Article

Influence of Bio-Fertilizer Type and Amount Jointly on Microbial Community Composition, Crop Production and Soil Health

1
Department of Soil and Water Sciences, College of Land Science and Technology, China Agricultural University, Beijing 100193, China
2
State Key Laboratory of Hydroscience and Engineering, Department of Hydraulic Engineering, Tsinghua University, Beijing 100084, China
*
Author to whom correspondence should be addressed.
Agronomy 2023, 13(7), 1775; https://doi.org/10.3390/agronomy13071775
Submission received: 7 June 2023 / Revised: 25 June 2023 / Accepted: 28 June 2023 / Published: 30 June 2023

Abstract

:
To ensure long-term food production in a changing world, it is critical to identify field management practices that increase crop yields and maintain soil health. Additionally, sustainable agriculture needs to provide experimental evidence to support the use of traditional agricultural practices. In this study, a 20-year investigation of the effects of different combinations of fertilizer types (control, chemical fertilizer, organic fertilizer, and bio-fertilizer) and fertilization amount (conventional dosages and high dosages) on wheat yield and soil health, including soil enzyme activity and microbial biomass, soil microbial diversity, and crop yield. Our long-term study indicates that the use of high dosages of bio-fertilizer can increase the fertilizer yield contribution rate by a minimum of 76.7% compared to other management combinations. Furthermore, this practice can improve soil biological quality, including the concentration of soil microbial biomass carbon, promote bacterial biodiversity, and enhance the soil health index. The effect of high dosages fertilizer was greater than that of conventional dosages fertilizer. The highest soil health index was 0.88 in high dosage bio-fertilizer, and the lowest was 0.12 in chemical fertilizer. In summary, these results suggested that the use of bio-fertilizer can help maintain soil health and crop productivity in the long term.

1. Introduction

The extensive use of chemical fertilizers in agricultural production has resulted in a reduction in overall soil health [1]. Excessive use of chemical fertilizers can alter the microbial composition of the soil and seriously compromise crop health and productivity [2]. Studies have demonstrated that the use of organic fertilizers, particularly bio-fertilizers, can lead to an increase in nutrient availability and microbial activity in soil [3,4]. Bio-fertilizer application is an effective technique for stimulating supply and releasing nutrients. Bio-fertilizers enhance soil fertility through various mechanisms, including nitrogen fixation, production of plant growth regulators, antibiotics, and biodegradation of organic matter [5]. These processes contribute to the availability of micro- and macro-nutrients in the soil environment. However, the impact of bio-fertilizers on crop yields is long-term rather than immediate. The high cost of bio-fertilizer compared to chemical fertilizers is a major reason why farmers are hesitant to incorporate them into their cropping systems [6]. Furthermore, few studies have focused on the influence of long-term bio-fertilizer in wheat cropping system [7,8]. Therefore, in this study, further characterization of long-term bio-fertilizer effects on multiple aspects of soil is required.
The application of effective microorganisms (EM) inoculums along with fertilizer is effective for the improvement of soil properties. EM, a microbial solution, was developed by Professor Dr Teruo Higa in the 1970s at Ryukyus University in Okinawa, Japan. The primary purpose is for use in natural or organic farming systems. However, the application has undergone expansion to address environmental concerns and promote the reuse of a majority of waste materials. [9]. Reportedly, following EM application, the beneficial soil microorganisms for plant growth increased. Due to the rapid organic matter mineralization, the crop yield and quality increased [10]. EM is generally applied with energy source for microorganisms. Previous studies have primarily concentrated on enhancing the quality of soils that are impaired by soil-borne diseases. However, there is a dearth of information on preserving microbial diversity and activity through sustainable farming practices [11]. The utilization of beneficial microbes as bio-fertilizers has become increasingly important in the agriculture sector due to their potential role in promoting food safety and sustainable crop production.
Soil microorganisms play a crucial role in maintaining the functionality and sustainability of agricultural ecosystems. Their contribution to nutrient cycling and soil structure maintenance is significant and cannot be overstated [12]. Microbial properties, such as microbial diversity and biomass, can be utilized as indicators to predict changes in soil function [13]. Previous studies have demonstrated the long-term effects of manure application on soil microbial communities and their responses [14]. Microbial biomass carbon and enzyme activities have the potential to be early and sensitive indicators for soil ecology and restoration, due to the information of the biochemical parameters [12]. Therefore, the effects of EM bio-fertilizers on microbial characteristics and microbial community composition were investigated to improve the sustainability of agricultural production.
The past decade has seen a significant rise in global interest in soil health, leading to the development of monitoring and assessment protocols by various government, non-government, and private sector groups [15]. Assessing soil health is a crucial initial step towards efficient soil management. Previous research has investigated the impact of soil biology on soil health, highlighting the importance of biological properties and processes in promoting sustainable agriculture and ecosystem services. To improve our understanding of the microbial community and the soil health processes they mediate, it is crucial to enhance microbial genomics and other molecular techniques.
This study aimed to assess the impact of long-term fertilization using EM bio-fertilizer, chemical fertilizer, and conventional fertilizer on soil biological activities and microbial community in an agricultural soil in northeast China. The focus was on investigating the effect of bio-fertilizer inputs on soil health and bacterial composition in moist soils commonly found in the North China plain. The hypothesis was that these inputs would have an effect on both variables. To test this, compost was produced using EM application and compared with compost produced without EM treatment. Six different fertilizer treatments are employed to evaluate the soil microbial biomass carbon, soil microbial biomass nitrogen, soil microbial biomass phosphorus, soil enzyme activities, bacteria community structure and their abundance in soils. Additionally, soil health index is calculated to identify an effective fertilization management practice.

2. Materials and Methods

2.1. Site Descriptions and Experimental Design

The field experiment was carried out at Quzhou Experimental Station (36°52′ N, 115°01′ E altitude: 39 m), China Agricultural University, which is in Handan City, Hebei Province, in North China Plain, China. The mean annual precipitation and temperature were 604 mm and 13.1 °C, respectively. The soil type is classified as clay loamy (in Soil taxonomy, 1999). The study replicated the common practice of growing winter wheat and summer maize in succession, which is prevalent in the North China Plain. The crop residue was uniformly crushed and mixed with the soil by rotary tillage to a depth of 20 cm. The long-term fertilization experiment was conducted using 18 plots, each with six fertilization treatments and three replicates. The plots were arranged in a randomized complete block design. The fertilization treatments used in the study comprised a control treatment (CK) with no amendments added, a chemical fertilizer (CF) treatment and a high dosage of organic fertilizer treatment (TC1) that both reflect local farmer practices, a high dosage of bio-fertilizer treatment (EM1), a conventional dosage of organic fertilizer treatment (TC2), a conventional dosage of bio-fertilizer treatment (EM2). The bio-fertilizer was composted with effective micro-organism (EM) agent solution over a 4-month period before application. The conventional fertilizer was composted over a 4-month period before application without effective micro-organism. Chemical fertilizer was a mixture of carbamide 600 kg hm−2 y−1, calcium superphosphate 1125 kg hm−2 y−1, and ammonium bicarbonate1125 kg hm−2 y−1. All the fertilizers were uniformly broadcast onto the soil surface by hand and immediately incorporated into the plowed soil (0–20 cm depth) by tillage.

2.2. Soil Sampling and Analysis of Chemical Properties and Microbial Biomass

To minimize the potential influence of recent fertilizer additions on the chemical and biological characteristics of the soil, soil samples were gathered before the implementation of organic manure. At least three cores (0–20 cm depth) were taken per plot and mixed into one soil sample. The soil samples were separated into three parts. The first portion was sifted through a 0.25 mm sieve. The second portion was sifted through a 2 mm sieve and stored at 4 °C, while the third portion was also sifted through a 2 mm sieve and stored at −80 °C. The soil organic carbon (SOC) in the air-dried portion was analyzed using the vitriol acid-potassium dichromate oxidation method. Soil total nitrogen (TN) was analyzed using the Kjeldahl method and soil total phosphorus (TP) was analyzed using the HClO4-H2SO4 method. The soil total potassium (TK) was measured by flame photometer. The potentiometric method was used to measure the pH of soil in a 1:2.5 (soil/water) mixture. The second part was used for measuring microbial biomass carbon and biomass nitrogen contents by using the chloroform-fumigation-extraction method [16]. The soil properties are listed in Table 1.
Soil dehydrogenase activity (DEH) was measured by reduction in 2, 3, 5-triphenyltetrazolium chloride (TTC). We mixed 5 g of soil samples with 15 mL of 2, 3, 5-TTC 0.5% (w/v) and 5 mL of Tris buffer (pH 7.6) and incubated at 37 °C in the dark for 24 h. Dehydrogenase converted TTC to 2, 3, 5-tribenzoylformamide (TPF). The resulting TPF was extracted with 100 mL of methanol and filtered, and the absorbance at 485 nm was measured with a spectrophotometer [16].
Urease activity (URE) was measured using this method. A total of 5 g medium was incubated with 10 mL citrate-phosphate buffer (pH 6.7) and 5 mL 10% urea solution for 3 h at 38 °C, and the released NH4+ activity was measured at 578 nm.
Alkaline phosphatase (ALP) activity was determined by incubating 5 g of medium with 5 mL of 0.075 mM disodium phenylphosphate and 10 mL of borate buffer (pH 9.6) at 37 °C for 3 h and adding 5 g of phenyl phosphate. The absorbance was measured at 578 nm, and the activity was expressed as phenol released g−1 soil h−1.
Invertase activity (SAC) was determined using the following method. We took 1 g of soil, added 5 mL pH 5.5 phosphate buffers and 15 mL 8% sucrose, and incubated them at 37 °C for 24 h. We quantitatively measure the amount of released glucose with a 508 nm spectrophotometer.
The microbial biomass carbon (SMBC) and microbial biomass nitrogen (SMBN) were measured by the chloroform-fumigation-extraction method [17].

2.3. Analysis of Soil Bacterial Community Structure and Diversity

Using the 16S rRNA method, the bacterial community structure and diversity of various soil samples fertilized for a long period of time were investigated. Soil DNA was extracted using the Power Soil DNA Isolation Kit (MOBIO Laboratories Inc., Carlsbad, CA, USA) according to the manufacturer’s instructions. Bacterial universal primers (16SrRNA gene V3-V4 region) GC-clip-338F and 806R use the extracted DNA as a template to amplify the 16SrRNA gene by PCR. Both forward and reverse primers were labeled with adapter, insert, and linker sequences. Each barcoded sequence (12-mer) was reverse-primed to pool multiple samples into a single MiSeq run. PCR conditions were 94 °C for 5 min, 94 °C for 30 s, 50 °C for 30 s, 72 °C for 30 s, and 72 °C for 10 cycles and 30 cycles. Quantitative DNA ligation is used to purify and pool PCR products in equimolar ratios to create DNA libraries for subsequent adapter sequencing [18].

2.4. Real Time Quantitative PCR (RT-qPCR) Analyses [18]

The ABI 7500 Real-Time PCR detection system (MoBio Laboratories, Carlsbad, CA, USA) was used to quantify the copy number of bacterial 16S rRNA gene. The reaction mixture (20 μL) contained Fast Fire qPCR Premix (SYBR Green) (Takara, Beijing, China), 10 μM of each primer, ROX reference dye, and 1 mL of 1/10 diluted DNA. Primers 338F and 806R were used for bacterial detection, and the heating program was as follows: 95 °C for 30 s, 95 °C for 5 s, 60 °C for 40 s, 72 °C for 15 s, for 40 cycles. Standards for measuring the amount of 16S rRNA were developed from clones containing the correct insert. Plasmid DNA preparations were obtained from clones using a miniprep kit (Qiagen, Germantown, MD, USA). The R2 of the standard curve was >0.99. Four RT-qPCR reactions were performed, and DNA was extracted from each soil sample.

2.5. Bioinformatic Analysis [18]

Sequence analysis was performed using QIIME (version 1.9.1) software. Briefly, sample-associated sequence reads were extracted from data acquired using the Illumina Miseq platform. Primers were removed, and sequences were truncated to remove low-quality sequences. The operational taxonomic unit (OTU) cluster difference was 0.03, and representative sequences for each phenotype were assembled using reference files from the Ribosome Database Project, with a bootstrap result of 80%. We calculated diffusion curves and diversity indices, which included measures for microbial community diversity, phylogenetic diversity (PD Faith), and coverage.

2.6. Soil Health Index

The soil health index based on the conceptual framework was derived from the sum of individual soil function scores and weighted for each soil function [5]. The first step was to identify important soil parameters when creating a minimum data set (MDS). Principal component analysis (PCA) was performed on all soil parameters to create a PCA model. The soil parameters in various units were then converted to unitless ratings using standard rating functions.
We calculated the soil health index (SHI) using the following formula:
S H I = W i × S i
where S is the value of the subscripted variable and W is the weight factor from principal component analysis or already defined in the conceptual framework.

2.7. Statistical Analysis

The study assessed the concentrations of SMBC, SMBN, SMBP, URE, ALP, DEH, and SAC in soil samples through ANOVA to determine any differences among the samples. Tukey’s procedure was then used to compare treatment means at a significance level of p < 0.05 using the SPSS 17.0 method (SPSS, Chicago, IL, USA).
Principal component analysis was performed on all soil parameters included in the conceptual framework to identify the most sensitive parameters. SPSS 10.0 was used for data reduction and principal component analysis (PCA) extraction. Principal Component Analysis (PCA) was conducted to identify principal factors that incorporate the maximum variation from the original data [19].

3. Results

3.1. Soil Health Indicators

3.1.1. Soil Enzymatic Activities and Microbial Biomass

Variations in soil enzymatic activities (ALP, SAC, DEH, and URE) are displayed in Table 2. Compared to the CK treatment, the soil enzymatic activities increased in the other five treatments. And the soil enzymatic activities in EM1 and TC1 treatment were higher than that in EM2 and TC2 treatment. The ALP, SAC, and DEH activities in the EM1, TC1, EM2, and TC2 treatment were significantly higher than that in the CF treatment. The increases were 15.8%, 24.7%, 6.4%, and 17.3%, respectively, for ALP. The increases were 41.9%, 47.1%, 23.0%, and 25.5%, respectively, for SAC. The increases were 87.3%, 40.5%, 42.5%, and 31.2%, respectively, for DEH. The URE activity in EM1, TC1, and EM2 treatment was higher than that in CF. Only the URE activity of TC2 was slightly higher than that in CF. The soil enzymatic activities (ALP, SAC, and URE) in TC1 and TC2 were slightly higher than that in EM1 and EM2, respectively. The DEH activity of EM1 and EM2 was significantly higher than that in TC1 and TC2, respectively. The concentrations of soil microbial carbon, soil microbial nitrogen, and soil microbial phosphorus in EM1 treatment were 518.46, 49.41, and 268.49 mg/kg, respectively. These results showed that both biological compost and conventional compost improved the soil enzyme activity, but the increasing extent was different.

3.1.2. Bacterial 16S rRNA Gene Copy Numbers

The size of the soil bacterial community was affected by the 20 years fertilization regimes as the estimation of the bacterial 16S rRNA genes by qPCR (Figure 1). The influences were significant on gene copy numbers per gram of soil. The numbers of bacterial 16S rRNA genes in 1 g of soil ranged from 2.08 × 10⁹ to 5.09 × 10⁹. Compared with the CK treatment, after 20 years of long-term fertilization, the gene copy numbers in EM1, EM2, TC1, and TC2 treatment were increased by 289.1%, 136.3%, 224.3%, and 109.4%, respectively. Among all the treatments, the gene copy number was the lowest in CF treatment while was the highest in EM1 treatment. The gene copy numbers in double fertilization treatment (EM1 or TC1) was higher than that in normal fertilization (EM2 and TC2) treatment. Compared with CK treatment, there were significant increases (p < 0.05) for all fertilized treatments except CF treatment.

3.1.3. Bacterial Community Composition

Figure 2 shows the relative abundance of different species in the 18 samples. The soil bacterial abundance varied significantly at phylum levels among fertilizer treatments. The phyla Actinobacteria, Chloroflexi, and Proteobacteria occupied 61.7–72.8% of the bacterial sequences obtained from the fertilized soils which were followed by Acidobacteria (6.8–15.9%), Bacteroidetes (5.1–9.8%), Gemmatimonadetes (1.8–3.0%), Firmicutes (1.5–4%), Planctomycetes (1.3–2.8%), and Verrucomicrobia (0.6–2.5%). The Proteobacteria occupied the highest proportions (32.4–40.0%) among the bacterial sequences in all soil samples.
The relative abundance of many phyla changed significantly under different fertilization treatments compared with the CK treatment (p < 0.05). The relative abundance of phyla Acidobacteria, Verrucomicrobia, Firmicutes, and Nitrospirae increased in all fertilization treatments, while phyla Proteobacteria and Chloroflexi decreased. Furthermore, compared to TC1 and TC2 treatment, the relative abundance of Proteobacteria, Bacteroidetes, and Verrucomicrobia increased significantly in EM1 and EM2 treatment while the relative abundance of Firmicutes and Gemmatimonadetes decreased. Moreover, high fertilization affected the relative abundance of phyla. For example, compared to EM2 and TC2 treatment, the relative abundances of Proteobacteria, Acidobacteria, and Bacteroidetes significantly increased in EM1 and TC1 treatment. In contrast, the relative abundance of Actinobacteria, Gemmatimonadetes, Verrucomicrobia, and Firmicutes decreased in EM1 and TC1 treatments compared to EM2 and TC2 treatments.

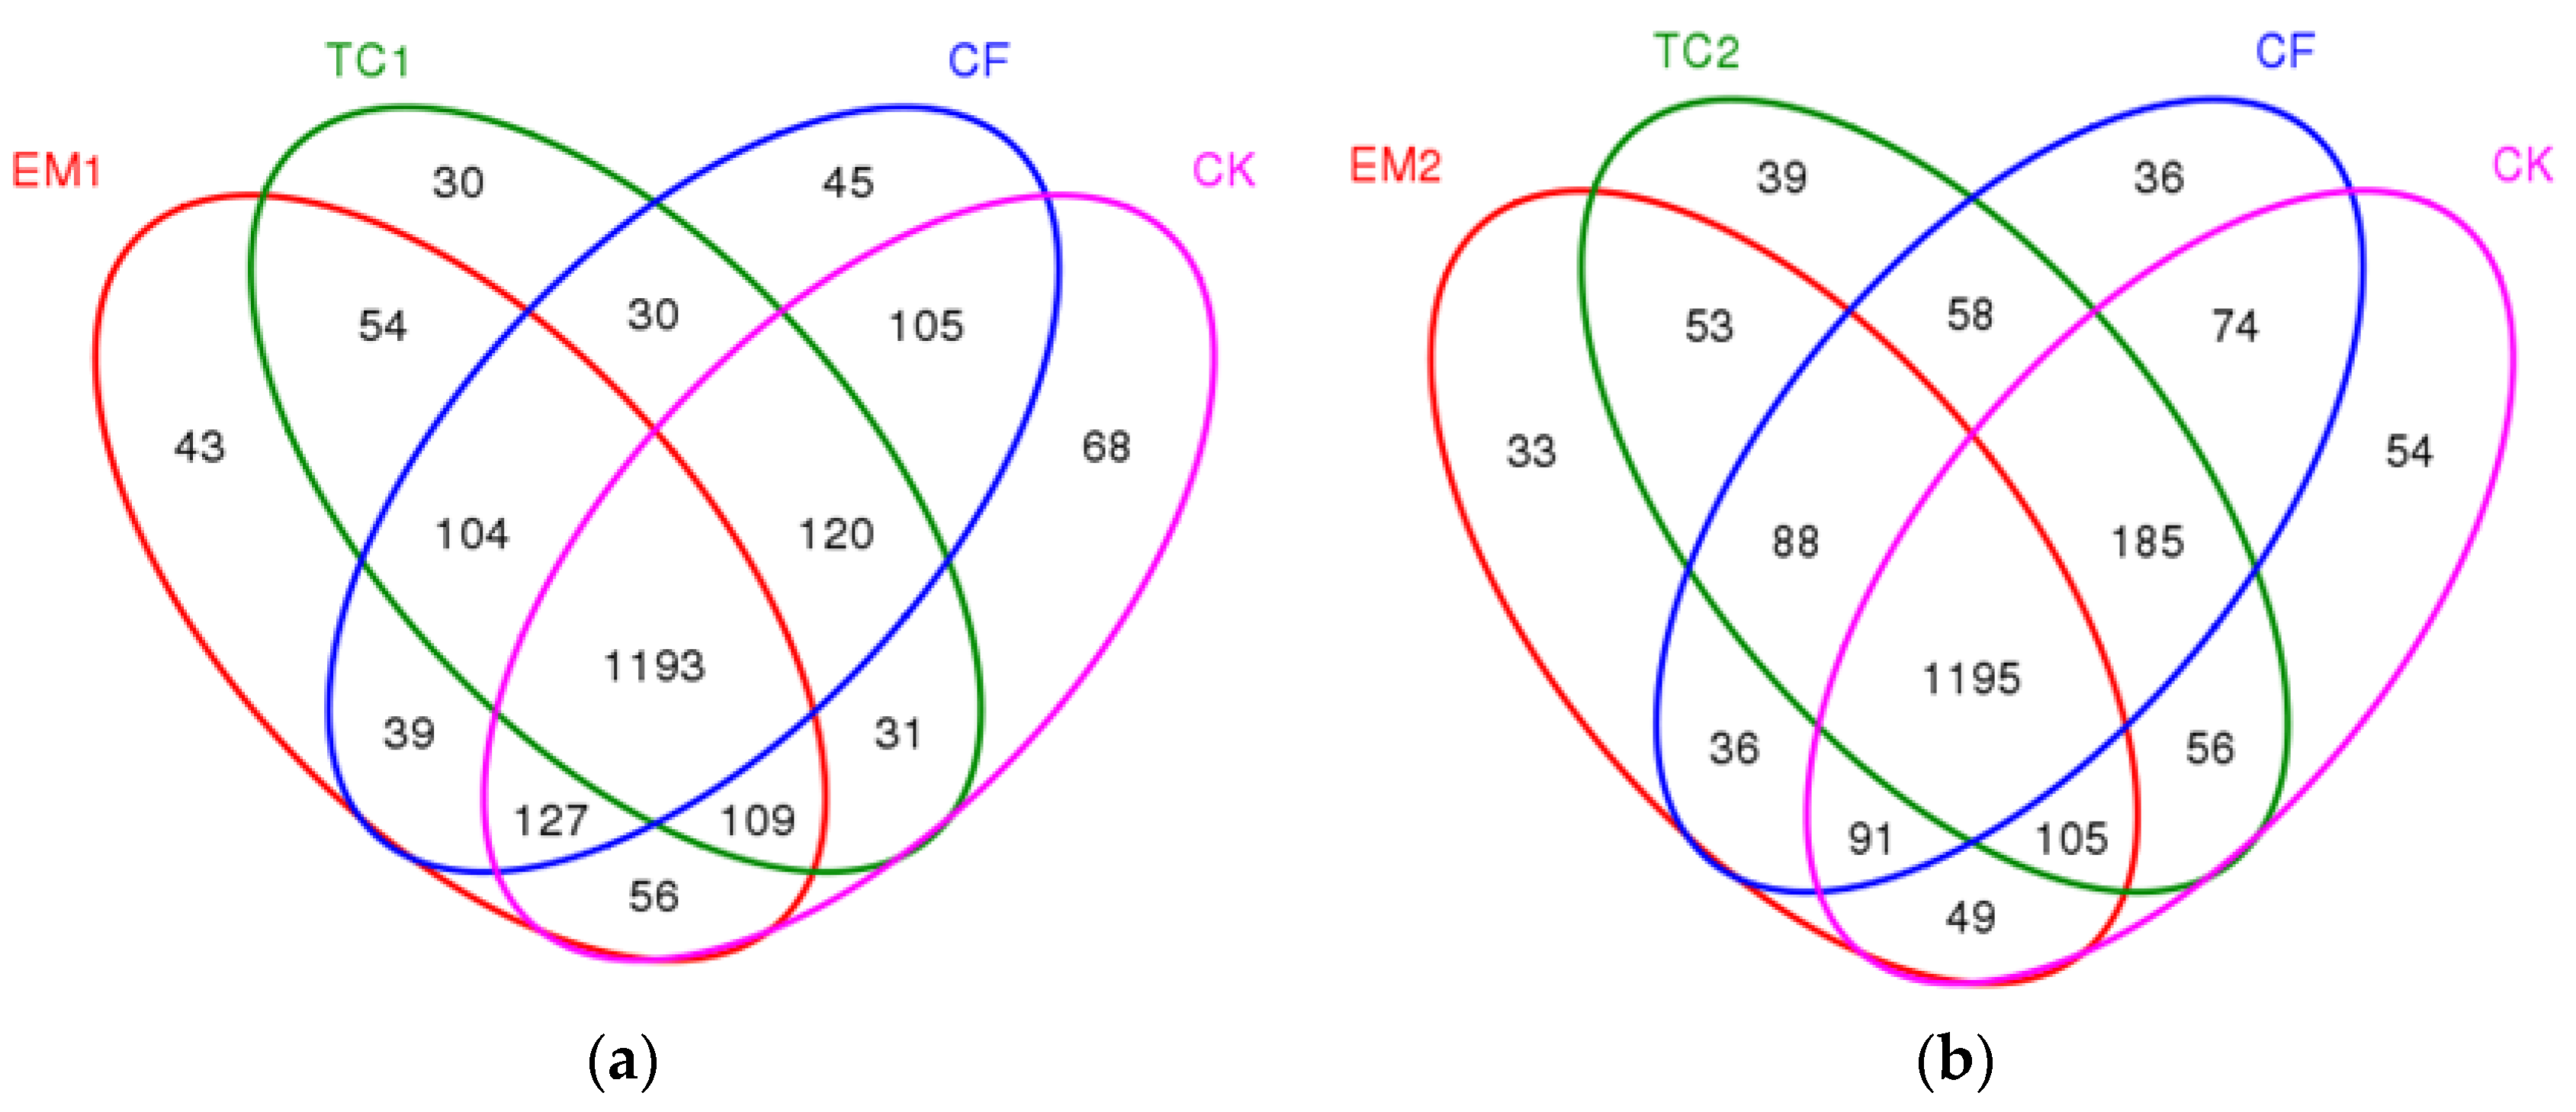
3.1.4. The Venn Diagram of the Different Long-Term Fertilizer Application

In order to compare the similarities and differences of the bacterial community composition of each sample under different treatments, a Venn diagram was constructed (Figure 3). The number of OTUs unique to CK, CF, EM1, and TC1 in the wheat season was 68, 45, 43, and 30, respectively, accounting for 8.6% of the total observed OTUs (Figure 3a). In addition, a total of 1193 OTUs accounted for 55.4% of the total number of OTUs observed across all treatments. Like the results of the last treatment, the number of OTUs unique to CK, CF, EM2, and TC2 in the wheat season was 54, 36, 39, and 33, respectively (Figure 3b). It was possible that the functional microorganisms present in the bio-compost may have entered the soil and interacted with the existing indigenous microorganisms, resulting in a change in the number of OTUs.

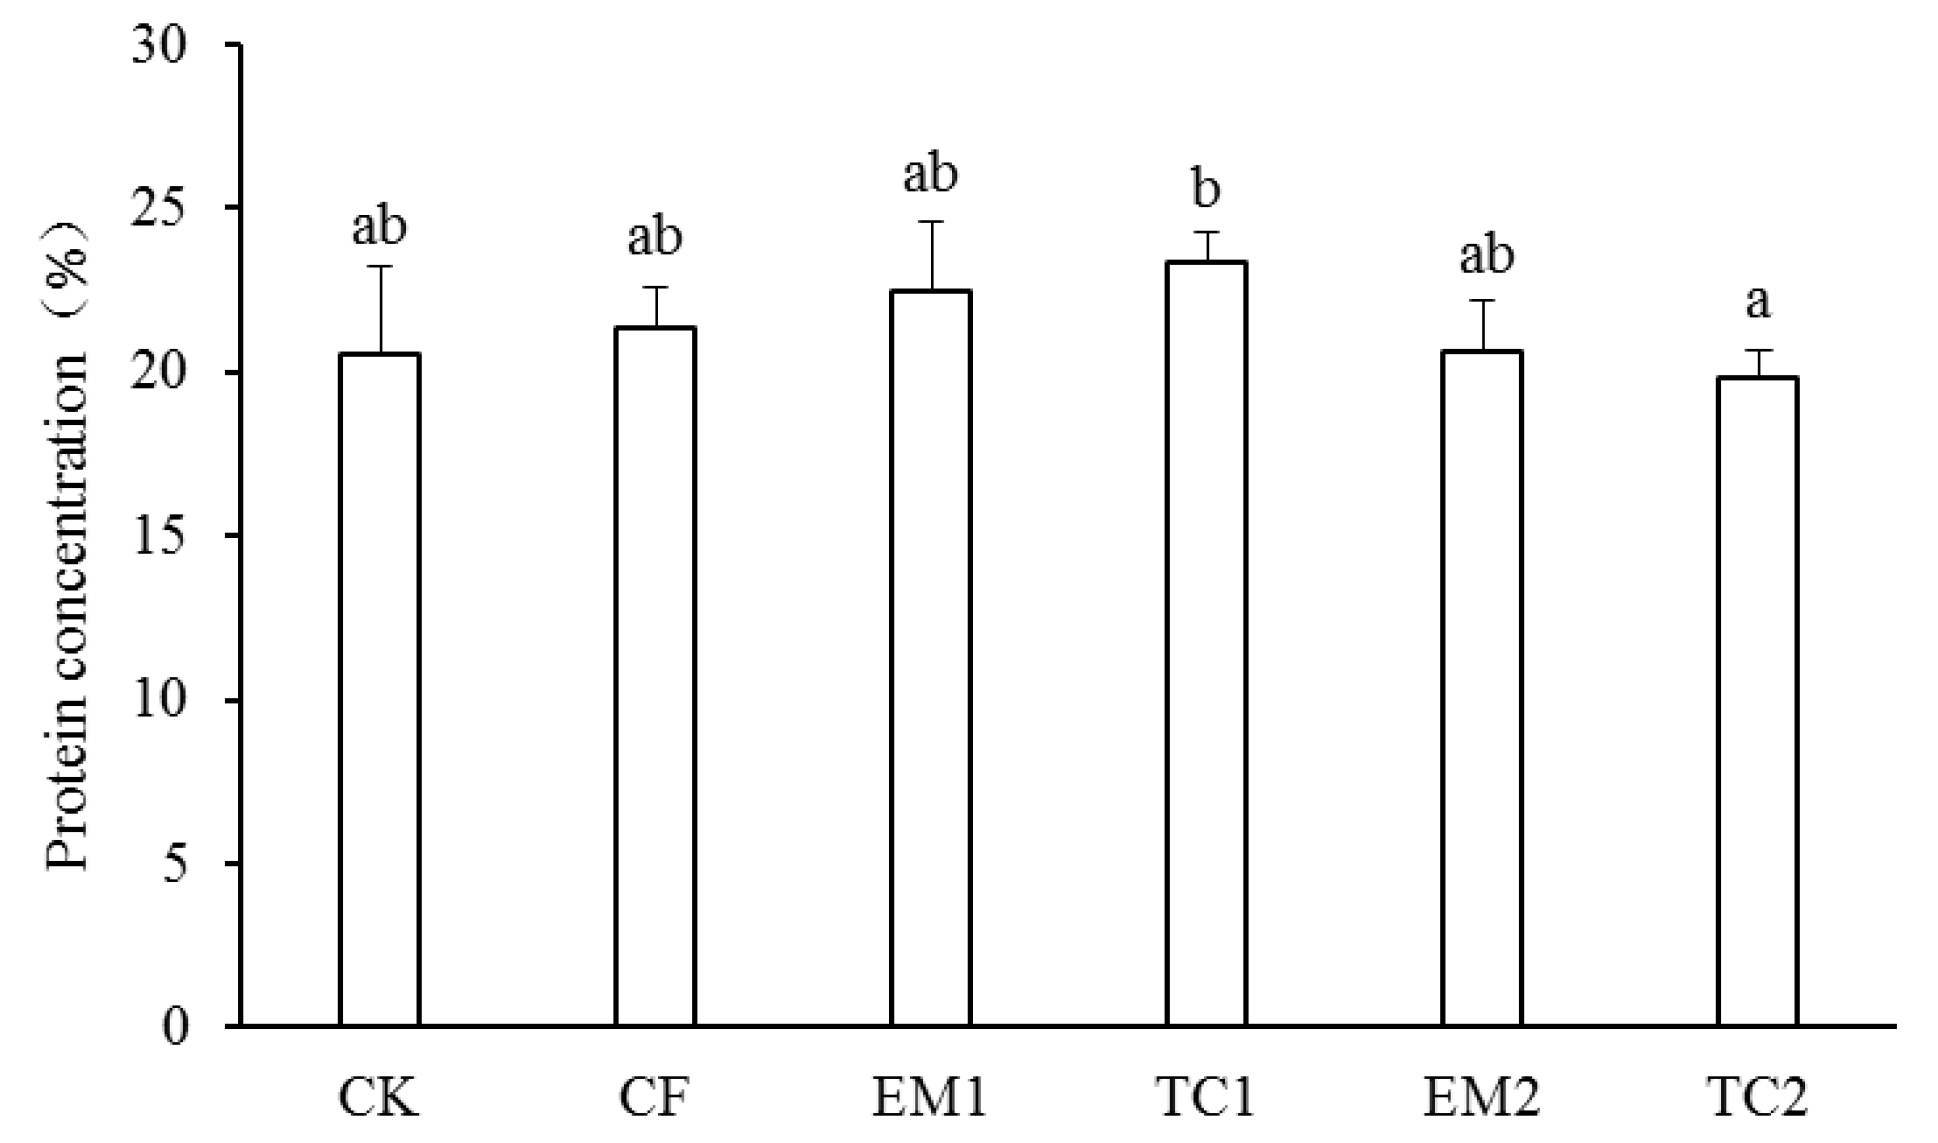
3.2. Grain Quality and Crop Yield

The protein of wheat grain was measured to indicate grain quality (Figure 4). The high fertilizer application increased the protein concentration compared to the conventional fertilizer application. The protein concentration of the TC1 treatment was 17.7% higher than that of the TC2 treatment. Compared to CF treatment, the protein concentration did not increase significantly under conventional fertilizer application.
The application of bio-fertilizer and conventional fertilizer significantly increased the crop yield compared the application of chemical fertilizer in our study. Specifically, the high bio-fertilizer increased the crop yield by 393.7%, while conventional fertilizer increased the crop yield by 348.2%. Compared to CF treatment, the crop yield increased significantly under both conventional fertilizer application and bio-fertilizer application. The fertilizer yield contribution rate was highest under EM1treatment, which reached 79.7%. Hence, the bio-fertilizer treatment had the highest crop yield.

3.3. Soil Health Index (SHI) of Different Fertilizer Treatments

The SHI values under different fertilization are shown in Table 3. The calculation process of SHI is detailed in Supplementary Material (Tables S1–S4). The highest SHI was 0.88 in EM1 treatment and lowest SHI was 0.12 in CF treatment. Continuous application of bio-fertilizer or manure fertilizer can significantly increase SHI value. The SHI values were the same in both EM2 and TC2 treatments. However, the SHI value was higher in EM1 treatment than that in TC1 treatment. Soil health condition changed little in the conventional bio-fertilizer and manure application. But double fertilization application can enhance the soil health condition. The lowest SHI value was in CF treatment, indicating that inorganic fertilizer failed to improve soil health.

4. Discussion

4.1. Changes in Soil Microbial Biomasses and Enzymatic Activities along the Long-Term Fertilization

The application of EM fertilization increased the nutrient concentration. For example, the concentration of TN, TP, and TK was higher in bio-fertilizer treatment than that in other fertilization treatments. The results were consistent with the previous study [20]. This is mainly because active microorganisms promote the decomposition and chemical decomposition of organic matter which stimulates the mineralization process of organic matter and provides more nutrients for soil and plant systems [21]. Moreover, the number of microorganisms in the soil was controlled by the long-term supply of organic matter, and the number of microorganisms increased significantly in soils with high concentrations of organic matter [22]. The EM1 and EM2 treatments showed the highest ability to enhance the concentration of soil SMBC, SMBN, and SMBP. The microorganisms in EM treatment can enhance the growth and activity of local microbiological populations due to the rapid response of these populations to the introduction of fresh amendments.
Soil enzyme activity is a recognized indicator of soil quality and is related to soil nutrient transformation [23]. The enzymes selected in this study (i.e., invertase, urease, alkaline phosphatase, and catalase) were related to the transformation of soil carbon, soil nitrogen and soil phosphorus. The enzyme activity was consistently greater in the compost amended soils than that in the other soils. In this study, the DEH activity was higher in the compost applied plots, which coincided with the previous study [24]. This may be due to higher organic matter concentration. The application of bio-fertilizer resulted in an increase in soil organic matter and provided a source of macronutrients and available organic carbon, which in turn contributed to higher enzyme activities.
Urease released N-NH4+ through urea hydrolysis, which played an important role in the hydrolysis chain of amino compounds [25]. It indicated that long-term application of mineral fertilizers or liquid fertilizers or both can lead to high urease activity [26]. The highest urease activity was in TC2 treatment. The study found no significant difference in URE concentration across different treatments.
Phosphatases played an important role in the phosphorus cycle, absorbing phosphorus for plants by releasing PO43 from immobilized organic phosphorus. The alkaline phosphatase activity in the soil containing organic fertilizer was significantly increased, which may be due to the increased microbial activity during long-term fertilization [27]. In this study, the highest mean values of urease activity were found in double fertilization (TC1 and EM1) treatments, followed by the TC2 treatment, EM2 and CF treatments, and the least was in the CK treatment. Similar results have been observed in other studies. It was considered that long-term fertilization would strongly affect soil enzyme activities [27].
Saccharase was also involved in soil carbon transformation and was linked to soil microbial biomass [25]. In this study, long-term fertilization increased saccharase activity except in the CF treatment. Similar results were also reported [28,29]. It was indicated that due to increased microbial activity and high substrate concentrations in soil, the invertase activity was enhanced [30].
The use of manure enhanced the soil organic carbon, which could stimulate the synthesis of the enzyme and microbial activity. In addition, after 20 years of organic matter application, enzymes could be highly immobilized in the soil.

4.2. Changes in Bacterial Community Composition along the Long-Term Bio-Fertilizer

In agroecosystems, soil microorganisms were directly affected by soil nutrients [31,32]. As the manure decomposed, nutrients and dissolved carbon were slowly released, allowing soil microbes to survive for a longer period of time [33]. It was reported that changes of soil carbon, soil nitrogen, and pH caused by fertilization had the most pronounced effects on the soil microbial community composition [34,35]. Continuous application of biofertilizers for 20 years provided a unique opportunity to assess the impact of long-term application of biofertilizers on soil microbial community composition compared with conventional organic fertilizers, chemical fertilizers, or unfertilized soils.
Pyrosequencing results showed that Proteobacteria, Chloroflexi, and Aquidobacteria were the most abundant species among all the soil samples in this study. Consistent with previous studies based on 16S rRNA gene cloning or pyrosequencing, this research also indicated that Proteobacteria, Chlorotribacteria, and Acidobacteria are the dominant taxa of soil bacteria [23].
Acidobacteria have been reported to be able to degrade plant residues such as cellulose and lignin, which play important roles in the carbon cycle [2]. In this study, the abundance of Acidobacteria increased after fertilization. The results showed that the relative abundance of Acidobacteria was significantly lower in high concentration fertilizer treatments compared to the unfertilized control treatments [36].
Some nitrogen cycling species, such as Planctomycetes and Proteobacteria, decreased relative levels after fertilization. This was consistent with the decline of some subpopulations of Planktomyces and Proteobacterial after fertilization [37]. Proteobacteria became more dominant in the EM fertilization treatment than CF fertilization treatment. It may be because the EM fertilizer had more effective microorganisms and facilitated the abundance of Proteobacteria.
Firmicutes were one of the most important commensal microbial communities. Certain Firmicutes played an important role in the manure degradation process [38]. Previous studies reported that Firmicutes were significantly more abundant in manure farming systems [33,39]. In this study, an increase in the relative frequency of Firmicutes was observed for all insemination treatments. These results were consistent with several previous studies [40]. The study found that the amount of Firmicutes in high concentration fertilizer treatments (EM1 and TC1) was surprisingly lower than that in conventional fertilizer treatments (EM2 and TC2). It was possible that the use of high doge bio-fertilizer led to an increase in the population of certain microorganisms while also suppressing the growth of Firmicutes.
Bacteroidetes were an important contributor in nutrient turnover in soil, which was positively correlated with soil total phosphorus and soluble phosphorus [11]. In this study, we showed that the relative abundance of Bacteroidetes was high in EM1 treatment. Because the concentration of certain soil nutrients increases after fertilization, Bacteroidetes proliferated in different fertilization treatments [41]. In summary, bio-fertilizer and conventional organic fertilizer could enhance soil bacterial richness in the soils of this study.

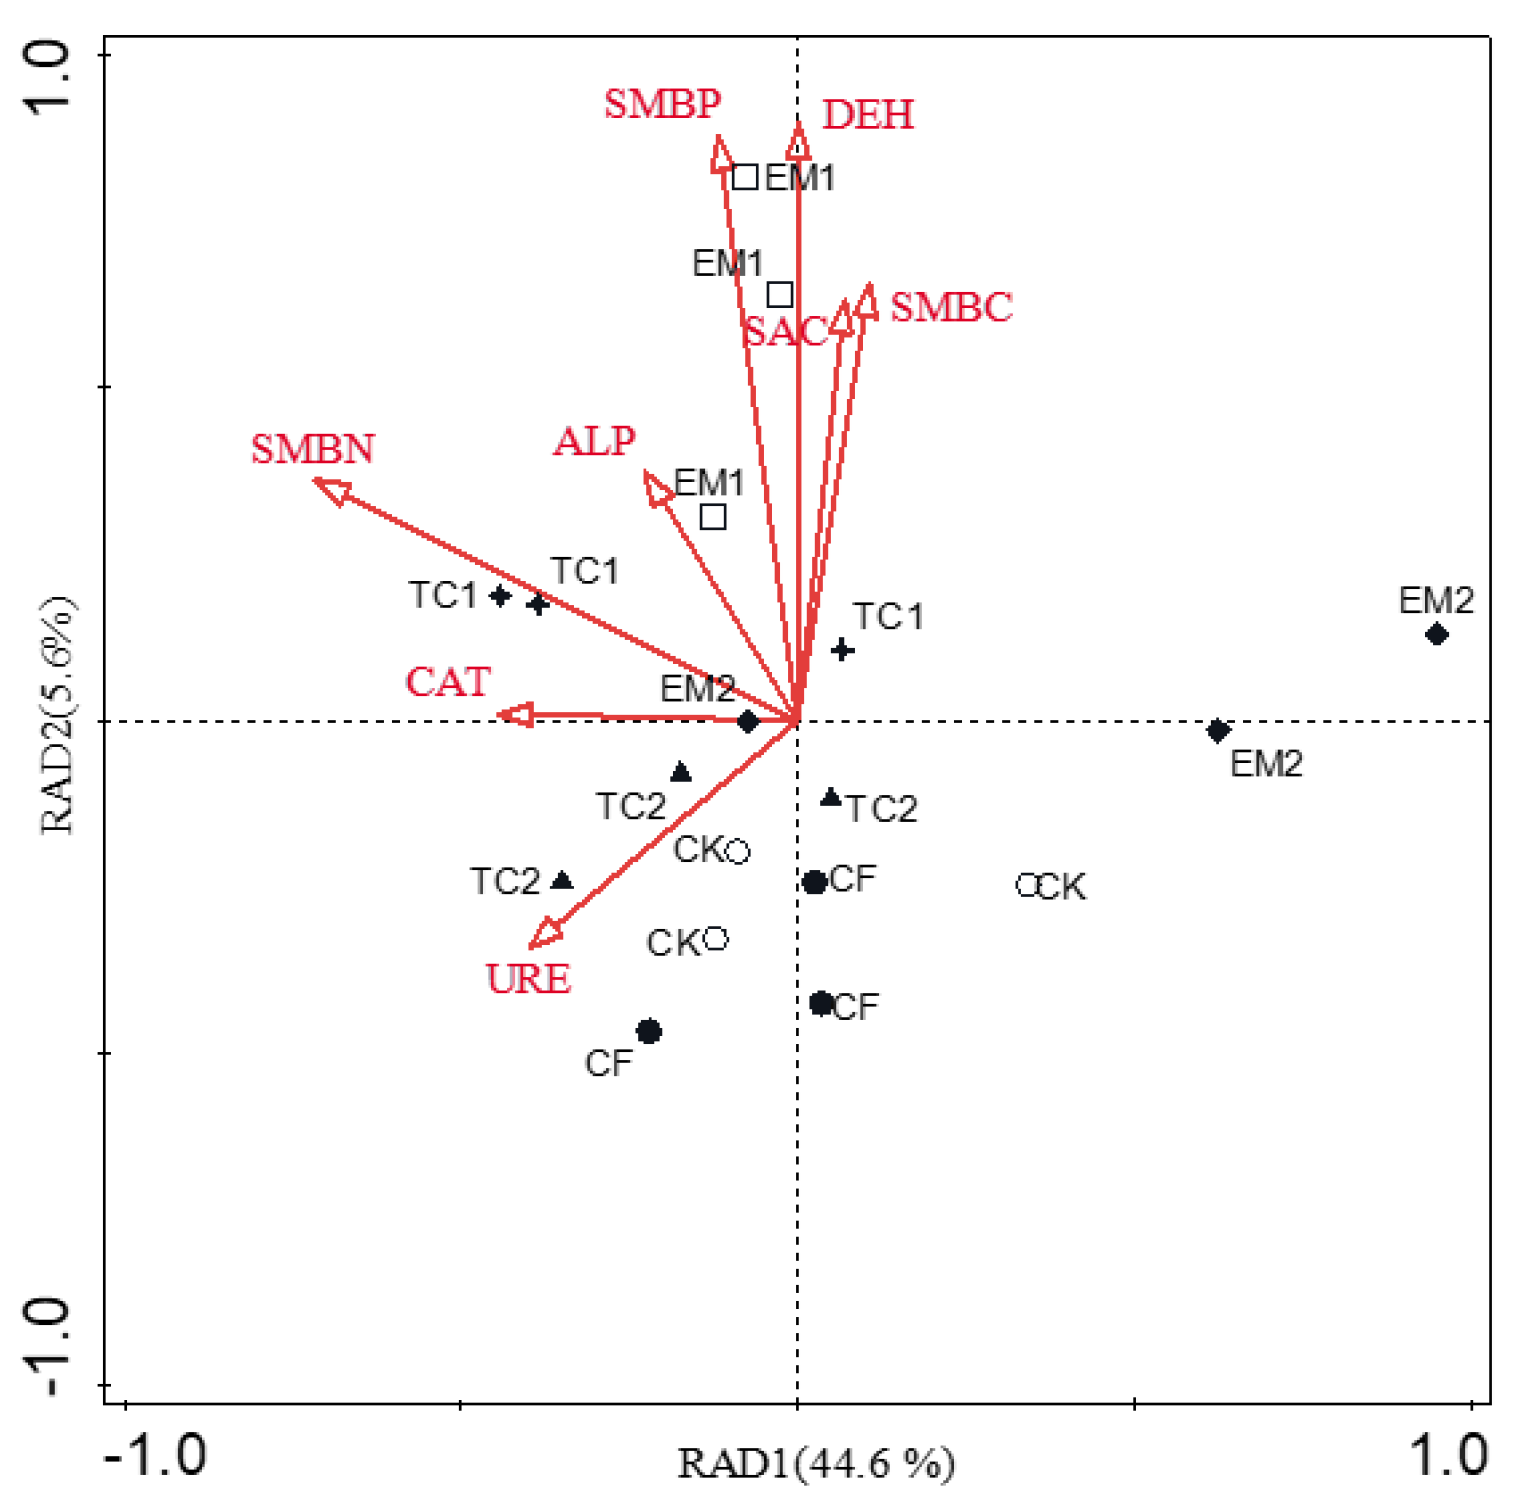
4.3. Relationship between Bacterial Communities and Environmental Variables

According to CANOCO direct selection, SMBN concentration (F = 4.2, p = 0.018) and soil URE concentration (F = 2.9, p = 0.04) were the two most significant bacterial communities with a variation rate of 20.8% and 13.0%, respectively (Figure 5). All environmental variables combined explained 57.7% of the microbiome variation between samples. Different fertilizer applications mainly affected the bacterial communities through altering the soil nutrient concentration [42]. The order of influence from highest to lowest was SMBN concentration, soil URE concentration, soil SAC concentration, soil DEH concentration, SMBC concentration, soil CAT concentration, soil ALP concentration, and SMBP concentration. Based on this model, the first two narrow RDA axes explained 50.1% of the total variance, the first axis explained 44.6%, and the second axis explained 5.6%. The bacterial communities in bio-fertilized treatments (i.e., EM1 and EM2) were grouped, respectively, and separately from the chemical fertilizer and the conventional organic fertilizer treatments (i.e., CF, TC1, and TC2) along the first axis.

4.4. Relationship of the Bio-Fertilizer Application with Soil Health

The bio-fertilizer application had the greatest impact on soil health. Soil health index varied with different fertilizer applications (Table 3). The powerful chemical soil health indicators, such as SOC and TN, were affected by different fertilization [42]. In agreement with our results, other authors have also reported increases in SOC and TN following bio-fertilizer application [43]. In this study, the highest concentration of SOC and TN in EM1 treatment resulted in the highest soil health index. Maybe the high content of main soil health indicators in the EM treatment results in a high soil health index.
More importantly, the biological soil health indicators (e.g., soil microbial biomass and soil community composition) were also affected by bio-fertilizer application. The effect of double bio-fertilization on increasing the number of soil microbial OTUs were significantly stronger than that of other fertilization (Figure 1). This may be due to the high availability of active organic substrates in the dual application of biofertilizer [43]. The variation trend of the soil health index was the same as the numbers of bacterial 16S rRNA genes. Although the bacterial community composition was broadly similar across all fertilization treatments, the relative abundance of some species varied. The relative abundances of Acidobacteria and Bacteroidetes were higher in double fertilizer application treatment (e.g., EM1 and TC1) than in other treatments (Figure 2). Maybe the relative abundances of Acidobacteria and Bacteroidetes were used as an indicator for soil health.

5. Conclusions

The present study was designed to determine the effect of long-term fertilization application on soil microbial biomasses, soil enzymatic activities, and soil microbial community composition. Afterwards, the soil health index was calculated using minimum data set method. The evidence from this study suggested that the effect on soil microbial biomasses and enzymatic activities with bio-fertilizer treatments was stronger than that with chemical fertilizer treatment. Compared to the conventional manure treatment and chemical fertilizer treatment, the concentration of SMBC, SMBN, and SMBP were high in bio-fertilizer treatment. The soil microbial community structure of bio-fertilizer and chemical fertilizer was quite different. Bio-fertilizer and conventional organic fertilizer had similar effects in maintaining a highly diverse bacterial community. The results suggested that long-term chemical fertilizer regimes reduced the biodiversity and abundance of bacteria. Moreover, the soil health index in EM1 treatment was the highest among all the other treatments. These results provided important information about the structure of microbial communities in this unique ecosystem. In short, proper addition of bio-fertilizers had a positive effect on soil health.

Supplementary Materials

The following supporting information can be downloaded at: https://www.mdpi.com/article/10.3390/agronomy13071775/s1. Table S1: The membership degree of the evaluation alternatives. Table S2: Load count of different soil indicators. Table S3: Different weights of evaluation indexes. Table S4: Soil health comprehensive evaluation index in different fertilizer treatments.

Author Contributions

Data curation, L.L.; Resources, L.T.; Validation, Y.L.; Writing—Original draft, L.L.; Writing—Review and editing, Y.L. All authors have read and agreed to the published version of the manuscript.

Funding

This research was funded by the National Key Research and Development Program of China, grant number 2021YFD1500802 and the National Key Research Program of China, grant number 2021EEDSCXSFQZD011.

Institutional Review Board Statement

Not applicable.

Data Availability Statement

The datasets of bacterial sequences generated for this study can be found in the Sequence Read Archive (SRA) data of National Center for Biotechnology Information under accession numbers SRP336958.

Conflicts of Interest

The authors declare no conflict of interest.

References

  1. Xue, C.; Ryan, P.C.; Zhu, C.; Chen, H.; Duan, Y.; Peng, C.; Guo, S.; Ling, N.; Shen, Q. Alterations in soil fungal community composition and network assemblage structure by different long-term fertilization regimes are correlated to the soil ionome. Biol. Fertil. Soils 2018, 54, 95–106. [Google Scholar] [CrossRef]
  2. Huang, X.Q.; Liu, L.L.; Wen, T.; Zhu, R.; Zhang, J.B.; Cai, Z.C. Illumina MiSeq investigations on the changes of microbial community in the Fusarium oxysporum f.sp. cubense infected soil during and after reductive soil disinfestation. Microbiol. Res. 2015, 181, 33–42. [Google Scholar] [CrossRef] [PubMed]
  3. Ho, A.; El-Hawwary, A.; Kim, S.Y.; Meima-Franke, M.; Bodelier, P. Manure-associated stimulation of soil-borne methanogenic activity in agricultural soils. Biol. Fertil. Soils 2015, 51, 511–516. [Google Scholar] [CrossRef]
  4. Neufeld, K.R.; Grayston, S.J.; Bittman, S.; Krzic, M.; Hunt, D.E.; Smukler, S.M. Long-term alternative dairy manure management approaches enhance microbial biomass and activity in perennial forage grass. Biol. Fertil. Soils 2017, 53, 613–626. [Google Scholar] [CrossRef]
  5. Liu, X.Y.; Shi, Y.; Kong, L.; Tong, L.H.; Cao, H.; Zhou, H.; Lv, Y.Z. Long-term application of bio-compost increased soil microbial community diversity and altered its composition and network. Microorganisms 2022, 10, 462. [Google Scholar] [CrossRef]
  6. Calleja-Cervantes, M.E.; Fernández-González, A.J.; Irigoyen, I.; Fernández-López, M.; Aparicio-Tejo, P.M.; Menéndez, S. Thirteen years of continued application of composted organic wastes in a vineyard modify soil quality characteristics. Soil. Biol. Biochem. 2015, 90, 241–254. [Google Scholar] [CrossRef]
  7. Francioli, D.; Schulz, E.; Lentendu, G.; Wubet, T.; Buscot, F.; Reitz, T. Mineral vs. organic amendments: Microbial community structure, activity and abundance of agriculturally relevant microbes are driven by long-term fertilization strategies. Front. Microbiol. 2016, 7, 1446. [Google Scholar] [CrossRef] [Green Version]
  8. Zhong, W.; Gu, T.; Wang, W.; Zhang, B.; Lin, X.; Huang, Q.; Shen, W. The effects of mineral fertilizer and organic manure on soil microbial community and diversity. Plant Soil 2010, 326, 511–522. [Google Scholar] [CrossRef]
  9. Sinha, R.K.; Valani, D.; Chauhan, K.; Agarwal, S. Embarking on a second green revolution for sustainable agriculture by vermiculture biotechnology using earthworms: Reviving the dreams of Sir Charles Darwin. J. Agric. Saf. Health 2014, 1, 50–64. [Google Scholar] [CrossRef]
  10. Shi, Y.; Qiu, L.; Guo, L.; Man, J.; Shang, B.; Pu, R.; Ou, X.; Dai, C.; Liu, P.; Yang, Y.; et al. K Fertilizers Reduce the Accumulation of Cd in Panax notoginseng (Burk.) F.H. by improving the quality of the microbial community. Front. Plant Sci. 2020, 11, 888. [Google Scholar] [CrossRef]
  11. Wang, B.; Li, R.; Ruan, Y.; Ou, Y.; Zhao, Y.; Shen, Q. Pineapple-banana rotation reduced the amount of Fusarium oxysporum more than maize–banana rotation mainly through modulating fungal communities. Soil Biol. Biochem. 2015, 86, 77–86. [Google Scholar] [CrossRef]
  12. Tian, W.; Wang, L.; Li, Y.; Zhuang, K.M.; Li, G.; Zhang, J.B.; Xiao, X.J.; Xi, Y.G. Responses of microbial activity, abundance, and community in wheat soil after three years of heavy fertilization with manure-based compost and inorganic nitrogen. Agric. Ecosyst. Environ. 2015, 213, 219–227. [Google Scholar] [CrossRef]
  13. Kracmarova, M.; Uhlik, O.; Strejcek, M.; Szakova, J.; Cerny, J.; Balik, J.; Tlustos, P.; Kohout, P.; Demnerova, K.; Stiborova, H. Soil microbial communities following 20 years of fertilization and crop rotation practices in the Czech Republic. Environ. Microbiome 2022, 17, 13. [Google Scholar] [CrossRef] [PubMed]
  14. Ghosh, S.; Lockwood, P.; Daniel, H.; King, K.; Hulugalle, N.; Kristiansen, P. Short-term effects of organic amendments on properties of a Vertisol. Waste Manag. Res. 2010, 28, 1087–1095. [Google Scholar] [CrossRef]
  15. Kersey, J.; Myrold, D. Response of soil health indicators to organic matter removal and compaction manipulations at six LTSP sites in the Western US. For. Ecol. Manag. 2021, 490, 119104. [Google Scholar] [CrossRef]
  16. Purakayastha, T.J.; Pathak, H.; Kumari, S.; Biswas, S.; Chakrabarty, B.; Padaria, R.N.; Kamble, K.; Pandey, M.; Sasmal, S.; Singh, A. Soil health card development for efficient soil management in Haryana, India. Soil Tillage Res. 2019, 191, 294–305. [Google Scholar] [CrossRef]
  17. Chae, Y.; Cui, R.; Woong Kim, S.; An, G.; Jeong, S.; An, Y. Exoenzyme activity in contaminated soils before and after soil washing: ß-glucosidase activity as a biological indicator of soil health. Ecotoxicol. Environ. Saf. 2017, 135, 368–374. [Google Scholar] [CrossRef]
  18. Vance, E.D.; Brookes, P.C.; Jenkinson, D.S. An extraction method for measuring soil microbial biomass C. Soil Biol. Biochem. 1987, 19, 703–707. [Google Scholar] [CrossRef]
  19. Xue, R.; Wang, C.; Liu, M.; Zhang, D.; Li, K.; Li, N. A new method for soil health assessment based on Analytic Hierarchy Process and meta-analysis. Sci. Total. Environ. 2019, 650, 2771–2777. [Google Scholar] [CrossRef]
  20. Jusoh, A.; Che, M.L.; Manaf, L.A.; Latiff, P.A. Composting of rice straw with effective microorganisms (EM) and its influence on compost quality. J. Environ. Health Sci. 2013, 10, 17. [Google Scholar] [CrossRef] [Green Version]
  21. Khaliq, A.; Abbasi, M.K.; Hussain, T. Effects of integrated use of organic and inorganic nutrient sources with effective microorganisms (EM) on seed cotton yield in Pakistan. Bioresour. Technol. 2006, 97, 967–972. [Google Scholar] [CrossRef] [PubMed]
  22. Chen, D.; Yuan, L.; Liu, Y.; Ji, J.; Hou, H. Long-term application of manures plus chemical fertilizers sustained high rice yield and improved soil chemical and bacterial properties. Eur. J. Agron. 2017, 90, 34–42. [Google Scholar] [CrossRef]
  23. Zhao, J.; Ni, T.; Li, J.; Lu, Q.; Fang, Z.; Huang, Q.; Zhang, R.; Li, R.; Shen, B.; Shen, Q. Effects of organic–inorganic compound fertilizer with reduced chemical fertilizer application on crop yields, soil biological activity and bacterial community structure in a rice–wheat cropping system. Appl. Soil Ecol. 2016, 99, 1–12. [Google Scholar] [CrossRef]
  24. Islam, M.R.; Singh, C.P.; Kim, Y.; Kim, M.; Sa, T. Community level functional diversity and enzyme activities in paddy soils under different long-term fertilizer management practices. Biol. Fertil. Soils 2011, 47, 599–604. [Google Scholar] [CrossRef]
  25. Hu, W.; Jiao, Z.; Wu, F.; Liu, Y.; Dong, M.; Ma, X. Long-term effects of fertilizer on soil enzymatic activity of wheat field soil in loess plateau, China. Ecotoxicology 2014, 23, 2069–2080. [Google Scholar] [CrossRef] [PubMed]
  26. Nayak, D.R.; Babu, Y.J.; Adhya, T.K. Long-term application of compost influences microbial biomass and enzyme activities in a tropical Aeric Endoaquept planted to rice under flooded condition. Soil Biol. Biochem. 2007, 39, 1897–1906. [Google Scholar] [CrossRef]
  27. Dong, W.Y.; Zhang, X.Y.; Liu, X.Y.; Fu, X.L.; Chen, F.S.; Wang, H.M.; Sun, X.M.; Wen, X.F. Responses of soil microbial communities and enzyme activities to nitrogen and phosphorus additions in Chinese fir plantations of subtropical China. Biogeosciences 2015, 12, 5537–5546. [Google Scholar] [CrossRef] [Green Version]
  28. Mandal, A.; Patra, A.K.; Singh, D.; Swarup, A.; Masto, R.E. Effect of long-term application of manure and fertilizer on biological and biochemical activities in soil during crop development stages. Bioresour. Technol. 2007, 98, 3585–3592. [Google Scholar] [CrossRef]
  29. Liang, Q.; Chen, H.; Gong, Y.; Yang, H.; Kuzyakov, Y. Effects of 15 years of manure and mineral fertilizers on enzyme activities in particle-size fractions in a north china plain soil. Eur. J. Soil. Biol. 2014, 60, 112–119. [Google Scholar] [CrossRef]
  30. Parthasarathi, K.; Ranganathan, L.S. Aging effect on enzyme activities in pressmud vermicasts of Lampito mauritii (kinberg) and Eudrilus eugeniae (kinberg). Biol. Fertil. Soils 2000, 30, 347–350. [Google Scholar] [CrossRef]
  31. Geisseler, D.; Scow, K.M. Long-term effects of mineral fertilizers on soil microorganisms—A review. Soil Biol. Biochem. 2014, 75, 54–63. [Google Scholar] [CrossRef]
  32. Leff, J.W.; Jones, S.E.; Prober, S.M.; Barberán, A.; Borer, E.T.; Firn, J.L.; Harpole, W.S.; Hobbie, S.E.; Hofmockel, K.S.; Knops, J.M.H. Consistent responses of soil microbial communities to elevated nutrient inputs in grasslands across the globe. Proc. Natl. Acad. Sci. USA 2015, 112, 10967–10972. [Google Scholar] [CrossRef] [PubMed] [Green Version]
  33. Bonanomi, G.; De Filippis, F.D.; Cesarano, G.; Storia, A.L.; Ercolini, D.; Scala, F. Organic farming induces changes in soil microbiota that affect agro-ecosystem functions. Soil Biol. Biochem. 2016, 103, 327–336. [Google Scholar] [CrossRef]
  34. Li, F.; Chen, L.; Zhang, J.; Yin, J.; Huang, S. Bacterial community structure after long-term organic and inorganic fertilization reveals important associations between soil nutrients and specific taxa involved in nutrient transformations. Front. Microbiol. 2017, 8, 187. [Google Scholar] [CrossRef] [Green Version]
  35. Sun, R.; Zhang, X.; Guo, X.; Wang, D.; Chu, H. Bacterial diversity in soils subjected to long-term chemical fertilization can be more stably maintained with the addition of livestock manure than wheat straw. Soil Biol. Biochem. 2015, 88, 9–18. [Google Scholar] [CrossRef]
  36. Zhou, J.; Guan, D.; Zhou, B.; Zhao, B.; Ma, M.C.; Qin, J.; Jiang, X.; Chen, S.F. Influence of 34-years of fertilization on bacterial communities in an intensively cultivated black soil in northeast China. Soil Biol. Biochem. 2015, 90, 42–51. [Google Scholar] [CrossRef]
  37. Cai, F.; Pang, G.; Li, R.; Li, R.; Gu, X.; Shen, Q.; Chen, W. Bioorganic fertilizer maintains a more stable soil microbiome than chemical fertilizer for monocropping. Biol. Fertil. Soils 2017, 53, 861–872. [Google Scholar] [CrossRef]
  38. Ryckeboer, J.R.; Mergaert, J.; Vaes, K.; Klammer, S.; Clercq, D.D.; Coosemans, J.; Insam, H.; Swings, J. A survey of bacteria and fungi occurring during composting and self-heating processes. Ann. Microbiol. 2003, 53, 349–410. [Google Scholar] [CrossRef]
  39. Hartmann, M.; Frey, B.; Mayer, J.; Mader, P.; Widmer, F. Distinct soil microbial diversity under long-term organic and conventional farming. ISME J. 2015, 9, 1177–1194. [Google Scholar] [CrossRef] [Green Version]
  40. Zhang, W.; Qiao, W.; Gao, D.; Dai, Y.; Deng, J.; Yang, G.; Han, X.; Ren, G. Relationship between soil nutrient properties and biological activities along a restoration chronosequence of pinus tabulaeformis plantation forests in the Ziwuling mountains, China. Catena 2018, 161, 85–95. [Google Scholar] [CrossRef]
  41. Wang, R.; Liu, T.; Lu, C.; Zhang, Z.; Guo, P.; Jia, B.; Hao, B.; Wang, Y.; Guo, W. Bioorganic fertilizers improve the adaptability and remediation efficiency of Puccinellia distans in multiple heavy metals-contaminated saline soil by regulating the soil microbial community. J. Hazard. Mater. 2023, 448, 130982. [Google Scholar] [CrossRef] [PubMed]
  42. Segura, C.; Horrocks, C.; Lopez-Aizpun, M.; Blackwell, M.S.A.; Darch, T.; Hood, J.; Le Cocq, K.; McAuliffe, G.A.; Lee, M.R.F.; Cardenas, L. Response of soil health indicators to dung, urine, and mineral fertilizer application in temperate pastures. J. Environ. Manag. 2023, 330, 117096. [Google Scholar] [CrossRef] [PubMed]
  43. Jiang, Y.; Zhang, J.; Manuel, D.; Op De Beeck, M.; Shahbaz, M.; Chen, Y.; Deng, X.; Xu, Z.; Li, J.; Liu, Z. Rotation cropping and organic fertilizer jointly promote soil health and crop production. J. Environ. Manag. 2022, 315, 115190. [Google Scholar] [CrossRef] [PubMed]
Figure 1. The abundance of bacteria under different treatments was expressed by the 16S rDNA copy number detected by quantitative PCR. The same letter in the same column indicates that the difference is not significant (p < 0.05, Tukey’s test).
Agronomy 13 01775 g001
Figure 2. Relative average abundances of the abundant phyla across soils from different fertilizer regimes (values represent % of total redundant sequences).
Agronomy 13 01775 g002
Figure 3. The Venn diagram of the number of shared and unique OTUs in different fertilization treatments (a) The fertilization treatments were EM1, TC1, CF, and CK.; (b) The fertilization treatments were EM2, TC2, CF, and CK.
Agronomy 13 01775 g003
Figure 4. The protein concentration at different fertilization regimes. The same letter indicates that the difference is not significant (p < 0.05, Tukey’s test).
Agronomy 13 01775 g004
Figure 5. Ordination plots of the results from the redundancy analysis (RDA) used to identify the relationships among the microbial bacterial taxa and the soil microbial biomass and soil enzyme activities. The red arrows indicated the lengths and angles between explanatory and response variables and reflect their correlations. Samples from different long-term fertilization treatments were marked with different symbols. EM1 was represented by “□”. EM2 was represented by “◆”. TC1 was represented by “✦”. TC2 was represented by “▲”. CF was represented by “●”. CK was represented by “○”.
Agronomy 13 01775 g005
Table 1. Soil properties with different fertilization treatments.
pHSOC (g/kg)TN (g/kg)TP (g/kg)TK (g/kg)
CK7.59 6.91 ± 0.3 a0.48 ± 0.02 ab1.03 ± 0.12 b228.87 ± 1.5 b
EM17.58 13.51 ± 0.6 c0.74 ± 0.1 a1.74 ± 0.08 a247.03 ± 1.8 a
TC17.58 10.33 ± 0.5 b0.72 ± 0.03 c1.65 ± 0.03 c253.2 ± 0.7 ab
EM27.54 9.73 ± 0.9 ab0.56 ± 0.01 c1.28 ± 0.07 c245.3 ± 4.2 c
TC27.50 8.34 ± 1.0 ab0.61 ± 0.01 ab1.25 ± 0.04 ab244.8 ± 7.2 bc
CF7.52 7.97 ± 1.6 ab0.54 ± 0.02 b1.32 ± 0.12 ab240.57 ± 1.0 bc
Different letters in the same column indicated significant differences among treatments using Tukey’s test (p < 0.05).
Table 2. Soil enzymatic activities and microbial biomass with different fertilization.
Enzymatic Activity *EM1TC1EM2TC2CFCK
ALP5.95 ± 0.2 ab6.41 ± 0.2 b5.47 ± 0.3 ab6.03 ± 0.1 ab5.14 ± 0.7 a5.04 ± 0.3 a
SAC50.99 ± 6.3 b52.85 ± 6.5 b44.20 ± 6.8 b45.09 ± 1.6 b35.93 ± 5.4 ab23.35 ± 3.6 a
DEH19.68 ± 0.5 a14.77 ± 0.6 ab14.98 ± 1.5 ab13.79 ± 6.2 ab10.51 ± 1.6 b14.29 ± 6.3 ab
URE2.05 ± 0.1 a2.10 ± 0.1 a2.0 ± 0.1 a2.43 ± 0.2 a2.42 ± 0.1 a1.99 ± 0.1 a
SMBC518.46 ± 19.4 a518.03 ± 4.8 a507.29 ± 25.0 a497.29 ± 24.7 a489.10 ± 8.8 a486.11 ± 24.3 a
SMBN49.41 ± 10.8 ab35.01 ± 8.7 a25.01 ± 1.9 bc28.55 ± 12.8 bc27.93 ± 3.2 bc18.10 ± 8.3 c
SMBP268.49 ± 39.5 a163.57 ± 8.0 a84.02 ± 8.6 b24.70 ± 13.2 c14.82 ± 3.2 c9.80 ± 0.5 c
* Alkali phosphatase activity was represented by ALP (Phenol mg/g). Invertase activity was represented by SAC (Glucose mg/g). Soil dehydrogenase activity was represented by DEH (TPF ug/g). Urease activity was represented by URE (NH4+-N, mg/g). Soil microbial carbon was represented by SMBC (mg/kg). Soil microbial nitrogen was represented by SMBN (mg/kg). Soil microbial phosphorus was represented by SMBP (mg/kg). Different letters in the same column indicated significant differences among treatments via Tukey’s test (p < 0.05).
Table 3. Crop yields of winter wheat and fertilizer yield contribution rate under different fertilizer treatments.
TreatmentAcre Yield (kg)Growth Rate (%)Fertilizer Yield Contribution Rate (%)
CK92.23 ± 10.4 e//
EM1455.3 ± 3.1 a393.779.7
TC1413.37 ± 1.0 b348.277.7
EM2395.03 ± 5.3 b328.376.7
TC2334.47 ± 9.8 c262.672.4
CF306.23 ± 5.3 d232.069.9
The same letter in the same column indicates that the difference is not significant (p < 0.05, Tukey’s test).
Disclaimer/Publisher’s Note: The statements, opinions and data contained in all publications are solely those of the individual author(s) and contributor(s) and not of MDPI and/or the editor(s). MDPI and/or the editor(s) disclaim responsibility for any injury to people or property resulting from any ideas, methods, instructions or products referred to in the content.

