Abstract
Fruit flies cause production losses in mango orchards affecting fruit quality. A National Campaign against Fruit Flies (NCFF) evaluates farm status using the fruit flies per trap per day index (FTD). Traps with attractant are installed manually within orchards in Mexico, but counting the flies trapped every week requires excessive numbers of trained personal. Electronic traps (e-traps) use sensors to monitor fruit fly population, saving labor and obtaining the real-time orchard infestation. The objective of this work was to acquire an image within a e-trap at 17:00 when an insect was detected and binarize the information in real-time to count the number of flies. Each e-trap was implemented with a polyethylene PET bottle screwed to a tap containing an ESP32-CAM camera. E-traps from several hectares of mango trees were sampled and transmitted through WSN wireless sensor networks. This original system presents a star topology network within each hectare with the long range LoRa transceiver at the central tower. It receives the fly count from five e-traps and finally transmits data to the house tower end point. Another contribution of this research was the use of a DJI mini2 for acquiring the e-trap data, and the 8-ha flight took 15 min and 35 s. This period can be reduced if the drone flies higher.
1. Introduction
Fruit flies (Diptera: Tephritidae) cause production losses up to billions of dollars per year around the world, with USD 242 million losses per year reported only in Brazil [1]. In Mali, 50% of the national mango production was lost due to fruit flies [2]; economic losses result from quarantine restrictions imposed by importing countries. Fruit fly females use fruit sugar content during their oviposition process, and their larvae feed from mango pulp [3,4]. Other fruits attacked by fruit flies with marketable losses include raspberries [5], almonds, and olives [6].
Fruit infestation is not always highly correlated with fly population [7]; instead, it varies under climatic changes [8,9]. Temperature, relative humidity, and light intensity influences female flies’ infestation [10]. The adult Mexican fruit fly is larger than a housefly; it has green eyes and transparent wings. These fruit flies are captured by detection traps that are set within the insect area named the infested zone. Several dry traps are sold in the market, including Tephri-Trap [11,12,13,14], McPhail-Trap [11,13,15] and Multi-Lure Trap [16]. Commercial food baits are available for fruit fly monitoring, but their performance depends on climate and fruit fly species [12,15,16,17]. The food bait used to attract and catch the flies depends on the trap’s volume and form. Efficient mass trapping controls the Mediterranean fruit fly (Ceratitis capitate) without presenting environmental impacts [18].
Fully automatic fly-monitoring systems can identify species [19], but semi-automatic systems require human experts to identify and count the trapped insects. The human expert analyzes the images captured by the camera equipped on the trap [20]. In order to provide better detection, electronic circuits monitor the flies entering the trap [21]. Miniaturized image sensors have reduced costs in fruit fly monitoring systems [22,23]. Counting algorithms [24] employ threshold algorithms [25], and texture and shape analysis [26] identified whiteflies in plant leaves with 85% accuracy. Recently, artificial intelligence has been effectively introduced in precise farming [27,28]. Deep convolutional networks (R-CNN) are being used for object detection in traps and are considered an accurate predictor of their locations [29,30].
UAVs can collect, process, and store data in real time [31,32]. UAVs used as aerial base stations enhance WSN capacity, coverage, and energy efficiency [33]. Multi-UAVs used for pest detection in large farms have tested several intelligent algorithms [34]. New data gathering algorithms [35,36] have been proposed to save data from soil ports in UAVs. Many researchers have investigated the compatibility of UAV and LoRa networks for enabling IoT applications [37,38]. UAV data collection algorithms [33] have considered multi-data-rate transmissions (DR) and contact duration time (CDT). Autonomous navigation and scheduling minimizes data collection time [39], combining two Reinforcement Learning (RL)-based frameworks. Several data collection problems in WSNs utilizing UAVs have been analyzed and discussed [40]. A UAV trajectory gives coverage to a set of ground nodes, avoiding the use of several UAVs that need to be connected to each other [41].
The objective of this research was to develop inexpensive handmade polyethylene (PET) traps in Mexico to capture flies within mango orchards [42] and transmit the collected information wirelessly to the producer and government agencies. With the use of these systems, the quantity of technical experts employed for analyzing fly traps decreases, obtaining a better governmental fly control. The electronic trap developed for this study, unlike similar products, counts the flies and generates an alarm when the first fly per hectare has been detected. Each electronic trap with LoRa transmission represents a node and uses a novel star topology within each hectare to gather infestation information. As mango orchards rarely possess WIFI connectivity, LoRa wireless systems turn out to be very important. The information is finally transmitted to a final end-device at the house through LoRa transmission or by means of a mini-drone that can cover greater distances.
The article is structured as follows: Section 2.1 reviews the construction of the electronic trap with each of the circuits employed. Section 2.2 analyzes the image analysis technique used for fly detection. Section 2.3 focuses on the wireless communication network architecture, including a DJI mini2 covered in Section 2.4. Section 3 shows all the results obtained from electronic trap monitoring, transmission evaluation and FTD analysis from three seasons. Section 4 describes some discussion concerning its performance. Finally, Section 5 includes some conclusions.
2. Methodology
Fly infestation was monitored during 2019–2021 in a commercial mango orchard located in Loma Bonita (17°25′47″ N, −101°11′19″ W, 17 m ASL), in the state of Guerrero, Mexico. The 8-hectare orchard presents 35-year-old trees, and the trees are planted with the traditional 10 × 10 m spacing. Therefore, 100 trees were grown per hectare, as shown in Figure 1. The experiment tests the fruit fly detection system comprehensively. The system considered a vision system for the detection of the fruit-fly, its wireless transmission system, and the introduction of routes with drones to acquire information from several hectares.
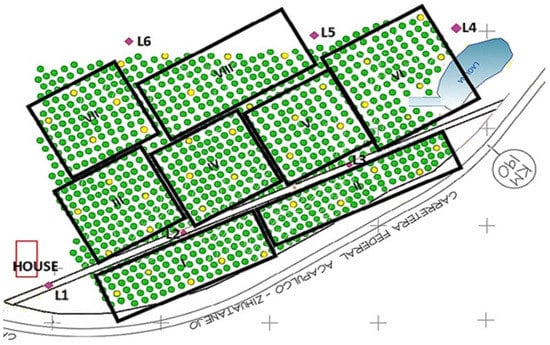
Figure 1.
E-traps and transmission sites in the 8-hectare mango orchard. Green circles represent mango trees, and yellow circles show trees with e-traps. Violet diamonds represent transmission towers.
2.1. IoT Fly Monitoring System
At the mango orchard, five traps were hung per hectare randomly. The minimum distance between traps was of 40 m, and the yellow circles in the orchard map show where the traps were hung (Figure 1). Traps sheltered from sunlight [14] were suspended from branches with wires coated with grease at heights ranging from 3 to 5 m above ground. The grease prevents predatory activity of ants against dead adult flies within the trap. A food attractant known as CeraTrap was used as bait in the traps as it attracts both males and females [14,42]. CeraTrap (Bioibérica, Barcelona, Spain) is an enzymatic hydrolyzed protein that maintains a high level of attraction which lasts for at least one month. Flies were collected weekly from the traps, preserved in 70% ethanol, and returned to the laboratory to estimate a daily capture rate. Every 15 days, the bait was replaced in the traps.
Partial automatic monitoring systems have been developed where human experts observe acquired images to count trapped flies [20,43]. In this design, the ESP32-CAM containing an OV2640 camera, identifies and counts the flies trapped per day. The cheap ESP32-CAM module (Figure 2a) is a low power consumption system ideal for remote monitoring IoT applications. The ESP32-CAM module contains a microcontroller with Bluetooth, Wi-Fi, and an SD card [44,45]. Its DIP format allows it to be easily and quickly integrated into any application, and the data obtained can be sent to any embedded device.
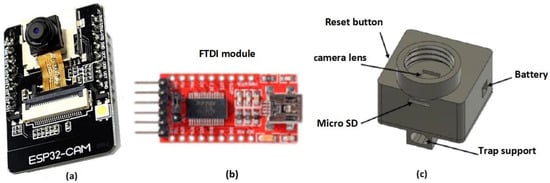
Figure 2.
E-trap main components including the (a) ESP32-CAM, (b) FTDI module, and (c) screw tap support.
The FTDI module (Figure 2b) uses a FTDI FT232R chip to provide an effective communication method between modern USB supported devices and RS232 serial devices. The top-trap casing design was completed using Solidworks version 2022 software. It isolates the ESP32-CAM module, leaves an access to extract the SD card easily, and presents a reset button. The design was 3D-printed using a hard plastic and was then screwed to a 500 mL PET bottle, Figure 2c.
The program is uploaded to the ESP32-CAM module through the FTDI module, Figure 3a and the Arduino IDE 2.0 software employs “AI Thinker ESP32-CAM”. The TX and RX pins are connected and once the program is loaded, the blue-line bridge is removed and the flash is pressed. Finally, the red module is detached, keeping only the supply voltage from the external battery. Physical connections are shown in Figure 3a, and a phenolic plate (Figure 3b) keeps the ESP32-CAM protected.
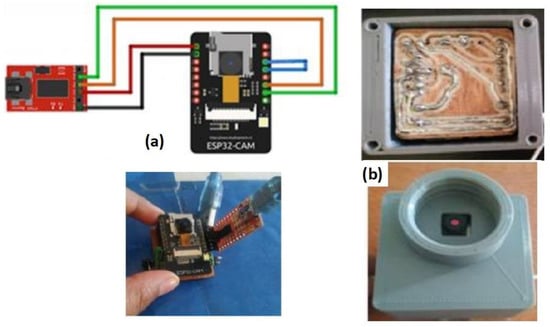
Figure 3.
ESP32-CAM (a) connection with FTDI module and (b) PCB board fixed to plastic tap case.
An infra-red (IR) sensor triggered the camera power supply whenever an insect entered the trap [46], avoiding excessive energy consumption. The infrared radiation PIR sensor (mod HC-SR501, Panasonic, Osaka, Japan) was inserted inside the trap, close to the insertion hole, to detect any kind of motion; this is shown in Figure 4a. The PIR (pyroelectric) sensor board uses the single trigger mode, and starts its operation when the control pin is set to zero (Figure 4b). The multivibrator output rises to five volts once insect movement is detected by the PIR sensor. This output is introduced to a flip-flop memory that stores its high value. Two pulses were detected due to the presence of two insects by the motion sensor, as depicted by the top signal, shown in Figure 4b. Although several insects are detected, the flip flop will stay constant at 5 V, meaning that the camera only flashes once. The ESP32-CAM has an internal RTC (Figure 4a), and when the time is 17:00, it checks port 1.0 to ask whether insects were detected, and if so, acquires an image and stores it in the SD card.
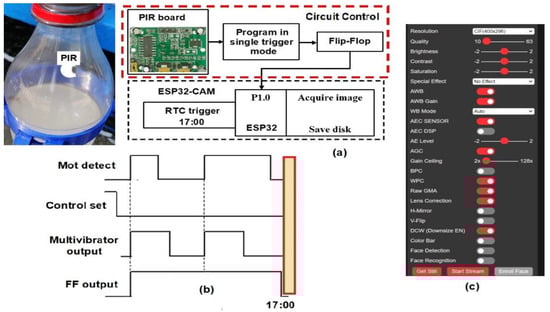
Figure 4.
(a) Block diagram of the control system for acquiring images. (b) Control timing signals at the PIR board. (c) ESP32-CAM software settings.
The ESP32-CAM webserver page was used to program the main settings of the acquired image. These parameters include resolution, brightness, and contrast settings, shown in Figure 4c. The camera had a 1/4″ lens size and was placed 20 cm over the Ceratrap liquid. It captured images with a resolution of 320 × 240 (QVGA). Camera image exposure and gain were fixed at 100 and 5, respectively. Contrast, brightness, and saturation applied to the picture varied between −2 and 2. Brightness was set to 1, and saturation was set to −2. Grayscale images save considerable space in memory and operational time for fly detection. During programming, a special effect was set to 2, corresponding to grayscale imaging. Once the camera takes a picture in each trap (node), real-time image processing takes place.
The number of flies are counted daily, and the information will be available to the producer through the LoRa transmission system, shown in Figure 5. The LoRa transmitter was fixed close to the trunk in Figure 5a and at the top of canopy at Figure 5b.
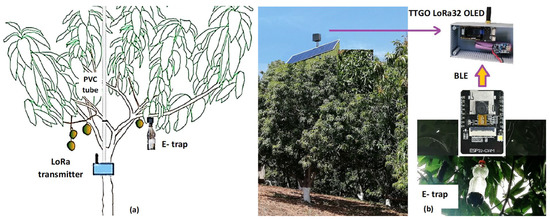
Figure 5.
(a) Schematic diagram from a tree having the LoRa module at the trunk. (b) Main modules were used to take images at the trap and send signals from the top of the tower.
2.2. Image Analysis
Embedded systems use computer vision techniques to detect flies within traps [47]. Segmentation techniques remove background image pixels, and the remaining pixels contain information from the fly or flies [48,49,50,51]. The grayscale image uses less memory, and during binarization, each pixel intensity is compared to a threshold value. Trapped flies were detected by comparing the pixel value in two successive grayscale images [52], with A(x,y) as the actual image and P(x,y) as the previous one. When both images are equal, no flies entered the trap. This operation can activate an alarm but cannot identify the fly species. The image processing algorithm used to detect the flies is shown in Figure 6.
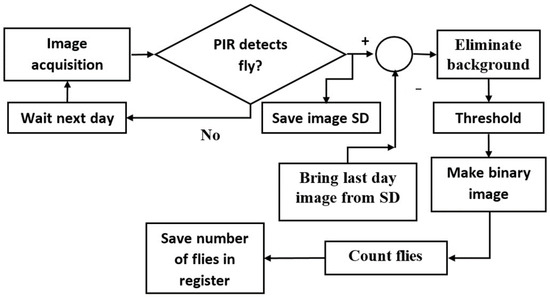
Figure 6.
Image processing block diagram.
An 8-bit grayscale image was acquired every day at 17:00 by the ESP32-CAM, as explained earlier. If the PIR sensor detected an insect within the trap, the grayscale image was saved in a SD and binarized. The image stored from the previous day was subtracted from the actual image to remove the background pixelwise. Sixty grayscale images were inserted into the ImageJ 1.41 software (LOCI, University of Wisconsin, Madison, WI, USA) to obtain their histograms. These histograms were used to obtain the threshold value, to binarize the image. Once the flies were binarized, the dark images were counted, and the value was saved in a register within the ESP32.
Figure 7a shows a grayscale image that has one fly and without eliminating the background by subtraction. The threshold value for binarization was 190, and the fly appears in black. All the CeraTrap liquid appears in white, and the PVC external vegetation gives a black value, shown in Figure 7b. Another RGB image presented three insects, an ant, a house fly, and a fruit fly, all floating over the yellow food bait, shown in Figure 7c. If we only wanted the insects to appear in the segmented area, two thresholds were used. The fruit fly is encircled in red while the housefly is surrounded by an orange circle (Figure 7d). Several new software’s are being developed to optimize segmentation in ImageJ [53,54].
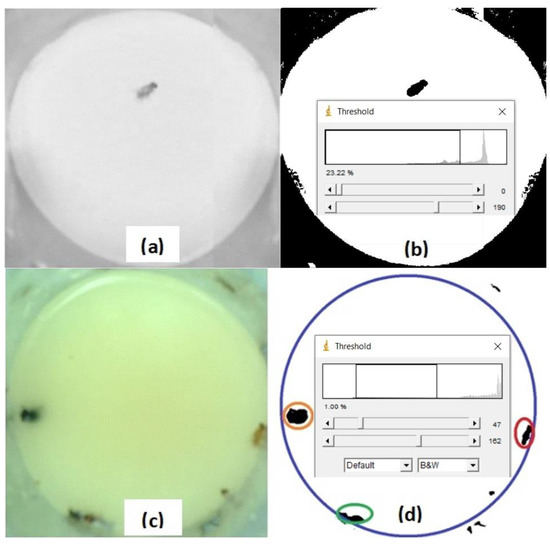
Figure 7.
(a) Grayscale image of one fly obtained with the ESP32-CAM. (b) Binarized fly image after thresholding. (c) Color image with several flies acquired with the ESP32-CAM. (d) Binary image of several flies after being processed with two thresholds.
2.3. LoRa Communication
LoRa is a Chirp Spread Spectrum (CSS) modulation technology that encodes information through chirps with a linear variation of frequency over time. The frequency used in North America is 915 MHz with three different bandwidths: 125 kHz, 250 kHz, or 500 kHz. As the bandwidth BW increases, a higher quantity of bytes can be sent in the same amount of time. Data transmission rate varies from 300 bps to 50 kbps, depending on the spreading factor (SF) and channel bandwidth settings [55]. With a higher spreading factor (SF = 12), the transmission can reach a greater distance, even as its data rate decreases. The coding rate CR is the final parameter and is related to the time-on-air required to transmit a packet. As CR becomes smaller, a greater time is required to transmit a packet as the time-on-air will be higher. In order to extend the communication range for this experiment, a spreading factor of 11 was selected along with a BW of 125 and a CR of 4/5 [56].
This experiment uses a TTGO LoRa32-OLED V1 module for each node connected to the ESP32-CAM. The module based on an ESP32 microcontroller [57] presents a SEMTECH SX1276 LoRa chip working at 915 MHz [58]. This module has been programmed in Arduino IDE [59]. In the first WSN, the ESP32-CAM sends the processed value with the number of flies trapped to the TTGO LoRa32-OLED V1 module nearby the trap height. In the second WSN, the TTGO LoRa32-OLED V1 module is fixed at the top of a 20 m tower, Figure 5. The ESP32-CAM communicates through its Bluetooth 4.2 LE module (BLE) with the TTGO Module.
The received signal strength indication (RSSI) measured in dBm, points out the strength of the signal that is reaching the receiver. As RSSI approaches 0, the signal arriving at the receiver improves. A relationship between distance and RSSI is given by the FRIIS equation [55], (Equation (1)). The constant A is the received power in dBm when the distance between the transmitter and receiver is 1 m, and n is the loss constant for a given environment. The n value used in a controlled environment is 2.
The distance between the receiver point and the transmitter node was measured with a laser (mod. Metron 60 BT, Sola, Austria). This sensor is very precise as it measures a distance of 50 m with an error of 1.5 mm. When trunks interfered with the optical ray, measurements were taken by sections. The final distance to the tower was obtained by the Pythagoras theorem (Equation (2)) after measuring variables d1 and d2. These distances are shown with semicolon lines in Figure 8.
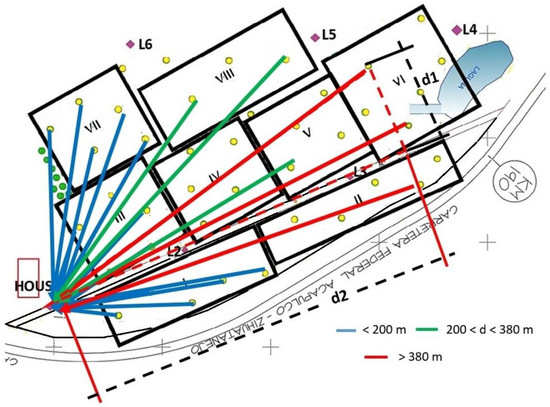
Figure 8.
Distances from each transmitter node to the receiver LoRa showing the measurements d1 and d2 (red semi-colon) that were required to obtain the distance d. Each black frame with a roman number corresponds to a hectare of grown trees. The different colored arrows show the transmission distance from each e-trap to the end receiving node.
LoRa Communication Systems
Three different data communication systems were tested, and each trap corresponds to a node. The first two nodes use LoRa static systems, meanwhile the third uses drone-tower combinations.
In the first WSN system, data was transmitted from each trap (node) to the LoRa receiver near the house (Figure 8). A point-to-point communication system was employed where the LoRa transmitter was at a height varying between 3 and 5 m based on the tree trunk and branches. The receiver was placed at a height of 20 m over the house tower. The receiver module measured the RSSI, and the transmitting packets presented up to 20 bytes of data information; two bytes correspond to the tree number and the other byte to the quantity of flies. Packet loss was determined as the percentage of bytes of information received against the total number of bytes sent. Blue lines in Figure 8 represent distances below 200 m between traps and house tower. Green lines represent those traps that have a distance higher than 200 m and lower than 380 m to the LoRa receiver. Red lines present distances between the trap transmitter and the house receiver longer than 380 m. Provisional values of trapped flies were inserted into the embedded system to test the efficiency of the communication system.
The second LoRa static transmission system presents a star topology (Figure 9). Each hectare marked with a black square or rectangle presents a star topology network with a receiver at the center of four or five transmitting traps (nodes). Each nearby trap (node) can be connected to a central gateway so that all data packets are aggregated to it without coordination between them [60,61]. The LoRa transmitters were initially placed over the trap at a height of 5 m and the LoRa transceiver fixed at a height of 20 m over a tower; each tower was placed at the middle of a hectare (square center).
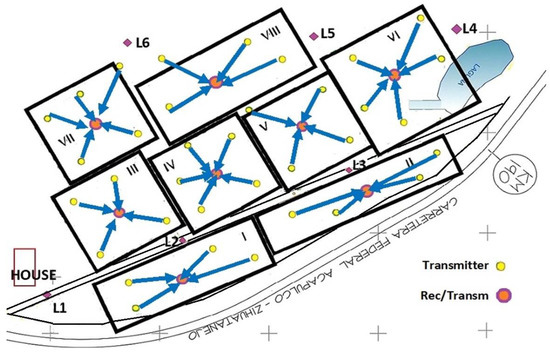
Figure 9.
Star topology with receiver at the center. Each trap is placed where a yellow filled circle appears. The central tower of each hectare of mango trees is marked with a circle filled with orange color. The transceiver in each central tower receives the data from the e-traps following the blue arrow routes. The transceiver from each tower transmits the data to the house end node.
The TTGO LoRa32-OLED V1 module at the top of the tower works as a transceiver and has the ability to receive and transmit data. The module was programmed with Arduino IDE, and the block diagram illustrates the constants used by the LoRa transceiver (915 MHz, CR = 4/5, BW = 125 kHz, SF = 11), shown in Figure 10. The data is collected daily at 18:00 when the system is reset and wakes from its sleeping routine. The system starts receiving data from each trap at 18:00. The first trap (node) will transmit data for 2 min, and the embedded system decodes the data package (Figure 11) which contains tree number 41 and the quantity of flies being trapped (3). In the example of Figure 11, each trap will transmit at a different time towards the receiver-end node fixed at the tower. The resultant packet elaborated by the TTGO LoRa32-OLED V1 module has 8 bytes (41 03 48 00 57 02 63 05) with the black bytes as the tree number; the next byte, shown in red font, is the number of flies (Figure 11). Once the data is encoded the package is transmitted to the main tower at 18:15, shown in Figure 10. After 30 s, the system will go to sleep until next day. The module uses only one antenna for both receiving and transmitting.
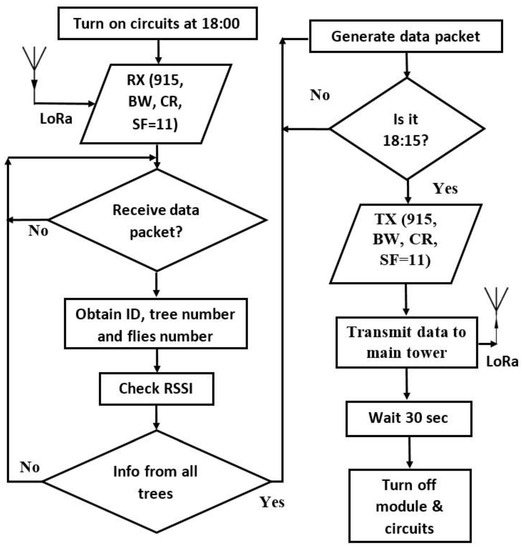
Figure 10.
Programming of the TTGO LoRa32-OLED V1 module.
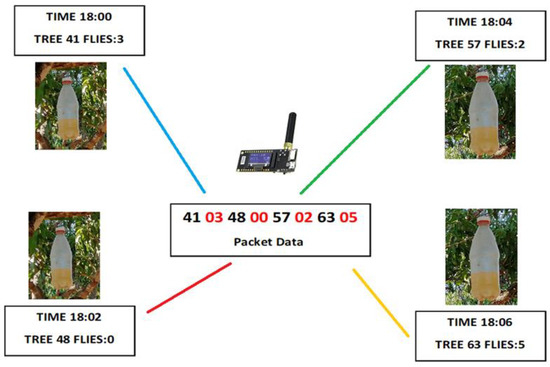
Figure 11.
Data transmitted within the traps (nodes) of one hectare. The black bytes correspond to the tree number and the red number indicates the number of flies counted at the specific trap at the tree. Each e-trap is sampled at a different time avoiding data interference.
2.4. UAV Data Collection System
The last communication system used a mobile drone platform (Figure 12) with a LoRa mounted on it. UAVs (Unmanned Aerial Vehicles) are aerial vehicles remotely driven with no pilot on board [62]. Waypoints allowed the DJI mini2 drone (Shenzhen DJI Sciences and Technologies Ltd., Shenzhen, China) to fly a predetermined path using GPS coordinates; altitude, speed, and camera settings were programmed by the operator for each waypoint. A similar autonomous UAV flight used a DJI GS Pro with a preplanned flight path [63]. Route planning should consider orchard environment, area and UAV features to program the optimum autonomous flight [64].
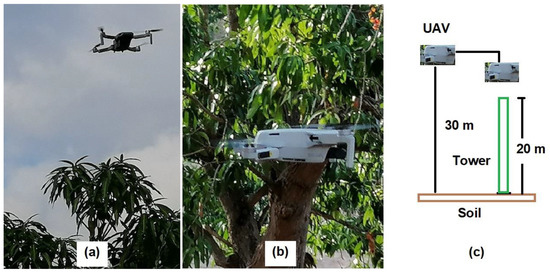
Figure 12.
(a) UAV flying over the trees in open space. (b) UAV returning from the route. (c) UAV heights during data acquiring routine.
The DJI mini2 flight altitude was set at 30 m (Figure 12a,c), and the drone speed at 1.5 m/s. Once the UAV views a tower it descends 5 m, Figure 12c. A two-dimensional route planning took into account tree size for UAV safety. The operator programmed the UAV manually to transit a given route using waypoints, (Table 1 and Figure 13). The waypoints given by WP1-THa1, WP2-THa3, etc., represent the different towers set on the mango farm. In point WP5, the UAV will rotate during its flight by 90°, so that it can arrive to WP6-THa6 (Table 1 and Figure 13). The autonomous mission used Litchi, a flight app for the DJI drone for tracking and getting the data from the towers. The TTGO LoRa32-OLED V1 module from each tower was programed as shown in Figure 10, and the data package was transmitted to a LoRa 1276 receiver (Semtech, France) at the UAV unit.

Table 1.
Waypoints containing travel distances and time on air.
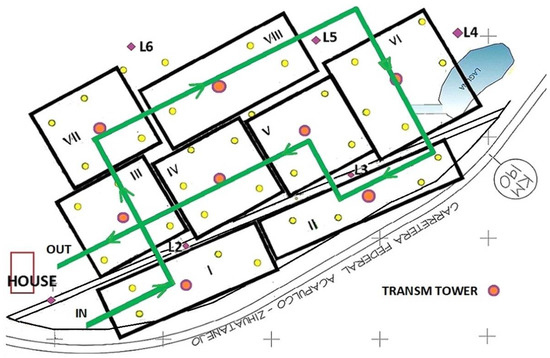
Figure 13.
UAV data collection from star-LoRa transceiver towers, showing its route in green. Yellow filled and orange circles represent the e-traps and towers within the orchard. Each black frame with a roman number corresponds to a hectare of mature mango trees.
2.5. Flies Monitored per Season
A monitoring network consisting of 40 traps was used to capture adult fruit flies. The traps with all their components and circuits were developed in the Irrigation laboratory at the Universidad Autonoma Chapingo. CeraTrap bait was added to the traps before hanging them on the trees. Four traps were hung per hectare on random trees around a central tower that contained the fifth trap. Fly presence was checked daily at the house tower receiver, and every week, traps were checked at the orchard by technical personnel [65], changing the trap with a new one that had fresh bait.
The fruit flies per trap per day index (FTD) determined plant health and its infestation according to the National Campaign against Fruit Flies (NCFF). The index was calculated from the number of fruit flies caught within all the traps per day [65].
3. Results
The Ceratrap fluid is a yellow color with R, G, B values of 206, 232, 181, respectively (Figure 7c and Figure 14b). The fly floating over the liquid has R, G, B values of 180, 173, and 058, respectively. The PET bottle hanging (Figure 14a,b) from a tree branch or structure moves with variable wind. A blue plastic pressure strap was designed and built to fix the bottle to the tree branch. Three holes within the strap allow ropes to fix the bottle to different branches and avoid movement, shown in Figure 14c.
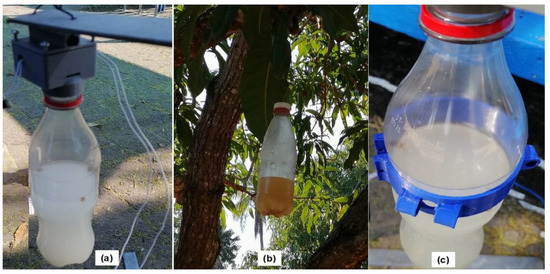
Figure 14.
(a) PET trap hanging in the lab. (b) PET trap hanging in the tree after 3 weeks with the same bait. (c) PET trap surrounded by a plastic structure to avoid movement.
As the day advanced, CeraTrap and fly RGB values varied; they were more difficult to analyze at noon, shown in Table 2. Eight-bit grayscale values acquired in the morning (9:00 am) were 204 and 133 for CeraTrap and flies, respectively. In the afternoon, all RGB and grayscales values decreased, and the grayscale difference was the highest (215%), so images were taken in the afternoon at 17:00.
Table 2.
Average raw RGB image data values of flies and CeraTrap fluid during the day.
Eight flies were introduced into 10 traps and fly detection analyzed at three hours (9:00, 12:00, 17:00) under three thresholds (Th1, Th2 and Th3), Table 3. The optimum threshold is always given by Th2.
Table 3.
Fly detection efficiency at noon, morning and afternoon for three different thresholds.
In the afternoon, the best threshold (Th2 = 122) showed flies in black on a white background. The pixels surrounding the trap’s polyurethane circle within the image remained black (Figure 15a,b). With Th1 = 83 in the afternoon, this contour became white, and the fruit-fly area decreased by 42%; detection efficiency was still 100%. With a higher threshold of 149, efficiency decreased to 12.5% and the ellipsoidal fly shape became square. At noon, with a threshold Th2 of 212, fly detection accuracy was 100%, but the outer contour from the PET bottle image became white. Two black small figures similar to flies were found outside the circle with Th1 = 83, reducing the detection efficiency to 75%; each fly area decreased by 64%. In the morning, the best threshold was Th2 with a value of 187. For Th1 = 155, the detection efficiency and fly area decreased to 75% and 57%, respectively.
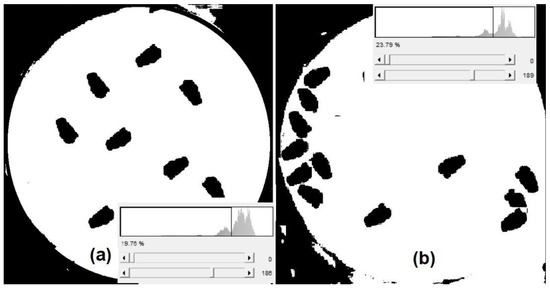
Figure 15.
Binarized image of flies using a single threshold (a) floating over the CeraTrap fluid and (b) at the side of the PET bottle.
During calm weather, the flies catched by the trap were found floating over the fluid in the center of the bottle, as shown in Figure 15a. However, under windy conditions, the CeraTrap fluid moved the flies to the side of the PET bottle, shown in Figure 15b. Threshold values for binarization were obtained using the ImageJ software, and images were acquired at 9:00; the threshold value was 186 in both images (Figure 15). Although binarization results were easy to achieve, automatic counting results were difficult because all the outer contour from the PET bottle is also black. If the image was XORed with F0 pixelwise, outside contour elimination worked in 40% of the cases.
The limited embedded computational power avoids the use of RGB images, so grayscale imaging was employed by the ESP32-CAM. When images from two consecutive days are subtracted, the value must be null if the number of flies is the same. This condition is not true if flies slide over the liquid surface before the second image is taken. A correlation was obtained between the fruit fly image processing count and the PIR sensor pulses, as shown in Figure 16.
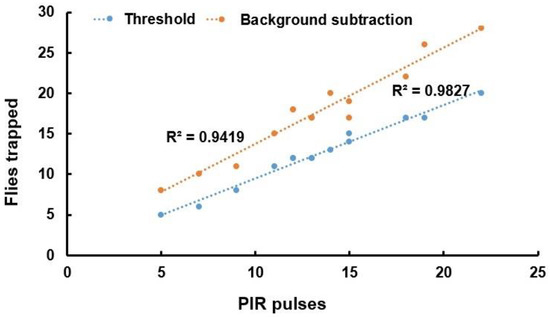
Figure 16.
Flies detected by the PIR sensor against those found by threshold and background subtraction algorithm.
A 0.9827 correlation was obtained between the insect count from threshold-based binarization and PIR pulses and is shown with blue line. An R2 = 0.94 with background subtraction was obtained, but the slope was higher. A higher quantity of flies resulted from subtraction imaging as the flies do not remain in the same location. For example, PIR counted 19 flies while the subtraction image algorithm counted 26.
3.1. Communication of Data
In the first transmission experiment, distance from nodes (traps) to the house tower varied between 100 and 500 m. Data were introduced to the LoRa module before the traps were hung on the trees to analyze their performance. Data arriving to the house receiver were averaged and RSSI and data packet loss plotted, shown in Figure 17. Vegetation interfered with the transmission and the receiver RSSI (yellow line) decreased from −80 dBm at 100 m to −120 dBm at 400 m, shown in Figure 17. At distances more than 400 m, data packet loss increased drastically from 30% to 70% and the system was no longer used. Indoor simulated RSSI results were very different from the real measurements, as shown by the green line in Figure 17.
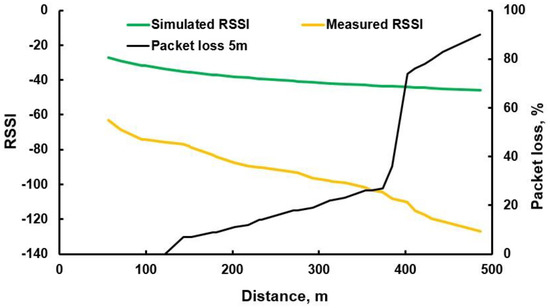
Figure 17.
RSSI, packet loss for different distances during data transmission within experiment one.
The star topology (second experiment) used class A LoRaWAN end nodes. Trap end-nodes with class A can only transmit during two specific time windows before they enter a sleep state and cannot send acknowledgment messages to the transmitter [66,67]. Each end-device transmits data to a receiver end device without verifying its availability. The LoRa application of this second experiment was set to transmit 10 bytes of data every 2 min. If the variables are SF = 11, BW = 125, f = 915 MHz, and CR = 4/5, the packet duration on air will be 578 ms. If the system transmits 20 bytes, its airtime will be 744 ms, representing only half of the tower LoRa receiving period.
In this star topology experiment, distance from the transmitter to the receiver ranged from 50 to 60 m. The transmission crossed through several branches, affecting the strength of the signal (RSSI) that was reaching the ESP32 LoRa module. Several trunks were gathered to provide a diameter section of 0.6 m, providing an RSSI = −114 dBm within safe limits, but there was also a 63% data packet loss (Table 4). Trees were pruned to avoid transmission problems, shown in Figure 18a,b. Dense vegetation included trunks, leaves, and branches, but trunks and thick branches attenuated the electromagnetic transmission considerably. The LoRa transmitter was taken to the top of the tree (Figure 5b and Figure 18c), minimizing data package-loss within the system. Communication between the orchard and house tower took place within open space, shown in Figure 9.
Table 4.
RSSI and data packet loss measured at the receiver after passing through a branch with different diameters.
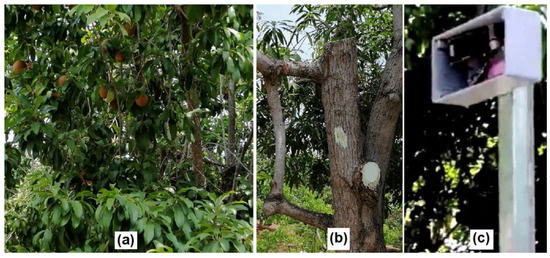
Figure 18.
Tree (a) having dense vegetation, (b) after being pruned, and (c) transmitter module at the top of the canopy.
The UAV-tower transmission system was carried out only during 2021 and using ten flights. In the first flight, the route took 813.3 s without acquiring data before the UAV returned home. Time on air data transmission from each tower was 578 ms, which can be reduced to 41.2 ms by using a spreading factor of 7.
Route programming allowed for a window of 2 min per tower, and the UAV could receive data several times. Transmission from 8 towers took 16 min, which added 13′55″ min to the flight transit of; the total flight time was therefore 29 min 55 s. This period is close to the battery discharge limit. The route was rescheduled to optimize transit time and battery consumption, shown in Table 5. It takes 15 min and 35 s to move over the trees and receive data from each tower. For example, in tower-3, UAV operation starts at 18:16:35 and is receiving data for 20 s; the UAV will then move to tower 7 for 60 s, shown in Table 1. This type of programming helps to synchronize between tower transmission and UAV receiver timing, allowing three times as much data to be sent. Class B transmission protocol was used between the tower (node) and the UAV receiver. In class B, nodes are synchronized with the network using properly timed reception windows [68]. Some UAVs incorporate sensors for taking air measurements and transmitting them through a LoRa node to a gateway [69].
Table 5.
Scheduled transmission for each tower, including transit flights between towers (V).
3.2. Fly Detection per Day
Fruit fly adult population shows fluctuations throughout the year [70]. In this orchard at Loma Bonita, Guerrero, Mexico, Anastrepha obliqua was the main fruit fly species trapped, but a small quantity of Anastrepha striata specimens were also found. Both varieties were common throughout the coast and were captured at mango farms during 2016 at the village of Atoyac [65]. Flies captured during the three seasons were expressed as FTD being sexually immature flies more attracted to traps that use CeraTrap [71]. The number of A. obliqua flies captured during 2017 and 2018 at Loma Bonita was 393 and 462, respectively. A maximum of 20 A. striata were captured per year before 2019. The plan developed to decrease fruit fly infestation was to rapidly collect mango fruit from the soil and release sterile males. These sterile males were released by helicopters in February 2019 so that they would mate with females who would then lay unviable eggs [72]. Technical personnel checked the traps every week during 2019. During 2020, data were downloaded at the tower close to the house from the 40 electronic traps. Trained personal checked the traps to determine the presence of new flies, and 85% were successful, with some errors being noted as the presence of other insects within the traps. The total number of flies collected during the entire 2019–2021 seasons were 41, 69, and 61, respectively. In June 2020, 20 flies were captured in the 40 traps, which was the highest amount (Figure 19). Only five flies appeared per week in the traps, and two flies were found in a trap near the water pond. During August of 2019 and 2020, no flies were trapped as the weather was dry (Figure 19), and the weeds-grasses within the tree rows died. Storms were present beginning in April 2021 and continuing until mid-September, causing a higher incidence of insects. With poor mango quality standards, fruit flies will affect orchards and supermarkets [73]. Therefore, cheap electronic traps can become proper insect control.
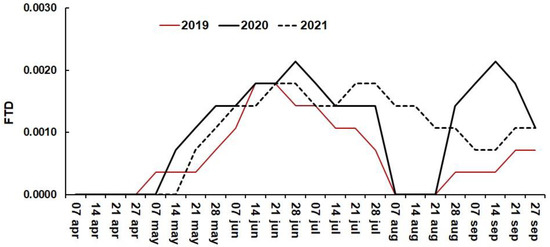
Figure 19.
Flies per trap per day obtained during three seasons.
4. Discussion
E-traps pair bait to attract flies with sensors to detect and count the insects [71]. Once the infestation is known, experts can help to control it without applying excessive amounts of insecticide. The number of pulses provided by PIR infrared sensor within the PET trap indicates the number of insects that entered [74]. As we used a flip flop, it was only counted once per day; the concept was to employ the trap as an alarm and save energy. A small solar panel would maintain a constant charge on a lithium battery. If this flip flop is removed, pulses can be counted by the microcontroller and provide a more accurate result of the number of flies trapped. A sound sensor and the PIR sensor can detect that an insect entered the trap but cannot identify whether it was a fruit fly [75]. The use of optoacoustic sensors can provide better fly detection within traps [76]. An image sensor based on the ESP32-CAM presented up to 3.2 Megapixels, higher than the 2 megapixels recommended to classify insects [74]. However, due to energy restrictions, the 320 × 240-pixel resolution image was used. In the future, the electronic trap will be able to advise the technician when the attraction bait is no longer effective. Changes in the fluid’s color and level within the bottle provides additional information. The IoT ESP32-CAM system detects the presence of fruit flies and transmits the trap number together with the number of flies counted daily through a LoRa system.
Image analysis that is carried out within embedded systems for shape classification and recognition should consider their limited computational power and reduced memory [77,78]. Memory size will depend on the number of arrays per image [79,80], whether they are RGB or grayscale, and their quality (bits per pixel). Memory access in embedded image processing systems dominates its energy consumption [80]. It was found that a single global threshold was not enough to obtain a perfect classification of the flies, shown in Figure 20a, as the black contour was prone to error counting. The automatic system employed two thresholds [81], and when the pixel intensity was within both thresholds, the pixels became black, otherwise it was left in cero, shown in Figure 20b; the thresholds used were 72 and 151. The percentage of fruit fly detection was 100%. Segmentation and detection results provide a rough count of the number of fruit flies trapped but does not provide an algorithm that can prevent beetles or houseflies from being counted. Deep learning techniques combined with image processing are actually used to count insects with precision [75]. Foliage reduced light incidence to the bottle, and when trees had more branches, CeraTrap RGB values varied throughout the day. Deep learning techniques are also required to optimize binarization under variable lightning patterns.
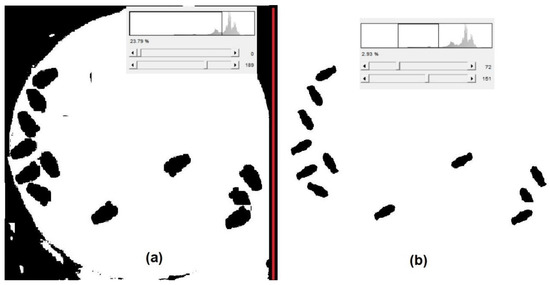
Figure 20.
(a) Binarization of a trap grayscale image after using (a) one and (b) two thresholds.
If more traps are added by hectare, the point to point will not work properly in the star topology. Information will collide when two or more transmissions overlap [82,83] at a single receiver. As transmission time increases, the probability that a collision takes place is higher. As a common destination node, a gateway [59,84] should substitute the LoRa receiver node. When nodes send to a single end-point, the total time required to transmit all nodes’ data to the destination module is reduced [27]. Wireless systems configured in a star topology, with nodes and a gateway device, use only one hop, eliminating latency problems. Multi-channel gateways can operate up to eight multiple frequency channels at the same time [84].
Transmission within mature mango trees can be highly attenuated by foliage and trunks. Propagation models are used to predict propagating signal path loss caused by vegetation in the 230 MHz–95 GHz frequency range [85]. Attenuation was low at tree trunk level at distances up to 350 m, but increased rapidly after 400 m [85]. Coverage area decreases with foliage and requires tests to determine the number of nodes and distance to receiver [86]. In our experiment, the height of transmitter and receiver antennas improved transmission distance and reduced data package loss.
Low-altitude platform UAVs working at altitudes below 100 m are used for precision agriculture and WSN networking [87]. UAV flights can reduce shadow and vegetation blockage effects [86]. Drones can dynamically collect data from distributed nodes and enhance network coverage. Static data collection by system2 did not consumed more power than with the tower-UAV system as timely transmissions were programmed precisely. A limiting factor in a UAV-based data collection system is its’ flight time restriction, but with larger capacity lithium-ion batteries, flight time can last up to 30 min [88]. The total time required for the flight over the 8-hectare farm to acquire data was a little more than 15 min, so capturing data from 15 hectares is possible. The method can be repeated after storing the route and waypoints, but rural farmers do not easily become accustomed to the process. If the UAV is elevated to 100 m, it can have a field of view of 5 hectares and could recover data from five towers instantly. The 15-hectare data could be acquired in 10 min. UAV communications systems work by using one frequency to control the aerial vehicle from the ground via a remote pilot while another frequency transmits data or videos [89].
Fruit flies sampled with electronic traps from 2019 to 2021 were plotted in Figure 19. Federal officials impose a quarantine if an infestation is detected. The NCFF plant protection categories consider a zone to be Free Fruit Fly when FTD = 0.0 and low prevalence when FTD ≤ 0.01. If FTD > 0.01, the zone has to take plant protection actions. Measurements higher than FTD < 0.0023 were encountered in the three years, corresponding to a weekly count of six flies per trap. Wasps and other beetles were found dead inside the trap.
5. Conclusions
Accurate determination of fruit-fly infestation is of great importance in different scientific fields. In this paper, a commercial electronic trap with a ESP32-CAM system was experimentally tested with an algorithm that uses limited computational power programming and memory. Each electronic trap provides low-cost nodes with IoT wireless transmission. As the ESP32-CAM takes a grayscale picture that is binarized by the embedded system, it allows for one or more clear fruit fly morphological features within the image; fruit fly morphological details within the image include the insect’s body and head. After binarization, counting provides the quantity of insects trapped in a given period of time. As illumination varies throughout the day with canopy density, a single threshold did not distinguish the flies properly. A window with two thresholds eliminated all the CeraTrap bait liquid background as well as the outside vegetation.
Generally, five traps are hung per hectare, so a star network topology of LoRa was employed per hectare. It provides shorter distances between end nodes and the receiver, making it helpful for dense vegetation spaces. This method is much cheaper than point-to-point end devices as a central receiver is used by the communication. The receiver was fixed to the top of a 20 m tower, but in some cases, packet loss occurred when trunks and branches interfered with the signal sent by the trap nodes, so pruning was necessary to reduce losses.
A DJI mini2 UAV scanned the data from same towers. At first, the UAV flew at a height of 30 m and took 15 min and 35 s to return home after scanning the 8-hectare route and collecting the data. At a higher flight altitude, route time can be reduced. Annual trap monitoring is still in progress, and, through the FTD, can determine the health of the farms. These electronic traps have shown excellent behavior and will be providing more information about fruit fly infestation in mango orchards.
In the future, several orchards with traps should be installed to maintain control of any fruit fly infestation. The alarm will help to determine the appearance of fruit flies and an odor-level sensor can provide an alert for when the CeraTrap fluid has to be replaced. With these traps, the technical personnel can work more efficiently.
Author Contributions
Conceptualization, F.H., R.R. and A.A.; Methodology, F.H., A.A., S.V., R.R. and O.O.; Software, O.O.; Validation, F.H., R.R., A.A. and O.O.; Formal analysis, F.H., S.V. and R.R.; Investigation, F.H., R.R., S.V. and O.O.; Writing—original draft, F.H.; Writing—review and editing, R.R. and S.V.; Project administration, R.R.; Resources, F.H.; Funding acquisition, F.H. All authors have read and agreed to the published version of the manuscript.
Funding
This research was funded by the DGIP research grants 22007-DTT-65 and 21078-DTT-65 from the Universidad Autonoma Chapingo.
Institutional Review Board Statement
Not applicable.
Informed Consent Statement
Informed consent was obtained from all subjects involved in this study.
Data Availability Statement
The data presented in this study are available upon request from the authors.
Acknowledgments
We would like to thank the DGIP Institute at the University that provided the funding and to trained personal at SENASICA for their help.
Conflicts of Interest
The authors declare no conflict of interest.
References
- Oliveira, C.M.; Auad, A.M.; Mendes, S.M.; Frizzas, M.R. Economic impact of insect pests in Brazilian agriculture. J. Appl. Entomol 2012, 137, 1–15. [Google Scholar] [CrossRef]
- Vayssières, J.F.; Fatogoma, S.; Moussa, N. Inventory of species of fruit flies (Diptera: Tephritidae) linked to the mangotree in Mali and testing of rational control. Fruits 2004, 59, 1–14. [Google Scholar]
- Guillén, L.; Monribot-Villanueva, J.L.; Guerrero-Analco, J.A.; Ortega, R.; Altúzar-Molina, A.; Mena, V.; Ruiz-May, E.; Aluja, M. Influence of Sunlight Incidence and Fruit Chemical Features on Oviposition Site Selection in Mango by Anastrepha obliqua: Implications for Management. Insects 2022, 13, 141. [Google Scholar] [CrossRef] [PubMed]
- Aluja, M.; Mangan, R.L. Fruit fly (Diptera: Tephritidae) host status determination: Critical conceptual, methodological, and regulatory considerations. Annu. Rev. Entomol. 2008, 53, 473–502. [Google Scholar] [CrossRef] [PubMed]
- Leach, H.; Moses, J.; Hanson, E.; Fanning, P.; Isaacs, R. Rapid harvest schedules and fruit removal as non-chemical approaches for managing spotted wing Drosophila. J. Pest Sci. 2018, 91, 219–226. [Google Scholar] [CrossRef]
- Grechi, I.; Preterre, A.L.; Caillat, A.; Chiroleu, F.; Ratnadass, A. Linking mango infestation by fruit flies to fruit maturity and fly pressure: A prerequisite to improve fruit fly damage management via harvest timing optimization. Crop. Prot. 2021, 146, 105663. [Google Scholar] [CrossRef]
- Soares, D.; Souza, T.A.; Santos, J.D.; Giustolin, T.A.; Alvarenga, C.D. Fruit flies (Diptera: Tephritidae) in mango orchards in the Minas Gerais semi-arid region. Rev. Caatinga 2020, 33, 844–852. [Google Scholar] [CrossRef]
- Louw, C.E. The efficacy of traps in predicting fruit fly infestation levels in mango orchards. Acta Hortic. 2013, 992, 429–439. [Google Scholar] [CrossRef]
- Rojnic, I.D.; Bazok, R.; Barcic, J.I. Reduction of olive fruit fly damage by early harvesting and impact on oil quality parameters. Eur. J. Lipid Sci. Technol. 2015, 117, 103–111. [Google Scholar] [CrossRef]
- Raghu, S.; Drew, R.A.I.; Clarke, A.R. Influence of host plant structure and microclimate on the abundance and behavior of a tephritid fly. J. Insect Behav. 2004, 17, 179–190. [Google Scholar] [CrossRef]
- N’Dépo, O.R.; Hala, N.; N’Da Adopo, A.; Coulibaly, F.; Kouassi, P.; Vayssières, J.F.; De Meyer, M. Fruit flies (Diptera: Tephritidae) populations Dynamic in mangoes production zone of Côte-d’Ivoire. Agric. Sci. Res. J. 2013, 3, 352–363. [Google Scholar]
- Nanga Nanga, S.; Hanna, R.; Fotso Kuate, A.; Fiaboe, K.K.M.; Nchoutnji, I.; Ndjab, M.; Gnanvossou, D.; Mohamed, S.A.; Ekesi, S.; Djieto-Lordon, C. Tephritid Fruit Fly Species Composition, Seasonality, and Fruit Infestations in Two Central African Agro-Ecological Zones. Insects 2022, 13, 1045. [Google Scholar] [CrossRef]
- Bali, E.M.; Moraiti, C.A.; Ioannou, C.S.; Mavraganis, V.; Papadopoulos, N.T. Evaluation of Mass Trapping Devices for Early Seasonal Management of Ceratitis Capitata (Diptera: Tephritidae) Populations. Agronomy 2021, 11, 1101. [Google Scholar] [CrossRef]
- Minhibo, M.Y.; N’Dépo, O.R.; Hala, N.; Koua, H.K.; Tuo, Y.; N’goran, A.; Coulibaly, A.B.; Doumbia, S.; Djaha, J.B.; Kouakou, C.K.; et al. Assessment of Fruit Fly Trapping System in Mango Orchards in Northern Côte d’Ivoire. J. Agr. Sci. Tech. 2018, A8, 18–27. [Google Scholar]
- Hanna, R.; Gnanvossou, D.; Goergen, G.; Bokonon-Ganta, A.; Mohamed, S.A.; Ekesi, S.; Fiaboe, K.K.; Agnontcheme, A.I. Efficiency of Food-Based Attractants for Monitoring Tephritid Fruit Flies Diversity and Abundance in Mango Systems Across Three West African Agro-Ecological Zones. J. Econ. Entomol. 2019, 113, 860–871. [Google Scholar]
- Ekesi, S.; Mohamed, S.; Tanga, C.M. Comparison of food-based attractants for Bactrocera invadens (Diptera: Tephritidae) and evaluation of Mazoferm—Spinosad bait spray for field suppression in mango. J. Econ. Entomol. 2014, 107, 299–309. [Google Scholar] [CrossRef]
- Manrakhan, A.; Daneel, J.H.; Beck, R.; Virgilio, M.; Meganck, K.; De Meyer, M. Efficacy of trapping systems for monitoring of Afrotropical fruit flies. J. Appl. Entomol. 2017, 141, 825–840. [Google Scholar] [CrossRef]
- Martinez-Ferrer, M.T.; Campos, J.M.; Fibla, J.M. Field efficacy of Ceratitis capitata (Diptera: Tephritidae) mass trapping technique in Clementine groves in Spain. J. Appl. Entomol. 2010, 136, 181–190. [Google Scholar] [CrossRef]
- Čirjak, D.; Miklečić, I.; Lemić, D.; Kos, T.; Pajač Živković, I. Automatic Pest Monitoring Systems in Apple Production under Changing Climatic Conditions. Horticulturae 2022, 8, 520. [Google Scholar] [CrossRef]
- Sciarretta, A.; Calabrese, P. Development of automated devices for the monitoring of insect pests. Curr. Agric. Res. J. 2019, 7, 19. [Google Scholar] [CrossRef]
- Potamitis, I.; Rigakis, I.; Tatlas, N.A. Automated surveillance of fruit flies. Sensors 2017, 17, 110. [Google Scholar] [CrossRef] [PubMed]
- Cardim Ferreira Lima, M.; Damascena de Almeida Leandro, M.E.; Valero, C.; Pereira Coronel, L.C.; Gonçalves Bazzo, C.O. Automatic Detection and Monitoring of Insect Pests—A Review. Agriculture 2020, 10, 161. [Google Scholar] [CrossRef]
- Gutierrez, A.; Ansuategi, A.; Susperregi, L.; Tubío, C.; Rankić, I.; Lenža, L. A Benchmarking of Learning Strategies for Pest Detection and Identification on Tomato Plants for Autonomous Scouting Robots Using Internal Databases. J. Sens. 2019, 2019, 5219471. [Google Scholar] [CrossRef]
- Boissard, P.; Martin, V.; Moisan, S. A cognitive vision approach to early pest detection in greenhouse crops. Comput. Electron. Agric. 2008, 62, 81–93. [Google Scholar] [CrossRef]
- Bodhe, T.S.; Mukherji, P. Selection of color space for image segmentation in pest detection. In Proceedings of the International Conference on Advances in Technology and Engineering, Mumbai, India, 23–25 January 2015. [Google Scholar]
- Ghods, S.; Shojaeddini, V. A novel automated image analysis method for counting the population of whiteflies on leaves of crops. J. Crop. Prot. 2015, 5, 59–73. [Google Scholar] [CrossRef]
- Parsons, L.; Ross, R.; Robert, K. A survey on wireless sensor network technologies in pest management applications. SN Appl. Sci. 2020, 2, 28. [Google Scholar] [CrossRef]
- Pang, H.; Zheng, Z.; Zhen, T.; Sharma, A. Smart Farming: An Approach for Disease Detection Implementing IoT and Image Processing. Int. J. Agr. Environ. Inf. Sys. IJAEIS 2021, 12, 55–67. [Google Scholar] [CrossRef]
- Ren, S.; He, K.; Girshick, R.; Sun, J. Faster R-CNN: Towards real-time object detection with region proposal networks. Adv. Neural Inf. Process Syst. 2015, 28, 91–99. [Google Scholar] [CrossRef]
- Diller, Y.; Shamsian, A.; Shaked, B.; Altman, Y.; Danziger, B.C.; Manrakhan, A.; Serfontein, L.; Bali, E.; Wernicke, M.; Egartner, A.; et al. A real-time remote surveillance system for fruit flies of economic importance: Sensitivity and image analysis. J. Pest Sci. 2023, 96, 611–622. [Google Scholar] [CrossRef]
- Sørensen, L.Y.; Jacobsen, L.T.; Hansen, J.P. Low Cost and Flexible UAV Deployment of Sensors. Sensors 2017, 17, 154. [Google Scholar] [CrossRef]
- Arroyo, P.; Herrero, J.L.; Lozano, J.; Montero, P. Integrating LoRa-Based Communications into Unmanned Aerial Vehicles for Data Acquisition from Terrestrial Beacons. Electronics 2022, 11, 1865. [Google Scholar] [CrossRef]
- Nguyen, M.T.; Nguyen, C.V.; Do, H.T.; Hua, H.T.; Tran, T.A.; Nguyen, A.D.; Ala, G.; Viola, F. UAV-Assisted Data Collection in Wireless Sensor Networks: A Comprehensive Survey. Electronics 2021, 10, 2603. [Google Scholar] [CrossRef]
- Al-Megren, S.; Kurdi, H.; Aldaood, M.F. A Multi-UAV Task Allocation Algorithm Combatting Red Palm Weevil Infestation. Procedia Comput. Sci. 2018, 141, 88–95. [Google Scholar] [CrossRef]
- Cao, H.; Liu, Y.; Yue, X.; Zhu, W. Cloud-assisted UAV data collection for multiple emerging events in distributed WSNs. Sensors 2017, 17, 1818. [Google Scholar] [CrossRef] [PubMed]
- Dong, M.; Ota, K.; Lin, M.; Tang, W.; Du, S.; Zhu, H. UAV-assisted data gathering in wireless sensor networks. J. Supercomput. 2014, 70, 1142–1155. [Google Scholar] [CrossRef]
- Deng, F.; Zuo, P.; Wen, K.; Wu, X. Novel soil environment monitoring system based on RFID sensor and LoRa. Comput. Electron. Agric. 2020, 169, 105169. [Google Scholar] [CrossRef]
- Saraereh, O.A.; Alsaraira, A.; Khan, I.; Uthansakul, P. Performance Evaluation of UAV-Enabled LoRa Networks for Disaster Management Applications. Sensors 2020, 20, 2396. [Google Scholar] [CrossRef]
- Bouhamed, O.; Ghazzai, H.; Besbes, H.; Massoud, Y. A UAV-Assisted Data Collection for Wireless Sensor Networks: Autonomous Navigation and Scheduling. IEEE Access 2020, 8, 110446–110460. [Google Scholar] [CrossRef]
- Liu, S.; Wei, Z.; Guo, Z.; Yuan, X.; Feng, Z. Performance Analysis of UAVs Assisted Data Collection in Wireless Sensor Network. In Proceedings of the 2018 IEEE 87th Vehicular Technology Conference (VTC Spring), Porto, Portugal, 3–6 June 2018; pp. 1–5. [Google Scholar]
- Chandrashekar, K.; Dekhordi, M.R.; Baras, J.S. Providing full connectivity in large ad-hoc networks by dynamic placement of aerial platforms. In Proceedings of the IEEE MILCOM 2004 Military Communications Conference, Monterey, CA, USA, 31 October–3 November 2004; Volume 3, pp. 1429–1436. [Google Scholar]
- Lasa, R.; Toxtega, Y.; Herrera, F.; Cruz, A.; Navarrete, M.A.; Antonio, S. Inexpensive traps for use in mass trapping Anastrepha ludens (Diptera: Tephritidae). Fla. Entomol. 2014, 97, 1123–1130. [Google Scholar] [CrossRef]
- Selby, R.D.; Gage, S.; Whalon, M. Precise and Low-Cost Monitoring of Plum Curculio (Coleoptera: Curculionidae) Pest Activity in Pyramid Traps with Cameras. Environ. Entomol. 2014, 43, 421–431. [Google Scholar] [CrossRef]
- Balde, A.Y.; Bergeret, E.; Cajal, D.; Toumazet, J.P. Low Power Environmental Image Sensors for Remote Photogrammetry. Sensors 2022, 22, 7617. [Google Scholar] [CrossRef]
- Dietz, H.; Abney, D.; Eberhart, P.; Santini, N.; Davis, W.; Wilson, E.; McKenzie, M. ESP32-Cam as a programmable camera research platform. Imaging 2022, 232, 2. [Google Scholar] [CrossRef]
- Eliopoulos, P.; Tatlas, N.A.; Rigakis, I.; Potamitis, I. A Smart Trap Device for Detection of Crawling Insects and Other Arthropods in Urban Environments. Electronics 2018, 7, 161. [Google Scholar] [CrossRef]
- Vieira, G.S.; Fonseca, A.U.; Rocha, B.M.; Sousa, N.M.; Ferreira, J.C.; Felix, J.P.; Lima, J.C.; Soares, F. Insect Predation Estimate Using Binary Leaf Models and Image-Matching Shapes. Agronomy 2022, 12, 2769. [Google Scholar] [CrossRef]
- Piccardi, M. Background subtraction techniques: A review. In Proceedings of the 2004 IEEE International Conference on Systems, Man and Cybernetics, The Hague, The Netherlands, 10–13 October 2004; Volume 4, pp. 3099–3104. [Google Scholar]
- Sun, Y.; Cheng, H.; Cheng, Q.; Zhou, H.; Li, M.; Fan, Y.; Shan, J.; Damerow, L.; Lammers, P.S.; Jonesd, S.B. A smart-vision algorithm for counting whiteflies and thrips on sticky traps using two-dimensional Fourier transform spectrum. Comput. Digit. Eng. 2017, 153, 82–88. [Google Scholar] [CrossRef]
- Zhu, C.; Wang, J.; Liu, H.; Mi, H. Insect Identification and Counting in Stored Grain: Image Processing Approach and Application Embedded in Smartphones. Mob. Inf. Syst. 2018, 2018, 5491706. [Google Scholar] [CrossRef]
- Cerruto, E.; Manetto, G.; Privitera, S.; Papa, R.; Longo, D. Effect of Image Segmentation Thresholding on Droplet Size Measurement. Agronomy 2022, 12, 1677. [Google Scholar] [CrossRef]
- Miranda, J.L.; Gerardo, B.D.; Tanguilig, B.T. Pest detection and extraction using image processing techniques. Int J Comput Commun. Eng. 2014, 3, 189–192. [Google Scholar] [CrossRef]
- Cui, S. DeutJ: An ImageJ plugin for improved automatic masking and segmentation of images from confocal microscopy. J. Bioinform. Seq. Anal. 2023, 13, 1–5. [Google Scholar]
- Levin, E.A.; Morgan, R.M.; Griffin, L.D.; Jones, V.J. A Comparison of Thresholding Methods for Forensic Reconstruction Studies Using Fluorescent Powder Proxies for Trace Materials. J. Forensic Sci. 2019, 64, 431–442. [Google Scholar] [CrossRef]
- Aarif, L.; Tabaa, M.; Hachimi, H. Experimental test and performance of RSSI-based indoor localization in LoRa Networks. Procedia Comput. Sci. 2022, 203, 420–425. [Google Scholar] [CrossRef]
- Yim, D.; Chung, J.; Cho, Y.; Song, H.; Jin, D.; Kim, S.; Ko, S.; Smith, A.; Riegsecker, A. An Experimental LoRa Performance Evaluation in Tree Farm. In Proceedings of the 2018 IEEE Sensors Applications Symposium (SAS), Seoul, Republic of Korea, 12–14 March 2018. [Google Scholar]
- Wiyadi, E.; Setiadi, R.; Umar, L. Effect of Vegetation Profile and Air Data Rate on Packet Loss Performance of LoRa E32-30dBm 433 MHz as a Wireless Data Transmission. J. Phys. 2020, 1655, 012015. [Google Scholar] [CrossRef]
- Kodali, R.K.; Borra, K.Y.; Sharan Sai, G.N.; Domma, H.J. An IoT Based Smart Parking System Using LoRa. In Proceedings of the 2018 International Conference on Cyber-Enabled Distributed Computing and Knowledge Discovery, CyberC, Zhengzhou, China, 18–20 October 2018; pp. 151–154. [Google Scholar]
- Rivera Guzmán, E.F.; Mañay Chochos, E.D.; Chiliquinga Malliquinga, M.D.; Baldeón Egas, P.F.; Toasa Guachi, R.M. LoRa Network-Based System for Monitoring the Agricultural Sector in Andean Areas: Case Study Ecuador. Sensors 2022, 22, 6743. [Google Scholar] [CrossRef] [PubMed]
- Sharma, D.; Verma, S.; Sharma, K. Network topologies in wireless sensor networks:A review. Int. J. Electron. Commun. Technol. 2013, 4, 93–97. [Google Scholar]
- Chen, T. Implementing Efficient and Multi-Hop Image Acquisition in Remote Monitoring IoT Systems Using LoRa Technology. Master’s Thesis, University of Saskatchewan, Saskatoon, SK, Canada, 2019. [Google Scholar]
- Neupane, K.; Baysal-Gurel, F. Automatic Identification and Monitoring of Plant Diseases Using Unmanned Aerial Vehicles: A Review. Remote Sens. 2021, 13, 3841. [Google Scholar] [CrossRef]
- Yuan, W.; Hua, W.; Heinemann, P.H.; He, L. UAV Photogrammetry-Based Apple Orchard Blossom Density Estimation and Mapping. Horticulturae 2023, 9, 266. [Google Scholar] [CrossRef]
- Tian, H.; Mo, Z.; Ma, C.; Xiao, J.; Jia, R.; Lan, Y.; Zhang, Y. or UAV spraying in orchards based on improved ant colony algorithm. Front Plant Sci. 2023, 14, 1101828. [Google Scholar] [CrossRef]
- Rodríguez-Rodríguez, S.; González-Hernández, H.; Rodríguez-Leyva, E.; Lomelí-Flores, R.; Miranda-Salcedo, M. Species Diversity and Population Dynamics of Fruit Flies (Diptera: Tephritidae) in Guerrero, Mexico. Fla. Entomol. 2018, 101, 113–118. [Google Scholar] [CrossRef]
- Davoli, L.; Pagliari, E.; Ferrari, G. Hybrid LoRa-IEEE 802.11s Opportunistic Mesh Networking for Flexible UAV Swarming. Drones 2021, 5, 26. [Google Scholar] [CrossRef]
- Fedullo, T.; Morato, A.; Peserico, G.; Trevisan, L.; Tramarin, F.; Vitturi, S.; Rovati, L. An IoT Measurement System Based on LoRaWAN for Additive Manufacturing. Sensors 2022, 22, 5466. [Google Scholar] [CrossRef]
- Guimarães, S.A.; Coelho Michel, H. IIoT Architecture Using LoRa Technology, LoRaWAN and OPC UA Protocols. In Proceedings of the International Conference on Industrial Engineering and Operations Management, Sao Paulo, Brazil, 5–8 April 2021. [Google Scholar]
- Martinez-Caro, J.; Cano, M. IoT System Integrating Unmanned Aerial Vehicles and LoRa Technology: A Performance Evaluation Study. Wirel. Commun. Mob. Comput. 2019, 2019, 4307925. [Google Scholar] [CrossRef]
- Bota, L.D.; Fabião, B.G.; Virgilio, M.; Mwatawala, M.; Canhanga, L.; Cugala, D.R.; De Meyer, M. Seasonal abundance of fruit flies (Diptera: Tephritidae) on mango orchard and its relation with biotic and abiotic factors in Manica Province, Mozambique. Fruits 2018, 73, 218–227. [Google Scholar] [CrossRef]
- Perea-Castellanos, C.; Pérez-Staples, D.; Liedo, P.; Díaz-Fleischer, F. Escape of Mexican fruit flies from traps baited with CeraTrap and effect of lure feeding on reproduction and survival. J. Econ. Entomol. 2015, 108, 1720–1727. [Google Scholar] [CrossRef] [PubMed]
- Plá, I.; García de Oteyza, J.; Tur, C.; Martínez, M.Á.; Laurín, M.C.; Alonso, E.; Martínez, M.; Martín, Á.; Sanchis, R.; Navarro, M.C.; et al. Sterile Insect Technique Programme against Mediterranean Fruit Fly in the Valencian Community (Spain). Insects 2021, 12, 415. [Google Scholar] [CrossRef]
- Susanto, A.; Dwi Yuliastari, P.; Ferliansyah, K.; Hersanti; Widiantini, F.; Maelani, S.; Permana, A. The Abundance of Fruit Flies (Bactrocera spp.) On Some Varieties of Mango from Three Selling Sources. Int. J. Fruit Sci. 2022, 22, 110–120. [Google Scholar] [CrossRef]
- Bilal, H.; Sanaullah, S.S.; Syed, M.; Ahmed Nawaz, M.; Sharif, U.; Fatima, M.; Raza, H.; Raza, A. Automated Identification and Monitoring of Fruit Fly. Curr. Rese. Agri. Far. 2021, 2, 41–44. [Google Scholar] [CrossRef]
- She, J.; Zhan, W.; Hong, S.; Min, C.; Dong, T.; Huang, H.; He, Z. A method for automatic real-time detection and counting of fruit fly pests in orchards by trap bottles via convolutional neural network with attention mechanism added. Ecol. Inform. 2022, 70, 101690. [Google Scholar] [CrossRef]
- Moraes, F.S.; Nava, D.E.; Rosa, V.S. Optoacoustic intelligent sensor for real-time detection of fruit flies in McPhail traps. In Proceedings of the 3rd International Symposium on Instrumentation Systems, Circuits and Transducers (INSCIT), Bento Goncalves, Brazil, 27–31 August 2018. [Google Scholar]
- Meribout, M.; Baobaid, A.; Khaoua, M.O.; Tiwari, V.K.; Pena, J.P. State of Art IoT and Edge Embedded Systems for Real-Time Machine Vision Applications. IEEE Access 2022, 10, 58287–58301. [Google Scholar] [CrossRef]
- Michalak, H.; Okarma, K. Robust Combined Binarization Method of Non-Uniformly Illuminated Document Images for Alphanumerical Character Recognition. Sensors 2020, 20, 2914. [Google Scholar] [CrossRef]
- Panda, P.R.; Catthoor, F.; Dutt, N.D.; Danckaert, K.; Brockmeyer, E.; Kulkarni, C.; Vandercappelle, A.; Kjeldsberg, P.G. Data and memory optimization techniques for embedded systems. ACM Trans. Design Automat. Electron. Syst. 2001, 6, 149–206. [Google Scholar] [CrossRef]
- Liu, J.; Bouganis, C.; Cheung, P.Y. Context-based image acquisition from memory in digital systems. J. Real-Time Image Proc 2019, 16, 1057–1076. [Google Scholar] [CrossRef]
- Senthilkumaran, N.; Vaithegi, S. Image segmentation by using thresholding techniques for medical images. Comput. Sci. Eng. Int. J. CSEIJ 2016, 6, 1–13. [Google Scholar]
- Harwahyu, R.; Presekal, A.; Sari, R. LoRaWAN Performance Evaluation with Optimized Configuration. Int. J. Future Gener. Commun. Netw. 2018, 11, 51–68. [Google Scholar] [CrossRef]
- Rajab, H.; Cinkler, T.; Bouguera, T. IoT scheduling for higher throughput and lower transmission power. Wirel. Netw. 2021, 27, 1701–1714. [Google Scholar] [CrossRef]
- Behjati, M.; Mohd Noh, A.B.; Alobaidy, H.A.H.; Zulkifley, M.A.; Nordin, R.; Abdullah, N.F. LoRa Communications as an Enabler for Internet of Drones towards Large-Scale Livestock Monitoring in Rural Farms. Sensors 2021, 21, 504. [Google Scholar] [CrossRef]
- Richardson, A.M.; Sowah, R.A.; Melià-Seguí, J.; Katsriku, F.A.; Vilajosana, X.; Owusu Banahene, W. Characterising foliage influence on LoRaWAN pathloss in a tropical vegetative environment. IET Wirel. Sens. Syst. 2020, 10, 198–207. [Google Scholar] [CrossRef]
- Avila-Campos, P.; Astudillo-Salinas, F.; Rodas, A.V.; Araujo, A. Evaluation of LoRaWAN Transmission Range for Wireless Sensor Networks in Riparian Forests. In Proceedings of the 22nd International ACM Conference on Modeling, Analysis and Simulation of Wireless and Mobile Systems, Miami Beach, FL, USA, 25–29 November 2019. [Google Scholar]
- Khawaja, W.; Guvenc, I.; Matolak, D.W.; Fiebig, U.-C.; Schneckenburger, N. A Survey of Air-to-Ground Propagation Channel Modeling for Unmanned Aerial Vehicles. IEEE Commun. Surv. Tutor. 2019, 21, 2361–2391. [Google Scholar] [CrossRef]
- Zhou, M.; Zhou, Z.; Liu, L.; Huang, J.; Lv, Z. Review of vertical take-off and landing fixed-wing UAV and its application prospect in precision agriculture. Int. J. Precis. Agric. Aviat. 2018, 1, 8–17. [Google Scholar] [CrossRef]
- Chen, J.; Tang, J. UAVo-assisted data collection for wireless sensor networks with dynamic working m des. Digit. Commun. Netw. 2022, in press.
Disclaimer/Publisher’s Note: The statements, opinions and data contained in all publications are solely those of the individual author(s) and contributor(s) and not of MDPI and/or the editor(s). MDPI and/or the editor(s) disclaim responsibility for any injury to people or property resulting from any ideas, methods, instructions or products referred to in the content. |
© 2023 by the authors. Licensee MDPI, Basel, Switzerland. This article is an open access article distributed under the terms and conditions of the Creative Commons Attribution (CC BY) license (https://creativecommons.org/licenses/by/4.0/).