Article

New Insights into the Enhancement Effect of Exogenous Calcium on Biochar Stability during Its Aging in Farmland Soil

1
School of Chemical Engineering, Zhengzhou University, Zhengzhou 450001, China
2
School of Environmental Science and Engineering, Shanghai Jiao Tong University, Shanghai 200240, China
3
Hydrology and Water Resources Survey Bureau of the Upper Reaches of the Yangtze River, Hydrology Bureau of Yangtze River Water Resources Commission, Chongqing 400010, China
4
Shanghai Investigation, Design & Research Institute Co., Ltd., Shanghai 200050, China
5
China–UK Low Carbon College, Shanghai Jiao Tong University, Shanghai 201306, China
6
School of Environment and Architecture, University of Shanghai for Science and Technology, Shanghai 200093, China
*
Author to whom correspondence should be addressed.
Agronomy 2023, 13(7), 1676; https://doi.org/10.3390/agronomy13071676
Submission received: 24 May 2023 / Revised: 12 June 2023 / Accepted: 21 June 2023 / Published: 22 June 2023

Abstract

:
Converting biowaste into biochar and incorporating it into soil is recognized as an effective method for carbon (C) sequestration. However, biochar inevitably undergoes an aging process in soil, which influences its stability, and ultimately threatens its carbon sequestration ability. This study selected CaCl2 as an exogenous additive of sewage sludge and bone dreg for producing Ca-rich biochars, and both surface C and bulk C stability in them were investigated under three aging processes (dry–wet aging, freeze–thaw aging, and natural aging in farmland soil). The results showed that the above three aging processes resulted in oxidized surface C in Ca-rich biochar decreasing by 10~23%, 28~41%, and 0~74%, respectively, compared with that in pristine biochar, while oxidized bulk C decreased by 6~10%, 0~1%, and 0~35%, respectively. This was attributed to the “protective effect” of Ca-containing crystals on the biochar surface, including CaO, Ca5(PO4)3Cl, Ca5(PO4)3(OH), Ca8H2(PO4)6·H2O, and Ca10(PO4)6(OH)2, which intervened in the oxidation of C–C/C=C in biochar but also reduced the generation of a fragmented C structure. By comprehensively assessing surface C and bulk C stability under three aging processes, final C sequestration in Ca-rich biochar increased to 27~80%, compared to that in pristine biochar (23~74%). Therefore, Ca-rich biochar is more dominant than pristine biochar, considering C sequestration potential during long-term aging in soil.

1. Introduction

Following the 26th United Nations Climate Conference in 2021, the G20 Summit in 2022 proposed the goal of “the rise of global temperature being limited to 1.5 °C” again, which requires the world to cut down carbon emissions by 40% by 2030. Biochar is a carbon-rich material generated from biowaste under an O2-limited and heating condition [1,2], and its application in soil can reduce CO2 emissions to the atmosphere during the global carbon cycle [3,4]. Biochar technology has been recognized as a promising approach to achieve long-term carbon sequestration [5]. However, due to the differences in feedstock and the pyrolysis technology of biochar, some biochar can be retained in soil for thousands of years and others only for decades [6,7], which is closely related to biochar stability [8,9,10]. For instance, Nguyen et al. [8] studied the 100-year change in biochar in soil and found that the oxidation process of unstable carbon in biochar resulted in carbon loss. Therefore, considering the improvement in biochar stability by regulating its formation during pyrolysis is of great significance for achieving the carbon sequestration and emission reduction capacity of biochar.
Many previous studies have focused on the effects of feedstock type and pyrolysis conditions on biochar stability [11,12,13,14,15]. Feedstock compositions and contents are the decisive factor affecting biochar stability. The stability of biochar derived from ash-rich feedstock was higher than that derived from ash-poor feedstock, which should be attributed to the encapsulation effect of ash on carbon [16]. Liu et al. [17] compared the stability of pig manure biochar with high ash content and rice straw biochar with low ash content, and found that the C stability in the former was higher than that in the latter. Meanwhile, the differences in the main carbon components in feedstock, including cellulose, hemicellulose, and lignin, also affect the stability of biochar. A higher lignin content in feedstock commonly led to a higher content of aromatic C in biochar and higher biochar stability [18]. Additionally, pyrolysis temperature has a significant role in determining the structure of biochar, thus influencing its stability. Usually, biochar produced at a high temperature has stronger stability than that produced at a low temperature, which can be attributed to the high temperature increasing aromaticity and inducing the formation of a condensed graphitic structure in biochar [19]. For example, a previous study reported that the unstable carbon in Silphium perfoliatum L. biochar decreased from 83.1% to 18.6% with increases in the pyrolysis temperature from 350 °C to 750 °C [20]. Chen et al. [21] also observed that with an increasing pyrolysis temperature, the stability of biochar evaluated by K2Cr2O7 was increased, and presented a positive correlation with its aromatization degree. The above studies indicate that biochar stability can be improved by selecting some specific types of feedstock or by elevating the pyrolysis temperature of biochar. However, the selectivity of feedstock limits the universality of biochar, while a high pyrolysis temperature increases energy consumption during the production of biochar.
In recent years, many researchers have found that some modification/activation methods, including physical activation (e.g., steam activation and CO2 activation) [22], chemical activation such as acid/alkaline/oxidants pretreatment [23,24,25], and thermal activation [26], could significantly affect C stability in biochar. Although the booming development of these modification/activation methods of biochar is beneficial for improving C stability, it also often brings high costs and secondary pollution problems caused by acid/alkaline/oxidants. Therefore, some mild mineral salts (K, Na, Ca, Mg, Fe, Al, P, Si, etc.) used in the preparation of modified biochar have gradually come to the attention of more and more researchers [27,28,29,30]. They pointed out that adding exogenous mineral salts in feedstock before pyrolysis could improve C stability by changing the composition and structure of biochar. On the one hand, these minerals generated new crystals and wrapped on the surface of the carbon skeleton during pyrolysis, and they served as physical barriers to inhibit the oxidation of biochar. Our previous study reported that by adding minerals K, Na, Ca, and Mg into biowaste, abundant mineral crystals, including KCl, NaCl, CaCl2, CaCO3, MgO, and MgO3(CO3)2, appeared on the surface of biochar. These crystals not only prevented the release of small molecules containing carbon during pyrolysis, but also prevented O2 and microorganisms from entering the interior of biochar, thus enhancing the thermal oxidation resistance and microbial oxidation resistance of biochar [27]. On the other hand, some minerals have also been shown to bond with carbon or carbon-containing groups to form new compounds during pyrolysis, thus increasing the energy required for carbon degradation. For instance, Li et al. [31] found that mineral P could combine with carbon to form a substance similar to C-O-PO3 or (CO)2PO2 during pyrolysis, which was wrapped on the surface of the carbon skeleton and strengthened the oxidation resistance of solid biochar products. Additionally, some minerals can form organometallic complexes with carbon. For example, mineral Si in biowaste interacts with C to generate organometallic C-Si couplings during pyrolysis [32,33], while mineral Fe can generate Fe-O-C organometallic complexes [34], and they are beneficial as they help improve the stability of biochar. However, until now, most of these studies focused on the effect of exogenous minerals on biochar stability during pyrolysis, while there has been a lack of a post-assessment about the influence of exogenous minerals on biochar stability under long-term aging, and rarely has research revealed the underlying mechanisms.
Calcium (Ca), as a ubiquitous mineral in soil, is an environmentally friendly additive with a low price. Many previous studies have confirmed that mineral Ca, including Ca(OH)2, CaCO3, and Ca(H2PO4)2, is an effective additive for improving biochar stability [19,29,31,35]. Meanwhile, a series of studies from our previous study also found that by adding CaCl2 to biowaste, the Ca-rich biochar produced has a higher carbon sequestration capacity [27,36]. This study performs a post-assessment for the carbon stability of Ca-rich biochar during aging in soil based on real application scenarios, which is a continuation of previous studies. Therefore, in this study, CaCl2 was used as exogenous calcium to prepare Ca-rich biochar using two biowastes, sewage sludge and bone dreg, and the effects of exogenous calcium addition on C stability in biochar were investigated by three aging methods: dry–wet alternating, freeze–thaw cycles, and natural farmland soil incubation. A series of experiments were conducted: (1) to investigate the influence mechanism of exogenous Ca on surface C stability in biochar under the above three aging methods; (2) to reveal the influence mechanism of exogenous Ca on bulk C stability in biochar under the above three aging methods; and (3) to evaluate the enhancement effect of exogenous Ca on overall biochar stability based on the results of surface C and bulk C. In this study, the long-term C stability of Ca-rich biochar in farmland soil was studied by simulating its real aging scenario. It provides a promising strategy for strengthening biochar stability by pre-adding mineral Ca in biowaste before pyrolysis, but also provides reliable experimental data for evaluating the long-term C sequestration capacity of biochar in farmland soil at a macro scale.

2. Materials and Methods

2.1. Preparation and Characterization of Pristine Biochar and Ca-Rich Biochar

Sewage sludge (SS) and bone dreg (BD) were selected as the feedstock for producing biochar. SS was collected from the sewage treatment plant, Minhang, Shanghai. BD was purchased from a farmers’ market in Shanghai. The two biowastes were dried at 60 °C in the oven for 24 h. Introducing calcium (Ca) in SS and BD was used to produce Ca-rich biochar. Specifically, 20 g CaCl2 was dissolved in 1.5 L deionized water to prepare a solution, which was then mixed with 50 g biowaste (SS or BD) by wet impregnation method. The mixture was stirred and dried in an oven at 60 °C to remove the whole water. Then two biowastes and corresponding Ca-rich biowastes were ground to small grains with particle size less than 2 mm. The ground biowaste was subjected to the pyrolysis process under N2 atmosphere with a heating rate of 10 °C·min−1 and held at the highest treatment temperature 500 °C for 2 h. The obtained biochar was ground and passed through 0.5 mm size for later experiments. The two pristine biochar and corresponding Ca-rich biochar samples were labelled as SSBC, BDBC, Ca-SSBC, and Ca-BDBC, respectively. The basic physicochemical characteristics of all biochar are shown in Table S1.
The elemental C, N, H, and O contents of biochars were determined using an elemental analyzer (Vario Macro Cube, German Elemental Analysis Systems Inc., Langenselbold, Germany), and the morphological and structural characterization by scanning electron microscope (SEM) (Sirion200, FEI, Portland Oregon, USA). The surface functional groups on biochar were identified by X-ray photoelectron spectroscopy (XPS) (AXIS Ultra DLD, Shimadzu Kratos, Kyoto, Japan). The XPS experiments were performed on a VG Escalab Mark II using Mg-Kα radiation emitted from a double anode at 50 W. Surface crystalline compositions of biochar were collected using an X-ray diffractometer (XRD) (D/max-2200/PC, Rigaku, Tokyo, Japan). Specifically, the dried biochar sample was ground into enough fine particles and spread evenly in the aluminum tank. The sample was scanned by XRD with an alpha ray excited by Cu at incident wavelength of λ= 1.5406 A, scanning speed of 2 deg·min−1, and scanning range of 20°~70°. Data analysis of the XRD results was performed using MDI Jade 6 software.

2.2. Experiments to Simulate the Dry–wet and Freeze–thaw Aging Processes of Biochar

Dry–wet aging and freeze–thaw aging are two common methods to simulate the aging of biochar in real environments [37,38]. All aging experiments were implemented in glass petri dishes (10 cm inner diameter) filled with fresh biochar. Then deionized water was added to make the maximum water holding capacity (WHC) of the biochar reach 100%. Both dry–wet and freeze–thaw aging processes of biochar underwent 25 rounds. Specifically, 15 g biochar was saturated by deionized water at 100% WHC. For each dry–wet round, the biochar samples were incubated under room temperature (25 °C) for 12 h followed by drying at 60 °C in an oven for another 12 h. For each freeze–thaw round, the samples were incubated under room temperature (25 °C) for 12 h followed by freezing at −20 °C in a refrigerator for another 12 h. Each dry–wet or freeze–thaw round was repeated 25 times in total, and samples were collected after 5, 10, 15, and 25 rounds. All samples were freeze-dried and then ground through a 2 mm sieve for the further characterization.

2.3. Measure of Carbon Stability in Biochar

Surface C stability. The surface C stability in biochar was calculated by contrasting the carbon element contents in biochar before and after aging (Equation (1)). In the formula, Cbefore and Cafter are the C contents (%) in biochar before and after aging, respectively, and they were determined using an elemental analyzer (Vario Macro Cube, German Elemental Analysis Systems Inc., Germany).
Oxidized   surface   C   ( % ) = C before C after C before × 100 %
Bulk C stability. The bulk C stability in biochar was assessed via chemical K2Cr2O7 oxidation, which simulated the disintegration of carbon skeleton in a simulative extreme oxidation environment. Specifically, 0.1 g C of biochar was treated in a glass test tube with 40 mL of 0.1 M K2Cr2O7 + 2 M H2SO4 solution at 55 °C for 60 h [21,31]. Results were expressed as the fraction of total C oxidized by K2Cr2O7, which was calculated by the concentration change of K2Cr2O7 before and after the reaction using Equation (2). Finally, the fraction of the oxidized carbon of the total carbon in the biochar was obtained.
2 K 2 Cr 2 O 7 + 3 C + 8 H 2 SO 4 = 2 K 2 SO 4 + Cr 2 ( SO 4 ) 3 + 3 CO 2 + 8 H 2 O

2.4. Experiments to Simulate the Natural Aging Process of Biochar in Different Farmland Soils

The three representative farmland soils of different regions according to geographical distribution from south to north were selected in this study based on the change in pH from acidity to alkalinity, including red soil from Hainan (pH 4.90), yellow soil from Shaanxi (pH 9.10), and paddy soil from Changshu (pH 6.27). The differences in carbon stability after applying pristine biochar and Ca-rich biochar in soil were explored. All farmland soil samples were sampled at a depth of 0~20 cm on the soil surface, air-dried and ground, and then passed through a 2 mm sieve. The basic physical and chemical properties of three farmland soils are shown in Table 1.
The co-culture experiment of biochar and farmland soil was performed in the container that was shaded around. Fifteen treatments were set, including three farmland soils (red soil, yellow soil, and paddy soil) and uniform mixtures from three farmland soils with the addition of four biochar samples (biochar–soil = 10% (w/w)). All treatments were conducted in triplicate. Specifically, 100 g samples from different treatment groups were placed in an opaque beaker wrapped in tin foil, and deionized water was added to make the WHC of the sample reach 70%. Then they were incubated at room temperature (25 °C) for 5 months. During this period, the lost water of the sample was replenished daily according to the weighing method. After 5-month experiments, all treatments were dried and passed through a 2 mm sieve for further characterization. The evaluation methods of surface C and bulk C stability were as above in Section 2.3.

2.5. Statistical Analysis and Quality Control

All experimental data were set up in three parallel tests. The collected data were analyzed using OriginPro 2023 software (10.0.0.154). The statistical analyses were conducted using SPSS 24.0 at the 0.05 probability level, and all experimental data were presented as mean values ± standard deviations (n = 3).

3. Results and Discussion

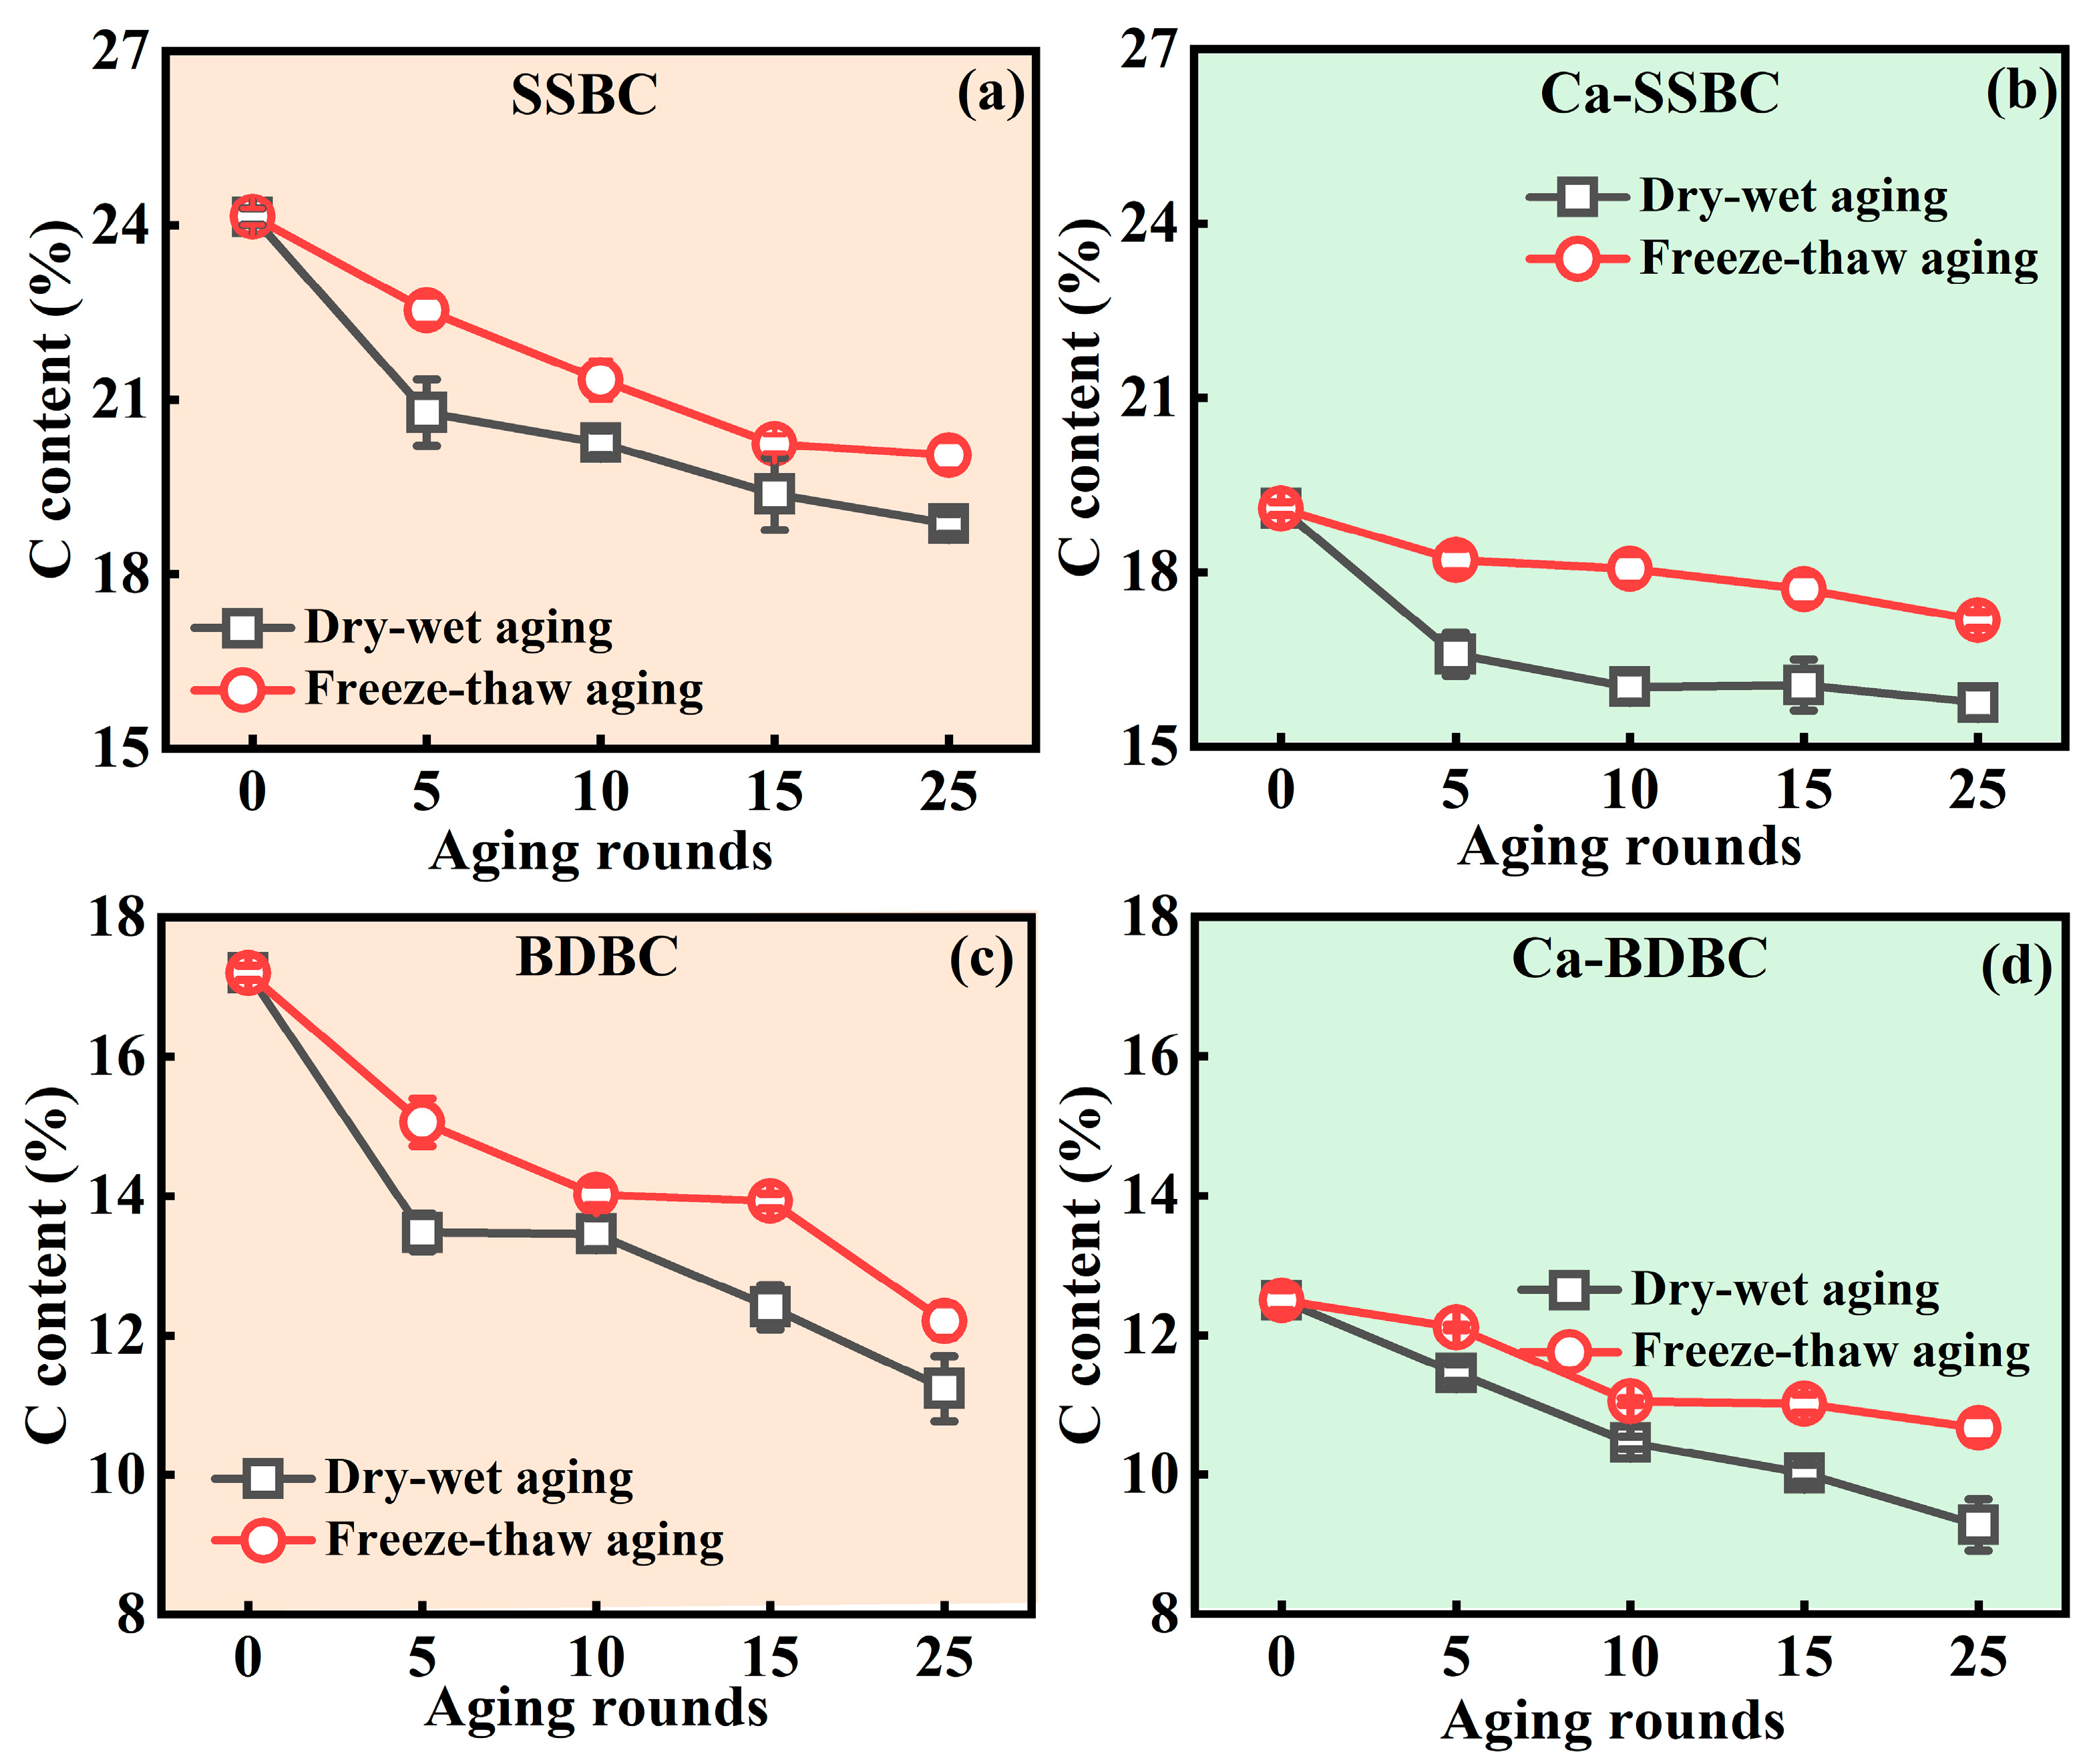
3.1. Exogenous Calcium Served as an “Armor” to Protect C during Biochar Aging

Change in main elements. Figure 1 and Figure S1 show the evolution of C, O, H, and N elements in biochar under the dry–wet and freeze–thaw aging processes. The C contents in SSBC and BDBC were 24.2% and 17.2% (Figure 1a,c), and they decreased continuously with the increase in aging rounds. Ultimately, after 25 dry–wet and freeze–thaw aging rounds, the C contents in SSBC decreased by 21.9% and 17.0%, respectively, and those in BDBC decreased by 34.7% and 29.0%, respectively. The C loss was attributed to the oxidation and decomposition of unstable carbon on the biochar surface [39]. After 25 dry–wet and freeze–thaw aging rounds, for Ca-SSBC, the C contents decreased by 17.5% and 10.1%, respectively, while the C contents in Ca-BDBC decreased by 25.8% and 14.6%, respectively (Figure 1b,d). This implies that exogenous Ca played a “protective” role on biochar, which defended against C loss. The O element contents increased remarkably with biochar aging. As shown in Figure S1a,c, the O contents in SSBC increased by 18.2% and 10.1% after 25 dry–wet and freeze–thaw aging rounds, respectively, while those in BDBC increased by 18.9% and 6.28%, respectively. For Ca-SSBC, the O contents increased by 33.6% and 19.1% after 25 dry–wet and freeze–thaw aging rounds, respectively, while those in Ca-BDBC increased by 27.3% and 6.86%, respectively (Figure S1b,d). Compared to pristine biochar, the addition of Ca could retain more O in biochar. XRD results confirmed that this O existed in the form of various minerals crystals, including CaO, Ca5(PO4)Cl, Ca5(PO4)(OH), Ca8H2(PO4)6·H2O, and Ca10(PO4)6(OH)2 (Figure S2). These crystals could act as a “protective barrier” of biochar, and prevent C loss during aging. In addition, for H and N elements, their contents in pristine and Ca-rich biochar did not change regularly during aging, and fluctuated within a negligible range (Figure S1e–l). Only an obvious decrease in N contents in aged BDBC and Ca-BDBC may be due to the volatilization of small N-containing components [40,41].
Changes in surface composition. The XPS results on the surface C bonding states for both pristine and Ca-rich biochar are shown in Figure S3. The C1s peaks were distinguished into four categories: aliphatic/aromatic peak (C–C/C=C) at 284.6 eV, ester peak (C–O) at 285.7 eV, carbonyl peak (C=O) at 287.0 eV, and carboxyl peak (O=C–O) at 288.7 eV [42,43,44,45,46]. Table 2 shows that 25 dry–wet (freeze–thaw) aging rounds caused the percentages of C–C/C=C (aliphatic/aromatic C) in SSBC and BDBC to decrease by 19% (14%) and 15% (12%), respectively. These lost aliphatic/aromatic C were transformed into O-containing functional groups [47], thus resulting in the obvious increase in C–O, C=O, and O=C–O. Shi et al. [43] also pointed out that the oxidative cleavage of some C–C bonds resulted in the formation of new C–O bonds during biochar aging. Similar to two pristine biochars, dry–wet and freeze–thaw aging treatments also resulted in more C–C/C=C in Ca-rich biochar to be transformed into C–O, C=O, and O=C–O. However, the decrements in C–C/C=C percentages in two pristine biochars were more than those in the corresponding Ca-rich biochar (Table 2), suggesting that the oxidation degree of C in the former was stronger than that in the latter during aging.
Changes in surface morphology. The SEM images of fresh and aged biochar samples are shown in Figure 2. An obvious and regular pore structure appeared in two pristine biochars, especially BDBC. After dry–wet or freeze–thaw aging, the surface smoothness of biochar decreased, and the regular pore structures began to collapse and disintegrate. Even some of the resulting fragments began to block the pores of biochar. The results were consistent with previous studies [47,48]. The evolution of the surface morphology of biochar during aging should be attributed to two aspects. On the one hand, it was caused by the physical disintegration of the biochar structure [9]. Biochar would tend to fracture at relatively low strain under mechanical stress [10,49], while both dry–wet and freeze–thaw aging could provide sufficient conditions for the physical breakdown of biochar [50]. These two aging methods could cause the expansion and shrinkage of graphite sheets in biochar to occur alternately [10], ultimately resulting in the fragmentation of the biochar structure. On the other hand, the chemical oxidation on the biochar surface destroys its structure [42,43]. Unstable carbon on the biochar surface could be oxidized by atmospheric oxygen, which introduces additional O-containing functional groups. Unlike the obvious pore structure in pristine biochar, the smooth coating covered the surface of Ca-rich biochar (Figure 2). After 25 dry–wet or freeze–thaw aging rounds, a crevice structure appeared on the Ca-rich biochar surface. The new structure was like a “web” with several broken holes, which served as a physical barrier to inhibit the oxidation of carbon during Ca-rich biochar aging [27,51,52].

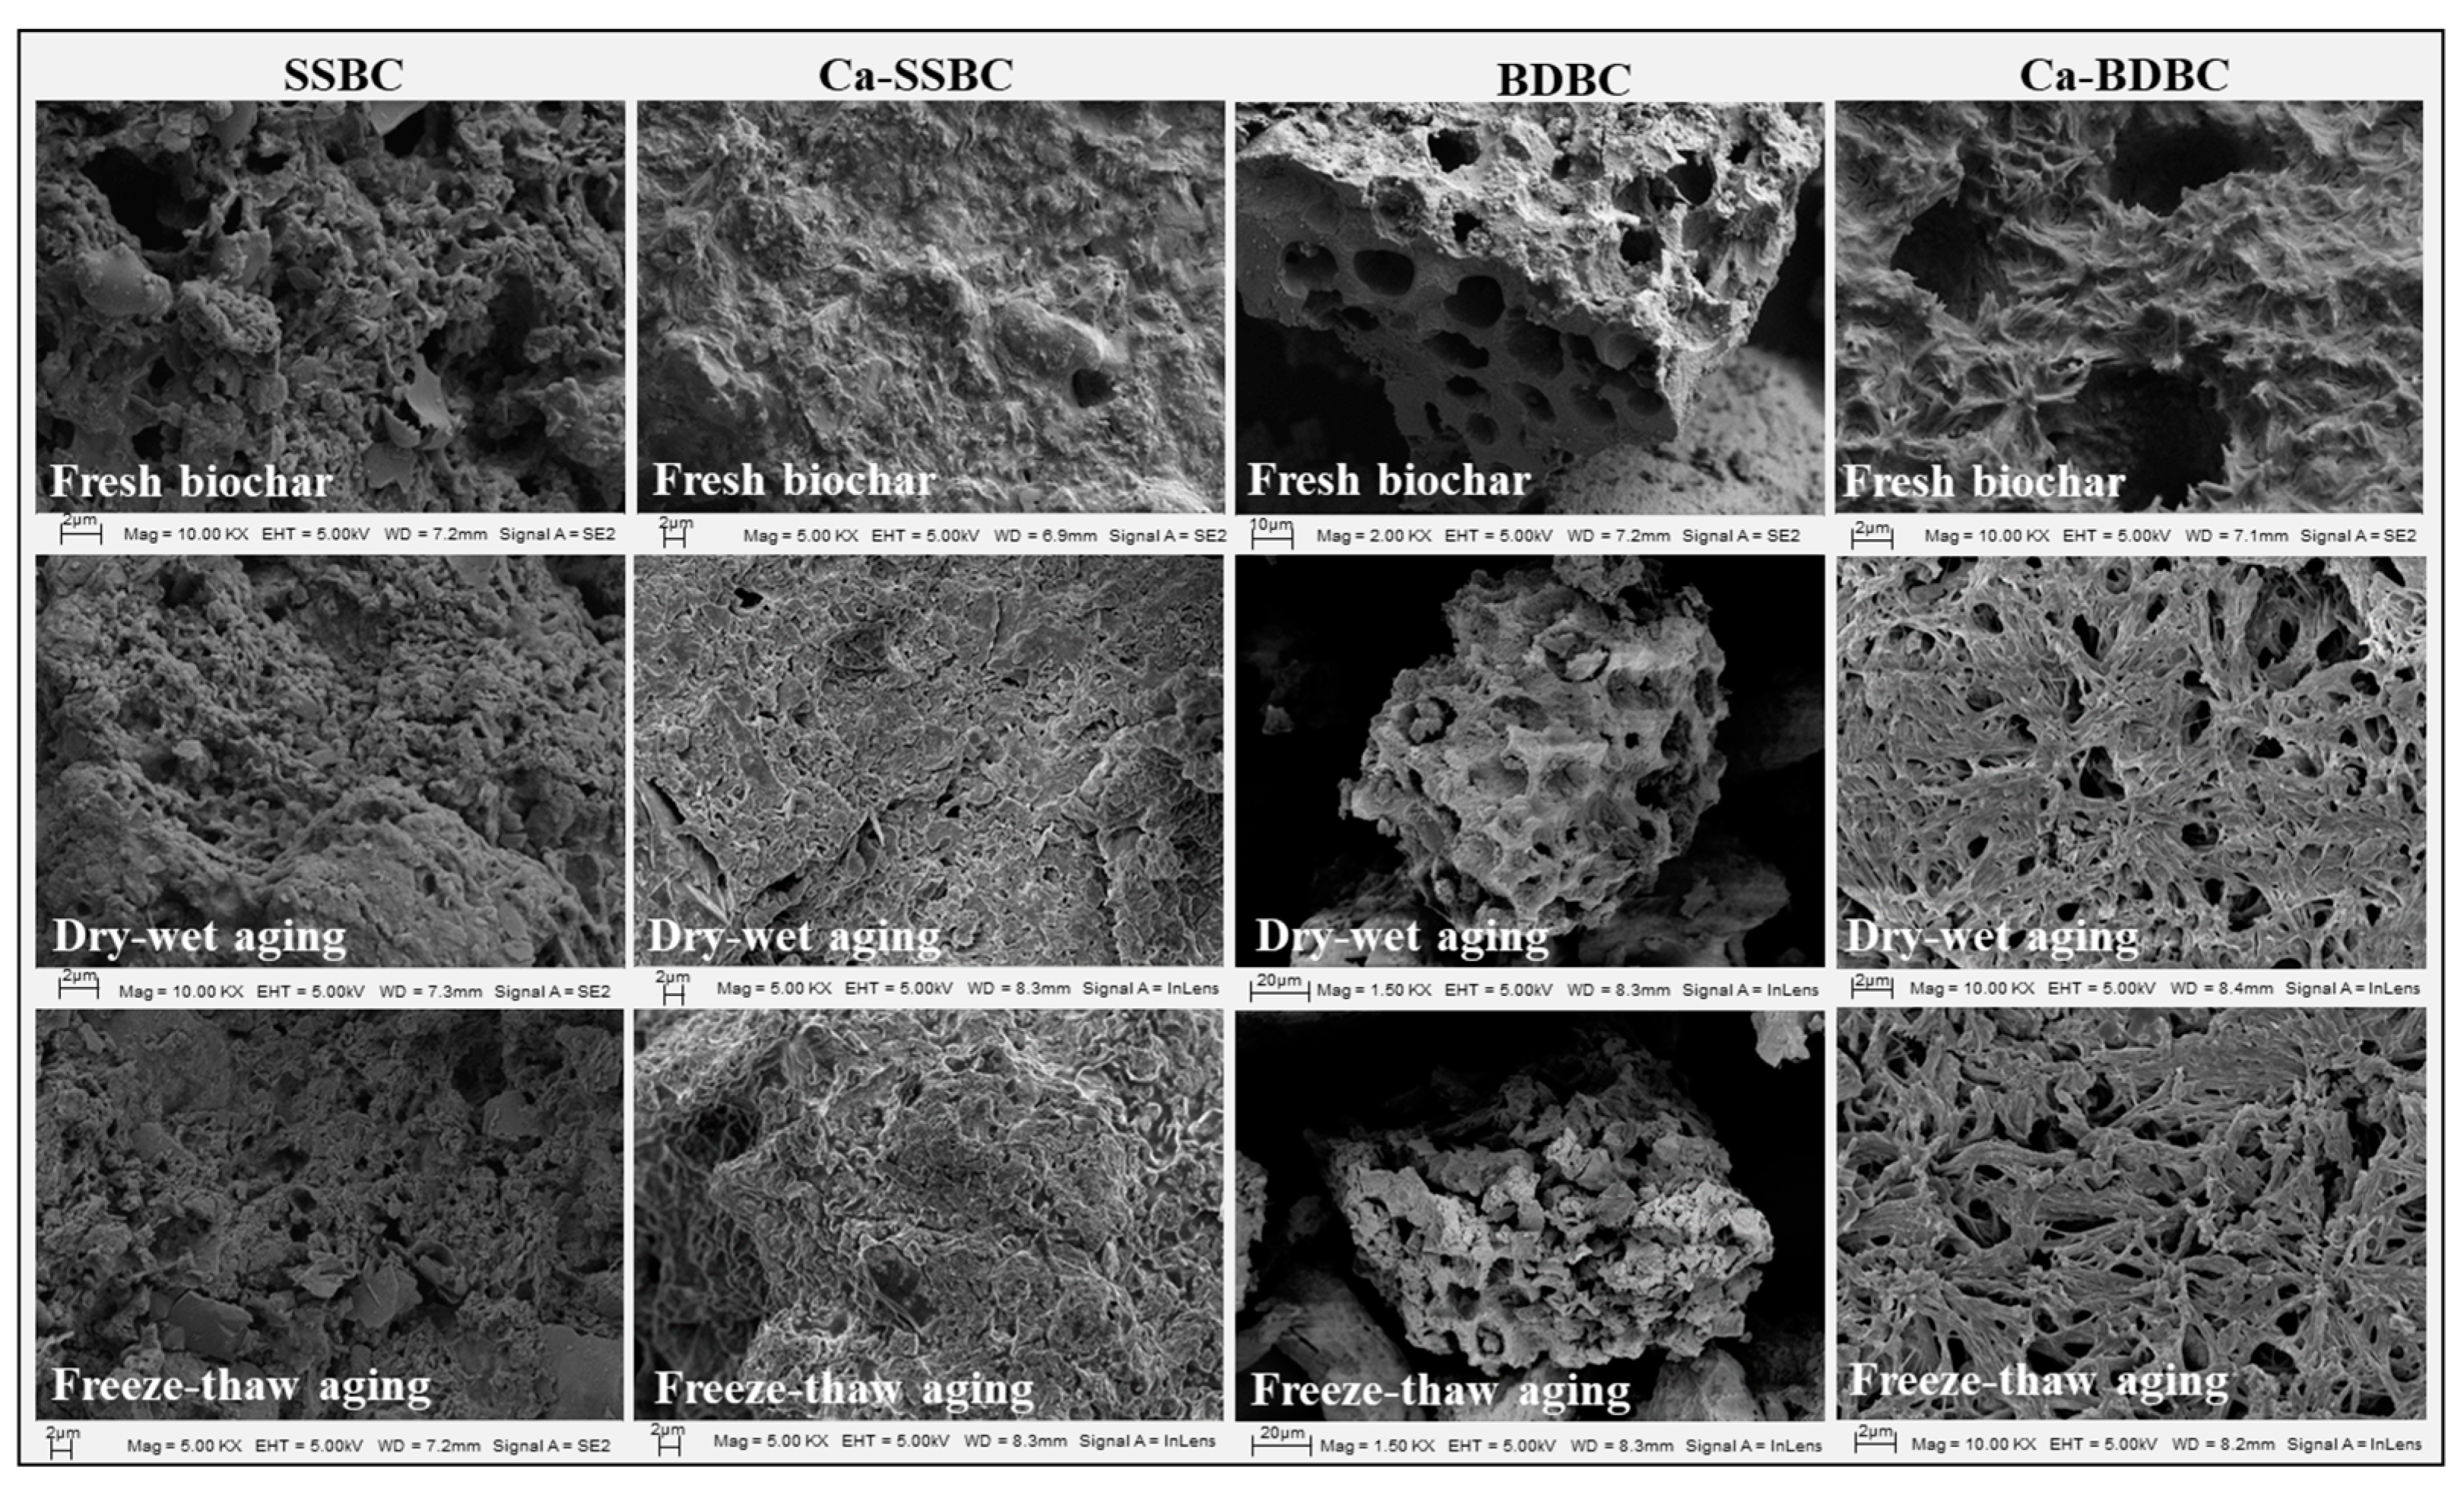
3.2. Exogenous Calcium Enhanced the Surface C Stability in Biochar during Aging Process

Dry–wet aging. Based on Equation (1) (Section 2.2), this study quantified the surface C stability in pristine biochar and Ca-rich biochar during dry–wet aging. As shown in Figure 3a,b, with the increase in aging round, the oxidized surface C in both pristine biochar and Ca-rich biochar increased obviously. In this study, the oxidized surface C in fresh biochar was defined as zero. After 25 dry–wet aging rounds, its contents in SSBC and BDBC increased to 22% and 35%, respectively, while those in Ca-SSBC and Ca-BDBC decreased by 20% and 10% compared with those in SSBC and BDBC, respectively. Dry–wet aging induced the oxidation of surface C by causing the destruction of the C structure in biochar [43]. Usually, dry–wet aging of biochar was accompanied by the absorption–drying–reabsorption process of water on its surface, which could change the sag diameter, crack size, and pore structure of biochar particles, and eventually led to the collapse of biochar structures and the generation of more liberated biochar fragments [10]. These biochar fragments, as fresh exposures, were prone to produce surface mineralization or abiotic oxidization [53,54]. As shown in Figure 2, dry–wet aging resulted in the surfaces of SSBC and BDBC becoming rough, and pore structures began to collapse and disintegrate. Meanwhile, dry–wet aging could destroy the biochar’s composition by chemical reactions. The XPS results showed that the percentages of C=O, O=C–O, and C–O in fresh biochar were lower than those in aged biochar (Figure S3 and Table 2), suggesting that aging resulted in the oxidization of biochar [37]. By contrasting C bond states of pristine biochar and Ca-rich biochar after dry–wet aging (Table 2), the percentages of C=O, O=C–O, and C–O in the former were higher than those in the latter, which corresponded with their surface C stability (Figure 3a,b). This phenomenon should be attributed to the “protective effect” of abundant Ca-containing crystals to the surface C in Ca-rich biochar (Figure S2). These crystals acted as a surface “armor” of Ca-rich biochar to prevent external oxygen from contacting biochar, thus inhibiting the oxidation of surface C. Additionally, the crevice structures, similar to a “web”, appearing on the surfaces of Ca-SSBC and Ca-BDBC very likely served as a physical barrier to inhibit the oxidization of surface C in biochar (Figure 2).
Freeze–thaw aging. Similar to dry–wet aging, the oxidized surface C in pristine biochar and Ca-rich biochar also increased with the increase in freeze–thaw aging rounds. As shown in Figure 3c,d, after 25 freeze–thaw aging rounds, the percentages of oxidized C in SSBC and BDBC increased from zero to 17% and 29%, respectively, while those in Ca-SSBC and Ca-BDBC increased from zero to 10% and 21%, respectively. Obviously, the oxidized surface C contents in biochar caused by freeze–thaw aging were lower than those caused by dry–wet aging (Figure 3a–d). This was due to the difference in the destruction mode and degree of carbon structure caused by the two aging processes. The freeze–thaw aging of biochar was usually accompanied by the expansion–shrinkage–re-expansion process of water in its interior [9,50]. Freezing treatment caused the expansion and embrittlement of the biochar structure and the intergranular and intragranular extrusion of biochar, resulting in the deformation and fragmentation of the biochar structure [55]. The subsequent thaw treatment resulted in the penetration of water into the biochar interior along surface pore or capillary pathways, further rearranging and translocating the biochar fragments [56,57]. Compared with the dry cracking of the biochar structure caused by high temperature, the brittle cracking caused by low temperature produces more mild damage to the C structure in biochar [48]. The XPS results from Table 2 also confirm this phenomenon and demonstrate that the contents of C=O, O=C–O, and C–O in aged biochar with the freeze–thaw treatment were less than those with the dry–wet treatment. Meanwhile, after 25 freeze–thaw aging rounds, the contents of C=O, O=C–O, and C–O in pristine biochar were more than those in the corresponding Ca-rich biochar, suggesting that mineral Ca in Ca-rich biochar also inhibited the oxidization of surface C in biochar during freeze–thaw aging. As with dry–wet aging, an obvious “net” structure was found on the Ca-rich biochar surface after freeze–thaw aging (Figure 2). Therefore, during freeze–thaw aging, the protective effect of mineral Ca on the Ca-rich biochar surface was still the dominant factor in enhancing the surface C stability in biochar.
Natural aging in farmland soil. Unlike the dry–wet and freeze–thaw aging, applying biochar in soil could create the realistic aging scenario, which was of more practical value for measuring the surface C stability in biochar. As shown in Figure 3e,f, the pristine biochar and Ca-rich biochar lost 7~23% C and 6~12% C after undergoing five-months natural aging in three farmland soils, respectively. The C loss should be attributed to three aspects. Firstly, the unstable C on the biochar surface was oxidized by soil components and atmospheric oxygen in the early stage of applying biochar in soil [58,59]. Secondly, biochar released some soluble organic components in soil and participated in the complex redox processes [39,41], resulting in the oxidation of C. Thirdly, the soil environment accelerated the fragmentation of biochar, resulting in the exposure of its active surface and further oxidation [10,49], while it is worth noting that the oxidized surface C contents from two pristine biochars in three soils were obviously more than those of the corresponding Ca-rich biochar (Figure 3e,f). Taking red soil, for example, the oxidized surface C contents in SSBC and BDBC were 23% and 14%, respectively, while in the corresponding Ca-rich biochar, they decreased to 6% and 11%, respectively. Similar results also appeared in yellow soil and paddy soil. Obviously, considering the surface C stability of biochar in soil, Ca-rich biochar was more dominant than pristine biochar. It was inseparable from the action of Ca-containing mineral crystals on the Ca-rich biochar surface (Figure S2), which could isolate biochar with the oxygen, soil microbes, and active enzymes from the soil environment and slow down the oxidization of surface C in biochar during mineralization [60]. Indeed, mineral Ca on the Ca-rich biochar surface could serve as the “bridge” to connect clay mineral particles in soil and organic C in biochar [60], which reinforced the “protective barrier” of biochar, thus resisting the degradation of C in biochar [61].

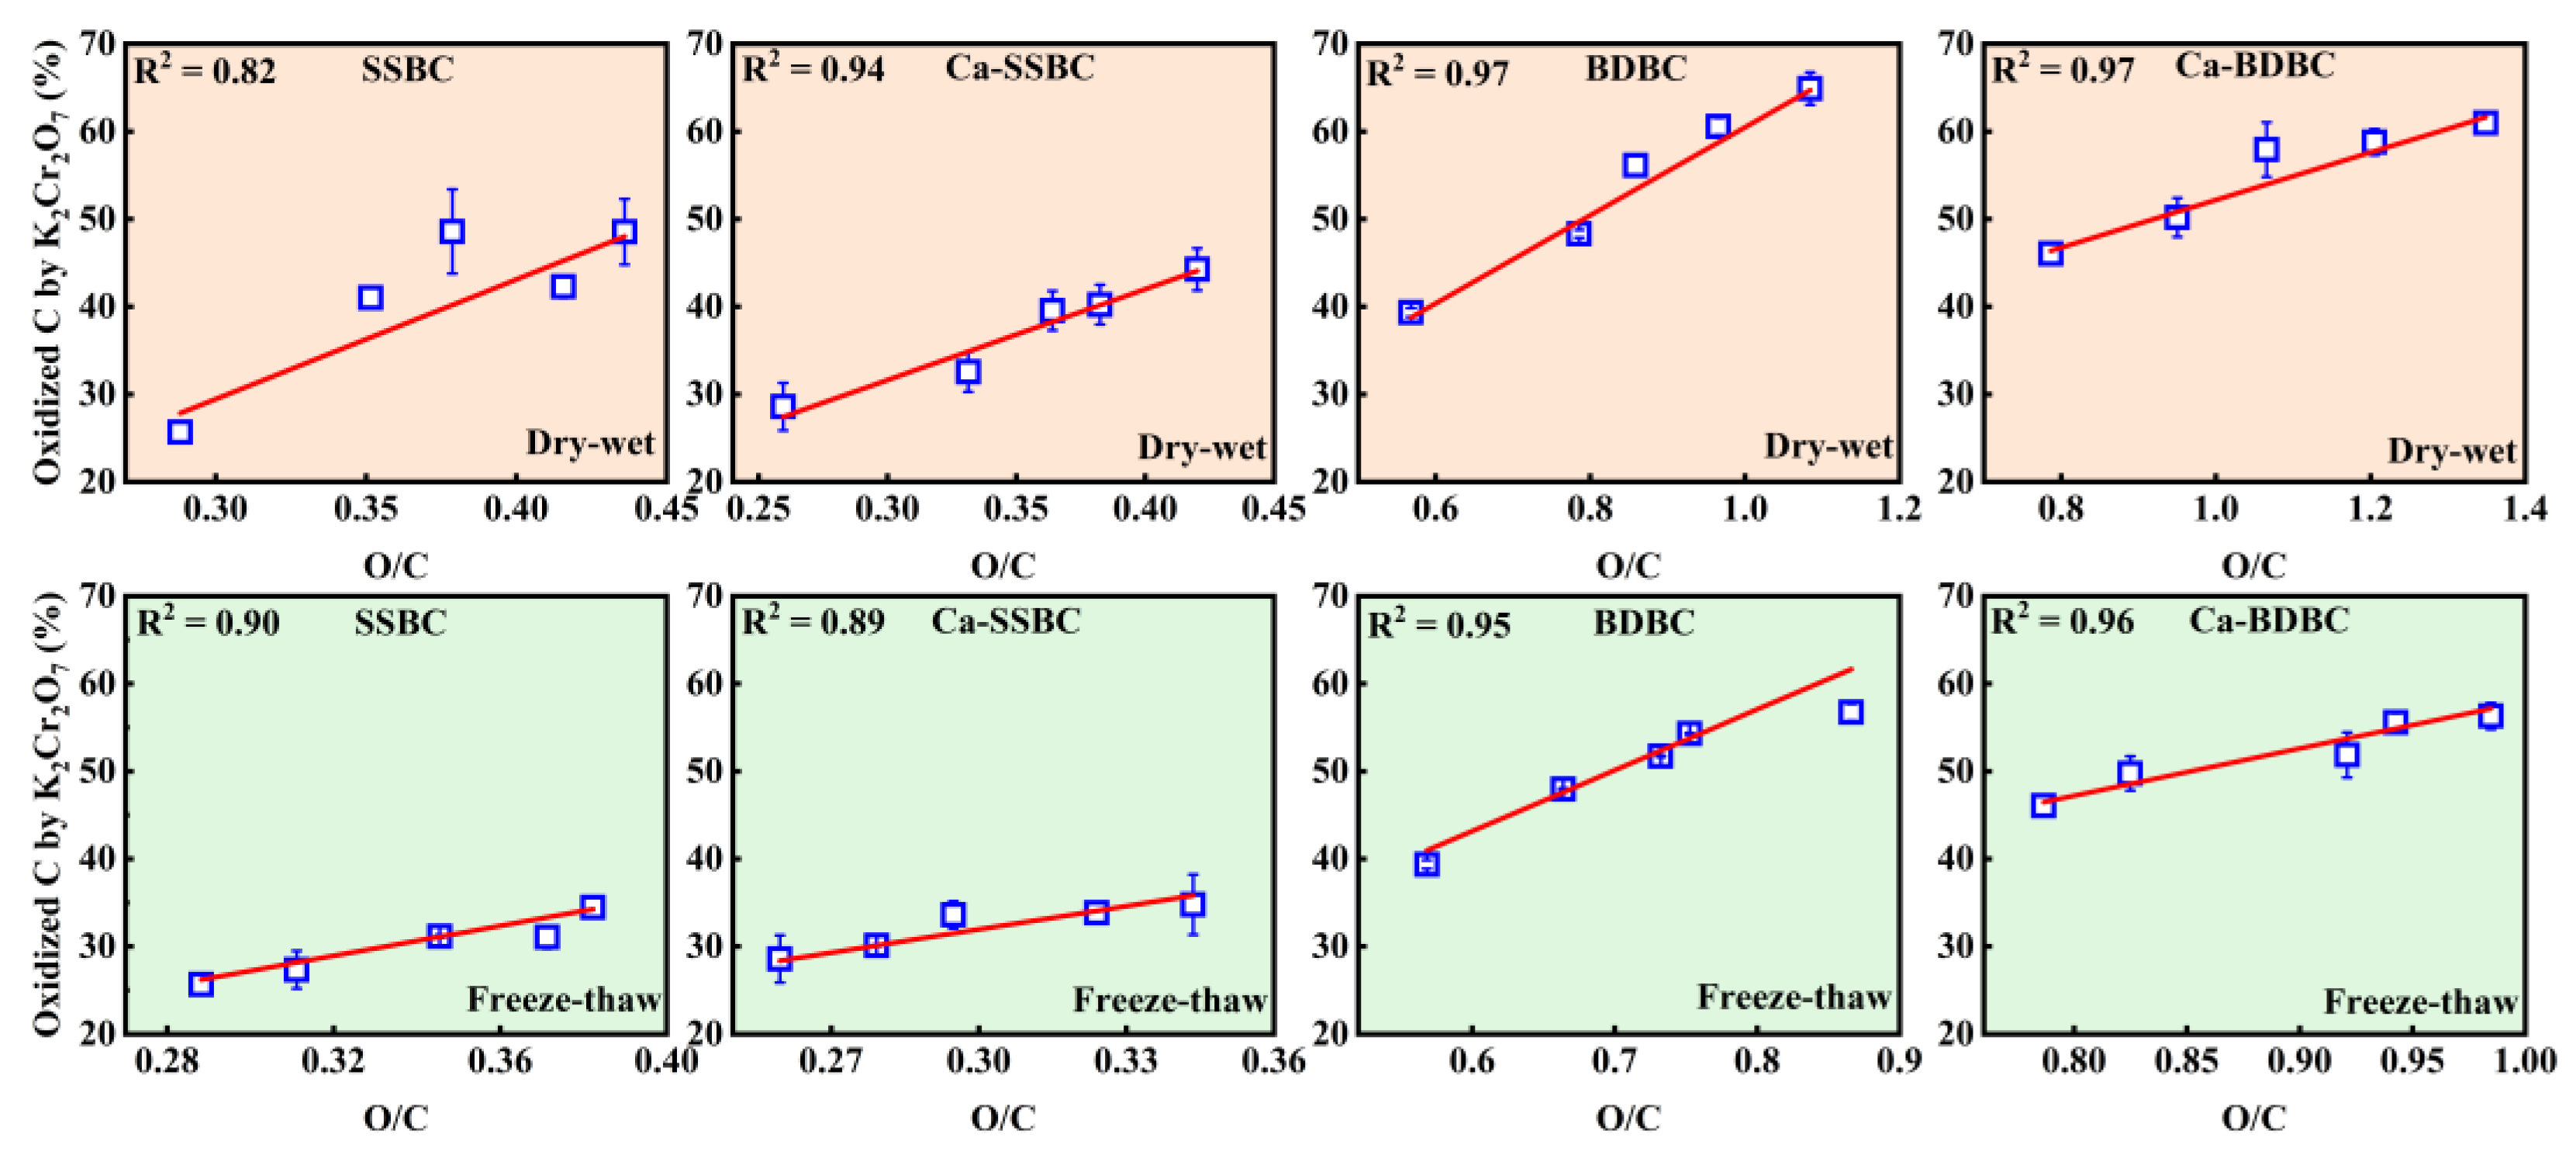
3.3. Exogenous Calcium Enhanced the Bulk C Stability in Biochar during Aging Process

Dry–wet aging. The K2Cr2O7 oxidization treatment of biochar is an important method to assess bulk C stability [31]. As shown in Figure 4a,b, for SSBC and BDBC, after 25 dry–wet aging rounds, the oxidized C contents increased from 26% to 49% and from 40% to 65%, respectively. This can be attributed to dry–wet aging causing the formation of more biochar fragments (Figure 2), which were prone to being oxidized and broken down [53,54]. Furthermore, dry–wet aging resulted in more aliphatic/aromatic C being oxidized (Table 2), which destroyed the order and regularity of the carbon structure, thus exposing more unstable C [9,62]. The oxidized C contents in two fresh Ca-rich biochar samples were higher than those in the corresponding pristine biochar. As shown in Figure 4c,d, the percentages of oxidized C in fresh SSBC, Ca-SSBC, BDBC, and Ca-BDBC were 25.7%, 28.6%, 39.4%, and 46.1%, respectively. In our previous study, we attributed this phenomenon to mineral Ca inducing the formation of more disordered carbon structures during biowaste pyrolysis [27]. Similar to pristine biochar, the oxidized bulk C contents in Ca-rich biochar increased with the increase in aging rounds (Figure 4c,d). After 25 dry–wet aging rounds, the contents of oxidized bulk C in Ca-SSBC and Ca-BDBC increased to 44% and 61%, respectively, and they were less than those in the corresponding pristine biochar. Here we focused on an interesting phenomenon in that after 25 dry–wet aging rounds, the rates of increase for the oxidized bulk C from SSBC and BDBC were 89% and 65%, respectively, and those from Ca-SSBC and Ca-BDBC were 55% and 32%, respectively. The rates of increase for the oxidized C from two Ca-rich biochars were obviously lower than those from the corresponding pristine biochar. This indicates that the effect of dry–wet aging on bulk C stability in Ca-rich biochar was weaker than that in pristine biochar. This was due to the protective layer formed by mineral Ca on the biochar surface, which could alleviate the damage of the biochar surface structure during the aging process [8,57,63,64]. This conjecture was verified by XPS results (Figure S2 and Table 2). The percentages of C–C/C=C in pristine biochar decreased by 19% (SSBC) and 15% (BDBC) after 25 rounds of dry–wet aging, respectively, while those in Ca-rich biochar decreased by 13% (Ca-SSBC), and 8% (Ca-BDBC), respectively. Combining the results of SEM in Figure 2 and XRD in Figure S2, it confirmed that mineral Ca could provide physical isolation in order to prevent the contact of carbon in biochar and external O2, thus reducing the formation of O-containing functional groups on the biochar surface [57]. Therefore, compared with the pristine biochar, it was more difficult to destroy the bulk C structure in Ca-rich biochar during dry–wet aging. Figure 5 further shows that the O/C ratio was positively correlated with the content of oxidized bulk C in both pristine biochar and Ca-rich biochar, indicating that the surface oxidation degree of biochar directly affected the bulk C stability [65,66].
Freeze–thaw aging. Freeze–thaw aging also decreased bulk C stability in biochar (Figure 4c,d). For SSBC and BDBC, after 25 rounds of freeze–thaw aging, the contents of oxidized bulk C increased from 26% to 34% and from 39% to 57%, respectively, while those in Ca-SSBC and Ca-BDBC increased from 29% to 35% and from 46% to 56%, respectively. It was unexpected that after 25 freeze–thaw aging rounds, the oxidized bulk C contents in two Ca-rich biochars were almost uniform with those from two pristine biochars, while the rates of increase for the oxidized bulk C decreased from 34% (SSBC) to 22% (Ca-SSBC) and from 44% (BDBC) to 22% (Ca-BDBC), respectively. The XPS results showed that compared to fresh biochar, freeze–thaw aging resulted in the percentages of C=O, O=C–O, and C–O in SSBC and BDBC increasing by 55% and 24%, respectively, and those in Ca-SSBC and Ca-BDBC increasing by 25% and 7%, respectively (Table 2), indicating that Ca-rich biochar had a stronger antioxidative capacity than pristine biochar. Meanwhile, unlike the fragment structure of pristine biochar after freeze–thaw aging, the SEM images of Ca-rich biochar presented the obvious “net” pore structure (Figure 2), which intervened in the oxidization of bulk C in biochar.
Natural aging in soil. After natural aging, biochar was isolated from soil and its bulk C stability was evaluated by the K2Cr2O7 oxidized method. As shown in Figure 4e, after natural aging in red soil, yellow soil, and paddy soil for five months, oxidized bulk C contents in SSBC were 20%, 16%, and 20%, respectively, while those in BDBC were 37%, 33%, and 27%, respectively. They were lower than the corresponding fresh biochar (26% in SSBC and 39% in BDBC). This phenomenon was closely related to the soil components, mainly soil minerals. On the one hand, the adsorption of soil minerals onto biochar could serve as a physical barrier and prevent its decomposition and oxidation processes [8,64]. On the other hand, the interaction of biochar with soil minerals induced the formation of biochar–mineral complexes [57], which inhibited the oxidation of biochar by occupying its surface reaction site or blocking its pores [63]. After natural aging in different soils, oxidized bulk C contents in Ca-rich biochar were obviously lower than those in pristine biochar (Figure 4f). Oxidized bulk C contents in Ca-SSBC were 18% (red soil), 16% (yellow soil), and 13% (paddy soil), respectively, which were lower by 8%, 1%, and 34% than those in SSBC, respectively. For Ca-BDBC with natural aging in red soil and yellow soil, the oxidized C contents were nearly equal to those in BDBC, while in paddy soil, the oxidized C contents in Ca-BDBC decreased by 21% compared with those in BDBC. Therefore, from the perspective of the long-term stability of biochar in soil, Ca-rich biochar was more suitable than pristine biochar.

3.4. Exogenous Calcium Enhanced C Sequestration Ability in Biochar during Aging Process

In this study, the initial carbon content of all fresh biochar was normalized to 100%, and the carbon sequestration in biochar during aging was roughly estimated by considering both surface C stability and bulk C stability. After 25 dry–wet aging rounds, for SSBC and BDBC, the final C sequestration contents were decreased from 74% to 40% and from 61% to 23%, respectively (Figure 6a,b), while C contents sequestrated in Ca-rich biochar were 46% (Ca-SSBC) and 27% (Ca-BDBC), respectively. After 25 freeze–thaw aging rounds, the final C sequestration contents in SSBC and BDBC were decreased to 55% and 31%, respectively, while the C contents sequestrated in Ca-rich biochar were 59% (Ca-SSBC) and 35% (Ca-BDBC), respectively (Figure 6c,d). The results indicate that when the initial carbon content was kept equal, two Ca-rich biochars could sequestrate more carbon than the corresponding pristine biochar under dry–wet or freeze–thaw aging. In addition, it is worth noting that the influence of freeze–thaw aging on C stability was weaker than that of dry–wet aging, suggesting that biochar was more suitable to being applied in the northern permafrost than in the southern dry soil. After natural aging in three farmland soils for five months, the final C sequestration contents in SSBC were 62% (red soil), 72% (yellow soil), and 74% (paddy soil), respectively (Figure 6e). For Ca-SSBC, their contents were 77% (red soil), 77% (yellow soil), and 80% (paddy soil), respectively, indicating that Ca-SSBC was more stable in soil than SSBC. Similar results also appeared in BDBC and Ca-BDBC (Figure 6f). In all, Ca-rich biochar could sequestrate more C than pristine biochar under all three aging processes. Therefore, it has greater application potential than pristine biochar.

4. Conclusions

This study found that under three aging processes (dry–wet aging, freeze–thaw aging, and natural aging), both surface C and bulk C stability of two Ca-rich biochars were superior to those of corresponding pristine biochar. This was attributed to the exogenous Ca on the Ca-SSBC and Ca-BDBC surfaces acting as a “physical barrier”, which intervened in the oxidation of C–C/C=C, but also protected the C skeleton structure from generating a fragmented structure. Eventually, with the addition of exogenous Ca, the maximal C sequestration in SSBC and BDBC increased by 24.4% and 16.9% under the three aging processes, respectively. This implies that when using biochar for carbon sequestration, exogenous calcium can be added to the precursors to enhance the long-term stability of biochar and improve carbon sequestration efficiency. This study provides a new insight to enhance the carbon sequestration potential of biochar in the long-term aging process of soil. Future studies may consider focusing more on the long-term carbon sequestration capacity in soil of various mineral-rich biochars.

Supplementary Materials

The following supporting information can be downloaded at: https://www.mdpi.com/article/10.3390/agronomy13071676/s1, Table S1: Main element contents and pore structure parameters of four biochars. Figure S1: Variations in oxygen (O), hydrogen (H), and nitrogen (N) element contents in pristine biochar and Ca-rich biochar under different aging processes. Figure S2: Surface crystal compositions of pristine biochar. Figure S3: Surface carbon functional groups of pristine biochar and Ca-rich biochar with different aging processes.

Author Contributions

H.N.: conceptualization; methodology; investigation; data curation; formal analysis; and writing—original draft. Y.J.: methodology; formal analysis; and writing—reviewing and editing. W.Z.: formal analysis and writing—reviewing and editing. L.Z.: supervision and writing—reviewing and editing. F.Y.: supervision; funding acquisition; conceptualization; and writing—reviewing and editing. All authors have read and agreed to the published version of the manuscript.

Funding

This work is supported by the Science and Technology Commission of Shanghai Municipality (No. 22dz1209402); and the study on low concentration urban biological nitrogen removal technology based on autotrophic denitrification of sulfur and iron.

Data Availability Statement

The data presented in this study are available on request from the author.

Conflicts of Interest

The authors declare no conflict of interest.

References

  1. Cheng, C.H.; Lehmann, J.; Engelhard, M.H. Natural oxidation of black carbon in soils: Changes in molecular form and surface charge along a climosequence. Geochim. Cosmochim. Acta 2008, 72, 1598–1610. [Google Scholar] [CrossRef]
  2. Lehmann, J. A handful of carbon. Nature 2007, 447, 143–144. [Google Scholar] [CrossRef]
  3. Lehmann, J.; Skjemstad, J.; Sohi, S.; Carter, J.; Barson, M.; Falloon, P.; Coleman, K.; Woodbury, P.; Krull, E. Australian climate–carbon cycle feedback reduced by soil black carbon. Nat. Geosci. 2008, 1, 832–835. [Google Scholar] [CrossRef]
  4. Spokas, K.A. Review of the stability of biochar in soils: Predictability of O:C molar ratios. Carbon Manag. 2010, 1, 289–303. [Google Scholar] [CrossRef] [Green Version]
  5. Woolf, D.; Amonette, J.E.; Street-Perrott, F.A.; Lehmann, J.; Joseph, S. Sustainable biochar to mitigate global climate change. Nat. Commun. 2010, 1, 56. [Google Scholar] [CrossRef] [PubMed] [Green Version]
  6. Sohi, S.P.; Krull, E.; Lopez-Capel, E.; Bol, R. A review of biochar and its use and function in soil. Adv. Agron. 2010, 105, 47–82. [Google Scholar]
  7. Hammes, K.; Torn, M.S.; Lapenas, A.G.; Schmidt, M.W.I. Centennial black carbon turnover observed in a Russian steppe soil. Biogeosciences 2008, 5, 1339–1350. [Google Scholar] [CrossRef] [Green Version]
  8. Nguyen, B.T.; Lehmann, J.; Kinyangi, J.; Smernik, R.; Riha, S.J.; Engelhard, M.H. Long-term black carbon dynamics in cultivated soil. Biogeochemistry 2009, 92, 163–176. [Google Scholar] [CrossRef]
  9. Wang, L.W.; O’Connor, D.; Rinklebe, J.; Ok, Y.S.; Tsang, D.C.W.; Shen, Z.T.; Hou, D.Y. Biochar aging: Mechanisms, physicochemical changes, assessment, and implications for field applications. Environ. Sci. Technol. 2020, 54, 14797–14814. [Google Scholar] [CrossRef]
  10. Spokas, K.A.; Novak, J.M.; Masiello, C.A.; Johnson, M.G.; Colosky, E.C.; Ippolito, J.A.; Trigo, C. Physical disintegration of biochar: An overlooked process. Environ. Sci. Technol. Lett. 2004, 1, 326–332. [Google Scholar] [CrossRef]
  11. Petersen, H.I.; Lassen, L.; Rudra, A.; Nguyen, L.X.; Do, P.T.M.; Sanei, H. Carbon stability and morphotype composition of biochars from feedstocks in the Mekong Delta, Vietnam. Int. J. Coal Geol. 2023, 271, 104233. [Google Scholar] [CrossRef]
  12. Liao, W.; Zhang, X.; Ke, S.; Shao, J.; Yang, H.; Zhang, S.; Chen, H. Effect of different biomass species and pyrolysis temperatures on heavy metal adsorption, stability and economy of biochar. Ind. Crops Prod. 2022, 186, 115238. [Google Scholar] [CrossRef]
  13. Singh, B.P.; Cowie, A.L.; Smernik, R.J. Biochar carbon stability in a clayey soil as a function of feedstock and pyrolysis temperature. Environ. Sci. Technol. 2012, 46, 11770. [Google Scholar] [CrossRef] [PubMed]
  14. Purakayastha, T.J.; Kumari, S.; Pathak, H. Characterisation, stability, and microbial effects of four biochars produced from crop residues. Geoderma 2015, 239–240, 293–303. [Google Scholar] [CrossRef]
  15. Masek, O.; Brownsort, P.; Cross, A.; Sohi, S. Influence of production conditions on the yield and environmental stability of biochar. Fuel 2013, 103, 151–155. [Google Scholar] [CrossRef] [Green Version]
  16. Han, L.; Ro, K.S.; Wang, Y.; Sun, K.; Sun, H.; Libra, J.A.; Xing, B. Oxidation resistance of biochars as a function of feedstock and pyrolysis condition. Sci. Total Environ. 2018, 616–617, 335–344. [Google Scholar] [CrossRef]
  17. Liu, Y.; Yao, S.; Wang, Y.; Haohao, L.; Brar, S.K.; Yang, S. Bio- and hydrochars from rice straw and pig manure: Inter-comparison. Bioresour. Technol. 2017, 235, 332–337. [Google Scholar] [CrossRef] [Green Version]
  18. Leng, L.; Huang, H. An overview of the effect of pyrolysis process parameters on biochar stability. Bioresour. Technol. 2018, 270, 627–642. [Google Scholar] [CrossRef]
  19. Xu, X.; Hu, X.; Ding, Z.; Chen, Y. Effects of copyrolysis of sludge with calcium carbonate and calcium hydrogen phosphate on chemical stability of carbon and release of toxic elements in the resultant biochars. Chemosphere 2017, 189, 76–85. [Google Scholar] [CrossRef]
  20. Du, J.; Zhang, L.; Ali, A.; Li, R.; Xiao, R.; Guo, D.; Liu, X.; Zhang, Z.; Ren, C.; Zhang, Z. Research on thermal disposal of phytoremediation plant waste: Stability of potentially toxic metals (PTMs) and oxidation resistance of biochars. Process Saf. Environ. Prot. 2019, 125, 260–268. [Google Scholar] [CrossRef]
  21. Chen, D.; Yu, X.; Song, C.; Pang, X.; Huang, J.; Li, Y. Effect of pyrolysis temperature on the chemical oxidation stability of bamboo biochar. Bioresour. Technol. 2016, 218, 1303–1306. [Google Scholar] [CrossRef]
  22. Baharak, S.; Chen WYEgiebor, N.O. A comprehensive review on physical activation of biochar for energy and environmental applications. Rev. Chem. Eng. 2019, 35, 735–776. [Google Scholar]
  23. Ghorbani, M.; Neugschwandtner, R.W.; Soja, G.; Konvalina, P.; Kopecký, M. Carbon fixation and soil aggregation affected by biochar oxidized with hydrogen peroxide: Considering the efficiency of pyrolysis temperature. Sustainability 2023, 15, 7158. [Google Scholar] [CrossRef]
  24. Ghorbani, M.; Konvalina, P.; Kopecký, M.; Kolář, L. A meta-analysis on the impacts of different oxidation methods on the surface area properties of biochar. Land Degrad. Dev. 2023, 34, 299–312. [Google Scholar] [CrossRef]
  25. Ahmed, M.B.; Zhou, J.L.; Ngo, H.H.; Guo, W.; Chen, M. Progress in the preparation and application of modified biochar for improved contaminant removal from water and wastewater. Bioresour. Technol. 2016, 214, 836–851. [Google Scholar] [CrossRef] [PubMed]
  26. Xu, Z.; He, M.; Xu, X.; Cao, X.; Tsang, D. Impacts of different activation processes on the carbon stability of biochar for oxidation resistance. Bioresour. Technol. 2021, 338, 125555. [Google Scholar] [CrossRef]
  27. Nan, H.; Zhao, L.; Yang, F.; Liu, Y.; Qiu, H. Different alkaline minerals interacted with biomass carbon during pyrolysis: Which one improved biochar carbon sequestration? J. Clean. Prod. 2020, 255, 120162. [Google Scholar] [CrossRef]
  28. Wang, F.; Zhang, R.; Donne, S.W.; Beyad, Y.; Liu, X.; Duan, X.; Yang, T.; Su, P.; Sun, H. Co-pyrolysis of wood chips and bentonite/kaolin: Influence of temperatures and minerals on characteristics and carbon sequestration potential of biochar. Sci. Total Environ. 2022, 838, 156081. [Google Scholar] [CrossRef]
  29. Zhang, J.; Wu, C.; Hou, W.; Zhao, Q.; Liang, X.; Lin, S.; Li, H.; Xie, Y. Biological calcium carbonate with a unique organic–inorganic composite structure to enhance biochar stability. Environ. Sci. Process. Impacts 2021, 23, 1747–1758. [Google Scholar] [CrossRef]
  30. Chen, Y.; Xu, Q.; Sun, K.; Han, L.; Sun, H.; Yang, Y.; Wang, Z. Effects of simulated diagenesis and mineral amendment on the structure, stability and imidacloprid sorption properties of biochars produced at varied temperatures. Chemosphere 2021, 282, 131003. [Google Scholar] [CrossRef]
  31. Li, F.; Cao, X.; Zhao, L.; Wang, J.; Ding, Z. Effects of mineral additives on biochar formation: Carbon retention, stability, and properties. Environ. Sci. Technol. 2014, 48, 11211–11217. [Google Scholar] [CrossRef] [PubMed]
  32. Guo, J.; Chen, B. Insights on the molecular mechanism for the recalcitrance of biochars: Interactive effects of carbon and silicon components. Environ. Sci. Technol. 2014, 48, 9103–9112. [Google Scholar] [CrossRef] [PubMed]
  33. Xiao, X.; Chen, B.; Zhu, L. Transformation, morphology, and dissolution of silicon and carbon in rice straw-derived biochars under different pyrolytic temperatures. Environ. Sci. Technol. 2014, 48, 3411–3419. [Google Scholar] [CrossRef] [PubMed]
  34. Lu, J.; Yang, Y.; Liu, P.; Li, Y.; Huang, F.; Zeng, L.; Liang, Y.; Li, S.; Hou, B. Iron-montmorillonite treated corn straw biochar: Interfacial chemical behavior and stability. Sci. Total Environ. 2020, 708, 134773. [Google Scholar] [CrossRef]
  35. Ren, N.; Tang, Y.; Li, M. Mineral additive enhanced carbon retention and stabilization in sewage sludge-derived biochar. Process Saf. Environ. Prot. 2018, 115, 70–78. [Google Scholar] [CrossRef]
  36. Nan, H.; Yin, J.; Yang, F.; Luo, Y.; Zhao, L.; Cao, X. Pyrolysis temperature-dependent carbon retention and stability of biochar with participation of calcium: Implications to carbon sequestration. Environ. Pollut. 2021, 287, 117566. [Google Scholar] [CrossRef]
  37. Hale, S.; Hanley, K.; Lehmann, J.; Zimmerman, R.; Cornelissen, G. Effects of chemical, biological, and physical aging as well as soil addition on the sorption of pyrene to activated carbon and biochar. Environ. Sci. Technol. 2011, 45, 10445–10453. [Google Scholar] [CrossRef]
  38. Zhang, P.; Fan, J.; Xu, X.; Xu, Z.; Yu, Y.; Zhao, L.; Qiu, H.; Cao, X. Contrasting effects of dry-wet and freeze-thaw aging on the immobilization of As in As-contaminated soils amended by zero-valent iron-embedded biochar. J. Hazard. Mater. 2022, 426, 128123. [Google Scholar] [CrossRef]
  39. Andrew, R.Z. Abiotic and microbial oxidation of laboratory-produced black carbon (biochar). Environ. Sci. Technol. 2010, 44, 1295–1301. [Google Scholar]
  40. Liu, D.; Liu, D.; Gao, J.; Yang, Y.; Ding, Y.; Guo, C.; Zhang, X.; Xia, Z.; Xu, W. Influence of addition of two typical activated carbons on fertility properties and mechanical strength of vegetation concrete under freeze-thaw conditions. Sci. Total Environ. 2022, 838, 156446. [Google Scholar] [CrossRef]
  41. Mukherjee, A.; Zimmerman, A.R. Organic carbon and nutrient release from a range of laboratory-produced biochars and biochar–soil mixtures. Geoderma 2013, 193–194, 122–130. [Google Scholar] [CrossRef]
  42. Fan, Q.; Sun, J.; Chu, L.; Cui, L.; Quan, G.; Yan, J.; Hussain, Q.; Iqbal, M. Effects of chemical oxidation on surface oxygen-containing functional groups and adsorption behavior of biochar. Chemosphere 2018, 207, 33–40. [Google Scholar] [CrossRef] [PubMed]
  43. Shi, K.; Xie, Y.; Qiu, Y. Natural oxidation of a temperature series of biochars: Opposite effect on the sorption of aromatic cationic herbicides. Ecotoxicol. Environ. Saf. 2015, 114, 102–108. [Google Scholar] [CrossRef] [PubMed]
  44. Singh, B.; Fang, Y.; Cowie, B.; Thomsen, L. NEXAFS and XPS characterisation of carbon functional groups of fresh and aged biochars. Org. Geochem. 2014, 77, 1–10. [Google Scholar] [CrossRef]
  45. Yao, F.X.; Arbestain, M.C.; Virgel, S.; Blanco, F.; Arostegui, J.; Maciá-Agulló, J.A.; Macías, F. Simulated geochemical weathering of a mineral ash-rich biochar in a modified Soxhlet reactor. Chemosphere 2010, 80, 724–732. [Google Scholar] [CrossRef]
  46. Fang, Q.; Chen, B.; Lin, Y.; Guan, Y. Aromatic and hydrophobic surfaces of wood-derived biochar enhance perchlorate adsorption via hydrogen bonding to oxygen-containing organic groups. Environ. Sci. Technol. 2014, 48, 279–288. [Google Scholar] [CrossRef] [PubMed]
  47. Ren, X.; Sun, H.; Wang, F.; Zhang, P.; Zhu, H. Effect of aging in field soil on biochar’s properties and its sorption capacity. Environ. Pollut. 2018, 242, 1880–1886. [Google Scholar] [CrossRef]
  48. Cao, Y.; Jing, Y.; Hao, H.; Wang, X. Changes in the physicochemical characteristics of peanut straw biochar after freeze-thaw and dry-wet aging treatments of the biomass. Bioresources 2019, 14, 4329–4343. [Google Scholar] [CrossRef]
  49. Gao, X.; Wu, H. Aerodynamic properties of biochar particles: Effect of grinding and implications. Environ. Sci. Technol. Lett. 2013, 1, 60–64. [Google Scholar] [CrossRef]
  50. Tan, L.; Ma, Z.; Yang, K.; Cui, Q.; Zheng, J. Effect of three artificial aging techniques on physicochemical properties and Pb adsorption capacities of different biochars. Sci. Total Environ. 2019, 699, 134223. [Google Scholar] [CrossRef]
  51. Rosas, J.M.; Ruiz-Rosas, R.; Rodríguez-Mirasol, J.; Cordero, T. Kinetic study of the oxidation resistance of phosphorus-containing activated carbons. Carbon 2012, 50, 1523–1537. [Google Scholar] [CrossRef]
  52. Nan, H.; Mašek, O.; Yang, F.; Xu, X.; Qiu, H.; Cao, X.; Zhao, L. Minerals: A missing role for enhanced biochar carbon sequestration from the thermal conversion of biomass to the application in soil. Earth-Sci. Rev. 2022, 234, 104215. [Google Scholar] [CrossRef]
  53. Sigua, G.C.; Novak, J.M.; Watts, D.W.; Cantrell, K.B.; Shumaker, P.D.; Szoegi, A.A.; Johnson, M.G. Carbon mineralization in two ultisols amended with different sources and particle sizes of pyrolyzed biochar. Chemosphere 2014, 103, 313–321. [Google Scholar] [CrossRef] [PubMed]
  54. Huisman, D.J.; Braadbaart, F.; Wijk, I.; Os, B. Ashes to ashes charcoal to dust: Micromorphological evidence for ash-induced disintegration of charcoal in Early Neolithic (LBK) soil features in Elsloo (The Netherlands). J. Archaeol. Sci. 2012, 39, 994–1004. [Google Scholar] [CrossRef]
  55. Liu, W.; Wang, Y.; Chen, D.; Lu, P. Effect of aging on physicochemical properties of bio-chars. J. Eng. Thermophys. 2021, 42, 1575–1582. [Google Scholar]
  56. Hillel, D. Introduction to Environmental Soil Physics: Chapter 1—Soil Physics and Soil Physical Characteristics; Academic Press: Cambridge, MA, USA, 2003; pp. 3–17. [Google Scholar]
  57. Yang, F.; Zhao, L.; Gao, B.; Xu, X.; Cao, X. The interfacial behavior between biochar and soil minerals and its effect on biochar stability. Environ. Sci. Technol. 2016, 50, 2264–2271. [Google Scholar] [CrossRef] [PubMed]
  58. Li, H.; Lu, X.; Xu, Y.; Liu, H. How close is artificial biochar aging to natural biochar aging in fields? A meta-analysis. Geoderma 2019, 352, 96–103. [Google Scholar] [CrossRef]
  59. Wang, H.; Feng, M.; Zhou, F.; Huang, X.; Tsang, D.; Zhang, W. Effects of atmospheric ageing under different temperatures on surface properties of sludge-derived biochar and metal/metalloid stabilization. Chemosphere 2017, 184, 176. [Google Scholar] [CrossRef]
  60. Yang, F.; Xu, Z.B.; Lu, Y.; Gao, B.; Xu, X.; Zhao, L.; Cao, X. Kaolinite enhances the stability of the dissolvable and undissolvable fractions of biochar via different mechanisms. Environ. Sci. Technol. 2018, 52, 8321–8329. [Google Scholar] [CrossRef]
  61. Skjemstad, J.O.; Clarke, P.; Taylor, J.A.; Oades, J.M.; Mcclure, S.G. The chemistry and nature of protected carbon in soil. Soil Res. 1996, 34, 1876–1880. [Google Scholar] [CrossRef]
  62. Mia, S.; Dijkstra, F.A.; Singh, B. Long-term aging of biochar: A molecular understanding with agricultural and environmental implications. Adv. Agron. 2017, 141, 1–51. [Google Scholar]
  63. Ren, X.; Wang, F.; Zhang, P.; Guo, J.; Sun, H. Aging effect of minerals on biochar properties and sorption capacities for atrazine and phenanthrene. Chemosphere 2018, 206, 51–58. [Google Scholar] [CrossRef]
  64. Lin, Y.; Munroe, P.; Joseph, S.; Kimber, S.; Zwieten, L.V. Nanoscale organo-mineral reactions of biochars in ferrosol: An investigation using microscopy. Plant Soil 2012, 357, 369–380. [Google Scholar] [CrossRef]
  65. Crombie, K.; Mašek, O.; Sohi, S.P.; Brownsort, P.; Cross, A. The effect of pyrolysis conditions on biochar stability as determined by three methods. GCB Bioenergy 2013, 5, 122–131. [Google Scholar] [CrossRef] [Green Version]
  66. Andrew, C.; Saran, P.S. A method for screening the relative long-term stability of biochar. GCB Bioenergy 2013, 5, 215–220. [Google Scholar]
Figure 1. Variations in carbon (C) element contents in pristine biochar and Ca-rich biochar under different aging processes (n = 3) (SSBC: sewage sludge biochar (a); BDBC: bone dreg biochar (c); Ca-SSBC: CaCl2 + sewage sludge biochar (b); Ca-BDBC: CaCl2 + bone dreg biochar (d).
Agronomy 13 01676 g001
Figure 2. Morphology changes in pristine biochar (SSBC: sewage sludge biochar; BDBC: bone dreg biochar) and Ca-rich biochar (Ca-SSBC: CaCl2 + sewage sludge biochar; Ca-BDBC: CaCl2 + bone dreg biochar) under different aging processes.
Agronomy 13 01676 g002
Figure 3. Variation in surface C stability in pristine biochar (SSBC: sewage sludge biochar; BDBC: bone dreg biochar) and Ca-rich biochar (Ca-SSBC: CaCl2 + sewage sludge biochar; Ca-BDBC: CaCl2 + bone dreg biochar) during dry-wet aging (a,b), freeze-thaw aging (c,d), and natural aging in different soils (e,f) (n = 3).
Agronomy 13 01676 g003aAgronomy 13 01676 g003b
Figure 4. Variation in bulk C stability in pristine biochar (SSBC: sewage sludge biochar; BDBC: bone dreg biochar) and Ca-rich biochar (Ca-SSBC: CaCl2 + sewage sludge biochar; Ca-BDBC: CaCl2 + bone dreg biochar) during dry-wet aging (a,b), freeze-thaw aging (c,d), and natural aging in different soils (e,f) (n = 3).
Agronomy 13 01676 g004
Figure 5. Relationship between O/C atom ratio and oxidized C by K2Cr2O7 in pristine biochar (SSBC: sewage sludge biochar; BDBC: bone dreg biochar) and Ca-rich biochar (Ca-SSBC: CaCl2 + sewage sludge biochar; Ca-BDBC: CaCl2 + bone dreg biochar) during different aging processes (n = 3).
Agronomy 13 01676 g005
Figure 6. Carbon content sequestrated in pristine biochar (SSBC: sewage sludge biochar; BDBC: bone dreg biochar) and Ca-rich biochar (Ca-SSBC: CaCl2 + sewage sludge biochar; Ca-BDBC: CaCl2 + bone dreg biochar) during dry-wet aging (a,b), freeze-thaw aging (c,d), and natural aging in different soils (e,f).
Agronomy 13 01676 g006aAgronomy 13 01676 g006b
Table 1. Selected properties of different farmland soils.
Farmland SoilpHSand
%
Silt
%
Clay
%
K
g·kg−1
Na
g·kg−1
Ca
g·kg−1
Mg
g·kg−1
Fe
g·kg−1
Al
g·kg−1
Red soil4.9046.829.923.36.20.820.930.6062.057.1
Yellow soil9.1021.369.88.9712.11.0231.75.8313.013.4
Paddy soil6.276.3479.214.425.21.764.735.0519.627.3
Table 2. Content analysis of C bond states on biochar surface with different aging processes.
BiocharContent/%0 RoundDry–wet/25 RoundsFreeze–thaw/25 Rounds
SSBCC–C/C=C79.2064.5167.74
C=O9.329.87/
O=C–O7.195.2810.58
C–O4.2920.3418.69
Ca-SSBCC–C/C=C74.7965.0668.60
C=O8.528.397.39
O=C–O8.426.297.96
C–O8.2720.2616.05
BDBCC–C/C=C67.7557.4759.85
C=O7.4611.928.47
O=C–O8.6911.979.70
C–O16.118.6521.97
Ca-BDBCC–C/C=C65.1860.0162.64
C=O7.298.799.92
O=C–O14.4810.405.82
C–O13.0420.8121.63
Disclaimer/Publisher’s Note: The statements, opinions and data contained in all publications are solely those of the individual author(s) and contributor(s) and not of MDPI and/or the editor(s). MDPI and/or the editor(s) disclaim responsibility for any injury to people or property resulting from any ideas, methods, instructions or products referred to in the content.

