Article

Monitoring Patch Expansion Amends to Evaluate the Effects of Non-Chemical Control on the Creeping Perennial Cirsium arvense (L.) Scop. in a Spring Wheat Crop

Faculty of Agricultural and Environmental Sciences-Crop Health, University of Rostock (UR), DE-18051 Rostock, Germany
*
Author to whom correspondence should be addressed.
Agronomy 2023, 13(6), 1474; https://doi.org/10.3390/agronomy13061474
Submission received: 31 March 2023 / Revised: 17 May 2023 / Accepted: 23 May 2023 / Published: 26 May 2023
(This article belongs to the Special Issue Innovations in Agriculture for Sustainable Agro-Systems)

Abstract

:
The creeping perennial weed species Cirsium arvense (L.) Scop. occurs in patches. Expanding creeping roots allow these patches to increase their covered area. This characteristic has rarely been addressed when investigating the effects of control options in arable fields. We designed a three-year field experiment (2019–2021) in north-eastern Germany, accounting for existing patch patterns. The experimental setup included an untreated control, a competition treatment (cover crop, CC), two disturbance treatments by mouldboard ploughing (PL), root cutting (RC), and four combined applications (RC + CC, PL + CC, PL + RC, PL + RC + CC). Root cutting was performed by a prototype tillage machine produced by “Kverneland”. Plots were defined by the species growth pattern and mapped by GPS and UAV. The experiment investigates the thistle response variables: “Expansion”, “Density”, “Coverage”, and “Height”. Treatments including disturbance by ploughing (PL, PL + CC, PL + RC, PL + RC + CC) reduced “Density” by the factor 0.15 and “Expansion” by 0.25, while those without ploughing (CC, RC, RC + CC) only reduced “Density” by the factor 0.68 and “Expansion” by 0.71. Adding root cuttings or cover crops did not further increase the reduction effect of ploughing. Treatments with competition by cover crops impacted “Expansion” more clearly than “Density”. When cover crops were combined with root cutting (RC + CC), “Expansion” was almost additively reduced, resulting in a reduction comparable to that of ploughing. The “Height” of the shoots was significantly reduced in four treatments (PL, RC + CC, PL + RC, PL + RC + CC), while “Coverage” did not change significantly. UAV patch monitoring proved to be accurate enough for thistle “Expansion” but not for thistle “Density” within the patch. The results of this study demand innovative research when controlling patch-forming creeping perennial weeds. The need for patches will limit small-scale experimental set ups.

1. Introduction

Considered one of the world’s worst weeds [1,2], the creeping perennial species Cirsium arvense (L.) Scop (Creeping thistle) grows in spatially distinct patches of varying sizes [3]. Commonly, C. arvense field infestations are patchy, with dense thistle stands alternating with areas free of thistles [4,5]. The clonal root system of creeping thistles facilitates survival and spatial spread in arable fields through vegetative sprouting. Expanding creeping roots allow patches to increase their covered area while safeguarding their persistence [6].
C. arvense produces seeds; however, under arable and ruderal conditions, dispersal via clonal propagules is described as prevalent [7,8]. Genetic diversity within fields and patches is proven [9]. Hence, patches can potentially grow with generatively and vegetatively reproduced units. While long and medium-distance dispersal on a landscape scale, e.g., from field margins into fields, demands modelling the full population dynamics [10], short-distance growth of small existing patches on a field scale is addressed by repeated monitoring [11]. Despite the prominent and visible field establishment of thistle patches, field trials are standardly designed with systematically located treatment plots, not accounting for existing patches [12,13,14]. In these plots, mainly shoot numbers and shoot biomass are assessed to evaluate the effectiveness of control treatments [12,14,15,16,17], regardless of the fact that patches also change in size [18]. The drawback of this method is that expanded or downsized patches are not accounted for and thus may be overlooked in evaluating treatment effects.
Creeping thistles are considered problematic in temperate regions of the world, causing yield losses in both conventional [19] and organic arable [20,21] systems. Chemical weeding in conventional [22] and inversion tillage by ploughing in organic farming [17] have so far been the primary practices to control C. arvense. Chemical weeding will be restricted in the near future [23,24]. Costly, intensive tillage operations increase the risk of soil erosion and leaching [25]. Alternatives in C. arvense control that limit the need for chemical weeding and inversion tillage are therefore needed. Non-chemical control of thistles usually combines the principles of disturbance and competition without the use of herbicides. As C. arvense is very sensitive to light competition, suppression by cover crops grown in the period between two main crops is a reasonable control treatment [26,27,28]. When periods of crop competition were extended by cover crops, e.g., clover grass mixtures, reductions of thistle biomass up to 69% indicated satisfactory control [12]. Another concept is disturbing the soil belowground [24,29,30]. Repeated disturbance of the soil and enhanced competition are concepts competing for the period between the main crops [22,24]. Creeping roots in the soil of arable fields are disturbed not only by ploughing, which fully inverts the soil, but also by cutting roots with minimal soil inversion [17,31,32,33]. Root cutting showed the first promising results in a two-year field study without a crop [29]. C. arvense shoot numbers were reduced by 75% and patch sizes by 90%. These effects were similar to those of ploughing [17,22]. Nevertheless, the root-cutting concept remains to be tested in field experiments and practical applications. In general, root-cutting treatments can be implemented between two crops, often called the stubble period.
Monitoring patches manually is time-consuming and labor-intensive because patches can be large and rapidly expand over time. Using UAVs (Unmanned Aerial Vehicles) has become a widespread technology in arable farming [34]. UAV-based weed monitoring is described as being accurate, flexible, and cost-effective [35,36,37]. As thistles occur in patches, mapping them with UAV-based cameras is promoted in research [11,34,38] and considered suitable for practical applications [11]. In cereals, off-the-shelf UAVs with RGB cameras pre-harvest detected patch sizes and coverage with approximately 90% accuracy compared to visual observations—as long as the green vegetation mainly consisted of C. arvense [11,34,39]. UAV thistle patch mapping can therefore potentially be used to investigate the growth pattern of thistles accurately and efficiently in response to control treatments.
Here, we present a field experiment based on non-chemical weed management practices relying on disturbance and competition. We established cover crops for competition, disturbed plots by either inversion tillage or root cutting, and combined the methods in seven treatments. The thistle patches were treated non-chemically over two years (2019–2021). In order to consider the special features of creeping perennials, we designed the field experiment based on existing patch patterns. Hence, instead of fixed plots of the same size, patches of variable sizes constituted plots. To our knowledge, this approach has not been implemented in previous studies before. We monitored patches by manual GPS (Global Positioning System) measuring on the ground and by digital-based UAV methods.
We hypothesized that: (1) Uncontrolled thistle patches develop not only more shoots and more cover but also expand in size over time. (2) Evaluating both patch size and thistle characteristics within patches changes the rating of non-chemical control treatments effects. (3) Thistle patch sizes and thistle characteristics within patches can be monitored accurately enough using UAV-based cameras.

2. Materials and Methods

2.1. Experimental Site

This study was conducted over two years (summer 2019–summer 2021) in northeastern Germany (Figure 1). The experimental field (location ‘Dummerstorf’, district of ‘Rostock’ in the state of Mecklenburg–West Pomerania) is located 20 km from the Baltic Sea at 37 m above sea level (54°1′ N, 12°14′ E). The site has a cool, temperate, and moist climate. Mean precipitation (Apr–Sep 2019–2021) was 367 litres m−2. The soil type is sandy loam. The 10-year average temperature was 9.95 °C. The field was conventionally managed for at least 20 years before setting up the experiment. Crops in these years were cereals, winter oilseed rape, sugar beets, and grain legumes in changing rotations.

2.2. Experimental Set Up

We started the experiment in July 2019. The field was cropped with lupins (Lupinus angustifolius) that year. Seed rate was 65 seeds m−2. Close to the lupin harvest, we monitored thistle patches. Individual thistle patches were mapped by (i) UAV (DJI P4, DJI, Shenzhen, China), (RTK, image sensor 1” CMOS, 20 MP, objective 8.8 mm) and (ii) GPS (Pentax-GNSS, Getac-PocketPC, Pentax, Tokyo, Japan) on the ground. GPS measurements were obtained by physically surrounding each patch in the field and setting the signal manually.
After the harvest of the lupins, we established experimental plots in such a way that each plot included one thistle patch. This was possible at the expense of similar plot sizes. Thirty-two plots were arranged in a factorial design with eight treatments and four replicates. Surrounding shoots with a distance of >2.5 m were considered independent from the given patch. Between neighbouring patches, a distance of >2.5 m was kept. At the beginning of the experiment (2019), the mean patch size was 38 m2, ranging from 9.56 m2 to 99.42 m2 (Figure 2), and the mean shoot density was 41.46 m−2, ranging from 34 to 51 m−2. Spring wheat was cropped in 2020 and 2021; the seed rate was 180 kg ha−1. The seedbed to sow the wheat was prepared by a single run of a field cultivator (10 cm depth).
Patches were distributed to each of the treatments in such a way that no significant differences in patch size or shoot density between treatments occurred at the beginning of the experiment. All patches covered an area of 1200 m2 in total. The whole experimental field was 500 m x 40 m, hence the two hectares.
In the autumn of 2019, we started the treatments. Treatments stayed on the plots during the two years of wheat cropping. Treatments were:
-
Untreated control (UC)
-
Cover crop (CC)—Sowing white mustard in September at a seeding rate of 25 kg ha−1
-
Root cutter (RC)—Root cutting in autumn (10 cm depth) and spring (20–25 cm depth)
-
Plough (PL)—Mouldboard ploughing in spring (20–25 cm depth)
-
Root cutter + Cover crop = (RC + CC)
-
Plough + Cover crop = (PL + CC)
-
Plough + Root cutter = (PL + RC)
-
Plough + Root cutter + Cover crop = (PL + RC + CC)
In the treatments with root cutting (RC), a prototype machine, “The Kverneland horizontal root cutter”(Kverneland, Klepp, Norway), went through the soil belowground without inverting. This machine fragments the root and below-ground shoot parts of thistles without inverting the soil. Almost completely flat, wide, and inflexible duckfoot blades facilitate these cuttings. Ploughing was conducted by a six-sheered mouldboard plough (Grégoire-Besson, Montfaucon-Montigné, France). In spring, root cutting and ploughing were performed before sowing the crop. In summer, root cutting was performed after shallow tilling with a field cultivator and a disc harrow (Table 1).

2.3. Weed Assessments

We assessed the thistle infestation of each plot with five variables:
  • “Shoot density”—counted shoots m−2, 10 subplots of 1 m2 per plot
  • “Shoot height”—measured shoot height in cm, 10 randomly chosen shoots per plot
  • “ExpansionGPS”—measured patch expansion (m2) monitored with GPS
  • “ExpansionUAV”—patch expansion (m2) camera monitored with UAV
  • “CoverageUAV”—estimated % of cover by thistle, plots divided into subplots of one m2 assessed in photographs taken by UAV.
“CoverageUAV” was assessed based on RGB and multispectral images [34]. The flight altitude was approx. 50 m, resulting in a ground resolution of 1 cm for the RGB images and 5 cm for the multispectral images. Hence, assessments were either manual evaluations on the ground (“Shoot density”, “Shoot height”, “ExpansionGPS”) or UAV-based evaluations (“ExpansionUAV”, “CoverageUAV”). All variables were measured in the first week of July in 2019, 2020, and 2021 close to the harvest of the field crop.
We used the measured values of summer 2019 as the starting values of each plot for all variables. Thus, relative changes between starting values in 2019 (Xp2019) and end values in 2021 (Xp2021), given per plot (p), were calculated. These relative changes have no dimension because units get cancelled out.
Y p = X p 2021   X p 2019  
X = Shoot density|ExpansionGPS|Shoot height|CoverageUAV, p = plot 1–32.
Values below 1 indicate a decrease, and values above 1 an increase of the given variable between 2019 and 2021. The relative differences of each thistle variable include the conditions at the start of the experiment while accounting for the absolute changes compared to the start value.
We fitted a separate calculation for each variable, resulting in the respective relative changes of “Density”, “Expansion”, “Height”, and “Coverage” as response variables (Yp).
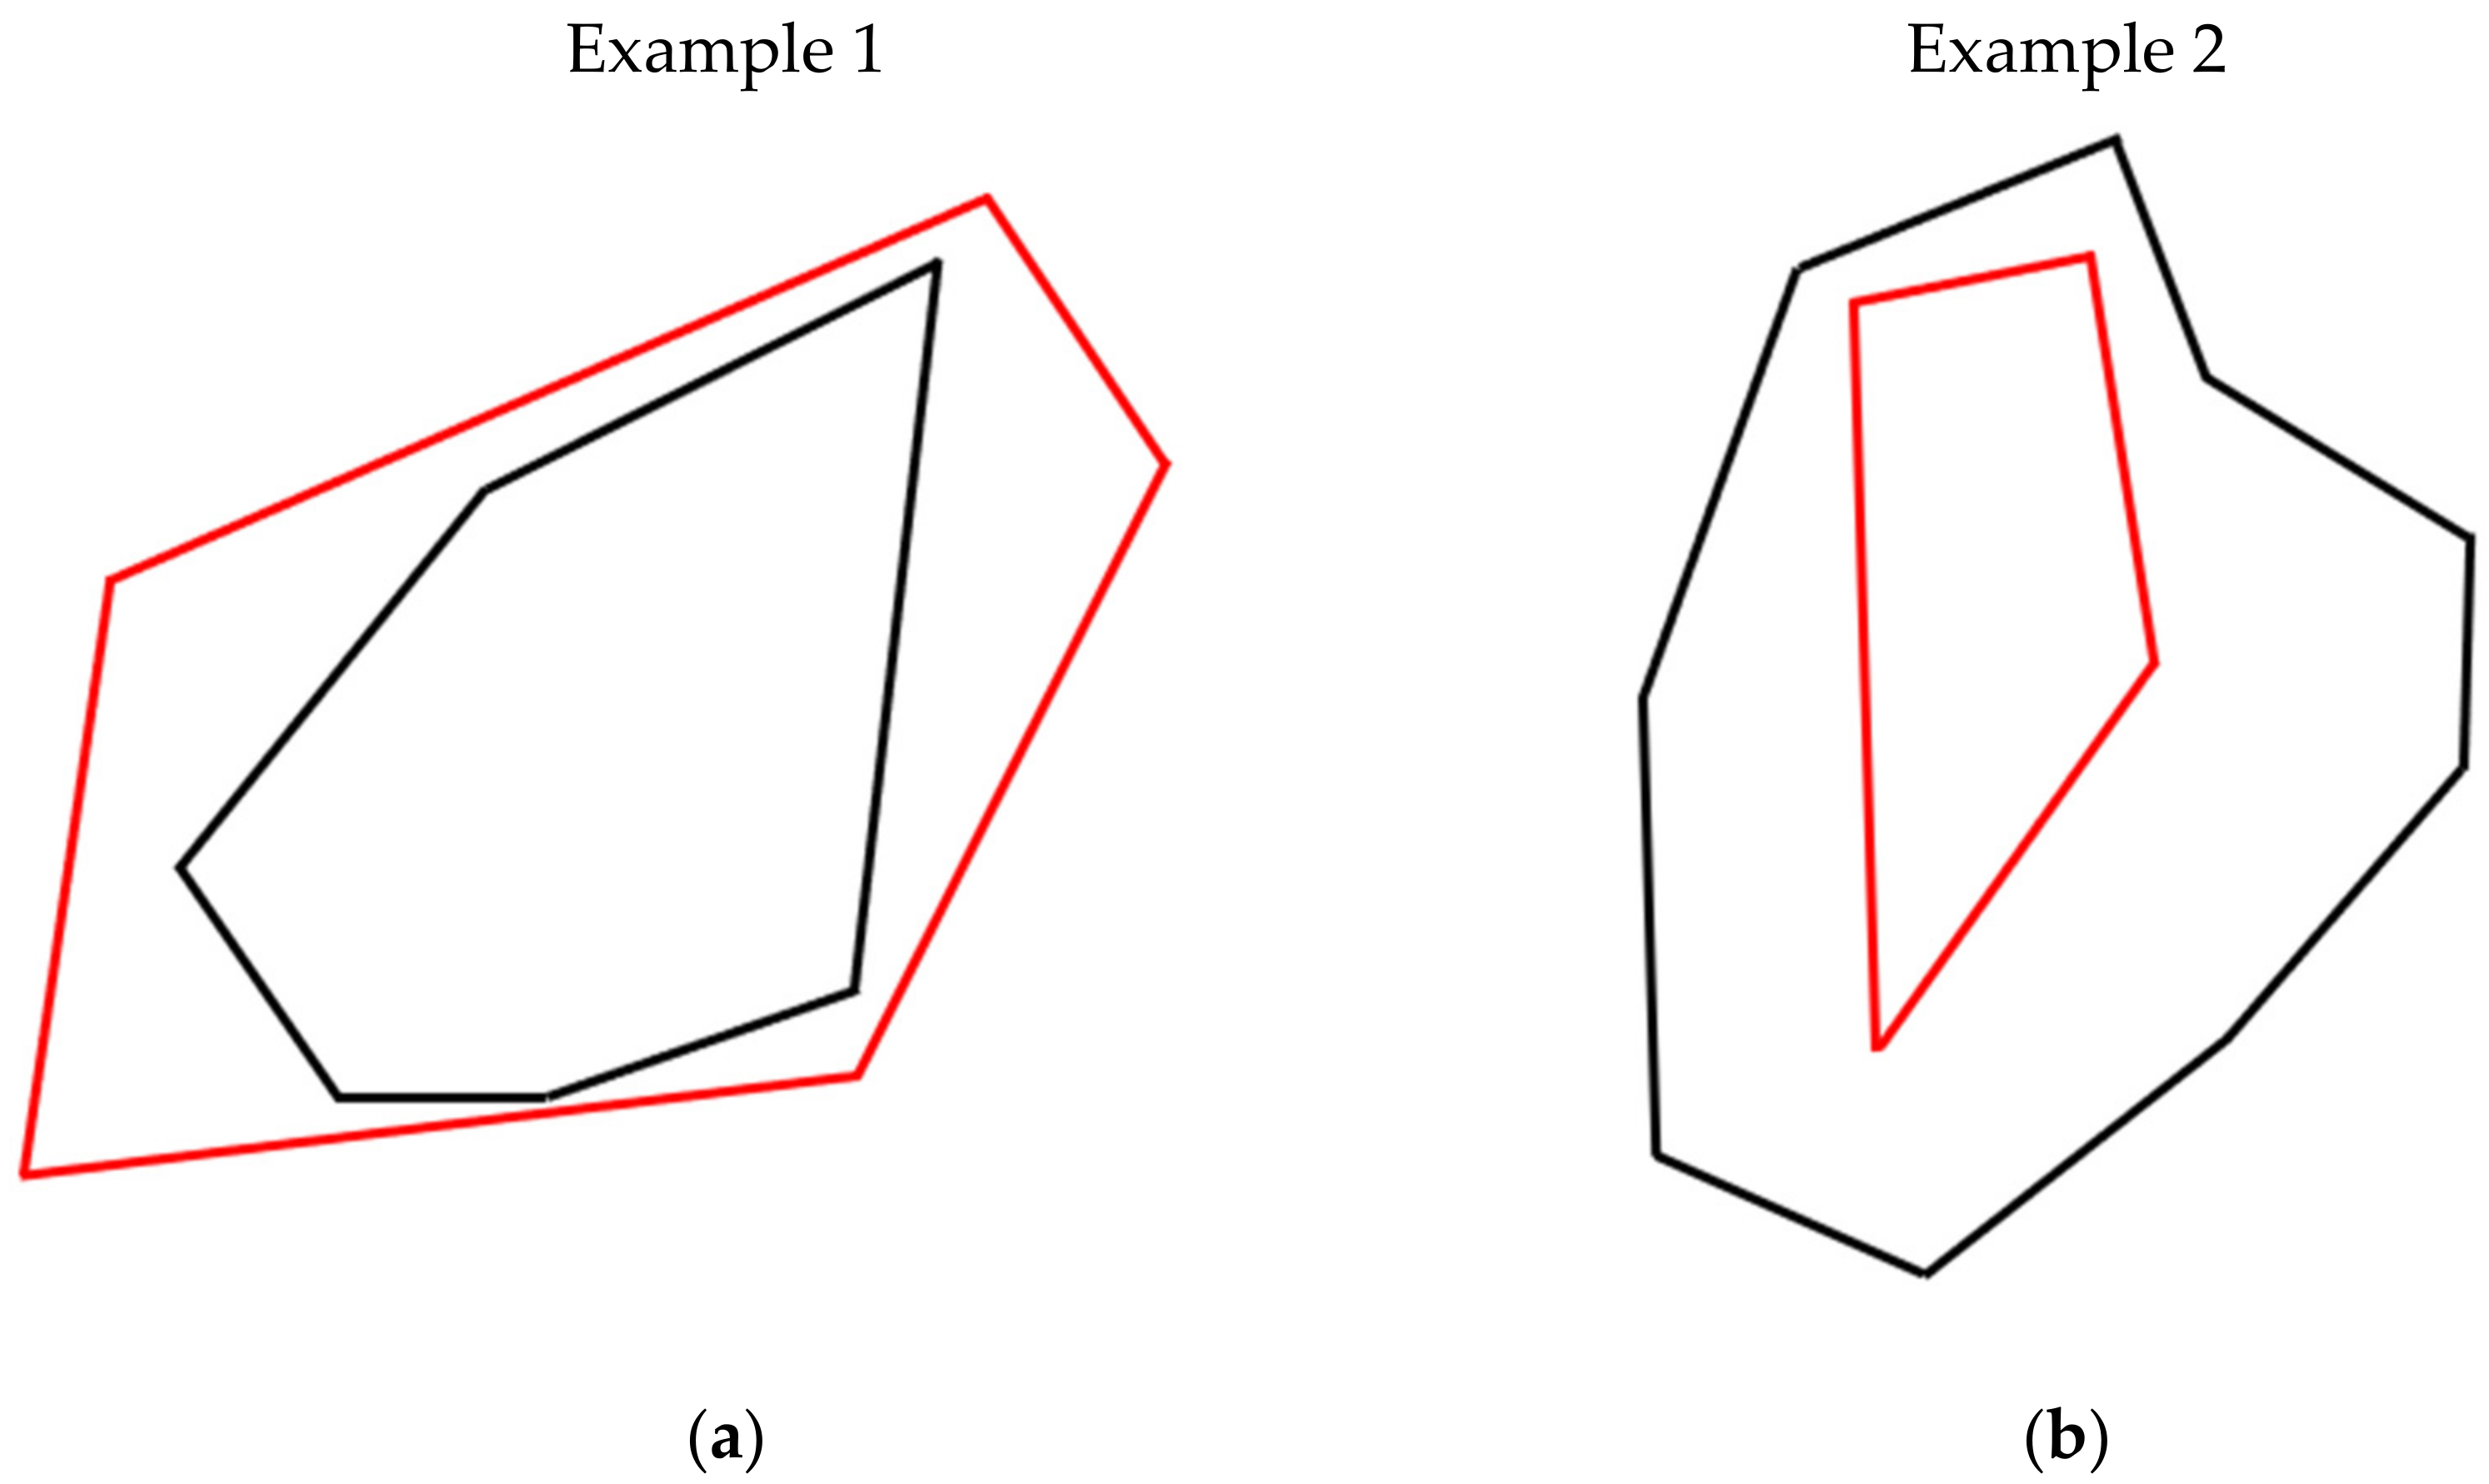
Figure 3 selects two plots to illustrate the variable “Expansion”. In example 1, the patch increased in size from 73 m2 to 95 m2 (“Expansion” = 1.32, absolute difference +22 m2), whereas in example 2, it decreased in size from 85 m2 to 21 m2 (“Expansion” = 0.25, absolute difference −64 m2). The example patch 2 was reduced by a factor of 0.25.
In August 2019, the starting patch sizes were also monitored by a UAV-based camera (at this date, thistles were growing in lupins). In 2020 and 2021, thistle patches were UAV-monitored in the wheat crop.

2.4. Statistical Analyses

Linear models were used to estimate the relationship between treatments and each variable with the respective “Density”, “Height”, “Expansion”, and “Coverage” as response variables:
Yp = α + β × TRp + ε
Y = Density | Expansion | Height | Coverage, p = plot 1–32.
With the variable plot p, TR is the effect of the treatment in plot p, and epsilon is the error term. Intercept is defined as α (treatment ‘Untreated control’, UC) and (β) measuring the change for “Density”, ”Expansion”, ”Height”, and ”Coverage” with respect to the treatment (TR).
A factorial ANOVA (PL, RR, CC) with all three-way interactions of the applied factors was carried out with the variables “Density”, “Height”, “Expansion”, and “Coverage”.
Linear regressions were used to test the relationship between two pairs of response variables (“ExpansionGPS” and “ExpansionUAV”, “Shoot density” and “CoverageUAV”). These regressions used plot-specific assessments for three years.
Statistical software R (version 4.2.1) was used for statistical analyses and scientific graphics [40]. The following packages were included: agricolae (non-parametric Kruskal-Wallis test; [41]); and lme4 and lmerTest (linear regression models; [42]).

3. Results and Discussion

3.1. Measuring Thistle Response

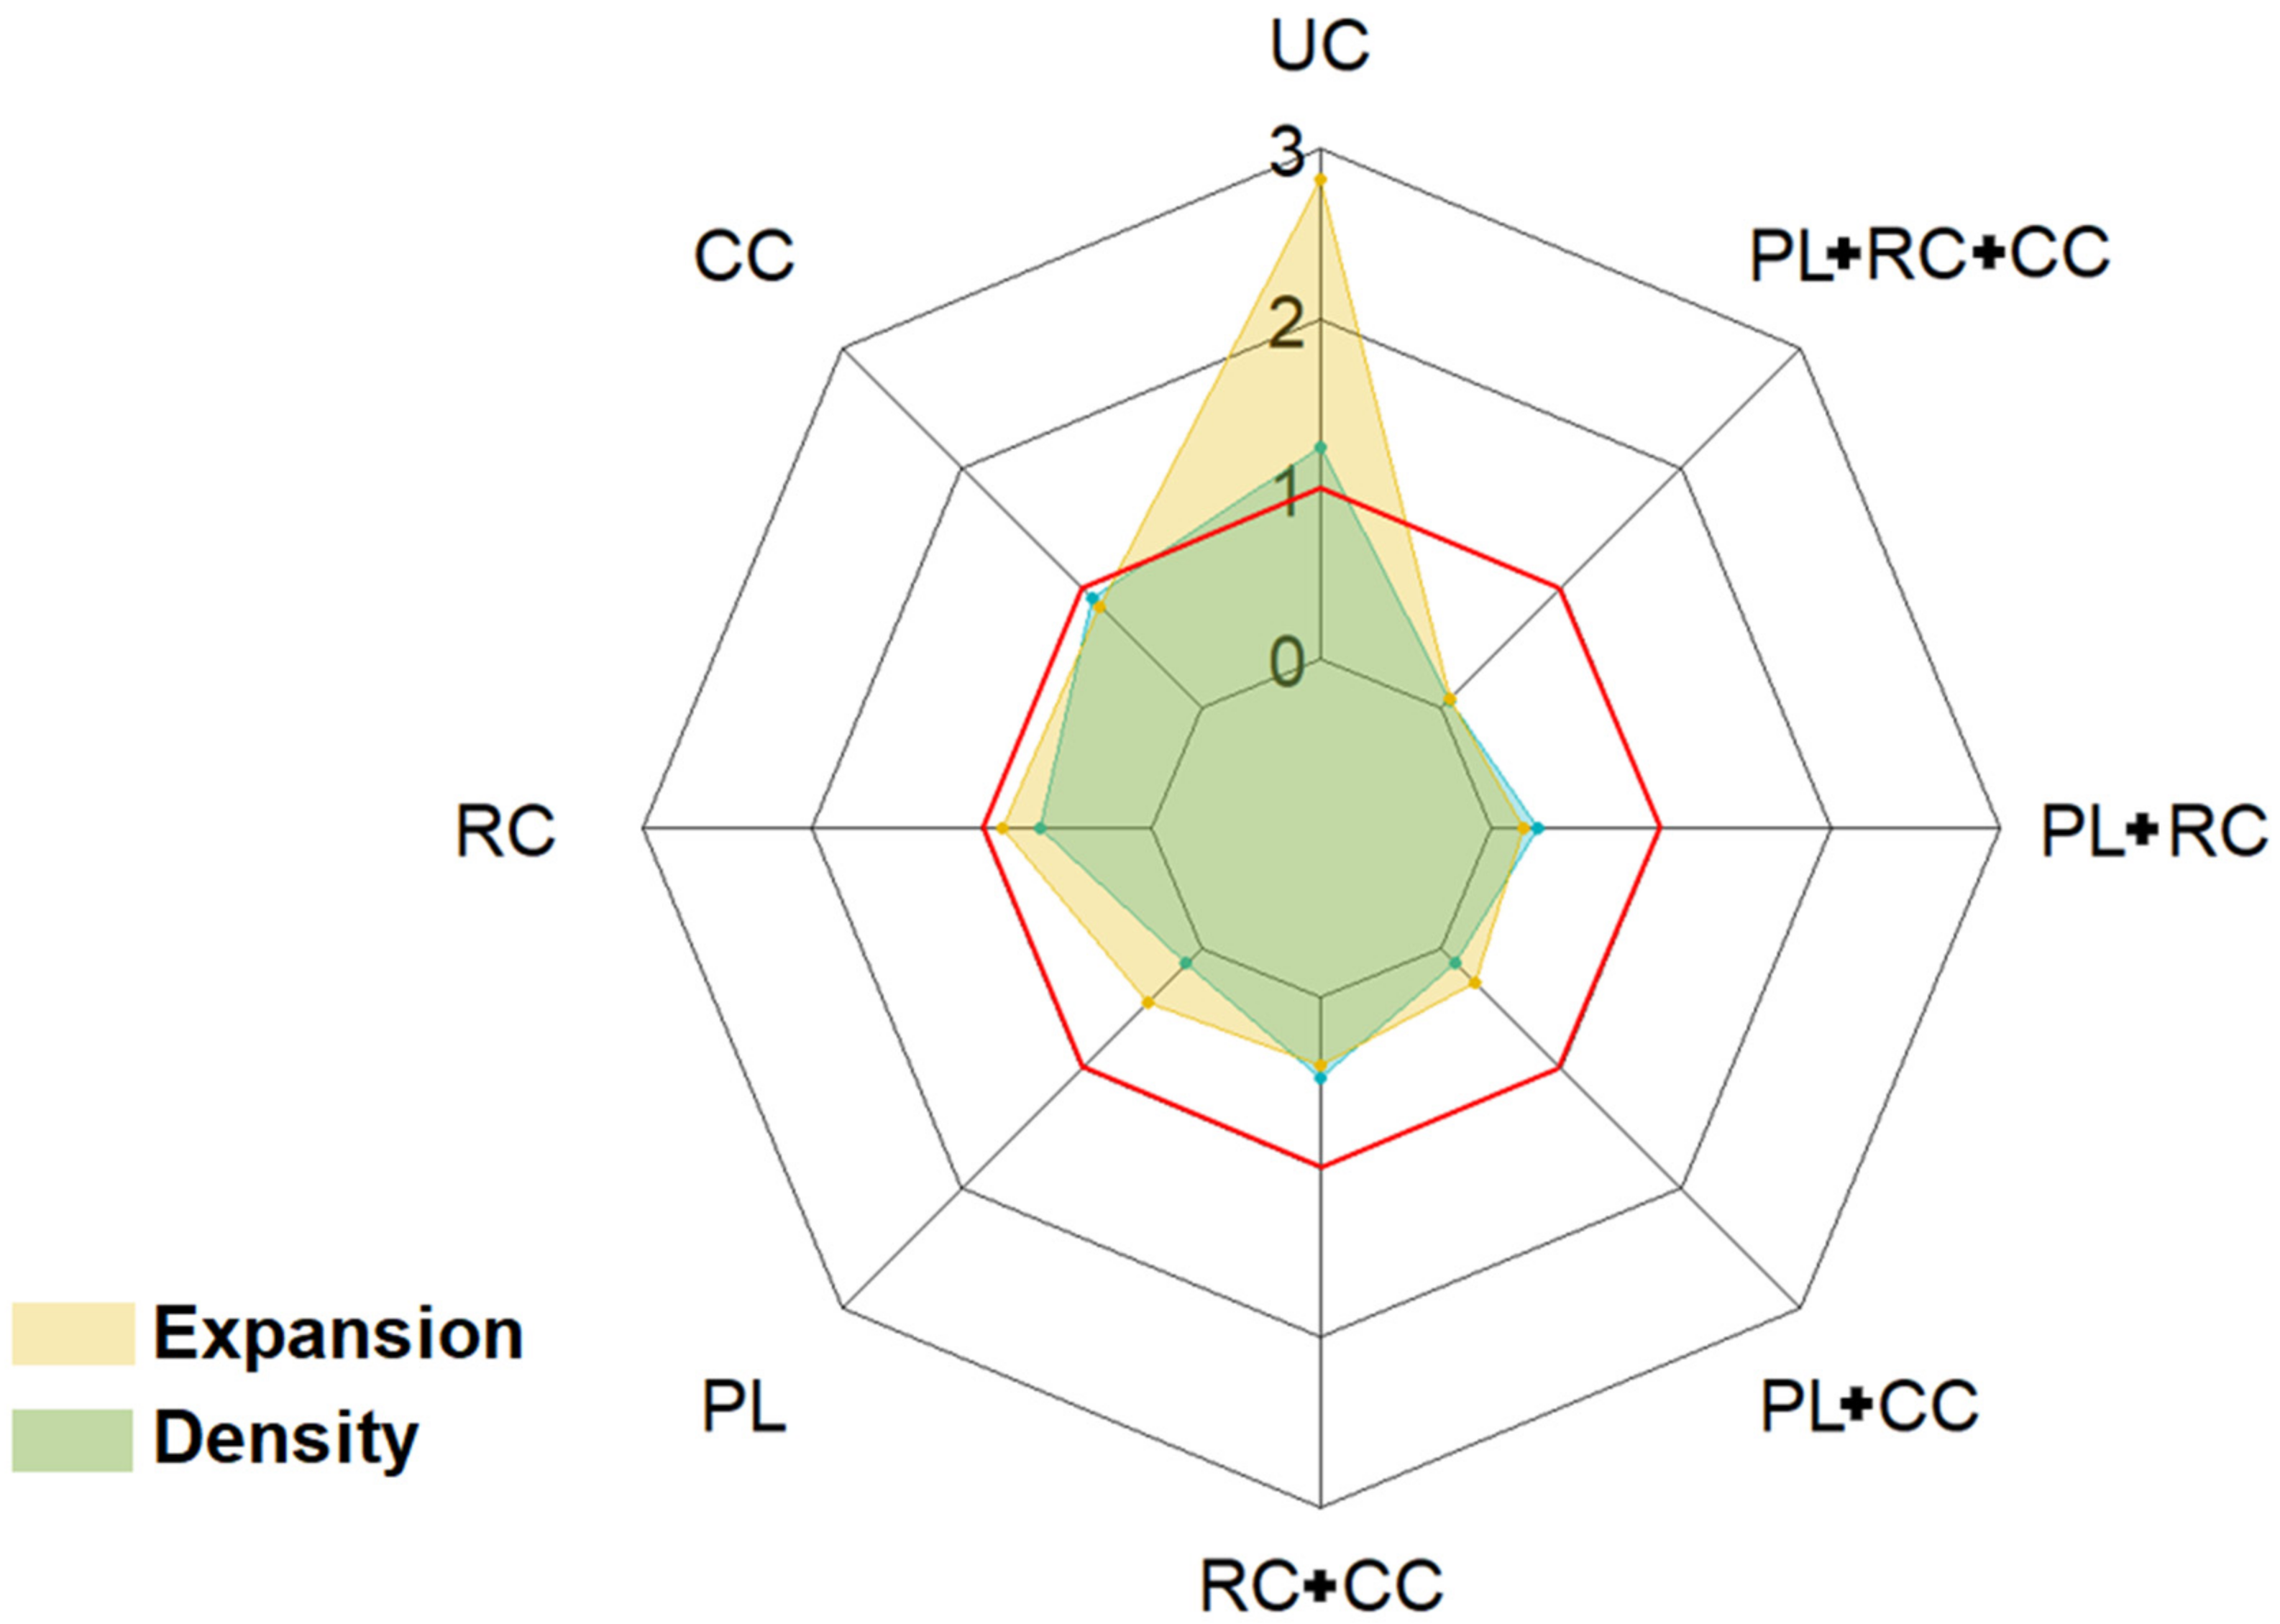
When illustrating the mean values of the response variables “Expansion” and “Density” in a radar plot (Figure 4), the different shape and spike for “Expansion” become immediately obvious. When untreated (UC in Figure 4), the thistle patch’s “Expansion” almost tripled in two years, while the “Density” within the patch changed to a much smaller extent.
Evaluating changes in the response variable “Expansion” was possible at the expense of an accurate, spatially arranged design. Rather, the spatial coordinates of the plots were defined by the species growth patterns. Consequently, the initial plot size differed due to the existing patch pattern, but any effect on the patch expansion throughout the two-year experimental period would not have been recognized without this effort. In quantity, the patches in untreated (UC) increased in their “Expansion” by a factor of 2.83 in the two-year experimental period (2019–2021). This development confirms the known growth patterns of the species. The root system of C. arvense is capable of spreading by one to six meters per year [26,43,44,45]. Below-ground root spread is reported to be up to six meters per season [26,43,45], demonstrating the quick “Expansion” potential of thistle patches. Therefore, we confirm our first hypothesis that uncontrolled thistle patches develop not only more shoots and more cover but also expand in size over time.
While monitoring the “Expansion” of existing patch patterns has previously not been taken into account for perennial weeds, this is more common in other research fields. When investigating plant–pathogen interactions, patches of plants serve as hosts, and diseases occur and spread in a patchy character [43,46,47]. Applications with plant pathogens use both the spatial scale and the intensity of the patchiness of disease. Understanding the spatial scale as well as the intensity of patchiness of disease are key factors in understanding plant–pathogen interactions and the effects of host plant patch size [46]. Transferred to the case of creeping perennial weeds, the response variable “Expansion” gives the spatial scale, while “Density”, “Height”, or “Coverage” describe the intensity.
Accounting for existing thistle patches can be limited when multiple treatments are tested. In our case, 32 patches were needed to implement eight treatments in a random design with four repetitions. The average initial patch size of 38 m2 meets plot sizes of 15 m2 to 48 m2 used by other authors in fixed plot designs with similar amounts of treatments [11,12,17,48].
Despite the obvious benefit of measuring patch “Expansion”, setting up a field experiment becomes much more challenging as enough thistle patches are required to establish the plots. Achieving this means either searching for opportunities for existing patches on a landscape level or establishing patches of the creeping perennials on the fields of a research station via planting. We went the first way, which is most promising in the usual three-year project time structure. Relying on new patches established in experimental fields definitely requires a planning perspective of more than three years, and establishment success is not guaranteed.

3.2. Treatment Effects

In Table 2, the treatment effects on the thistle variables contrasted to the untreated control (UC) are estimated in a linear model. All treatments reduced the “Expansion” of the patches and the “Density” of shoots within the patches significantly compared to UC (Table 2). Comparing estimates of the treatments with UC reveals that after disturbance by ploughing (PL, PL + CC, PL + RC, PL + RC + CC) “Density” is reduced by the factor 0.15 and “Expansion” by 0.25, while treatments without ploughing (CC, RC, RC + CC) had smaller effects with 0.68 for “Density” and 0.71 for “Expansion”. The “Height” of the shoots was also reduced in all treatments, significantly in four of them (PL, RC + CC, PL + RC, PL + RC + CC). The “Coverage” of thistles within the patches did not change significantly.
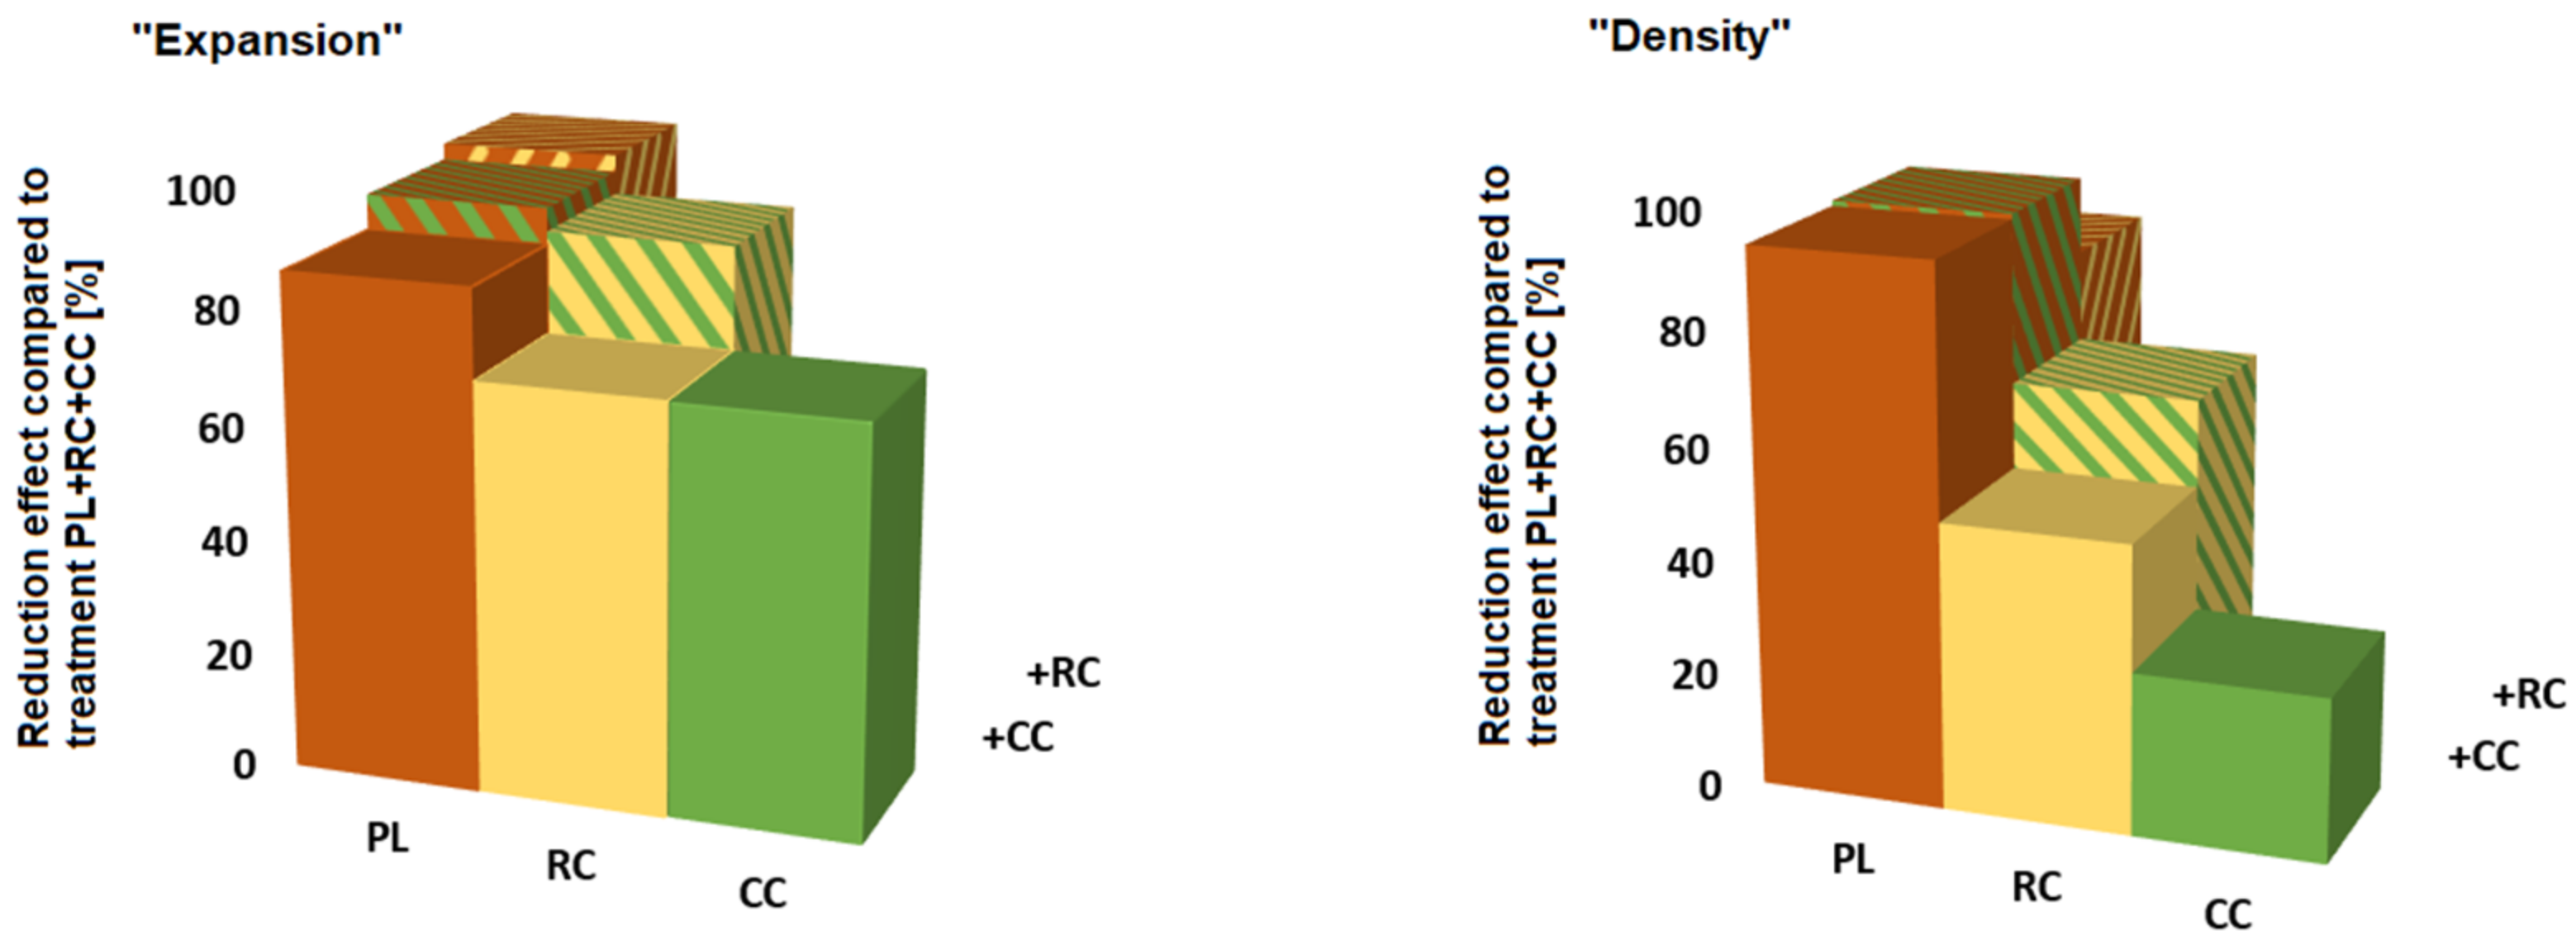
The three single factors (plough, root cutter, cover crop) as established in the treatments significantly affected “Expansion” and “Density” (Appendix A, Table A1). Significant interactions between two factors were found when ploughing was involved. PL reduced “Expansion”, “Density”, “Coverage”, and “Height” significantly. Combining RC and CC with ploughing (treatments PL + RC and PL + CC) increased the effects. However, the values are lower than the summed effect of the two factors. In the combined treatment RC + CC, the effects of RC and CC are roughly added; thus, no interaction occurred. Regardless of the response variable, the treatment PL + RC + CC—combining three control measures—reduced the thistle infestation to the highest degree (Table 2). This result does not depend on an interaction, as the three factors did not interact (Appendix A, Table A1). Therefore, we calculated the reduction of the other control treatments relative to this most effective treatment. Figure 5 compares the treatment reduction effects estimated in the linear models on the response variables “Expansion” and “Density”.
Treatments including ploughing (PL, PL + CC, PL + RC) reduced “Density” and “Expansion” more than those without ploughing (Figure 5). Adding root cuttings or cover crops did not further increase the reduction effect of ploughing. Root cutting alone (RC) reduced both “Density” (50.4%) and “Expansion” (70.7%) only moderately. Treatments with competition by cover crops (CCs) impacted “Expansion” more clearly than “Density”. When cover crops were combined with root cutting (RC + CC), “Expansion” was almost additively reduced, resulting in a reduction comparable to that in the ploughed treatments. “Height” was also additively reduced by the combination RC + CC, but the effect was still smaller than that of ploughing (see Table 2). Root cutting has been shown to reduce “Expansion” and “Density” without reducing “Height” [29]. When root cutting frequency was increased to more cuttings than required to reduce “Density” and “Expansion”, “Height” was reduced, too [29]. This was attributed to a higher depletion of root reserves by repeated cutting, in which thistles first reduced “Expansion” and “Density” before giving up on “Height”. This further strengthens the observation that ploughing is the superior treatment to root cutting in reducing thistle infestations.
The effect of the combined treatment (RC + CC) on “Density” was much smaller than on “Expansion”. Cover crops were dense, reaching more than 90% coverage six weeks after sowing. C. arvense plants that were in late summer/autumn were quickly overgrown by the closing canopy. C. arvense is known to be very sensitive to light competition [14,49]. When exposed to light competition, plants can escape competition laterally, thus expanding the patch vertically by growing taller than the cover crop or by promoting competitive dominance by, e.g., increasing shoot density [50]. C. arvense shoots barely elongate in late summer/autumn [4] and thus cannot escape vertically. Laterally escaping was unlikely as cover crops covered a far greater area than just the area of the given patch. This puts more emphasis on strengthening competitive dominance by focusing on “Density”, as outgrowing the cover crop laterally was not possible. Likely, this explains the higher control effect on “Expansion” than on “Density” by treatment CC. Thus, the variable “Density” is most promising to characterise the effect of the treatments on the quality of the thistle patches, while the variable “Expansion” characterises the effects quantitatively. While patch size changes (“Expansion”) were crucial to understanding what happened in the untreated control (Figure 4), the differences between treatments measured as “Expansion” and “Density” were at first glance less pronounced. However, a joint evaluation revealed that using both “Expansion” and “Density” to elaborate the control effects of the treatments was better than relying just on one of them.
Using shoot “Density” measurements to rank the effectiveness of thistle control treatments is common [14,51]. Nevertheless, without measuring “Expansion” the treatment effects would have been evaluated differently, which confirms our second hypothesis: Evaluating both patch size and thistle characteristics within patches changes the rating of non-chemical control treatments effects. Especially the effects of cover crops alone and in combination with other treatments would have been severely underestimated without the effort to measure “Expansion”. Combinations of competitive cover crops and disturbance treatments were proven to suppress C. arvense shoot densities [32,51]. Our results indicate that these effects can be even more pronounced when including “Expansion” measurements.
Effective treatments always included disturbance treatments (PL or RC), with ploughing having a much greater impact than cutting. Both treatments attempt to cut root fragments. Root cutting can decrease the intensity of C. arvense infestations [29], but ploughing additionally inverts the soil, thereby burying root fragments. Smaller C. arvense root fragments regrew less vigorously than larger ones if buried as deep as with ploughing [52]. Sprouts of smaller and less vigorous root fragments seem unable to reach the soil surface from these depths. Thus, compared to root cutting, ploughing is the superior thistle control treatment to reduce “Density”. When combined with cover crops, the effect of ploughing hardly changed, while together with root cutting, the effect on “Density” almost doubled (Figure 4).
Summing up, evaluating the treatment effects of thistle management with a measurement of the patch size together with a sample measurement of the thistle intensity was valuable because the special features of the creeping perennial species were accurately addressed.

3.3. UAV Monitored Thistle Response Variables

Using UAV-based measurements in our experiment delivered two response variables related to patch size and patch intensity: total patch size per plot (“ExpansionUAV”) and the coverage of a sample measurement within the patches (“CoverageUAV”).
We used the patch sizes monitored by manual GPS measurements on the ground (“ExpansionGPS”) to check those by UAV-based cameras (“ExpansionUAV”). Total patch size UAV-measured close to harvest was almost perfectly correlated with GPS-ground measurements (Table 3).
UAV monitoring of thistle patches was proven to be quite accurate [34], but this correlation is astonishing. Plots and, thus, patches were visited several times during the growing season of the spring wheat. These visits probably resulted in small tracks. We expect that these small tracks assisted the UAV camera trace exactly the size of the patches. Nevertheless, with respect to the results of [34,53], there is no reason not to trust in a reliable picture of thistle patch sizes by UAV monitoring. In our experiment, GPS monitoring manually took 8 h for all patches. UAV monitoring needs several steps, from flying the UAV to interpreting the annotated images, but is still more time-efficient than manual GPS measurements. UAV monitoring is expected to become even faster, especially through improved detection methods allowing for higher flight altitudes and improved image processing programs [34,54].
UAV-monitoring also delivered the variable “CoverageUAV”. The values of this could be an alternative to manually evaluating “Shoot density” on the ground. The linear regression of “Shoot density” and “CoverageUAV” in our experiment also revealed a significant relation (Table 3). This result indicates the possibility of making intensity assessments within thistle patches easier and more time-efficient. Unfortunately, the linear relation between these two response variables is not yet ideal to predict shoot density with “CoverageUAV”. First, the relation cannot be linear because shoot density can increase continuously while coverage as a relative metric has an upper limit. However, in our data, no non-linear regression yielded a stronger correlation than the linear one. Secondly, the linear regression left the first ten shoots without any coverage in the UAV-based measurements (Table 3). The significant intercept of 10.3 (Table 3) means that thistle shoots measured on the ground were systematically overlooked by the “CoverageUAV”. Shoot “Density” was manually monitored pre-harvest in dense crop stands. The human observer in the field has a three-dimensional view of the crop stands and acts closer to the crop stand. Thistle shoots almost covered by the crop were monitored on the ground (“Density”), while these could not be identified as thistle coverage by the UAV-based camera [34,39]. This also explains why Table 2 did not show any significant differences between treatments for “Coverage” while “Density” did.
Replacing reference data traditionally collected on the ground with data from aerial observations requires the so-called ground truthing of the latter [55]. The third hypothesis is linked to this requirement. Based on our results, we confirm that patch size was reliably monitored using UAV-based cameras but not intensity (“Shoot density”, “CoverageUAV”) within patches. However, the presented ground truth is promising for future applications. Patch size monitoring is ideal for UAV imaging. Monitoring thistle intensities within the patches presupposes much more precise thistle identification. Higher resolutions in the camera, a lower flight height, or more time over a patch may assist to overcome the current limits we experienced in our experiments.

4. Conclusions

Uncontrolled thistle patches developed not only more shoots and more cover but also expanded in size over time. Evaluating both patch size and thistle characteristics within patches changed the rating of non-chemical control treatments effects. Root cutting in combination with cover crops was as effective as ploughing in reducing patch sizes. Therefore, monitoring patch size changes proved vital in accurately determining infestation levels and treatment effects on C. arvense. Thistle patch sizes could be monitored accurately enough using UAV-based cameras, while monitoring thistle characteristics within patches has to be improved.
Our results demand that we innovate the methodology of field experimental research when controlling patch-forming creeping perennial weeds on arable fields. These demands are challenging. Planning experiments will become more complicated. The need for enough patches will limit small-scale field experimental set ups in a classical plot design. Patches in fields suitable for experiments must be known. Monitoring with technologies such as UAV or even satellites will assist in acquiring fields with weed patches to set up experiments. During the experiments, UAV-based camera technologies will collect the weed data in the future. Efforts to improve UAV monitoring should target thistle intensities within the patch, as patch size monitoring already gives reliable data. Hence, technological innovations can pave the way to address patchy creeping perennial weeds in field experiments more accurately.
Nevertheless, these experiments will stay more demanding, at least for a while. Testing very effective control methods, such as spraying non-selective herbicides, would probably not justify the efforts. However, in times of pesticide reduction programs, bans of active herbicidal ingredients, and increased public interest in how fields are farmed, alternative control methods are required. These have other efficacies by nature, as our results indicated. We conclude to search for technological innovations in order to evaluate these efficacies as accurately as possible.
New experimental efforts will pay off in new and reliable results to support farmers in times of changing paradigms for weed control on arable fields.

Author Contributions

Conceptualization, M.M.W., S.A. and B.G.; Validation, M.M.W. and S.A.; Formal analysis, M.M.W. and S.A.; Data curation, M.M.W. and S.A.; Writing—original draft, M.M.W.; Writing—review & editing, S.A. and B.G.; Visualization, M.M.W.; Supervision, S.A. and B.G.; Funding acquisition, S.A. and B.G. All authors have read and agreed to the published version of the manuscript.

Funding

This project has received funding from the European Union’s Horizon 2020 research and innovation programme under grant agreement No 771134. The project AC/DC-weeds was carried out under the ERA-NET Cofund SusCrop (Grant N°771134), being part of the Joint Programming Initiative on Agriculture, Food Security and Climate Change (FACCE-JPI).

Data Availability Statement

Data is available on request by the first author.

Acknowledgments

We sincerely thank our colleagues in the Crop Health group at the University of Rostock for their technical assistance. We thank Goerres Grenzdoerffer and Matthias Naumann from Faculty of Agricultural and Environmental Sciences Geodesy and Geoinformatics, University of Rostock, for conducting all UAV-flights. We thank Jesper Rasmussen and Saiful Azim from the University of Copenhagen for UAV-Image processing and analyzing. We thank Gut Dummerstorf GmbH for providing the experimental field and their technical assistance.

Conflicts of Interest

The authors declare no conflict of interest.

Appendix A

Table A1. Factorial ANOVA (PL, RC, CC) for thistle variables. The p-value column shows the p-value for each individual factor and the interactions between the factors. Bold values denote statistical significance at the p-value < 0.05 level.
“Expansion”“Density”“Coverage”“Height”
Factorp-Value
PL<0.001<0.0010.0390.001
RC0.0050.0020.5150.431
CC0.0080.0110.9590.638
PL:RC0.047<0.0010.8510.372
PL:CC0.0330.2710.9520.036
RC:CC0.1220.8480.2410.111
PL:RC:CC0.1450.1920.8860.081

References

  1. Holm, L.G.; Plucknett, D.L.; Pancho, J.V.; Heisenberger, J.P. The World’s Worst Weeds: Distribution and Biology. Q. Rev. Biol. 1978, 53, 319–320. [Google Scholar] [CrossRef]
  2. Leth, V.; Netland, J.; Andreasen, C. Phomopsis cirsii: A potential biocontrol agent of Cirsium arvense. Weed Res. 2008, 48, 533–541. [Google Scholar] [CrossRef]
  3. Eber, S.; Brandl, R. Regional pathch dynamics of Cirsium arvense and possible implications for plant-animal interactions. J. Veg. Sci. 2003, 14, 259–266. [Google Scholar] [CrossRef]
  4. Tiley, G.E.D. Biological Flora of the British Isles: Cirsium arvense (L.) Scop. J. Ecol. 2010, 98, 938–983. [Google Scholar] [CrossRef]
  5. Hamouz, P.; Hamouzová, K.; Tyšer, L.; Holec, J. Effect of site-specific weed management in winter crops on yield and weed populations. Plant Soil Environ. 2014, 60, 27–35. [Google Scholar] [CrossRef]
  6. Nadeau, L.B.; Vanden Born, W.H. The root system of canada thistle. Can. J. Plant Sci. 1989, 69, 1199–1206. [Google Scholar] [CrossRef]
  7. Heimann, B.; Cussans, G.W. The importance of seeds and sexual reproduction in the population biology of Cirsium arvense—A literature review. Weed Res. 1996, 36, 493–503. [Google Scholar] [CrossRef]
  8. Solé, M.; Durka, W.; Eber, S.; Brandl, R. Genotypic and Genetic Diversity of the Common Weed Cirsium arvense (Asteraceae). Int. J. Plant Sci. 2004, 165, 437–444. [Google Scholar] [CrossRef]
  9. Hettwer, U.; Gerowitt, B. An investigation of genetic variation in Cirsium arvense field patches. Weed Res. 2004, 44, 289–297. [Google Scholar] [CrossRef]
  10. Blumenthal, D.; Jordan, N. Weeds in field margins: A spatially explicit simulation analysis of Canada thistle population dynamics. Weed Sci. 2001, 49, 509–519. [Google Scholar] [CrossRef]
  11. Rasmussen, J.; Nielsen, J. A novel approach to estimating the competitive ability of Cirsium arvense in cereals using unmanned aerial vehicle imagery. Weed Res. 2020, 60, 150–160. [Google Scholar] [CrossRef]
  12. Graglia, E.; Melander, B.; Jensen, R.K. Mechanical and cultural strategies to control Cirsium arvense in organic arable cropping systems. Weed Res. 2006, 46, 304–312. [Google Scholar] [CrossRef]
  13. Thomsen, M.G.; Mangerud, K.; Riley, H.; Brandsæter, L.O. Method, timing and duration of bare fallow for the control of Cirsium arvense and other creeping perennials. Crop. Prot. 2015, 77, 31–37. [Google Scholar] [CrossRef]
  14. Bicksler, A.J.; Masiunas, J.B. Canada Thistle (Cirsium arvense) Suppression with Buckwheat or Sudangrass Cover Crops and Mowing. Weed Technol. 2009, 23, 556–563. [Google Scholar] [CrossRef]
  15. Gruber, S.; Claupein, W. Effect of tillage intensity on weed infestation in organic farming. Soil Tillage Res. 2009, 105, 104–111. [Google Scholar] [CrossRef]
  16. Hoeft, E.V.; Jordan, N.; Zhang, J.; Wyse, D.L. Integrated cultural and biological control of Canada thistle in conservation tillage soybean. Weed Sci. 2001, 49, 642–646. [Google Scholar] [CrossRef]
  17. Brandsæter, L.O.; Mangerud, K.; Helgheim, M.; Berge, T.W. Control of perennial weeds in spring cereals through stubble cultivation and mouldboard ploughing during autumn or spring. Crop. Prot. 2017, 98, 16–23. [Google Scholar] [CrossRef]
  18. Wilson, R.G. Canada thistle—The problem, distribution and economics. In Proceedings of the North Central Weed Conference, Moines, IO, USA, 8–10 December 1981. [Google Scholar]
  19. Schroeder, D.; Mueller-Schaerer, H.; Stinson, C.S.A. A European weed survey in 10 major crop systems to identify targets for biological control. Weed Res. 1993, 33, 449–458. [Google Scholar] [CrossRef]
  20. Riesinger, P.; Hyvönen, T. Impact of Management on Weed Species Composition in Organically Cropped Spring Cereals. Biol. Agric. Hortic. 2006, 24, 257–274. [Google Scholar] [CrossRef]
  21. Glemnitz, M.; Radics, L.; Mackensen, K. Weed management in organic farming in the new EU member states and the acceding countries—Status quo and main limitations. In Proceedings of the 3rd QLIF Congress, Hohenheim, Germany, 20–23 March 2007. [Google Scholar]
  22. Håkansson, S. Weeds and Weed Management on Arable Land: An Ecological Approach; CABI Pub: Cambridge, UK, 2003; pp. 81–193. [Google Scholar]
  23. Fogliatto, S.; Ferrero, A.; Vidotto, F. Current and future scenarios of glyphosate use in Europe: Are there alternatives? Adv. Agron. 2020, 163, 219–278. [Google Scholar] [CrossRef]
  24. Zhang, H.; Andert, S.; Brandsæter, L.O.; Rasmussen, J.; Robin, M.-H.; Salonen, J.; Tørresen, K.S.; Valantin-Morison, M.; Gerowitt, B. Future management of arable perennials—An introduction to the project AC/DC-weeds. Jul. Kühn-Inst. 2020, 464, 280–285. [Google Scholar] [CrossRef]
  25. Aronsson, H.; Ringselle, B.; Andersson, L.; Bergkvist, G. Combining mechanical control of couch grass (Elymus repens L.) with reduced tillage in early autumn and cover crops to decrease nitrogen and phosphorus leaching. Nutr. Cycl. Agroecosyst. 2015, 102, 383–396. [Google Scholar] [CrossRef]
  26. Bakker, D. A comparative life-history study of Cirsium arvense (L.). In The Biology of Weeds; Harper, J.L., Ed.; Blackwell Scientific Publications Ltd.: Oxford, UK, 1960. [Google Scholar]
  27. Edwards, G.R.; Bourdot, G.W.; Crawley, M.J. Influence of herbivory, competition and soil fertility on the abundance of Cirsium arvense in acid grassland. J. Appl. Ecol. 2000, 37, 321–334. [Google Scholar] [CrossRef]
  28. Boström, U.; Fogelfors, H. Long-term effects of herbicide-application strategies on weeds and yield in spring-sown cereals. Weed Sci. 2002, 50, 196–203. [Google Scholar] [CrossRef]
  29. Weigel, M.; Gerowitt, B. Mechanical disturbance of Cirsium arvense—Results from a multi-year field study. Jul. Kühn-Inst. 2022, 468, 79–85. [Google Scholar] [CrossRef]
  30. Tørresen, K.S.; Gerowitt, B. Late-Autumn Ramet Sprouting of Three Arable Creeping Perennial Weed Species. Agronomy 2022, 12, 2175. [Google Scholar] [CrossRef]
  31. Hakansson, I.; Steneberg, M.; Rydberg, T. Long-term experiments with different depths of mouldboard ploughing in Sweden. Soil Tillage Res. 1998, 46, 209–223. [Google Scholar] [CrossRef]
  32. Thomsen, M.G.; Brandsæter, L.O.; Fykse, H. Sensitivity of Cirsium arvense to simulated tillage and competition. Acta Agric. Scand. Sect. B Soil Plant Sci. 2011, 61, 693–700. [Google Scholar] [CrossRef]
  33. Melander, B.; Munier-Jolain, N.; Charles, R.; Wirth, J.; Schwarz, J.; van der Weide, R.; Bonin, L.; Jensen, P.K.; Kudsk, P. European Perspectives on the Adoption of Nonchemical Weed Management in Reduced-Tillage Systems for Arable Crops. Weed Technol. 2013, 27, 231–240. [Google Scholar] [CrossRef]
  34. Rasmussen, J.; Nielsen, J.; Streibig, J.C.; Jensen, J.E.; Pedersen, K.S.; Olsen, S.I. Pre-harvest weed mapping of Cirsium arvense in wheat and barley with off-the-shelf UAVs. Precis. Agric. 2019, 20, 983–999. [Google Scholar] [CrossRef]
  35. Rodene, E.; Xu, G.; Palali Delen, S.; Zhao, X.; Smith, C.; Ge, Y.; Schnable, J.; Yang, J. A UAV-based high-throughput phenotyping approach to assess time-series nitrogen responses and identify trait-associated genetic components in maize. Plant Phenome J. 2022, 5, e20030. [Google Scholar] [CrossRef]
  36. Marino, S.; Alvino, A. Detection of Spatial and Temporal Variability of Wheat Cultivars by High-Resolution Vegetation Indices. Agronomy 2019, 9, 226. [Google Scholar] [CrossRef]
  37. Duddu, H.S.N.; Johnson, E.N.; Willenborg, C.J.; Shirtliffe, S.J. High-Throughput UAV Image-Based Method Is More Precise Than Manual Rating of Herbicide Tolerance. Plant Phenom. 2019, 2019, 6036453. [Google Scholar] [CrossRef]
  38. Mink, R.; Dutta, A.; Peteinatos, G.; Sökefeld, M.; Engels, J.; Hahn, M.; Gerhards, R. Multi-Temporal Site-Specific Weed Control of Cirsium arvense (L.) Scop. and Rumex crispus L. in Maize and Sugar Beet Using Unmanned Aerial Vehicle Based Mapping. Agriculture 2018, 8, 65. [Google Scholar] [CrossRef]
  39. Ølsen, S.I.; Nielsen, J.; Rasmussen, J. Image Analysis. In Thistle Detection; Sharma, P., Bianchi, F.M., Eds.; Springer: Berlin/Heidelberg, Germany, 2017; pp. 413–425. [Google Scholar]
  40. R Studio Team (Ed.) R Studio: Integrated Development for R; PBC: Boston, MA, USA, 2022. [Google Scholar]
  41. Mendiburu, F.; Yaseen, M. Agricolae: Statistical Procedures for Agricultural Research, R package version 1.4.0; The R Project for Statistical Computing: Vienna, Austria, 2020. [Google Scholar]
  42. Bates, D.; Mächler, M.; Bolker, B.; Walker, S. Fitting Linear Mixed-Effects Models Usinglme4. J. Stat. Softw 2015, 67, 48. [Google Scholar] [CrossRef]
  43. Amor, R.L.; Harris, R.V. Seedling establishment and vegetative spread of Cirsium arvense (L.) Scop, in Victoria, Australia. Weed Res. 1975, 15, 407–411. [Google Scholar] [CrossRef]
  44. Melander, B.; Holst, N.; Rasmussen, I.A.; Hansen, P.K. Direct control of perennial weeds between crops—Implications for organic farming. Crop. Prot. 2012, 40, 36–42. [Google Scholar] [CrossRef]
  45. Tworkoski, T. Developmental and Environmental Effects on Assimilate Partitioning in Canada Thistle (Cirsium arvense). Weed Sci. 1992, 40, 79–85. [Google Scholar] [CrossRef]
  46. Burdon, J.J.; Jarosz, A.M.; Kirby, G.C. Pattern and Patchiness in Plant-Pathogen Interactions—Causes and Consequences. Annu. Rev. Ecol. Syst. 1989, 20, 119–136. [Google Scholar] [CrossRef]
  47. Yin, C.; Hulbert, S.H.; Schroeder, K.L.; Mavrodi, O.; Mavrodi, D.; Dhingra, A.; Schillinger, W.F.; Paulitz, T.C. Role of bacterial communities in the natural suppression of Rhizoctonia solani bare patch disease of wheat (Triticum aestivum L.). Appl. Environ. Microbiol. 2013, 79, 7428–7438. [Google Scholar] [CrossRef]
  48. Tavaziva, V.J.; Lundkvist, A.; Verwijst, T. Effects of selective cutting and timing of herbicide application on growth and development of Cirsium arvense in spring barley. Weed Res. 2019, 59, 349–356. [Google Scholar] [CrossRef]
  49. Wedryk, S.; Cardina, J. Smother Crop Mixtures for Canada Thistle (Cirsium arvense) Suppression in Organic Transition. Weed Sci. 2012, 60, 618–623. [Google Scholar] [CrossRef]
  50. Gruntman, M.; Groß, D.; Májeková, M.; Tielbörger, K. Decision-making in plants under competition. Nat. Commun. 2017, 8, 2235. [Google Scholar] [CrossRef] [PubMed]
  51. Brandsæter, L.O.; Goul Thomsen, M.; Wærnhus, K.; Fykse, H. Effects of repeated clover undersowing in spring cereals and stubble treatments in autumn on Elymus repens, Sonchus arvensis and Cirsium arvense. Crop. Prot. 2012, 32, 104–110. [Google Scholar] [CrossRef]
  52. Dock Gustavsson, A.M. Growth and regenerative capacity of plants of Cirsium arvense. Weed Res. 1997, 37, 229–236. [Google Scholar] [CrossRef]
  53. Forero, M.G.; Herrera-Rivera, S.; Ávila-Navarro, J.; Franco, C.A.; Rasmussen, J.; Nielsen, J. Color Classification Methods for Perennial Weed Detection in Cereal Crops. In Progress in Pattern Recognition, Image Analysis, Computer Vision, and Applications; Vera-Rodriguez, R., Fierrez, J., Morales, A., Eds.; Springer: Cham, Germany, 2019; Volume 11401, pp. 117–123. [Google Scholar] [CrossRef]
  54. Sørensen, R.A.; Rasmussen, J.; Nielsen, J.; Jørgensen, R.N. Thistle detection using convolutional neural networks. In Proceedings of the EFITA WCCA 2017 Conference, Montpellier, France, 2–6 July 2017; p. 75. [Google Scholar]
  55. Suir, G.; Saltus, C.; Sasser, C.; Harris, J.; Reif, M.; Diaz, R.; Giffin, G. Evaluating Drone Truthing as an Alternative to Ground Truthing: An Example with Wetland Plant Identification, ERDC/TN APCRP-MI-9; Engineer Research and Development Center: Vicksburg, MI, USA, 2021. [Google Scholar] [CrossRef]
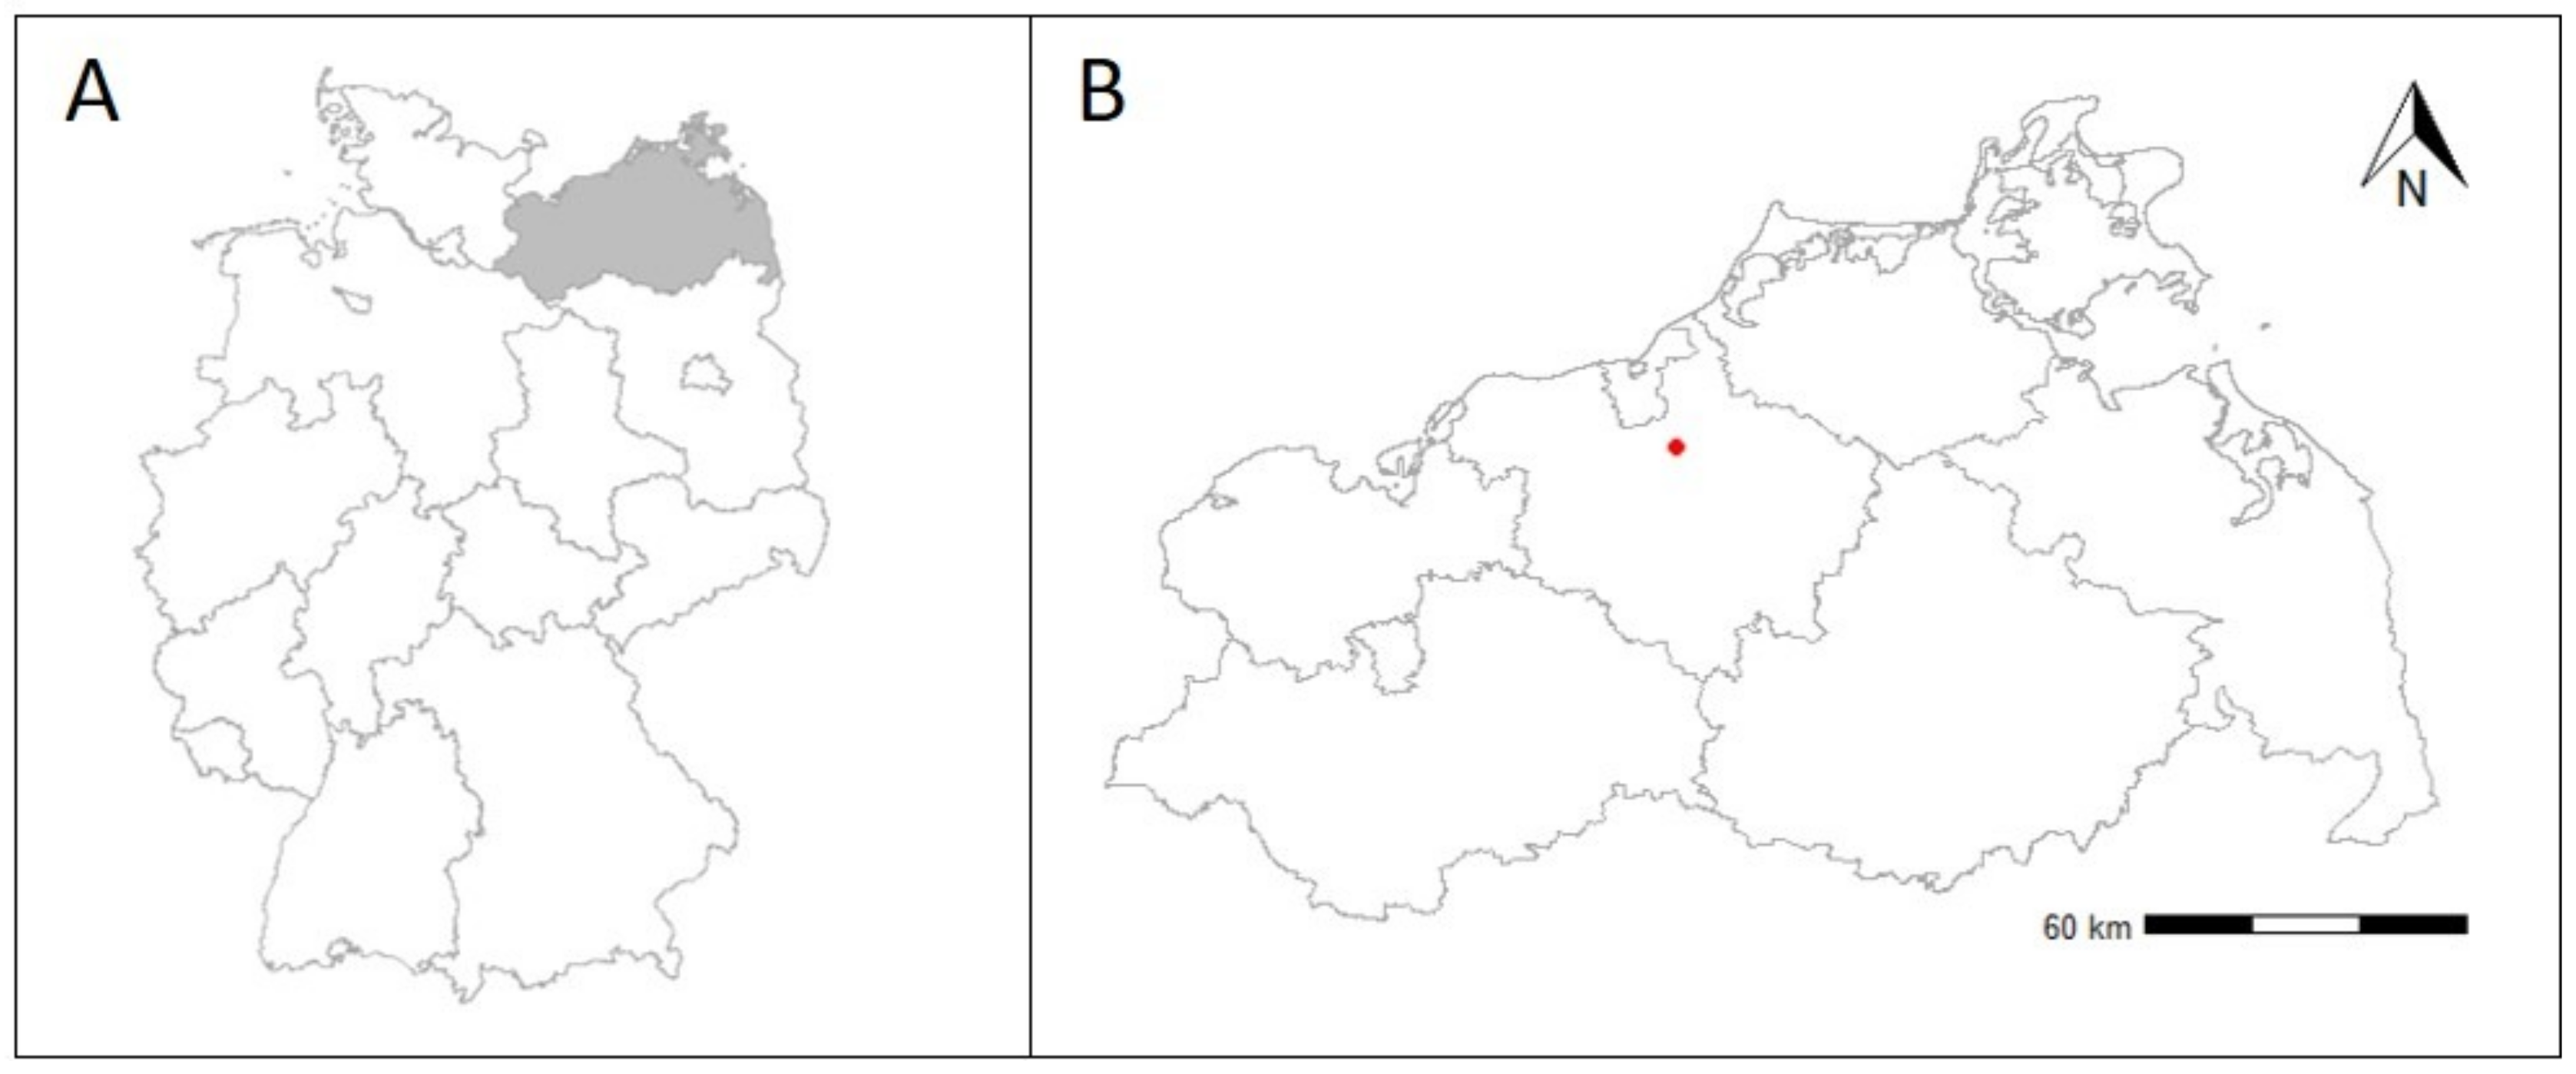
Figure 1. Locations of the district of Rostock in north-eastern Germany (A) and the studied field ‘Dummerstorf’ in Mecklenburg–West Pomerania (B).
Agronomy 13 01474 g001
Figure 2. UAV image of thistle patches growing in Lupines in ‘Dummerstorf’ in July 2019.
Agronomy 13 01474 g002
Figure 3. GPS-monitored patch “Expansion” development in ‘Dummerstorf’ 2019–2021. Black marked = 2019, Red marked = 2021. (a) Example 1 “Expansion” = 1.32; (b) Example 2 ”Expansion” = 0.25.
Agronomy 13 01474 g003
Figure 4. Changes in thistle “Expansion” and ”Density” in ‘Dummerstorf’ between 2019 and 2021 in the treatments (see Section 2.2); Red line = 1 indicates no changes. See description, Section 2.3.
Agronomy 13 01474 g004
Figure 5. Effect of control on thistle “Expansion” and ”Density”. Given are the reductions of single and combined control treatments relative to the maximum reduction of treatment PL + RC + CC = 100%. Single treatments (RC, CC, PL) shown in plain colour. Treatment combinations (RC + PL, RC + CC, PL + CC) shown by added hatching.
Agronomy 13 01474 g005
Table 1. Dates for management and assessment operations in ‘Dummerstorf’ between 2019 and 2021.
Field Operations201920202021
Root cutting (spring, 20 cm)-27-January31-March
Ploughing (spring, 20 cm)-28-January31-March
Sowing spring wheat-18-March31-March
Grain harvest-20-August31-August
Field cultivator (5 cm), disc harrow (7 cm)24-August22-August-
Field cultivator (10 cm) 13-March30-March
Sowing cover crop5-September15-September-
Root cutting (autumn, 10 cm)5-September15-September-
Table 2. Linear model effects of treatments on thistle variables “Expansion”, “Density”, “Coverage”, and “Height”, Significance codes: * p < 0.05, ** p < 0.01, and *** p < 0.001. See description, Section 2.4.
Estimate
Fixed Treatment Effects“Expansion”“Density”“Coverage”“Height”
Intercept: UC2.83 ***1.25 ***0.99 **0.93 ***
CC−1.95 ***−0.34 *+0.19−0.23
RC−1.95 ***−0.6 ***+0.04−0.15
PL−2.38 ***−1.12 ***−0.51−0.69 ***
RC + CC−2.44 ***−0.78 ***−0.19−0.35 *
PL + CC−2.55 ***−1.13 ***−0.24−0.28.
PL + RC−2.63 ***−0.97 ***−0.34−0.40 *
PL + RC + CC−2.76 ***−1.19 ***−0.60−0.54 **
Table 3. Linear regressions: “ExpansionGPS” as a function of “ExpansionUAV” and manually evaluated “Shoot density” as a function of UAV-based Coverage; Significance codes: ** p < 0.01, and *** p < 0.001.
Estimate
yxInterceptSloper2
ExpansionGPSExpansionUAV1.340.96 ***0.92
Shoot densityCoverageUAV10.33 **0.37 ***0.27
Disclaimer/Publisher’s Note: The statements, opinions and data contained in all publications are solely those of the individual author(s) and contributor(s) and not of MDPI and/or the editor(s). MDPI and/or the editor(s) disclaim responsibility for any injury to people or property resulting from any ideas, methods, instructions or products referred to in the content.