Article

Bioponics—An Organic Closed-Loop Soilless Cultivation System: Yields and Characteristics Compared to Hydroponics and Soil Cultivation

1
Ecological Engineering Centre, Institute of Natural Resource Sciences, Zurich University of Applied Sciences, 8820 Wädenswil, Switzerland
2
MycoSolutions AG, 9014 St. Gallen, Switzerland
3
Environmental Genomics and Systems Biology Research Group, Institute of Natural Resource Sciences, Zurich University of Applied Sciences, 8820 Wädenswil, Switzerland
*
Author to whom correspondence should be addressed.
Agronomy 2023, 13(6), 1436; https://doi.org/10.3390/agronomy13061436
Submission received: 23 April 2023 / Revised: 16 May 2023 / Accepted: 17 May 2023 / Published: 23 May 2023
(This article belongs to the Special Issue Organic vs. Conventional Cropping Systems—Series II)

Abstract

:
Sustainable food production has become increasingly important. Soilless cultivation systems offer several advantages, such as water and nutrient use efficiency, and can be implemented where traditional agriculture is impossible. Bioponic systems use locally or regionally available nutrient sources from organic waste streams (either fluid or solid) and can thus contribute to closing nutrient cycles locally. Bioponics harnesses the metabolic processes of microorganisms which release nutrients from organic matter. This study aimed to set up a bioponic system, by using biogas digestate concentrate and biochar as nutrient sources, and promoting nutrient release from the organic sources by including a biofilter in the system. The development of water quality, plant growth, and quality was monitored extensively. In addition, the influence of either the fungal biocontrol agent Trichoderma atrobrunneum or UV-C treatment of the nutrient solution on plant health and growth was investigated. Three cultivation cycles with Lactuca sativa (“HAWKING” Salanova®) in bioponic (BP), hydroponic (HP), and soil (SO) cultivation were performed. The study showed that healthy lettuces could be produced in BP systems, using a biogas digestate concentrate and biochar as nutrient sources, despite salt accumulation in the nutrient solution. In plant sap analyses, lettuces cultivated in BP systems contained less nitrate but more ammonium and chloride. The yield of the lettuces grown in the BP systems was intermediate, compared to the HP and the SO. The fungus, T. atrobrunneum, strain, T720, survived in soil and soilless cultivation systems. Compared to the HP and the SO systems, the shoot height of lettuces grown in the BP system, with the application of Trichoderma, was significantly increased. In SO systems with Trichoderma application, a significantly higher chlorophyll and flavonoid content, but significantly lower shoot height was observed. The fresh weight of lettuce roots was significantly higher in HP systems with Trichoderma treatment. Cultivating plants by using organic waste streams requires commitment and experience from producers. In BP systems, a biofilter (either within the system or externally, to increase nutrient levels) can help to rapidly convert the ammonium-rich fertilizer to plant-available nutrients. Unlike conventional HP systems, in BP systems, nutrients are released slowly over time, requiring close monitoring and adjustments. In conclusion, healthy lettuces for human consumption can be produced in BP systems, and the application of the biocontrol agent used has some beneficial influence on plant growth.

1. Introduction

Sustainable food production, the use of water and other resources, as well as the closing of material cycles with concurrent increasing urbanization, are major challenges for humanity in the coming decades. The sustainable development goals (SDGs) of the United Nations [1] are a signpost for the direction in which society should develop on a political and social level, in order to meet these challenges and enable a better life for all. Soil-independent plant production is vital to overcoming challenges in SDG 2—zero hunger, SDG 6—clean water and sanitation, SDG 11—sustainable cities and communities, and SDG 12—responsible consumption and production. Soilless production systems do not require fertile soil, reuse nutrients [2], and use up to 80% less water than conventional soil cultivation [3]. Additionally, awareness of the importance of urban gardening, food security, and self-sufficiency has been increased by restrictions and border closures caused by the COVID-19 pandemic [4,5].
Conventional soilless cultivation systems, such as hydroponic (HP) systems, rely on mineral fertilizers dissolved in irrigation water [2], which allow the composition of the nutrient solution to be precisely adjusted to suit the requirements of plants. However, raw materials are mined, processed, or produced with expensive energy-intensive processes. In particular, the essential nutrients, potassium (K) and phosphorus (P), are limited resources [6]. Until now, many countries do not have legislation that obliges growers to recycle the used hydroponic nutrient solution. In the open soilless systems, water and nutrients are released into the environment and can subsequently contribute to pollution [7]. Closing nutrient cycles by using regionally and municipally sourced organic fertilizers, such as fish manure [8], urine or biogas digestate [9,10,11], could therefore reduce greenhouse gas emissions, save inorganic fertilizer, and reduce environmental pollution [7,12]. Another reason for the increasing interest in organic nutrient sources for soilless production is their lower nitrate content when compared to inorganic fertilizers, resulting in lower nitrates accumulated in leaves and petioles, which is beneficial for human consumption [13,14,15]. When organic fertilizers are used for soilless cultivation systems, the process is called digeponics [16,17], anthroponics [3], organic hydroponics, or bioponics [18,19].
The principle of bioponics is not new and has already been used for several thousand years in its simplest form. In 2007, a patent was registered by William Textier [20], describing the use of organic fertilizers in a hydroponic system containing microorganisms such as bacteria, enzymes, or enzyme-producing fungi like Trichoderma spp. However, bioponics has not yet prevailed over conventional hydroponics in large-scale cultivation in commercial enterprises. It is better known in hobby gardening. There are many ideas, available online, about how to produce organic fertilizer, and products for small-scale systems are also commercially available. One reason large-scale bioponics has not yet made a breakthrough is likely due to the increased workload required for monitoring nutrient availability and plant development. Parameters such as pH and electrical conductivity (EC), often used in conventional hydroponics [21], cannot be used alone to monitor and manage a bioponic system. Therefore, a better understanding of soilless systems, based on organic nutrients, is required and was investigated within this study.
Crucial to the operation of any bioponic system are microorganisms that metabolize organic substrates, releasing nutrients required for plant growth [22,23]. These metabolic processes can occur either within or outside the system. Most likely, the best-known example of bioponics is aquaponics, which combines soilless plant cultivation with aquaculture, allowing nutrient-rich water from fish production to be used for the fertilization of plants, which, in turn, cleans the water for the fish [8,24,25]. One of the nutrient sources that could be potentially used in bioponics, biogas digestate, is a residue from the anaerobic fermentation of organic matter, such as plant biomass, animal manure, and catering and slaughterhouse waste. Depending on the biogas plant’s operating system and conditions (particularly pH and temperature), a fraction of nitrogen can also be lost as ammonia [26]. However, most of the nitrogen and all other elements in the input substrates remain in the digestate [27]. These elements include major plant nutrients such as phosphorus, potassium, and calcium. Therefore, by using the biogas digestate, production of already limited nutrients required for soilless system operation can be reduced. However, the addition of organic nutrient sources in soilless production systems requires experience, precise handling, and the continuous addition of fertilizer, due to the potential non-plant-optimal forms of nutrients and the slow release of nutrients due to organic matter. Furthermore, producing healthy lettuce for human consumption requires an understanding of whether plant-available heavy metals, such as cadmium and lead [28,29], are present in fertilizers, and how they are absorbed by the plants.
Besides the source of nutrients, the key difference between bioponic and conventional soilless culture is the active promotion of microorganisms to enable mineralization [23]. In bioponics, the ecosystem functions, originating from the microbial community present from the system start-up, ensure important functions in the system, including nitrification [30], nutrient conversion, disease suppression, and contribution to productivity and plant quality, similar to soil-based systems [31]. On the other hand, commercial hydroponics relies exclusively on mineral fertilizers. Additionally, using biofilm reduction agents is standard practice and suppresses ecosystem functions connected to the biodiversity of microorganisms [2,7,32]. Furthermore, hydroponic systems often require a reset approximately every fifth growth cycle (Ramon Melon, head grower at WholeLeaf, Coaldale, AB, Canada, pers. comm) due to frequent infections and diseases of the cultivated crops [33]. For this reason, it is common in conventional hydroponic production that the nutrient solution is either disinfected through UV-C radiation [7], or entire production systems are disinfected with chemical agents [32], which is costly and could also pollute the surrounding environment.
Root rot, caused by Pythium spp., is a soil-borne fungal disease that is difficult to control. Pythium is a genus of parasitic oomycetes, which favors by humid growth conditions [34] and high nutrient levels [35], and causes high economic losses [35,36,37]. Isolates of certain fungi, like Trichoderma spp. [38,39,40] and Gliocladium spp. [34], bacterial isolates from an aquaponic system [41], and beneficial rhizosphere microorganisms, like bacilli [34], pseudomonads [42,43,44] or lactobacilli [44,45,46], have disease-suppressing effects on many soil-borne diseases, including those caused by Pythium spp. The use of the fungal biocontrol agent, Trichoderma spp., in soil cultivation, is becoming widespread [39,47,48,49,50], while its application in soilless cultivation systems is not yet well studied.
The aim of this study was to investigate plant production and nutrient utilization in bioponics, using a biogas digestate concentrate (from a methanization plant) and biochar as nutrient sources, while promoting nutrient release from the organic sources by including a biofilter to the system. These results were compared to conventional hydroponic, and soil cultivation to investigate feasibility of large-scale production using organic nutrient sources. The investigation focused on answering the following questions: How can the stable operation of soilless cultivation, using organic nutrient input, be achieved? What are the characteristics of nutrient release in a bioponic system and how should it be monitored and controlled? What is the yield of fresh biomass produced in a bioponic system, when compared to hydroponics and soil cultivation? Are there any differences in the elemental composition of plant biomass (i.e., plant sap)? Does the plant growth in soilless production systems benefit from the application of the bioagent, Trichoderma atrobrunneum, and from the UV-C treatment of the nutrient solution?
To gain new knowledge about bioponic cultivation, various plant and nutrient solution samples of three cultivation systems and different treatments were extensively monitored to determine not only NPK, but a series of other nutrients.

2. Materials and Methods

Three identical successive trials, with lettuce cultivation of 26 days each (Supplementary File, Table S1), were performed at the Zurich University of Applied Sciences (Wädenswil, Switzerland) in a foliar greenhouse (47.21743° N, 8.68151° E). Each trial included four identical closed-loop bioponic (BP) and hydroponic (HP) systems and two soil cultivation systems (SO), serving as a control (Figure 1). Air temperature and relative humidity in the greenhouse were measured at 10 min intervals with four Hygrochron iButtons (Avnet Memec, Rothrist, CH) placed next to the lettuces at random locations. Photosynthetically active radiation (PAR) in the greenhouse was measured with sensor SKL2640 (Skye Instruments Ltd., Powys, UK), and logged every 10 min.
For BP and HP cultivation, two systems each were inoculated with T. atrobrunneum, while two systems included a UV-C treatment for nutrient solution disinfection. In the SO systems, one system was inoculated with T. atrobrunneum, while the other served as a control.

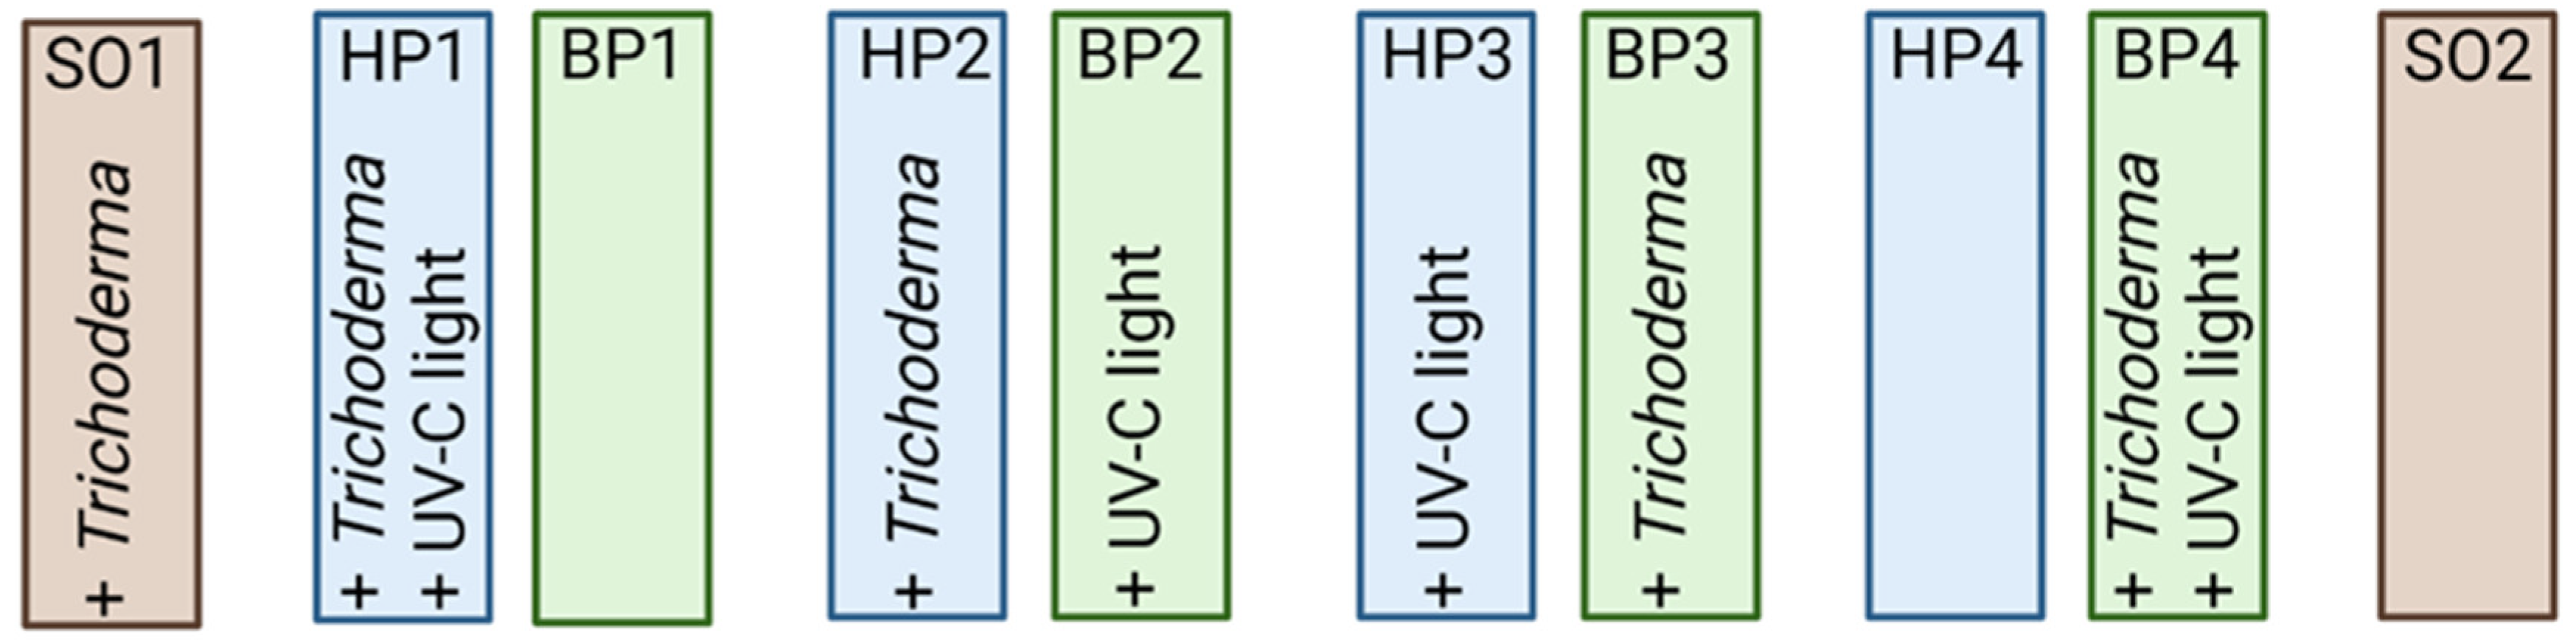
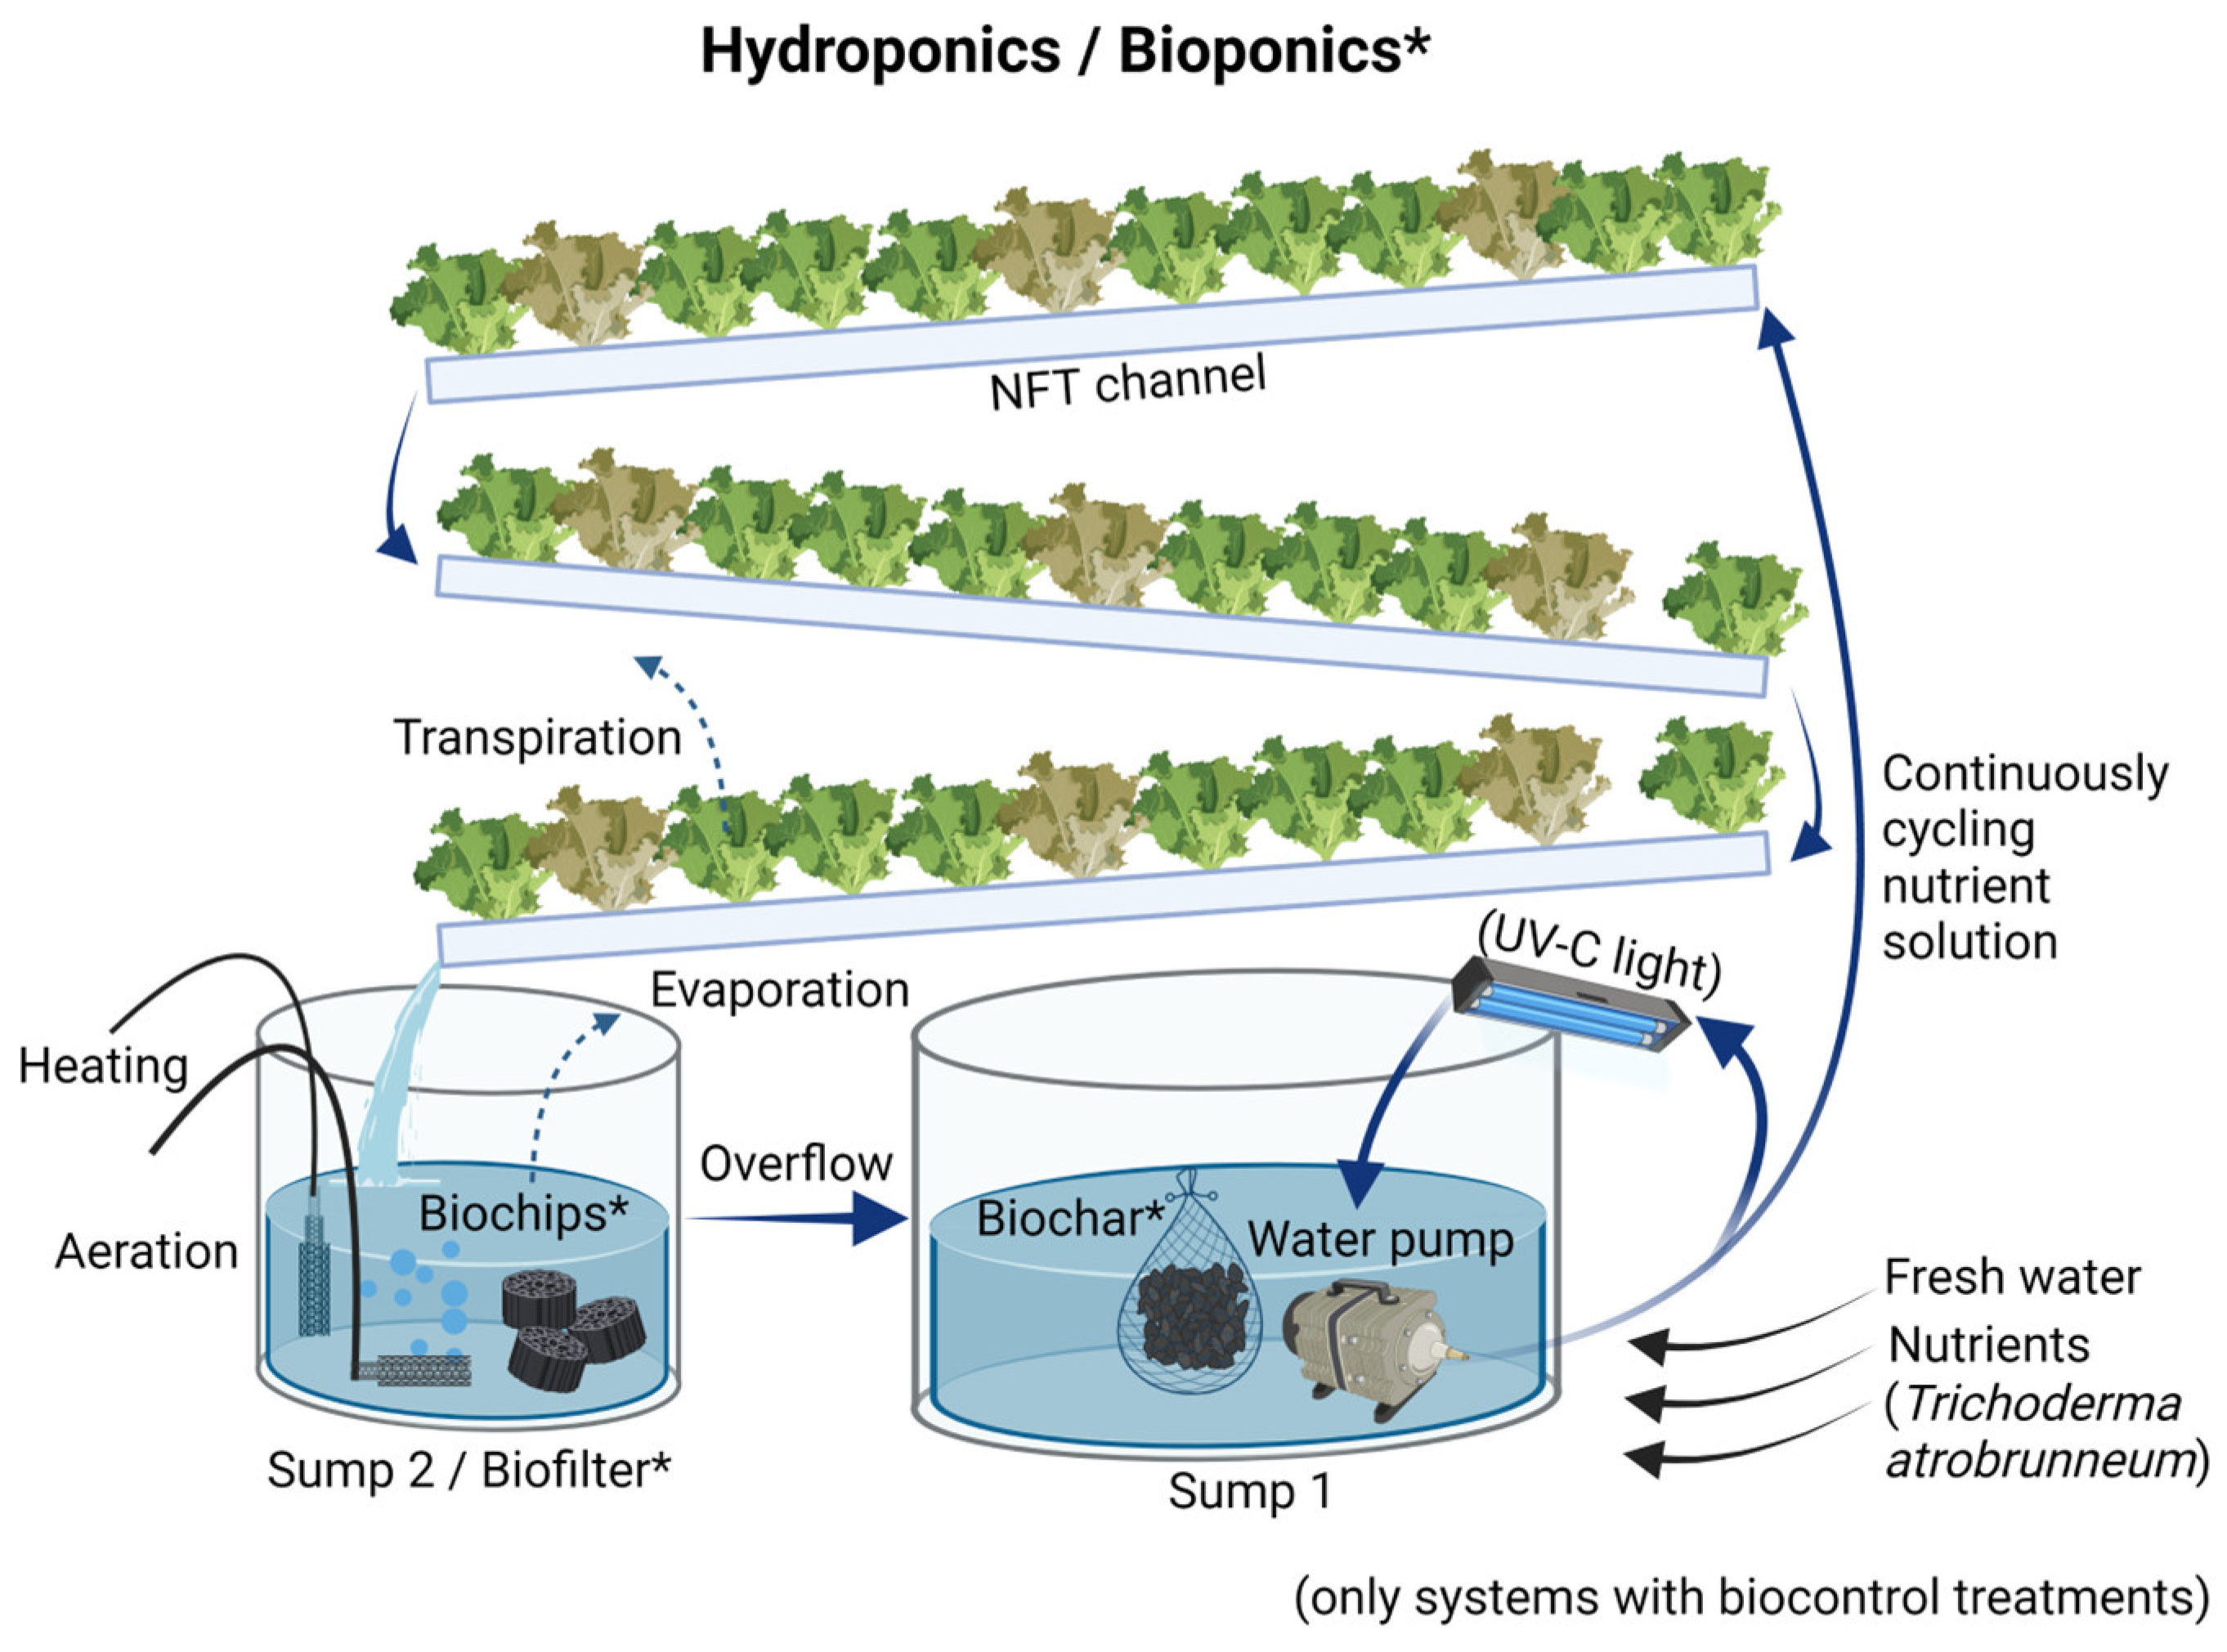
2.1. Soilless Cultivation System Setup

Each BP and HP system (255 L of total water volume) consisted of three serially arranged nutrient film technique (NFT) channels with 34 plants per system, a reservoir, containing the nutrient solution (sump 1, 185 L). A reservoir (sump 2, 70 L) was also used, in the BP systems, as a biofilter to support nitrification, and, in the HP systems, simply as a reservoir (Figure 2). The heating rods in sump 2 were set to 23 °C in the BP systems, to provide optimal conditions for nitrifiers, and to 21 °C in the HP systems. Dissolved oxygen was kept at saturation, using an air pump with an air stone. Water loss due to evapotranspiration was compensated for twice per week, and the amount of water added was recorded.
To obtain an established biofilter for the BP systems, a biofilter (400 L of biochips and 800 L tap water) was started six weeks prior the start of the first trial, using Pure + Filter Start Gel (Evolution Aqua, Wigan, UK). During this starting process, the biofilter was fed with ammonium di-hydrogen phosphate (Sigma-Aldrich, Buchs SG, Switzerland) and fish feed (Tilapia Vegi, 3.0 mm, Hokovit, Hofmann Nutrition AG, Bützberg, Switzerland) to promote microbial growth. Microbial activity was monitored by weekly measurements of ammonium (NH4+), nitrite (NO2), and nitrate (NO3). After the biofilter was able to transform 5 mg L−1 NH4+ within 24 h, the biochips needed for each experiment were taken out of the prepared mature biofilter and added to the BP systems at the start of each trial.

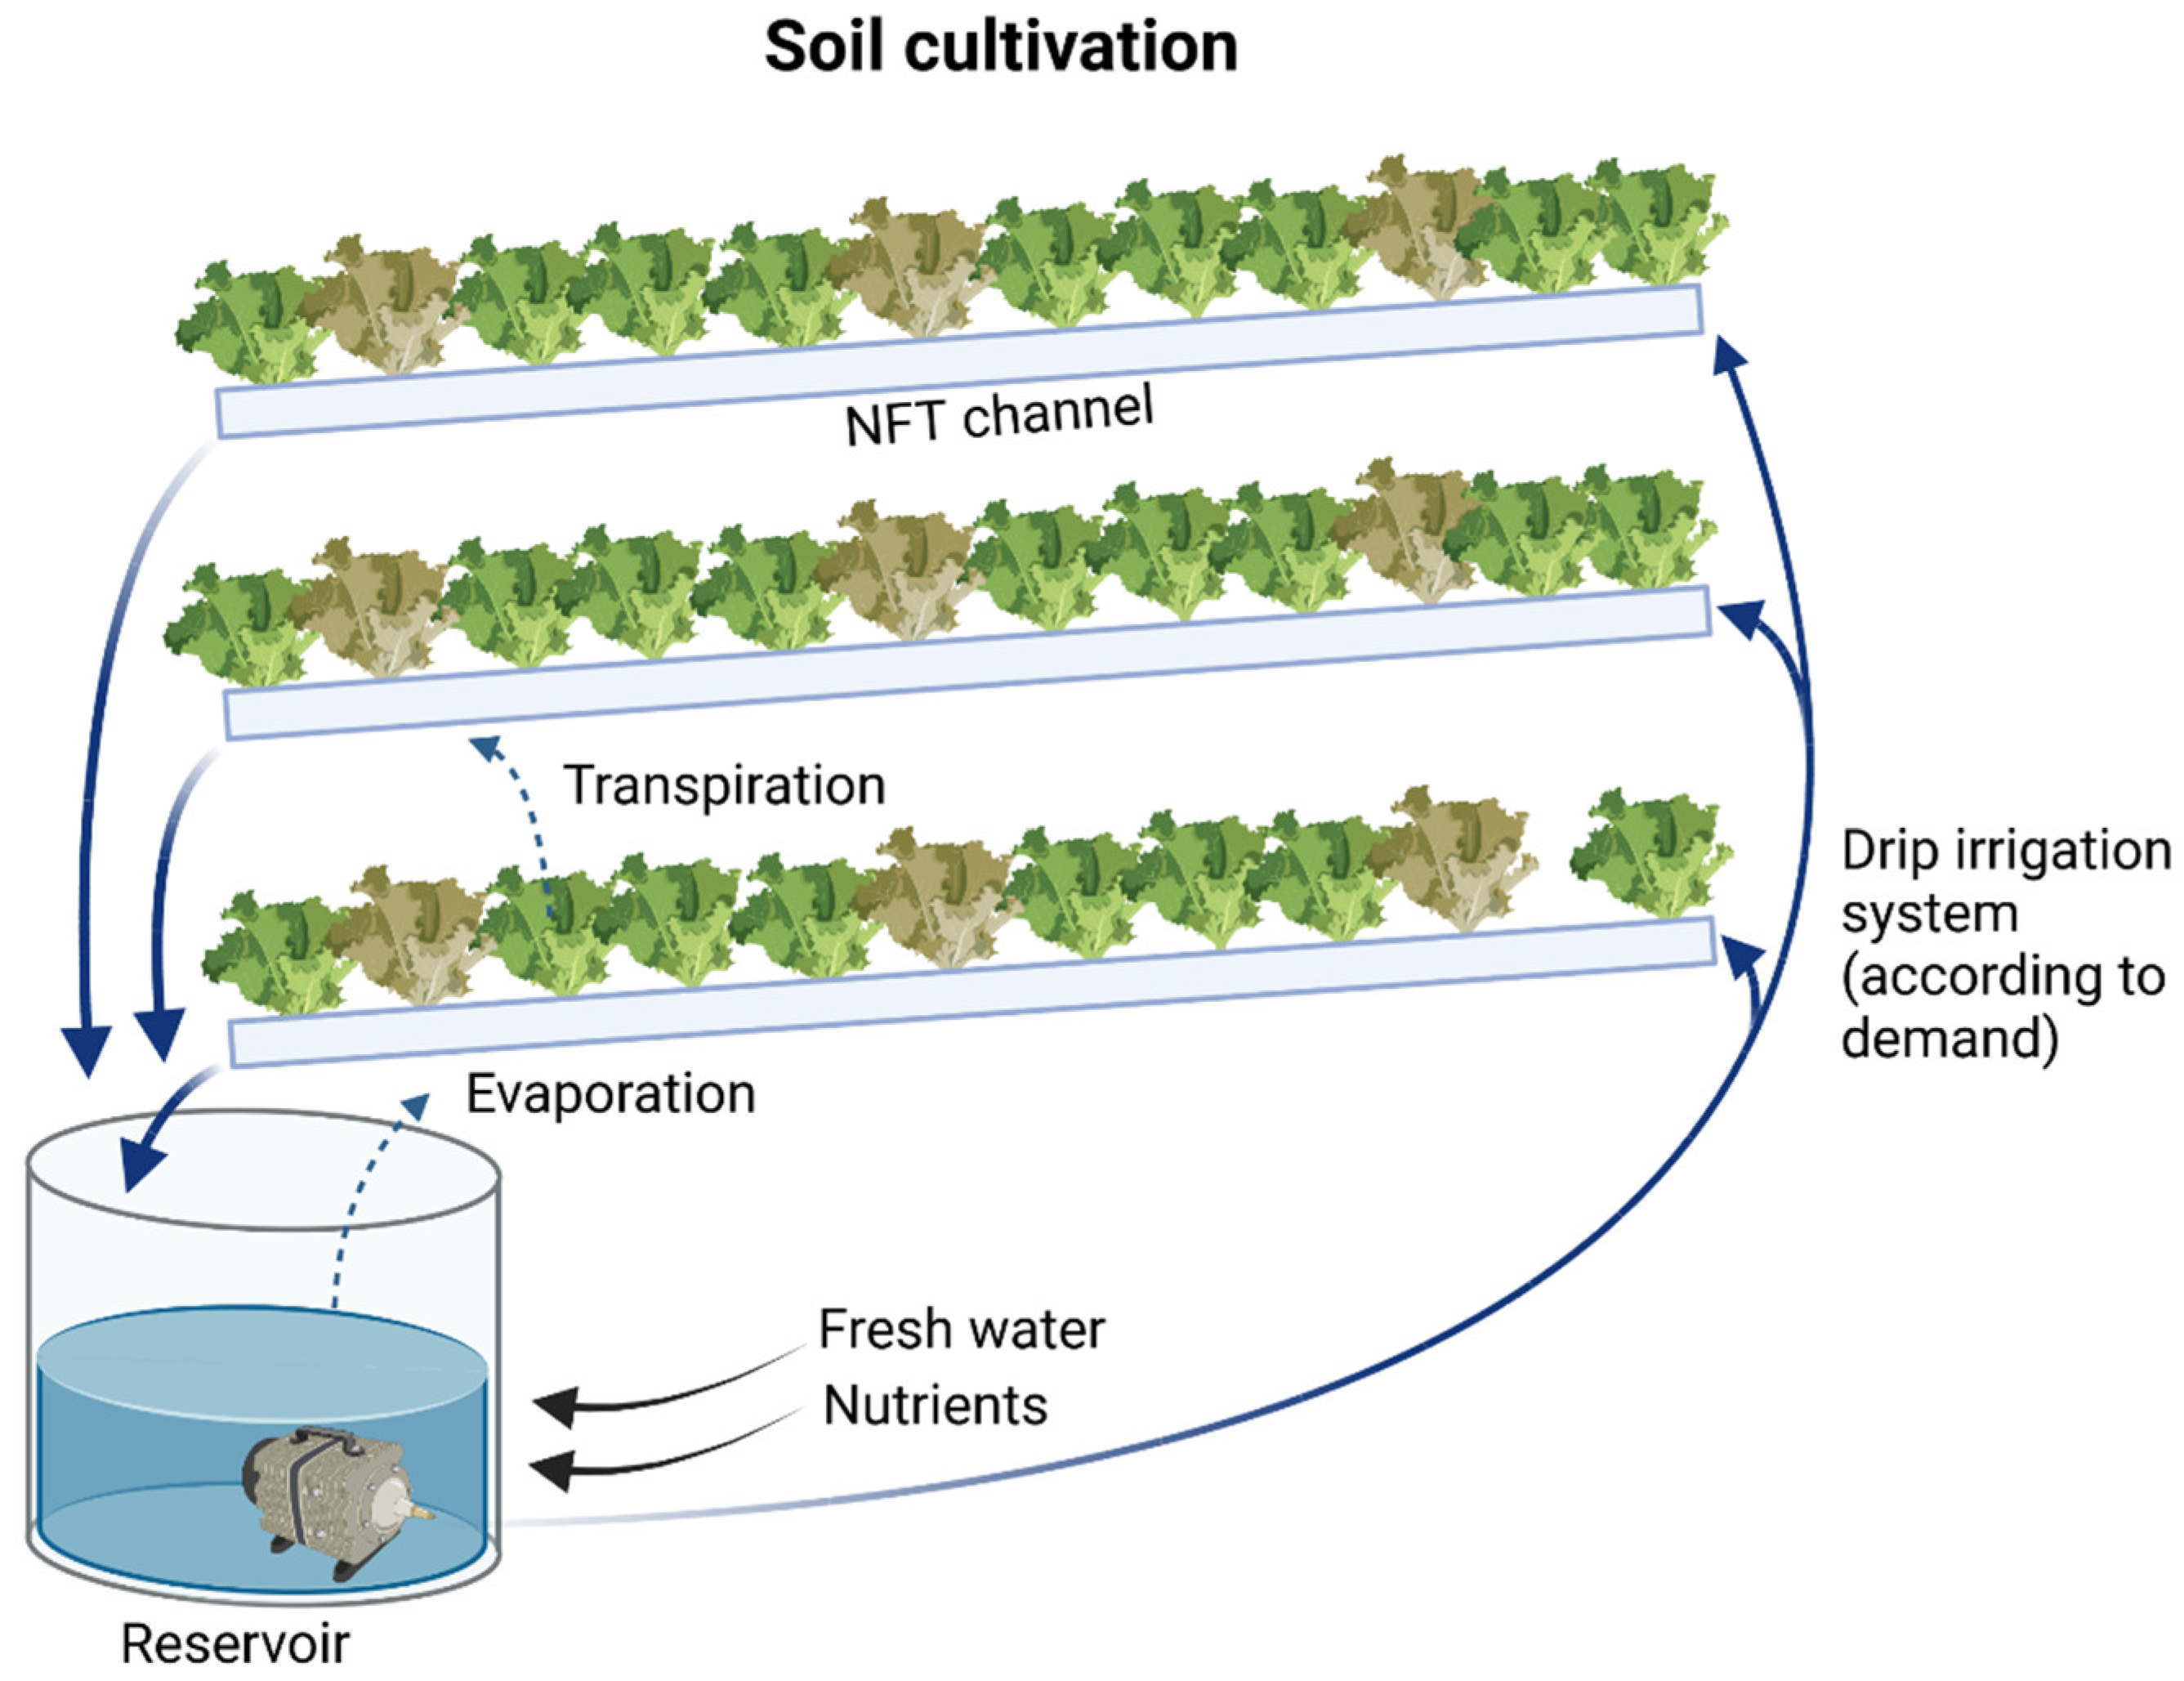
2.2. Soil Cultivation System

Each SO system consisted of three nutrient film technique (NFT) channels, arranged in parallel, filled with organic pot substrate (Floradur BIO-Substrat Topf, Floragard Vertriebs-GmbH, Oldenburg, Germany), and planted with 34 plants per system (Figure 3). A reservoir (70 L) contained the nutrient solution for automatic drip irrigation. Irrigation ran every day for 10 min and, if needed, more water was irrigated, but the amount was not recorded.

2.3. Seedling Preparation

Pelleted lettuce seeds (Lactuca sativa “HAWKING” Salanova®, Bigler Samen AG, Thun, Switzerland) were sown in the greenhouse. The seedlings for the BP and HP systems were grown in rockwool cubes (Grodan SBS, 36 × 36 × 40 mm, gvz-rossat AG, Otelfingen, Switzerland), initially in tap water until both cotyledons of the seedlings had completely opened and afterwards, in a fertilizer solution (Wuxal® Profi, Maag, Dielsdorf, Switzerland) with a step-by-step increase in electrical conductivity (EC), up to 1800 μS cm−1 over the period of 22 days. The fertilizer solution was replaced three times per week.
Seedlings for the Trichoderma treatment were inoculated with the bio agent, Avengelus with T. atrobrunneum concentrate (MycoSolutions AG, St. Gallen, Switzerland) using an application concentration of 1 mL L−1, five days after sowing, when they reached the cotyledon stage. After that, the irrigation solution was not changed for 3 days.
Lettuce for the SO systems was sown into a seedling tray, using seedling substrate (Floradur BIO-Substrat Block, Floragard Vertriebs-GmbH, Oldenburg, Germany). Seedlings for the Trichoderma treatment were inoculated with an application concentration of 1 mL L−1 (1 × 10⁶ CFU per mL in irrigation water) just after seeding, and repeated 13 days post-seeding. The seedlings were transplanted into all systems after 27–30 days, when the seedling roots were long enough (ca. 5 cm).

2.4. Fertilizer Management

To be able to compare the results of the BP and HP systems, both nutrient solutions were adapted to a target concentration of total nitrogen (TN) of approx. 50 mg L−1 TN (which is about one-third of conventional HP systems [2]). For BP and HP system filling and refilling, a mixture of tap water and deionized water (1:1) was used (Table 1). To ensure that the same amount of iron was available to the BP and HP lettuces, 32 g of iron-chelate EDTA-Solution 6.7% (Ökohum GmbH, Herrendorf, Switzerland) was added to the systems at the trial start and after about 10 days.

2.4.1. Bioponics (BP)

It is important to know the source and quality of organic nutrients, especially in closed loops, to ensure the safety of the food produced and to reduce customer concern regarding harmful substances. A biogas digestate concentrate (consisting of one-third each of green and catering waste, animal manure, and slaughterhouse waste), that was treated at 55 °C to reduce possible mesophilic pathogens [51], was obtained from the biogas plant, SwissFarmerPower Inwil AG (Inwil LU, Switzerland), and used as a nutrient source (Table 1). Ultrafiltration was performed to minimize the bacterial load [51,52,53]. However, this process reduces microbial diversity, which plays a vital role in BP cultivation [21,54]. Additionally, a strict and clean working practice was implemented to eliminate contact between the lettuce shoots and nutrient solution, minimizing possible contamination risks with pathogens.
The target nitrogen concentration was divided into three fertilizer applications (Table 2) (two of about 18.5 mg L−1 TN and one of about 12.9 mg L−1 TN), to avoid an initial ammonium peak that would be toxic to the plant roots.
In addition, a mesh bag with one kilogram of alkaline biochar (type: soil conditioner; PYREG GmbH, Dörth, Germany), containing approx. 170 mg kg−1 phosphorus and 2730 mg kg−1 potassium, was placed in the sump of the BP systems to supplement P and micronutrients.
As the optimum pH value for lettuce production is between 5.5 and 5.8 [2], and for the nitrifying bacteria, a pH of 7.0 to 9.0 [55], the targeted pH value for the BP systems was 7.0 ± 0.5 to promote nitrification. The pH was measured daily and, if necessary, adjusted using citric acid (≥99.5%, Sigma-Aldrich, Buchs SG, Switzerland) and sodium hydrogen carbonate (CARL ROTH GmbH + Co. KG, Karlsruhe, Germany).

2.4.2. Hydroponics (HPs)

For the HP systems, a nutrient solution with a target TN concentration of 50 mg L−1 was calculated with the software, HydroBuddy [56]. The nutrient solution (Table 1) was prepared using commercially available mineral nutrients (potassium sulfate, calcium nitrate, potassium monobasic phosphate, micromix, and plantspeed Fe EDTA 6.7%) (Table S2). As these nutrients have good plant availability and low ammonia content, the entire amount of nutrients was added to the systems at the start of each trial. The pH in the HP systems was adjusted to 6.5 ± 0.5 with nitric acid 30% (HNO3, CARL ROTH GmbH + Co. KG) to promote optimal nutrient uptake. The pH was measured daily and, if needed, retargeted using nitric acid. The amount of each added substance was recorded.

2.4.3. Soil Cultivation (SO)

The lettuces were drip irrigated with a conventional nutrient solution (Plantaktiv Typ A, 18/12/18, 0.1% application concentration, Hauert MANNA Düngerwerke GmbH, Nürnberg, Germany).

2.5. Nutrient Solution Analyses

Nutrient solution samples were taken and analyzed, as defined in Table 3. To determine when fertilization in the BP systems was required, the levels of NH4+, NO2, NO3, TN, and PO43− were measured at the beginning of trial A and after 7 and 12 days. At the start of trials B and C, only TN was measured, due to target identical total nitrogen level for each trial. Additional information about nutrient solution analysis can be found in the Supplementary File (Supplementary Methods and Table S3).

2.6. Plant Growth and Quality

2.6.1. Plant Growth

Plant growth was monitored by visual inspection using a standard protocol (overall health status, leaf color, leaf properties, necroses, pest infestation), measuring shoot diameter and height of nine lettuce plants from a specific position in the NFT channels (Figure 2 and Figure 3) at the start, middle and end of each trial. The indicators for plant growth (chlorophyll, flavonoid, anthocyanin content and nitrogen balance index, NBI) were measured at the same dates with the Dualex® Scientific (ForceA, Université Paris Sud, Orsay Cedex, France).

2.6.2. Fresh and Dry Weight Determination

Shoot and root fresh weight (without the rockwool part) and root length were determined at harvest. Additionally, the total lettuce biomass per system was determined. For dry weight determination, shoots and roots were chopped and dried in aluminum boxes for 72 h at 60 °C, until a constant weight was reached.

2.6.3. Shelf-Life and Consumer Test

Water loss was observed for 14 days to measure the shelf-life of the lettuce heads after harvest. Three shoots per system were covered with a standard plastic bag for vegetable boxes, stored at 4 °C in the fridge, and weighed every third day.
A consumer test was carried out to estimate the general acceptance of consumers for lettuce produced in the BP, HP, and SO systems. This test was performed after trials A and B as an «acceptance test» with 47 volunteer participants.

2.6.4. Plant Nutrient Analyses

To investigate the nutrient composition and potential heavy metal contamination of plants, sap from the young and old leaves of twelve lettuces was analyzed for pH, EC, sugar, TN, and NO3, NH4+, Cl and Si by NovaCropControl (Table 3). To compare different methods for nitrate measurement in lettuce shoots, NO3 was also measured in a mixed sample of young and old leaves by ZHAW according to the ion chromatography (IC) Application Note No. S-173 (Metrohm AG, Zofingen, CH) [57]. For this purpose, 150 mL of deionized boiling water was poured over 13 g cut lettuce leaves, and incubated for 15 min while swirling. Afterwards, samples were filtered (0.45 µm), quantitatively transferred into volumetric flasks, and filled up to 200 mL with deionized water. Samples were diluted 1:100 and NO3 concentrations were measured using IC.

2.7. Biocontrol

2.7.1. UV-C Treatment

In systems with UV-C treatment, a UV lamp (18 Watt Kobre® Tec UV-C Klärgerät, Koi-Breeder AG, Schinznach-Dorf, Switzerland) was installed after sump 1, continuously exposing (1.2 L min−1) the nutrient solution (Figure 2). The UV-C dose influences the organisms in which specific groups of bacteria and fungi, are inhibited. The UV-C application of 254 nm was set to a dose of 88 mW s−1 cm−2 in order to harm Pythium spp. maximally [58]. This setting should not have damaged T. atrobrunneum, because that would require UV-A and UV-B, and not UV-C light lengths [59,60].
The extinction of nutrient solution (e) was measured and (IT) was calculated based on the intensity of the incoming light (I0), the coefficient of the measurement (k), the distance inside the UV lamp (x), and the intensity of the transmitted light (Equation (1)). The flow through the UV system was adjusted accordingly to reach the target UV-C dose.
I T = I 0 × e k x
The UV lamps in the BP and HP systems were started three days after adding Trichoderma, allowing the fungal biocontrol agent to spread. To calculate the effectively applied UV-C dose, based on the transmission of the nutrient solution, water samples were taken in the middle and at the end of trial A and at the start, middle, and end of trials B and C.

2.7.2. Trichoderma atrobrunneum Strain T720 Application

The Trichoderma atrobrunneum strain T720, was added with the application concentration of 1 mL L−1 to the nutrient solution of the BP systems one day after it was started but before the first sampling. To determine the presence of the Trichoderma strain applied to the systems, samples were taken at the start, middle, and end of each trial. Nutrient solution and soil samples were isolated on potato dextrose agar plates to visually check the presence or absence of T. atrobrunneum strain T720. This was performed by MycoSolutions.

2.8. Data Analyses

Statistical analyses and graphics were carried out with R statistical software, version 1.4.1106 [61], processed within RStudio. Packages “boom“ [62], “emmeans“ [63], “ggpubr” [64], “gridExtra“ [65], “lsmeans” [66], “lubridate“ [67], “multcomp” [68], “multcompView” [69], “openxlsx“ [70], “RColorBrewer” [71], “readxl” [72], “rstatix” [73] and “tidyverse” [74]. Different combinations of these packages were used for the data analyses. All data were reported as the sample mean ± SD per cultivation cycle per cultivation system. The data were checked for normal distribution, by means of the Shapiro test. If data was normally distributed, one-way ANOVA was used to test for differences. If the data had no normal distribution, a Kruskal–Wallis analysis of variance was used. Multiple comparisons were performed using a Tukey’s range test for parametric data and a Wilcoxon signed-rank test for non-parametric data. To consider interactions between cultivation system and treatment, a two-way ANOVA was performed. Non-normally distributed data were transformed using a Box–Cox transformation. All tests were performed at a significance level of α = 0.05 and no outliers were removed.
Principal component analysis (PCA) was used to determine the main parameters influencing the characteristics of different cultivation systems and treatments. However, as the treatments did not differ significantly, only the PCA plots for the cultivation systems are presented. The effect of biocontrol application was tested for significant differences regarding nutrient solution quality, plant growth parameters, and plant sap analysis.
The correlation of two methods of measuring nitrate (in plant sap of young and old leaves; NovaCropControl, and in extract of mixed leaves; ZHAW), chlorophyll, and NBI measurement (Dualex) was calculated using Pearson’s correlation.
The evaluations of the consumer test were carried out with XLSTAT Addinsoft, version 2020.1.3 [75]. The nine-item scale (overall popularity, popularity of appearance, taste, and texture) was evaluated using the Friedman test, followed by multiple comparisons. For the Just-About-Right (JAR) scales (bitterness, flavor, crispness, tenderness, juiciness), percentage frequency distributions were generated, and penalty analysis was performed.

3. Results

The greenhouse’s climate conditions showed small but significant differences during the three successive trials, each lasting 26 days (Table 4 and Supplementary File, Figure S1). These conditions followed the seasonal trajectory as expected. The nutrient solution parameters generally followed the same trends, and plants in all systems grew well. Therefore, the results are presented as a mean of the specific cultivation system (BP, HP, and SO).

3.1. Nutrient Solution Characteristics

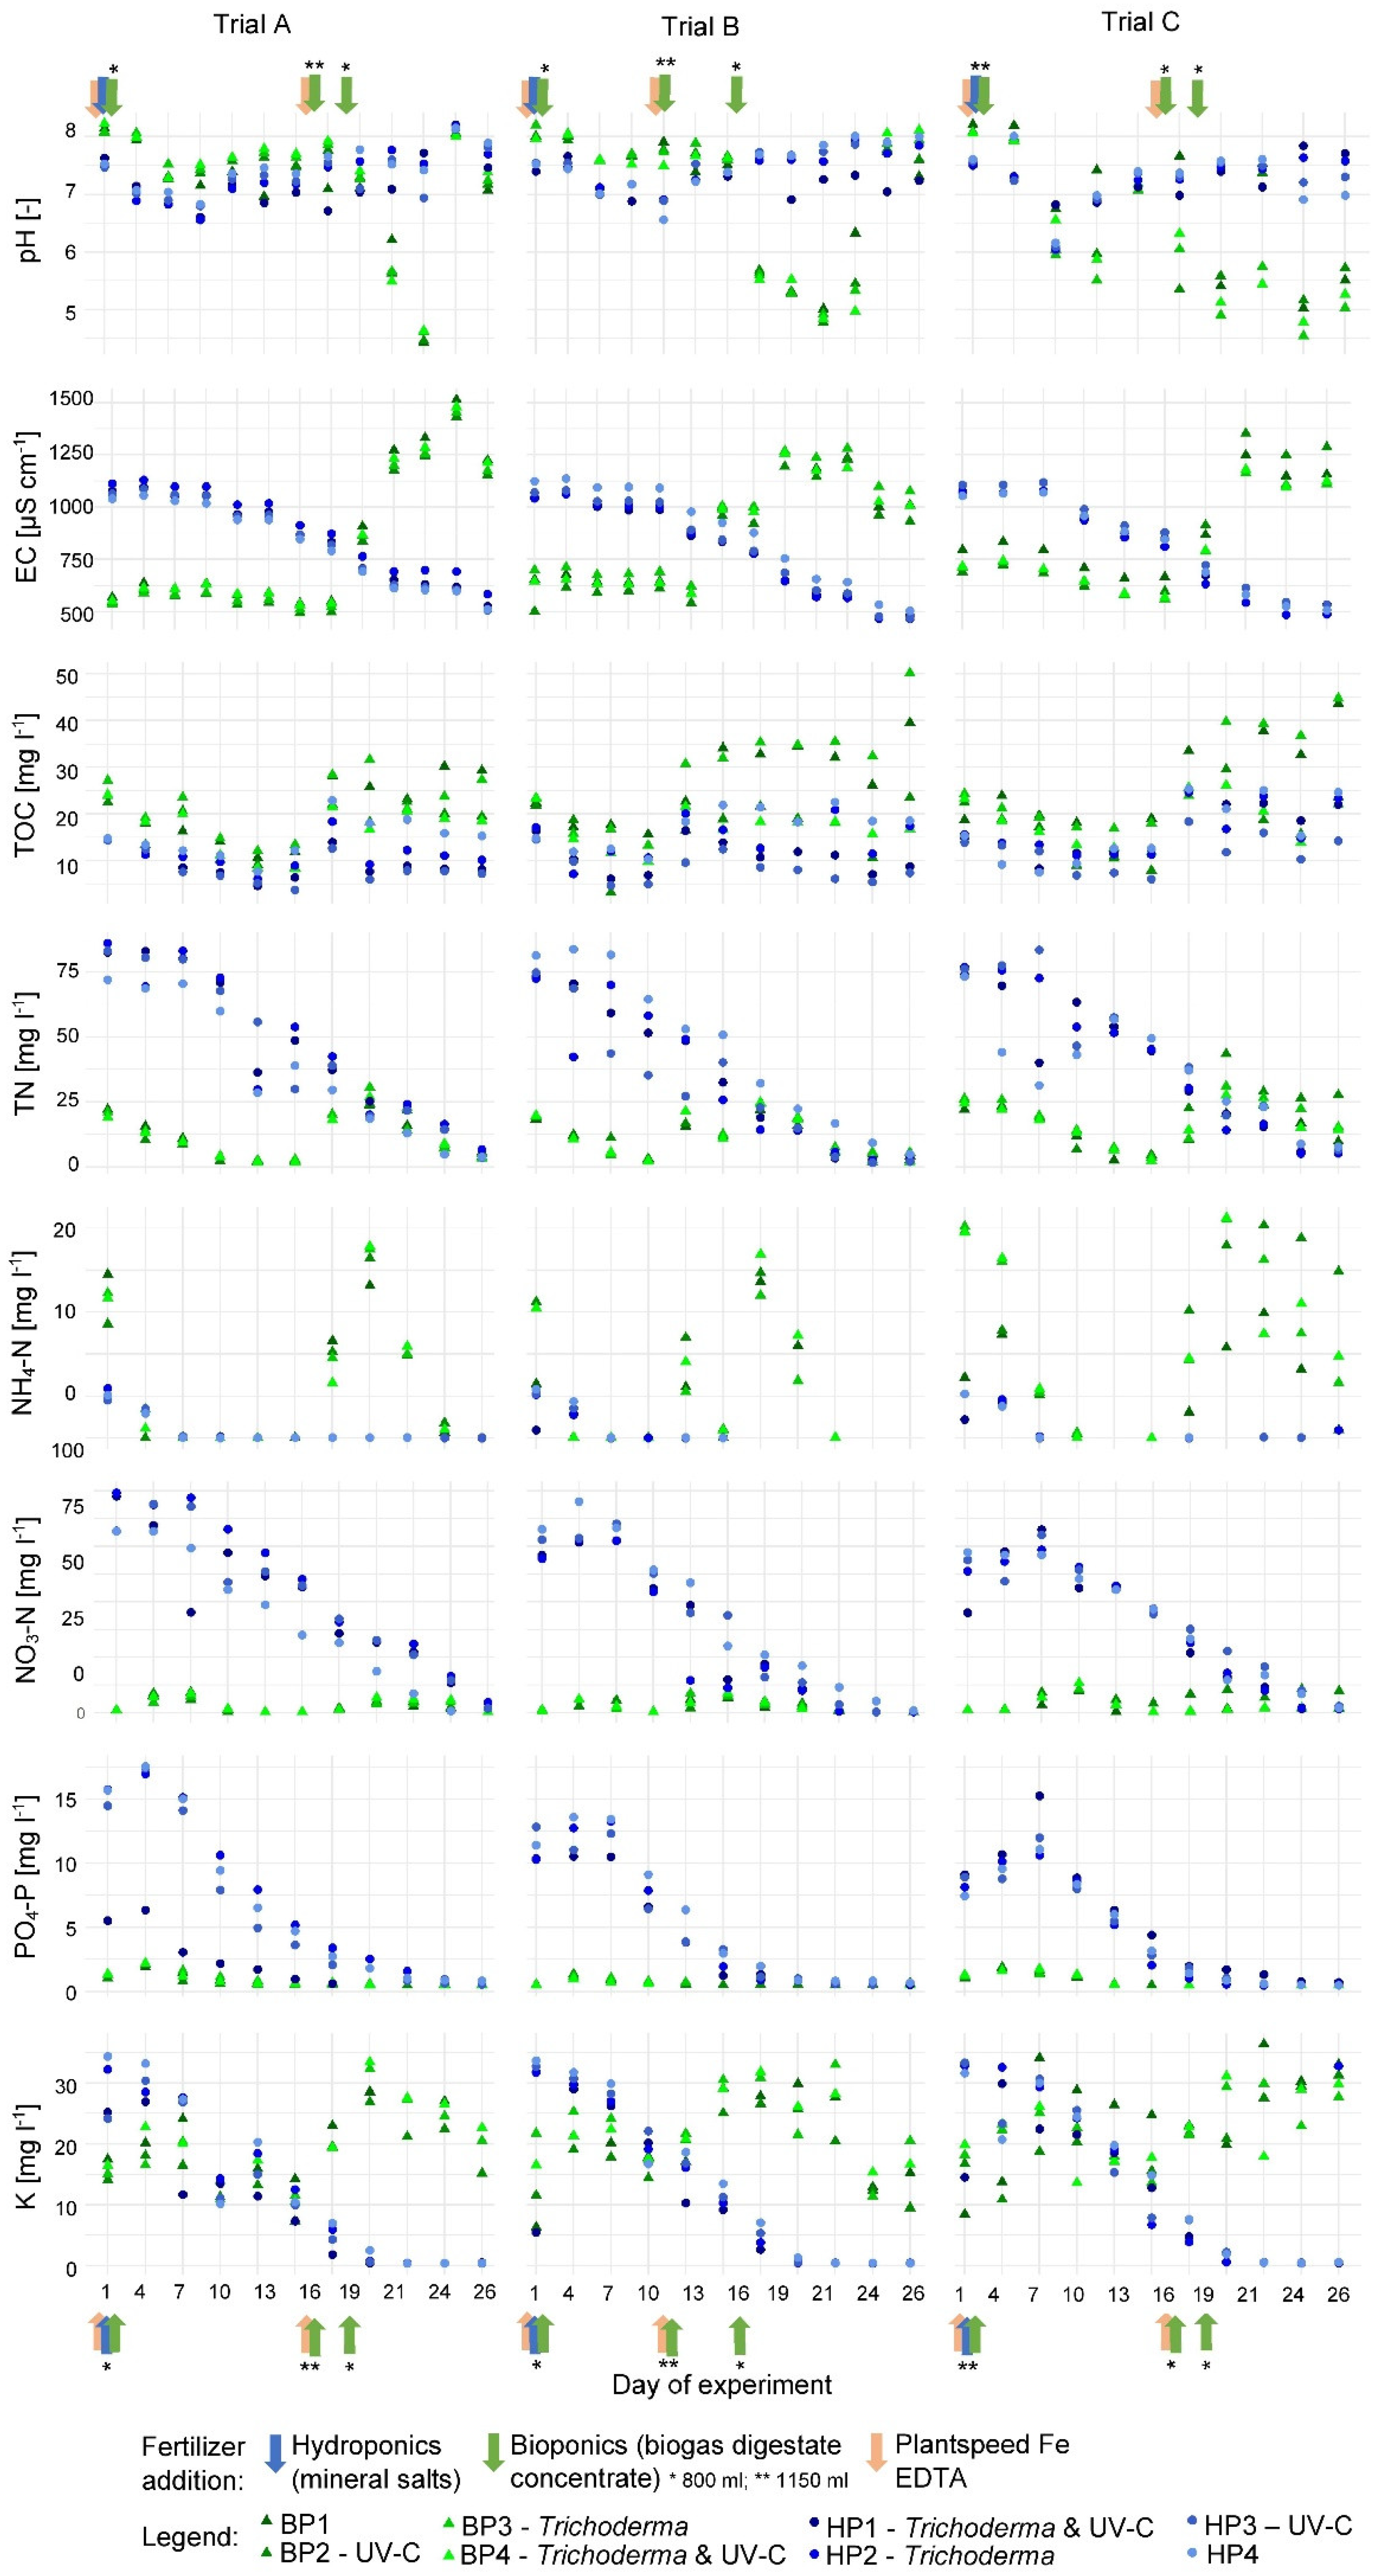
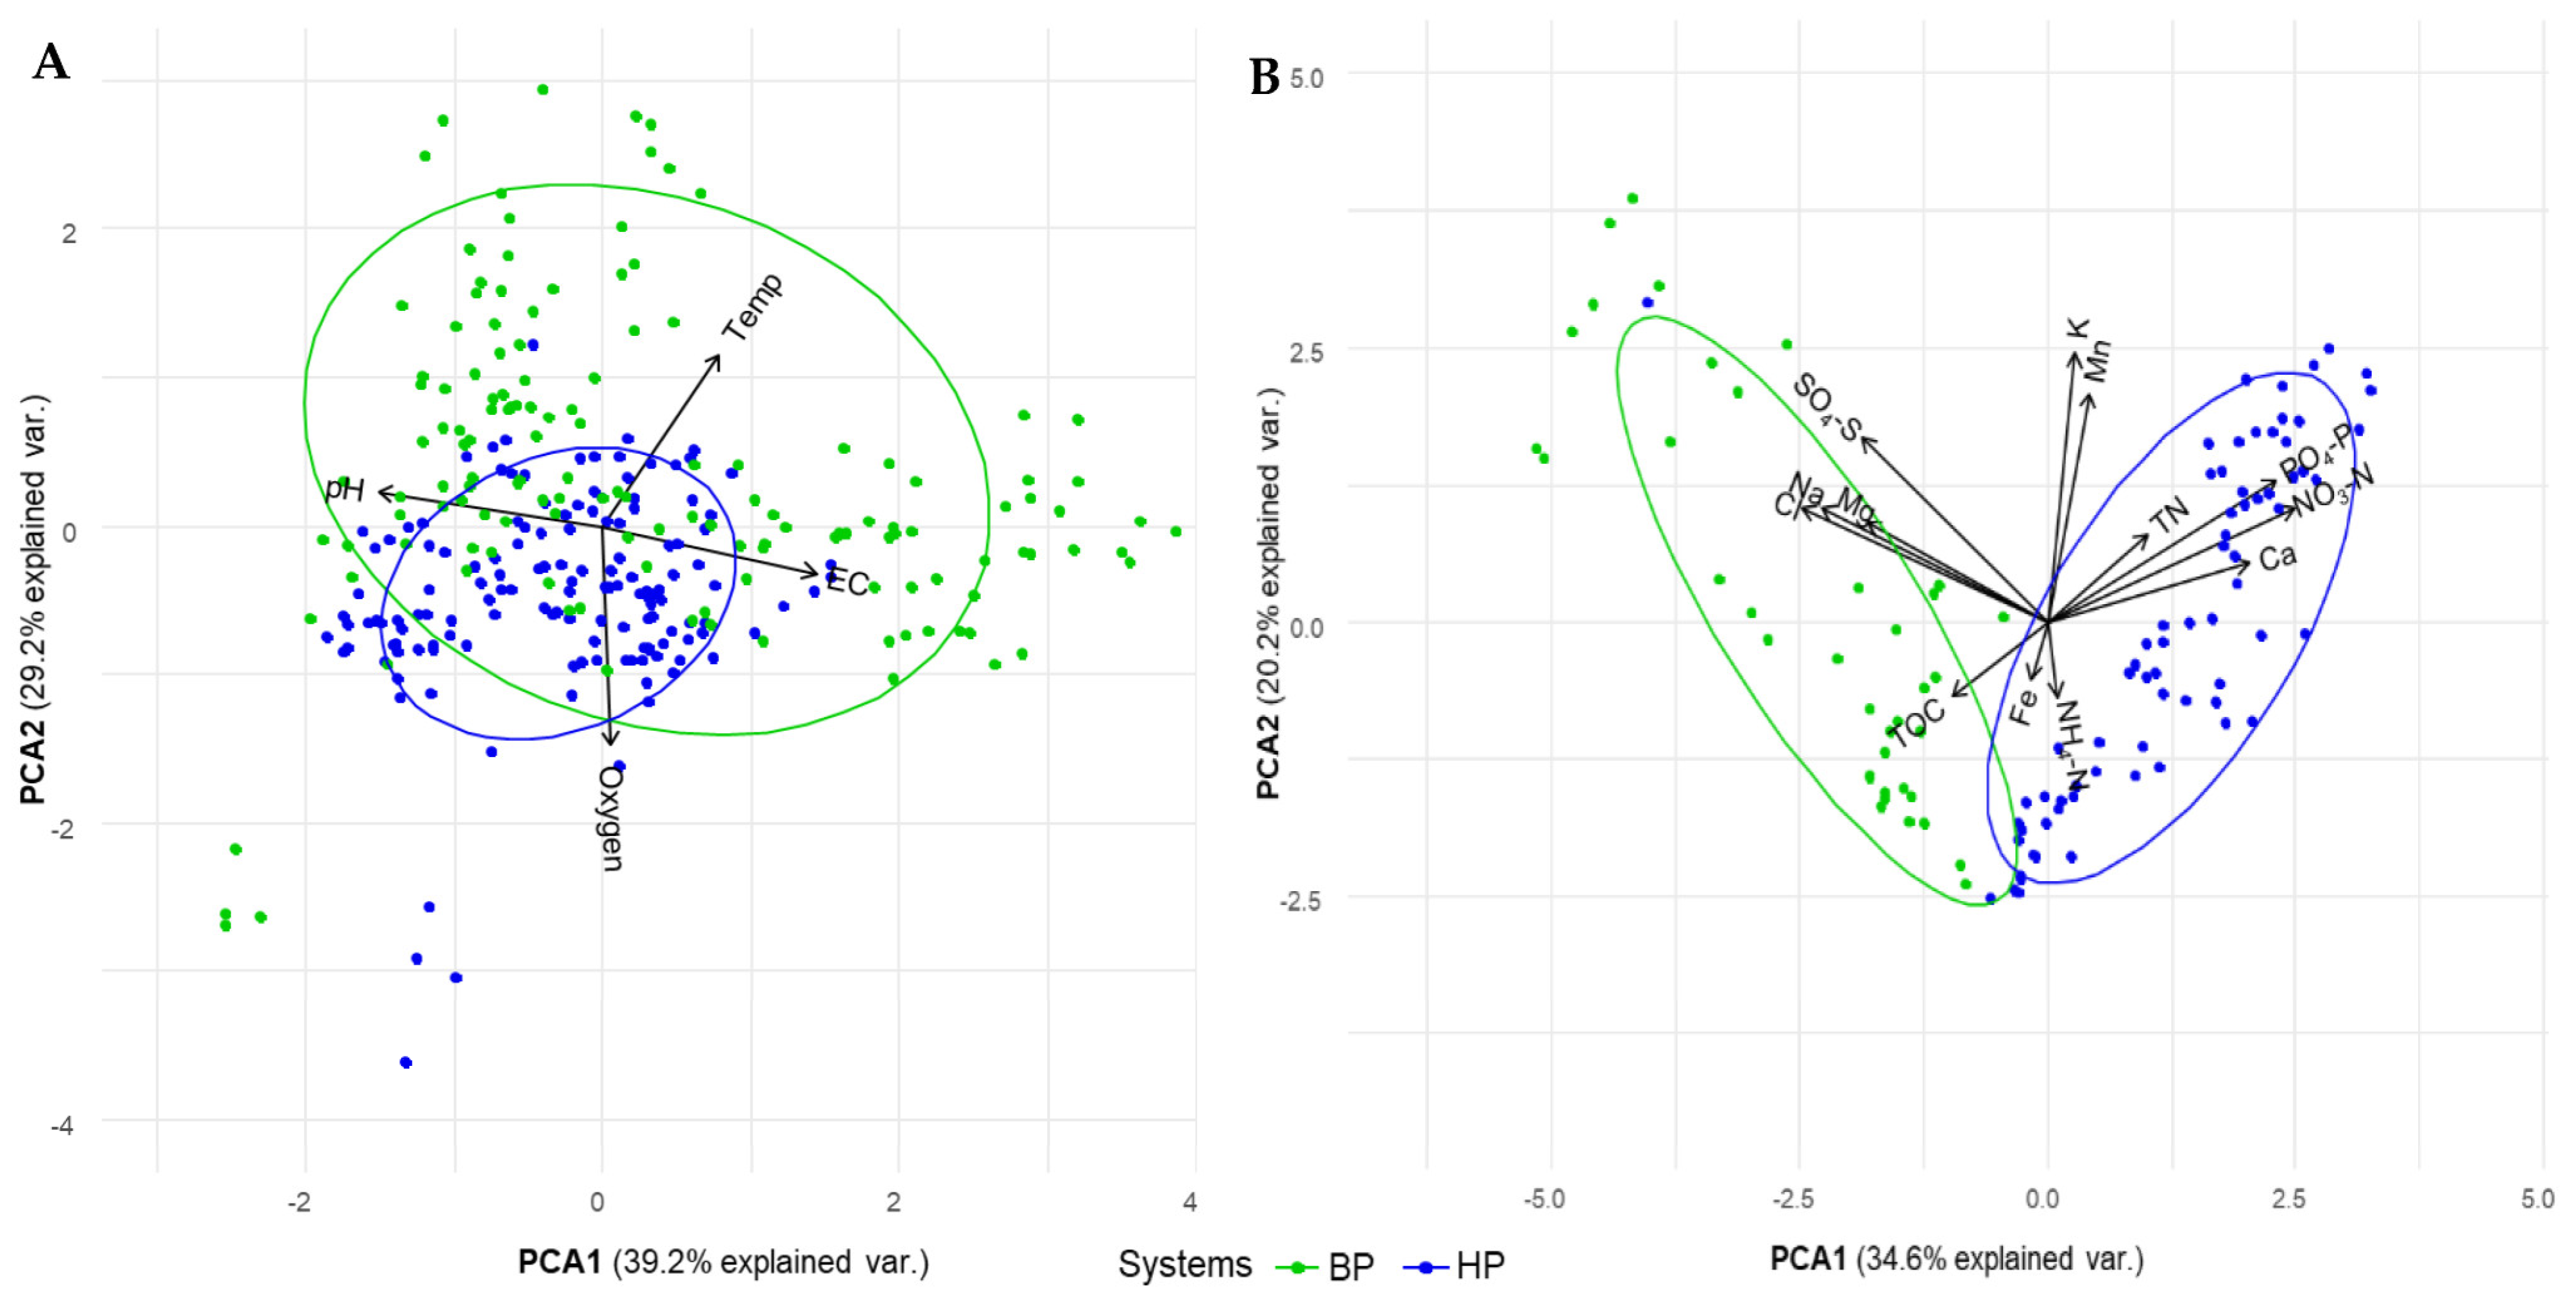
3.1.1. Physiochemical Parameters

The variation of the nutrient solution composition clearly followed the same temporal pattern in all three trials. The pattern in trial C deviated slightly, due to the higher fertilizer addition at the trial’s start (Figure 4 and Figure 5). The oxygen concentration was high in both systems but significantly lower in the BP systems, compared to HP systems, which can be attributed to ongoing biological activity in the biofilter (Table 5). The EC did not differ significantly between the BP and HP systems, and there was consistent temporal development during each trial (Figure 4); in the BP systems, the EC was low in the first half of the trials and increased sharply after second fertilization. At the same time, in HP, the EC was high in the first half and decreased over time. The rapid increase in EC in the BP systems reflected the increasing concentration of salts related to the fertilizer addition (Figure 5), while the decreasing EC in HP was linked to nutrient uptake by plants. The pH in HP was at a target value of 6.5 ± 0.5 over the entire duration of all trials. In contrast, the pH was too high (pH 8) in the BP systems at the start of each trial and did not react immediately to the addition of citric acid (Figure 4). After three days, the pH was stabilized at the target level of 7.0 ± 0.5; pH in the BP systems decreased after the second fertilization in trials A and B, while in trial C, it decreased after the first fertilizer addition (Figure 4), which is connected to the higher addition of the biogas effluent concentrate at system start. After another week, the pH in the BP systems was around 4.5.

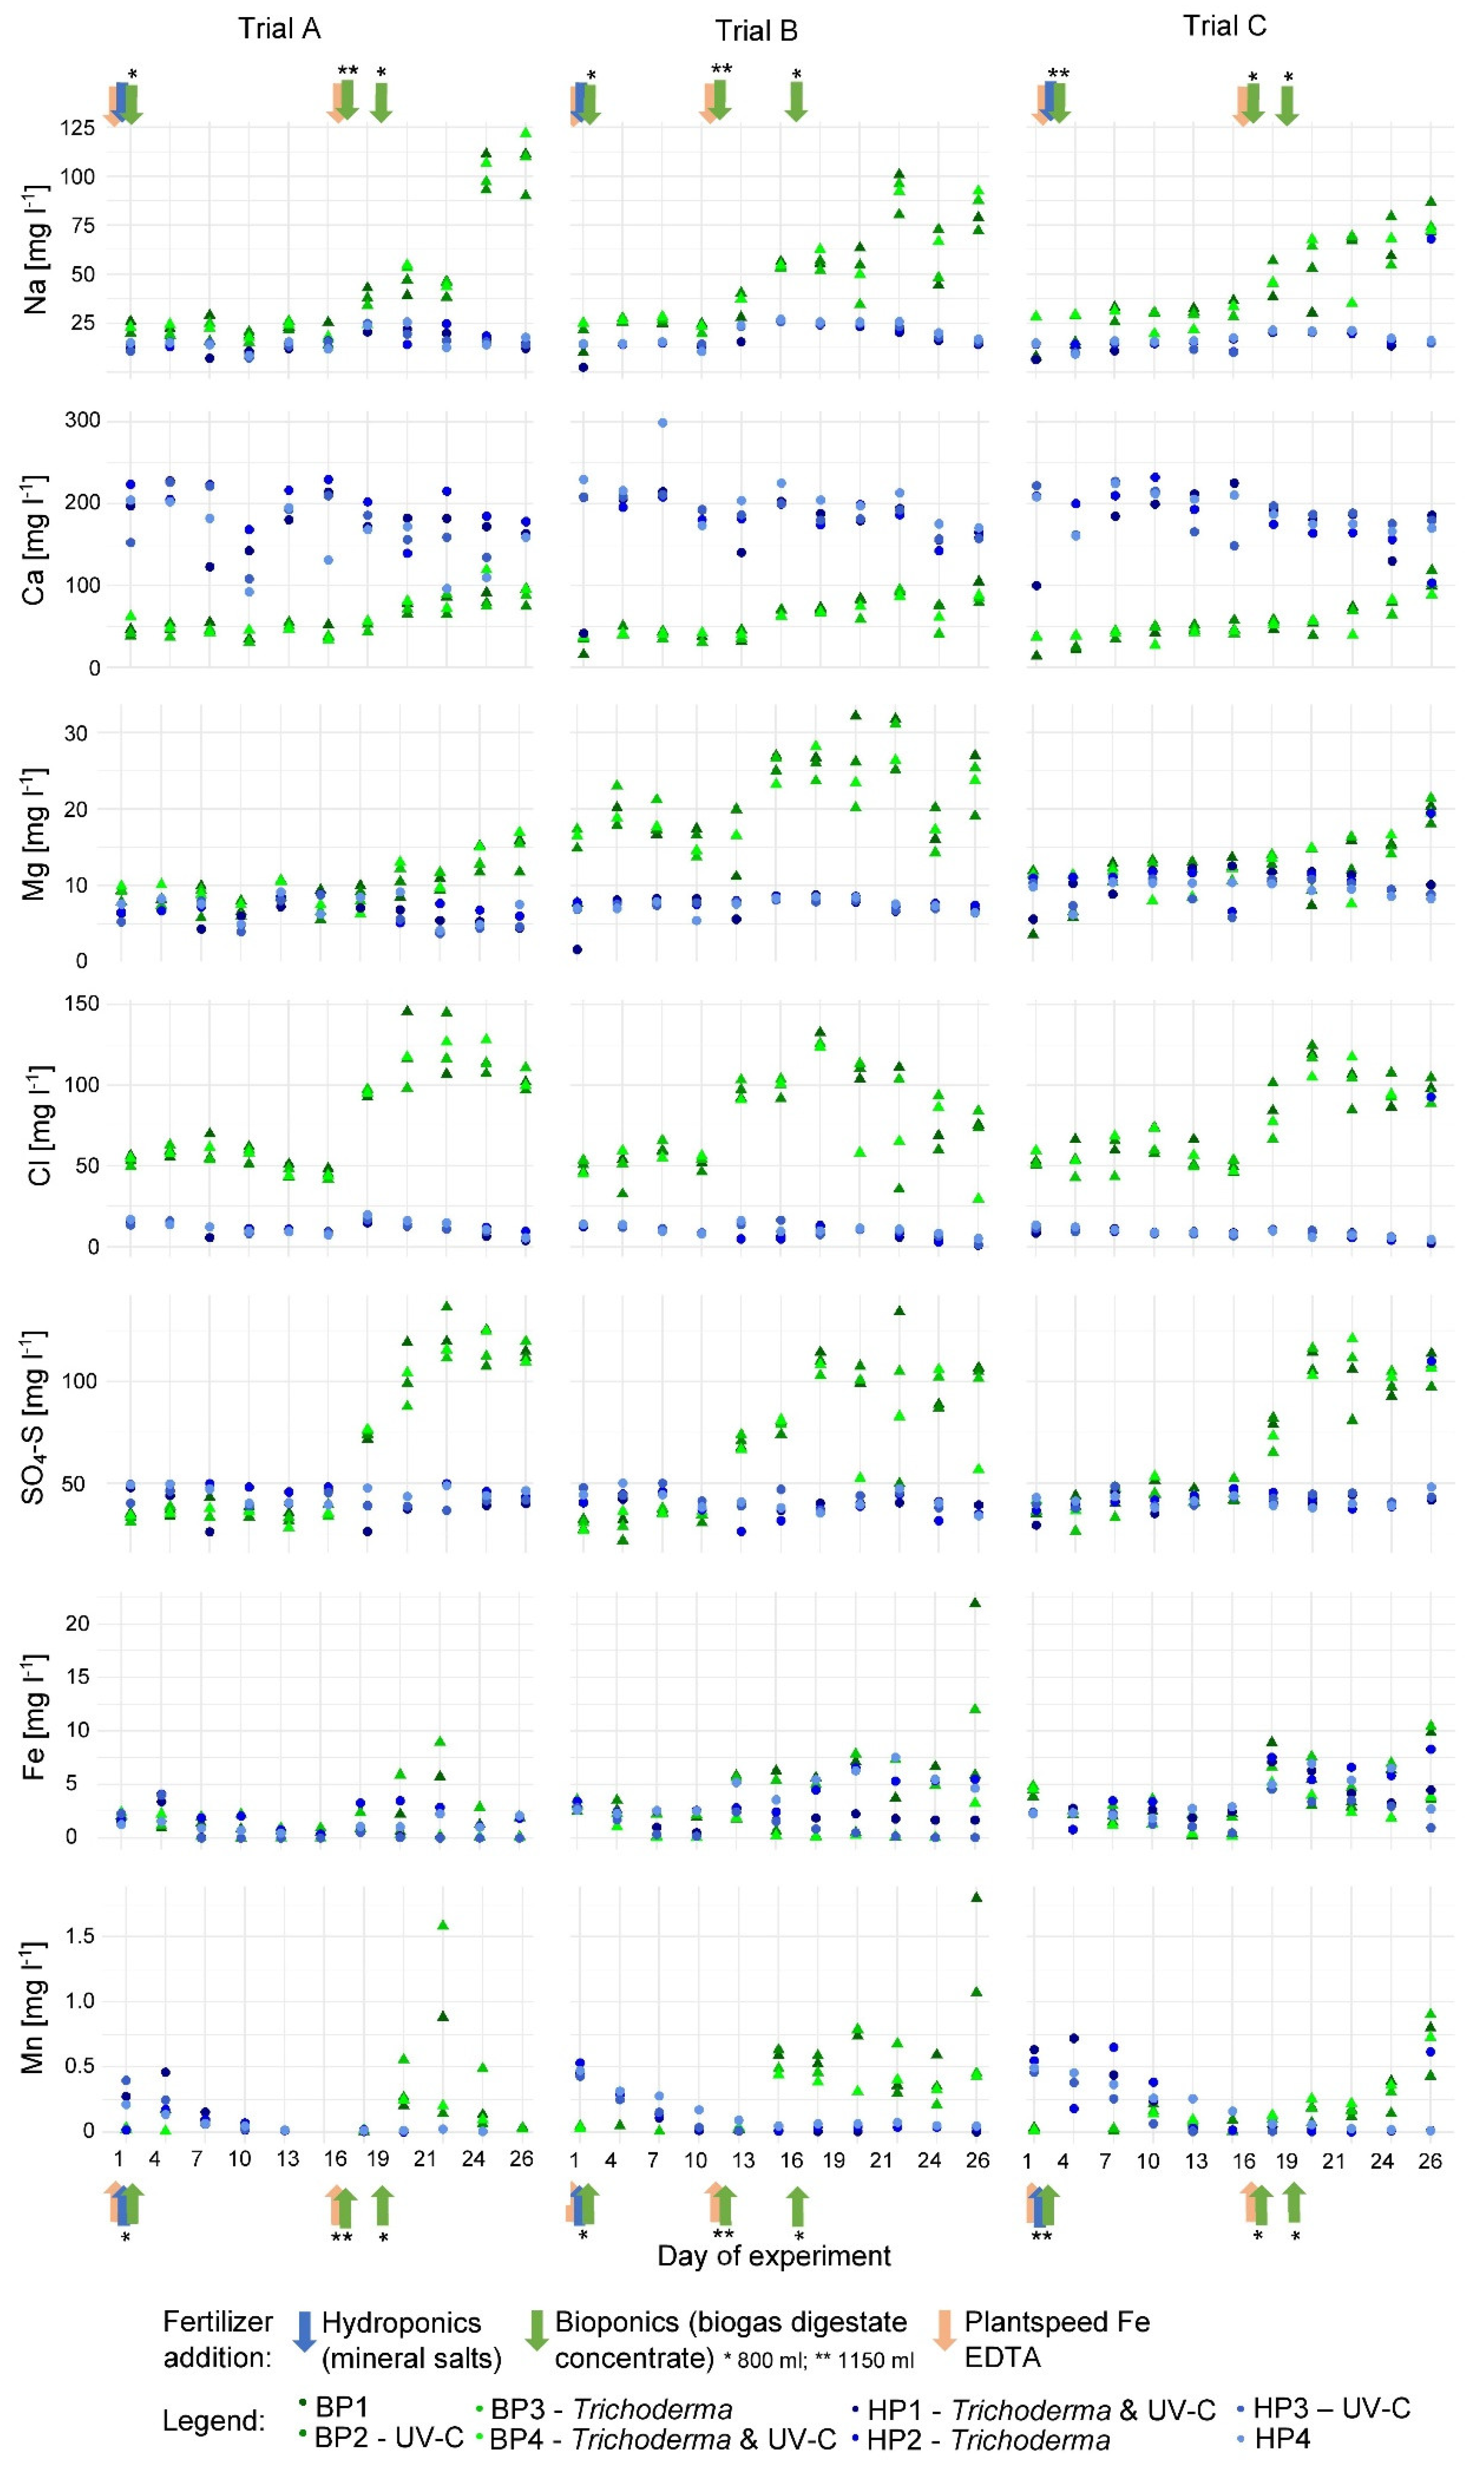
3.1.2. Nutrient Concentrations in the Nutrient Solution

In all trials, a higher level of TN in solution was observed in HP systems, compared to BP systems, which can be attributed partly to a deviation from the target value during nutrient solution calculation (66 mg L−1 NO3-N was added to the systems instead of 50 mg L−1 NO3-N). Due to possible discrepancies between the calculation and the actual concentration of nitrogen in the fertilizers, N concentrations were higher than calculated. Shortly after the second and third ammonium-rich organic fertilizer additions, TOC, TN, and NH4+-N increased in BP systems (Figure 4 and Supplementary File, Figure S2). Additionally, a temporary increase in NO2-N was observed in BP systems after fertilizer additions, while NO3-N increased over time. After week 1, the concentrations for NO3 were low in BP systems; thus, a second dose of fertilizer was added. TOC was higher in BP systems compared to HP systems. The increase in TOC was related to the fertilizer additions.
In HP systems, where the entire amount of plant-available nutrients was added at the system start, NO3-N levels decreased steadily and were very low at the end of each trial. On the other hand, the PO43−-P and K+ were used up earlier, around the middle of the third week. Over time, the concentrations of Na+, Ca2+, Mg2+, Cl, SO42−, and Mn increased in the BP systems, while they remained constant in the HP systems (Figure 5). Systems including a UV-C treatment showed significantly lower iron concentrations in the nutrient solution (Supplementary File, Table S4).
Based on principal component analysis (PCA), temperature, pH, EC, and oxygen saturation explained 39.2% of the variation on the first axis, while, in the second axis, they explained 29.2%, together explaining 68.4% of the variation if selected parameters (Figure 6A). Additionally, the PCA revealed a clear distinction between HP and BP cultivation systems regarding dissolved nutrients (Figure 6B). The first axis explained 34.6% of the variation, while the second axis explained 20.2%, together explaining 54.8% of the variation between selected parameters. As BP systems had comparably higher levels of SO42−, Mg2+, Na+, and Cl, while HP systems had comparably higher levels of TN, PO43−, NO3, and Ca, these profiles reflect the nutrient composition of the fertilizers used.

3.2. Plant Growth and Quality
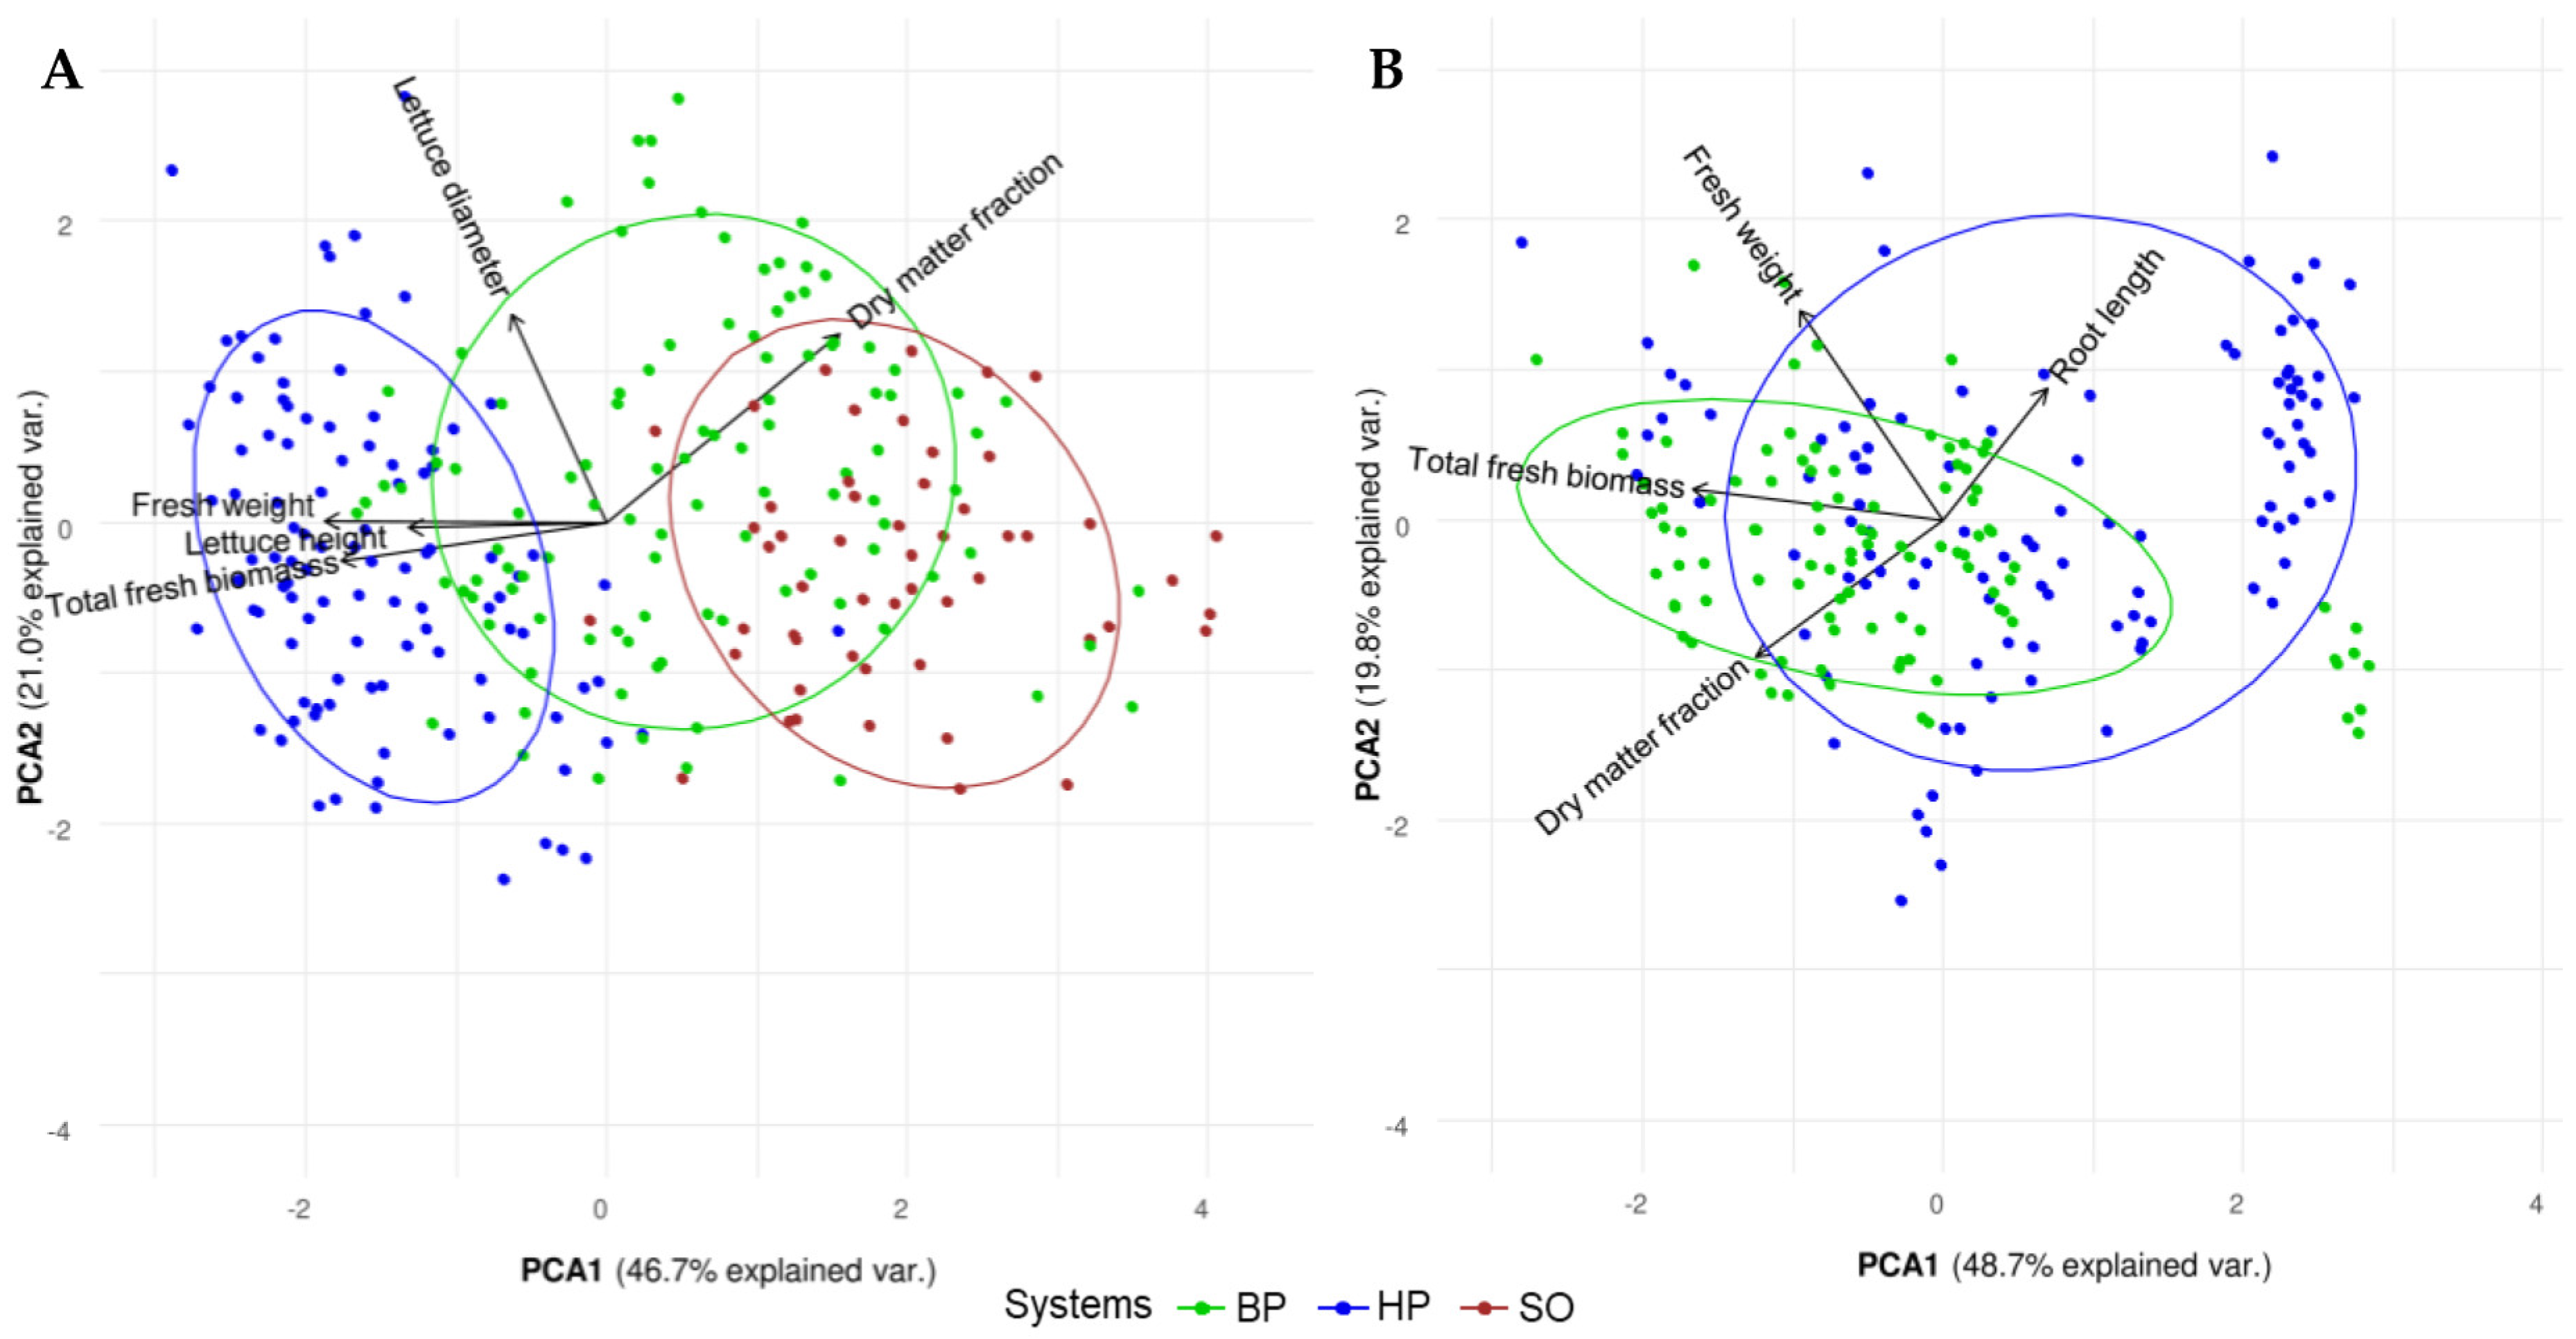
3.2.1. Plant Growth

Plant growth was similar for all three trials (Supplementary File, Figure S2), resulting in lettuce of marketable quality. Overall, plants showed healthy growth, and no visual differences between the cultivation systems were observed (Supplementary File, Figure S3). However, a few lettuces with inner leaf tip-burn occurred at the end of trial A (HP1–Trichoderma and UV-C and HP3–UV-C) and from the middle of trial C (BP2–UV-C) on. According to in vivo Dualex measurements, BP and HP lettuces’ NBI and chlorophyll content were higher than in SO-cultivated lettuces (Supplementary File, Table S5). BP lettuces were the least stressed as they had the lowest flavonoid value (Supplementary File, Table S5). Shoot growth was similar in BP and HP lettuces. However, the yield of the HP systems was significantly higher than that of the BP and SO-cultivated (Table 6). Compared to the HP system, the BP systems produced a yield of ~72%, and the SO systems, ~66%.

3.2.2. Fresh and Dry Weight

The higher fresh weight and lower dry matter fraction of lettuce shoots in HP lettuces, compared to BP and SO-cultivated, indicate that these lettuces contained more water. The root-to-shoot ratio in the BP systems was 0.10 ± 0.02, while in the HP systems, it was lower (0.06 ± 0.04), indicating stronger root growth of BP lettuces, which was also reflected by the higher total root biomass produced per system. However, this was coupled with a shorter root length in BP lettuces (Figure 7).
PCA clearly distinguished between different cultivation systems, regarding plant shoot and root growth (Figure 7). Based on the plant shoot growth parameters, the first axis explained 46.7% of the variation, while the second axis explained 21.0%, together explaining 67.7% of the variation of selected parameters (Figure 7A). Based on the plant root growth parameters, the first axis explained 48.7% of the variation while the second axis explained 19.8%, together explaining 68.5% of the variation of selected parameters (Figure 7B). Lettuce plant shoots from the BP systems were intermediate to those of the HP and SO systems, regarding plant growth (Figure 7A). Lettuce shoots in the BP and SO systems were described by their dry matter fraction, while lettuces from HP systems were described by their fresh weight, lettuce height, and total biomass per system (yield). While lettuce roots in the HP systems were described by their length, the more important parameters of BP lettuces were the dry matter fraction and total fresh biomass per system (Figure 7B).

3.2.3. Shelf-Life and Consumer Test

During the storage period of 14 days, no significant differences in weight loss occurred. The trend indicated that HP lettuces displayed a shorter shelf-life, whereas BP lettuces performed best (Table 6).
The consumer test (Supplementary File, Supplementary Methods) showed that the BP lettuces were rated as high as those produced in the HP and SO systems (Supplementary File, Table S10). The popularity, in terms of appearance, taste, and texture, was about the same for the HP and SO-cultivated lettuces, while the BP lettuces scored slightly lower. Regarding bitterness, the lettuces were the same, although some testers stated ‘just right’ for the BP variant. Lettuces from the SO systems tended to be slightly too weak in flavor. In terms of crispness, HP and SO-cultivated tended to be too crunchy, while the lettuces from BP systems were too delicate. Although BP and SO-cultivated lettuces tended to be less juicy, HP lettuces were ‘just right’.

3.2.4. Plant Nutrients

Generally, the differences between the cultivation systems were reflected in the plant sap of young and old leaves (Table 7). The pH of plant sap was the same in young and old leaves, EC was much lower in younger leaves, and young leaves contained more sugar than old leaves. Concentrations for the element, Silicon (Si), were higher in BP, and SO cultivation, compared to HP, in both young and old leaves. More data on sap can be found in the Supplementary File, Figure S4.

3.3. Food Safety

3.3.1. Leaf Nitrate

According to nitrate analysis (as performed at ZHAW), the lettuces from the BP systems contained the lowest concentrations of nitrate (396.99 ± 274.02 mg kg−1), followed by lettuces from the HP systems (598.65 ± 181.63 mg kg−1) and the SO systems (690.29 ± 132.44 mg kg−1) (Supplementary File, Table S6). According to sap analysis (performed at NovaCropControl), nitrate levels were twice as high in old leaves compared to young leaves (Table 8). In contrast, NH4+ levels were higher in younger leaves than in older leaves. The BP lettuces had the highest NH4+ content, followed by those of the HP and SO systems. However, lettuces grown in the BP systems contained the most Cl, while those grown in SO contained the least.
Comparing the two nitrate (in plant sap; NovaCropControl, and extract; ZHAW), chlorophyll, and NBI measurement methods, significant positive correlations were observed between sap analysis (NovaCropControl) of young and old leaves, sap analysis of young leaves and nitrate in an extract of mixed leaves (ZHAW), and sap of old leaves and nitrate in an extract of mixed leaves (Supplementary File, Table S7 and Figure S5).

3.3.2. Heavy Metals

The heavy metal concentrations measured in lettuce dry matter were below the detection limit for Cd and Pb (Table 9). Additionally, the BP lettuce plants did not show diverging levels of the other heavy metals like Cu, and Al, compared to the HP and SO-cultivated lettuce plants. This indicates that this lettuce is suitable for consumption according to the analyses performed within this study.

3.4. Biocontrol

3.4.1. UV-C Treatment

While the UV-C dose in the BP systems was around the target value of 88 mW s−1 cm−2, the water system in the HP systems was exposed to a higher UV dose. This is likely due to higher transmission of the nutrient solution, because these systems did not include particles from the biochar (Supplementary File, Figure S6). In trials A and B, the applied UV-C dose increased towards the end of the trial, while in trial C it decreased, which is connected with the transmission of the system waters (Supplementary File, Table S8).
The UV-C light treatment decreased the TOC in BP and HP systems (Figure 4), while plants in the BP systems had shorter root lengths when UV-C light was applied (Supplementary File, Figure S4). Additionally, the fresh weight of lettuce roots was higher in HP systems with UV-C light treatment.

3.4.2. Application of Trichoderma atrobrunneum as Biocontrol Organism

In systems where Trichoderma atrobrunneum strain T720 was not applied, the organism could not be detected (Supplementary File, Table S9). Conversely, in systems where the fungal biocontrol agent was applied, it was present until the end of the trials, even though there was a degree of absence of Trichoderma results in the intermediate samples. The minor difference in the nutrient solution, plant sap, or lettuce growth does not point in a defined direction (Supplementary File, Figure S4). Therefore, it is unclear to what extent these differences can be attributed to the treatment. For this reason, only the most significant (p < 0.01) observations are described.
Trichoderma was able to survive, including in systems with UV-C treatments (Supplementary File, Table S9);even the rapid pH drop in the BP systems did not cause Trichoderma to die. The extent of colonization cannot be quantified with the data obtained from this study.
The application of Trichoderma had no statistically significant effect on the chemical water parameters (Figure 5 and Supplementary File, Figure S4). As nitrification still took place, it can be assumed that Trichoderma treatments did not negatively influence the HP, BP, and SO systems’ microorganism community. However, the shoot height of lettuces grown in the BP systems, with the application of Trichoderma, was significantly increased, compared to the HP and the SO. In the SO system with Trichoderma application, a significantly higher chlorophyll and flavonoid content, and significantly lower shoot height were observed. The fresh weight of lettuce roots was significantly higher in the HP systems with Trichoderma treatment. The shelf-life of lettuces was neither significantly influenced by Trichoderma, nor the UV-C application on the nutrient solution.

4. Discussion

The three successive trials in summer provided results on the growth of BP lettuce, and allowed for comparison with growth in conventional HP and SO systems. Plants in all three cultivation systems were healthy, and adequate plant growth was recorded. The indicators of plant growth and biomass quality in the BP systems were often intermediate between the HP and the SO, indicating that BP cultivation is a more “natural” method than conventional HP cultivation, such as in the addition of a biofilter compartment, and of biochar as a nutrient source. The novel BP method that we tested featured several modifications compared to HP cultivation, such as the addition of a biofilter compartment, and of biochar as a nutrient source. As a consequence of using an organic nutrient source, the BP nutrient solution needed continuous monitoring, pH adjustment, and fertilizer supplementation. The usage of biogas plant concentrate led to salt accumulation, but the plant sap contained less nitrate in the BP systems than in the HP and the SO.

4.1. Nutrient Solution Characteristics

4.1.1. Physiochemical Parameters

Nitrification, the key biochemical process in BP cultivation, occurs under aerobic conditions. Therefore, it is vital to maintain all parameters within the optimal range to promote the growth of nitrifying bacteria [76], particularly by keeping pH at ~7 during the trials (Table 5). However, the pH was adjusted to be one unit lower in the HP systems, ~6.0, for the optimal nutrient uptake by plants, as the nitrification process is not required in HP systems. Due to the higher pH in BP systems, reduced nutrient uptake could have occurred, especially for the micronutrients [2], resulting in an 18% smaller yield (Table 6). At the beginning of the trial, the pH was around 8, and therefore higher than the target pH value in BP systems. Additionally, as biochar was used, it was difficult to lower the pH level within the system because of its alkalinity and buffering effect. A fast pH drop after the second fertilizer addition was observed (Figure 4), corresponding to data from butterhead lettuce production in NFT channels, based on an organic nutrient procedure, where pH fluctuates more when the buffering capacity is exhausted [21]. Microbial activity, associated with the addition of the carbon source in organic fertilizers, may contribute to rapid pH changes [77].

4.1.2. Nutrient Concentrations in the Nutrient Solution

Bioponic systems are characterized by a higher total organic carbon (TOC) level than HP systems (Figure 4), due to the high organic nutrient content of the fertilizer used [21]. The observed NO2 peaks, after fertilizer additions and an increase in NO3 in BP systems over time (Figure 4), indicate that nitrification was ongoing and is in line with the work by Sheshtawy et al. [78]. Our findings were also consistent with the knowledge that the use of a biofilter in BP systems is essential to lower the risk of phytotoxic effects by increasing the amount of better plant-available nitrogen [28], and to reduce loss of TN from volatilization by conversion of NH4+ to NO2/NO3 [79]. Furthermore, to prevent growth limitations and reduce plant stress, smaller yet continuous fertilizer applications would improve system operation and nutrient availability in BP systems. On the other hand, plant-growth-relevant parameters, such as NH4+, NO3, PO43−, and K+, should be monitored regularly.
Biogas digestate concentrate contains high concentrations of Na+, Ca2+, Mg2+, Cl, SO42−, and Mn (Table 1), resulting in salt accumulation in the nutrient solution, which is known for organic fertilizers used in soilless cultivation [21,80]. This was also found in this study (Figure 5). Therefore, plant nutrient uptake can be inhibited, especially in BP systems. As uncharged components, such as organic molecules, do not contribute to the EC until microbial degradation begins (Figure 4) [21], it is not possible to rely on EC to obtain information when organic fertilizer, such as biogas effluent, addition is required. Additionally, non-essential salts for plants, such as Na+ and Cl, which are contained in biogas digestate, were detected (Figure 5) [21]. Therefore, it would be advantageous if only the plant-growth-relevant parameters, such as NH4+, NO3, PO43−, and K+, could be monitored on routine ion-specific measurements. Sensors are currently being developed that allow ion-selective measurements in nutrient solutions [80]. Voogt et al. [79] developed a possible solution to prevent Na+ accumulation, using a desalinization system based on reverse osmosis. The high amount of SO42− found at the end of the trials (Figure 5) could be a result of the nutrient release under aerobic conditions over time, which was also found by Goddek et al. [81].
Iron is needed to synthesize chlorophyll, and plays an essential role in maintaining the structure and function of chloroplasts. Symptoms of iron deficiency are interveinal chlorosis in young leaves and stunted root growth, leading to poor yield and reduced nutritional quality [82]. Consequently, iron was added to the HP and BP systems at the start and middle of each trial. A steady decrease in concentration over time was observed (Figure 4 and Figure 5). The iron concentration in the BP systems was slightly but not significantly higher than in the HP. This could be related to the biogas digestate concentrate composition, as the biogas plant also processes slaughterhouse waste. Systems with UV-C treatment showed a significantly lower concentration of iron in the nutrient solution (Supplementary File, Table S4), assuming that the complexing agent, EDTA, was degraded by the UV-C radiation, as previously described [83,84]. However, the iron concentration in the plant sap did not differ significantly between the individual treatments (Supplementary File, Figure S4). The lettuce plants did not show any signs of iron deficiency (Supplementary File, Figure S3), suggesting that, even though significantly lower, plants in UV-C treatment did not suffer iron deficiencies. Nevertheless, diethylenetriaminepentaacetic acid (DTPA) would probably be more suitable for future experiments, especially because BP systems usually have a higher pH value than HP systems [84], as the optimal pH range for ETDA is between 4 and 6.

4.2. Plant Growth and Quality

Chlorophyll, an antioxidant, is a health-promoting substance in human nutrition [85]. Lettuces grown in BP and HP systems contained significantly more chlorophyll than SO-cultivated lettuce (Supplementary File, Table S5). This could be related to better iron availability in soilless production systems, as the chlorophyll content is related to iron uptake [86]. In the experiment by Song et al. [87], the antioxidant contents generally decreased with increasing nutrient solution levels in lettuce production. Therefore, due to the lower strength of the BP nutrient solution compared to that in the HP systems, it is possible that the BP lettuces in this study also contained more antioxidants.
While in this study, the yield from the BP systems was 72% of the yield in conventional HP cultivation (Table 6), the BP lettuce yield was also lower in the studies by Williams and Nelson [21], and Atkin and Nichols [88], ~63% and ~45%, respectively. Nozzi et al. [89] produced a yield of ~89% in aquaponics compared to HPs. These differences can be attributed to the available macronutrients in the nutrient solution (Figure 4). To achieve higher nutrient levels, converting nutrients in an external reactor (for nitrification), with the subsequent addition of this solution to the BP system, would be an option. The dry matter fractions of BP and SO-cultivated lettuces, compared to HP, were higher (Table 6), while BP was between HP and SO-cultivated, indicating that nutrients from organic sources improve the quality of produced lettuce [90]. It is possible that NO3 was limiting plant growth in the BP systems after week one, as its concentrations were low (Figure 4). Compared with other studies [91], the root-to-shoot ratio obtained was low for both cultivation systems of this study (Table 6; if using a commercial HP solution, this ratio would probably be higher), indicating that root growth was increased because of low nutrient levels. As a result, plants invested more in lateral root growth to increase nutrient uptake [92,93].
The inner leaf tip-burn, shown by a few plants (Figure S3), is a physiological disorder involving calcium and water uptake connected to the microclimate in lettuce shoots, and is a common abiotic issue in hydroponics [94]. In this study, the Ca2+ content in plant sap composition was lower in BP plants compared to HP and SO-cultivated, which also indicates that less water was incorporated in BP plants than in HP plants [94]. The risk of inner leaf tip-burn can be reduced by adequate ventilation [95].
Although commercial lettuce production requires adequate levels of nitrogen (N), phosphorus (P), and potassium (K) to provide high-quality postharvest attributes, which are essential for longer shelf-life [96], we did not observe significant differences in the shelf-life of BP, HP, and SO-cultivated lettuces (Table 6). For human nutrition, the ingredients in the lettuce must comply with the legal requirements [97]. The values for Cd and Mn were below the detection limit, and therefore compliant with the legal maximum values (Table 9).
Silicon (Si), which is more present in the sap of BP and SO-cultivated plants than HP plants (Table 7), is one of the most beneficial micro-elements for several plants. However, in the literature, its role has not been considered essential in plant nutrition. For this reason, Si is not used as a common ingredient in hydroponic recipes, despite having several beneficial effects, such as the mitigation of environmental and pathogenic stresses [98,99].

4.3. Food Safety

4.3.1. Leaf Nitrate

Plants can accumulate NO3 to a high degree [97]. Nitrate levels are particularly high when the plants grow under insufficient light conditions during the cold season [91]. The NO3 content in plants can be controlled to some extent by adapted fertilization [86], sufficient light, and afternoon harvesting [100].
For lettuce production in Switzerland, a maximum value of 4000 mg nitrate kg−1 fresh weight applies for outdoor cultivation, and 5000 mg nitrate kg−1 for glass/foil cultivation during the warm season [97], while the EU limit value is 2500 mg nitrate kg−1 in the open air and 3500 mg NO3 kg−1 under cover [101,102]. In this study, all measured NO3 concentrations (Table 8 and Supplementary File, Table S6) were below these maximum values. The values for old leaves in the HP and SO systems were high but comparable with those measured in the study by Fallovo et al. [89]. In general, young leaves contain less nitrate than old leaves [103], which was also confirmed in this experiment (Table 8). The high NO3 accumulation could be further explained by the high nutrient uptake of lettuce. Lettuce needs to keep a high turgor pressure, resulting in the accumulation of NO3 in its leaves [91,104]. The tendency of higher NO3 content with higher salinity levels can also be explained by the osmotic adjustment that allows plants to absorb water under low total water potential [105].
Although in this study, the NO3-N levels in the HP systems decreased steadily and were very low at the end of each trial (Figure 4), lettuce grown in the BP systems accumulated less NO3 than that in the HP and SO systems (Table 8). This could be related to the lower TN concentrations and the continuous N release (Figure 4 and Figure 5) during the entire cultivation, because of organic nutrient sources [21]. The fertilizer management (three fertilizer applications during one trial), and the differing proportions of N-forms (relatively more NH4+ present in the nutrient solution of the BP systems compared to the HP) contained in biogas digestate concentrate, may have also led to less NO3 being incorporated in lettuce leaves. This study also observed that the use of ammonium-rich fertilizers in soilless systems led to reduced leaf NO3 concentrations [106], with the BP lettuces containing more NH4+ and CL in leaf sap than the HP (Supplementary File, Figure S4). Blom-Zandstra and Lampe [107] found that the NO3 content in the lettuce leaves was lower, due to increased chloride uptake. As more chloride was present in the BP nutrient solution in this study, it is likely that chloride was absorbed more than NO3 [108], which would reflect the high chloride value in plant leaf sap (Table 8). Another possible reason for the lower NO3 content in lettuce shoots could be the significantly higher amount of silicon in the BP nutrient solution. Manzocco et al. [105] suggested adding silicon to the HP solution as an interesting strategy to increase yield and reduce NO3 accumulation. Therefore, various explanations are possible for why BP lettuce accumulates less NO3, and no special strategy is required to produce low-nitrate lettuce in BP systems. However, the exact reason for lower NO3 levels should be researched further.
Regarding the two different methods of measuring NO3 in plant leaves, it is noticeable that the values of the mixed sample of young and old leaves measured in plant sap extract by IC were lower (Table 8 and Supplementary File, Table S6). However, significant positive correlations were obtained by comparing the two nitrate (in plant sap; NovaCropControl, and extract; ZHAW), chlorophyll, and NBI measurement methods (Supplementary File, Table S7 and Figure S5).

4.3.2. Heavy Metals

Markou et al. [109] conclude that, depending on the digestion parameters and the specific antibiotic compounds used, the degree of elimination of heavy metals varies highly. Heat treatment and the subsequent use of solid/liquid separation, as applied on the biogas effluent concentrate used for this study, can significantly decrease the heavy metal concentration in the liquid [109]. However, it is recommended that the potential risks of heavy metals, in terms of food safety, are investigated further.
In the EU, the maximum levels of heavy metals allowed in plants for human consumption are set at 0.20 mg kg−1 for cadmium and 0.30 mg kg−1 for lead [102]. The heavy metals of the lettuce produced in this study (Table 9) are below these values.

4.3.3. Other Harmful Substances

Any substances (e.g., antibiotics, disinfectants, endocrine-disrupting compounds, mycotoxins, fungicides, etc.) that are used in food production and animal husbandry may end up in the biogas plant, and are therefore a potential risk when closing nutrient cycles. However, some studies have shown that anaerobic methanization, which achieves high temperatures, also degrades many such substances [110,111]. Previous screenings of 80 pesticides in biogas effluent (ZHAW, unpublished data, 1998) have shown that all potential contaminants were under detection level. While Combalbert et al. [51] stated that antibiotics could not be eliminated under anaerobic conditions, Visca et al. [52] found that emerging environmental contaminants from widely used antibiotics in human and veterinary medicine, such as sulfamethoxazole, enrofloxacin, and ciprofloxacin, were almost removed during anaerobic digestion.

4.4. Biocontrol

4.4.1. UV-C Treatment

The decrease in TOC in BP and HP systems, because of UV-C treatment, is typically applicable for nutrient solutions that are high in organics [112]. The observed increase in TOC (Figure 4), and the decrease in transmission in trial C (Supplementary File, Figure S6), could be related to increased algae growth in the nutrient solution. The fertilizer application at the start of trial C was higher compared to trials A and B (Table 2). Therefore, the algae, which entered the production system attached to the seedling rockwool cube, had more nutrients available for their growth from the beginning of the trial. Additionally, the fresh weight of lettuce roots was higher in HP systems with UV-C treatment (Supplementary File, Figure S4).
To harm Pythium, the applied dose would have had to be increased during the experiment, to compensate for the increased absorbance of UV radiation in the solution [82]. However, it was not adjusted because the target UV-C dose was set at a high level. Therefore, the extinction was simply measured, and the applied UV-C dose was calculated.

4.4.2. Trichoderma atrobrunneum Strain T720 Application

In this study, the fungal biocontrol agent, Trichoderma atrobrunneum strain T720, survived in all systems. The absence of Trichoderma at the start of the trials (Supplementary File, Table S9) could be related to insufficient mixing in the system water to date. In the samples of seedling production, for the SO systems with Trichoderma application, the fungus could not be detected, whereas it was found in seedling production, based on rockwool. It is unclear whether the amount of Trichoderma, used for inoculation at sowing and after 13 days, was sufficient for the beneficial fungus to colonize the substrate in the seedling trays.
The T. atrobrunneum strain T720 survived in soil and soilless cultivation systems. The UV-C treatment, and the fast pH drop (from pH 8 to pH 4.5) in the BP systems (Figure 4), had no measurable effect on the presence of the fungal biocontrol agent. Only a few significant differences were observed, regarding the addition of Trichoderma to the nutrient solution, lettuce growth, or plant sap composition. The shoot height of lettuces grown in the BP system, with the application of Trichoderma, was significantly increased compared to those in the HP and SO systems (Supplementary File, Figure S4). Via the production of organic acids, such as gluconic or citric acid, Trichoderma is able to lower the pH value locally and therefore increases the solubilization of phosphates and micronutrients, such as iron, magnesium, and manganese [48]. Due to the increased pH value prevailing in this experiment, it is possible that nutrient uptake by the beneficial fungus was promoted. However, no significant differences were observed in plant sap analysis (Supplementary File, Figure S4). The difference in flavonoid content in the SO systems (Supplementary File, Figure S4) could be attributed to stress conditions, due to watering on demand, which may have led to water stress [113]. However, further observations, by conducting a stress-test with an artificial Pythium spp. Infection, would help to generate insights into how the different systems and applications respond to this fungal infection.

5. Conclusions

The bioponic cultivation of lettuce, using biogas effluent concentrate and biochar as nutrient sources, was successful and resulted in marketable lettuces. However, at the present state of development, bioponics requires commitment and experience in nutrient monitoring and system management. To foster circularity in large hydroponic enterprises, and substitute unsustainable mineral nutrient solutions in cultivation, the research should focus on improving the composition of organic fertilizers to allow for comparable ease of application. Additionally, system development should include in-depth studies of biofilter management and integrate appropriate ICT, IoT, and sensor devices.
In BP cultivation, a biofilter (either within the system, or externally to increase nutrient levels) can help to convert the ammonium-rich fertilizer to plant-available nutrients faster. Unlike conventional HP systems, BP systems cannot rely only on electrical conductivity (EC), as uncharged components do not contribute to the measurement. Many organic molecules do not all have charge until microbial degradation begins, highlighting their ability to release nutrients over time. Thus, close monitoring of the nutrient concentrations, such as NH4+, NO3, PO43−, and K+, in the BP systems is required. In the study, the BP yield was smaller compared to the HP, but higher than in SO culture. However, compared to HP cultivation, lettuces with a better nutrient composition for human nutrition were produced resource-efficiently with recycled nutrients and water in the BP and SO systems. Lettuces produced in the BP systems contained less NO3, but more NH4+, Cl, and Si, which is related to the nutrient solution characteristics. Technological solutions for dealing with salt accumulation, a common problem in organic fertilizers, will advance BP cultivation and improve overall water and nutrient consumption needed for food production.
It Is essential to know the exact composition and source of the organic waste stream used for plant production, as this can lower the risks of harmful or toxic substance presence. Moreover, awareness of the extent to which the plants absorb them, to minimize the risk of other harmful substances on human health, should be considered. Thus, subsequent studies should focus on determining whether biogas digestate contains harmful substances that could accumulate in the system water and produced crops. The BP lettuces did not show higher levels of heavy metals, compared to the HP and SO-cultivated lettuces. Furthermore, the effect of the biocontrol agent had some beneficial properties. For example, the shoot height of lettuces grown in the BP system, with the application of Trichoderma, was increased, compared to the HP and SO systems. The presence of Trichoderma might be useful for enhancing the growth of soilless plants and reducing diseases that can occur in this cultivation system.

Supplementary Materials

The following supporting information can be downloaded at: https://www.mdpi.com/article/10.3390/agronomy13061436/s1, Supplementary Methods, Supplementary Tables, and Supplementary Figures.

Author Contributions

Conceptualization, F.G., J.H., Z.S. and R.J.; methodology, F.G., J.H., N.B., Z.S., T.H.M.S. and R.J.; practical implementation, F.G. and J.H.; formal analysis, F.G. and J.H., data analysis F.G., J.H. and N.K.; data curation, F.G.; writing—original draft preparation, F.G. and J.H.; writing—review and editing, F.G., J.H., N.K., N.B., Z.S., T.H.M.S. and R.J.; visualization, F.G. and N.K.; supervision, N.B., Z.S., T.H.M.S. and R.J.; project administration, R.J.; funding acquisition, N.B., T.H.M.S. and R.J. All authors have read and agreed to the published version of the manuscript.

Funding

This research was funded by the Department of Life Sciences and Facility Management of the Zurich University of Applied Sciences, seed grant (Anschubfinanzierung) 2020/21.

Data Availability Statement

The data presented in this study are available in this article or in Supplementary Materials.

Acknowledgments

The authors express their gratitude to Katjusa Mezek, Nikita Krähenbühl, Rahel Wanner and Alex Mathis (Zurich University of Applied Sciences, Wädenswil, CH). The authors would like to thank the team at MycoSolutions AG for the good collaboration and the Trichoderma analyses, to the Environmental Analytics research group for the ICP analyses, and to the Food Sensory research group of the Institute of Food and Beverage Innovation at Zurich University of Applied Sciences for supporting the consumer test.

Conflicts of Interest

The authors declare no conflict of interest.

References

  1. United States. The 17 Sustainable Development Goals. Available online: https://sdgs.un.org/goals (accessed on 14 June 2021).
  2. Resh, H.M. Hydroponic Food Production: A Definitive Guidebook for the Advanced Home Gardener and the Commercial Hydroponic Grower; CRC Press: Boca Raton, FL, USA, 2015; ISBN 9781482239263. [Google Scholar]
  3. Sánchez, H.J.A. Lactuca Sativa Production in An Anthroponics System. 2015. Available online: https://www.hemmaodlat.se/research/lactuca%20sativa%20production%20in%20an%20anthroponics%20system.pdf (accessed on 5 January 2021).
  4. Nicola, S.; Ferrante, A.; Cocetta, G.; Bulgari, R.; Nicoletto, C.; Sambo, P.; Ertani, A. Food supply and urban gardening in the time of covid-19. Bull. Univ. Agric. Sci. Vet. Med. Cluj-Napoca. Hortic. 2020, 77, 141. [Google Scholar] [CrossRef]
  5. Bulgari, R.; Petrini, A.; Cocetta, G.; Nicoletto, C.; Ertani, A.; Sambo, P.; Ferrante, A.; Nicola, S. The impact of Covid-19 on horticulture: Critical issues and opportunities derived from an unexpected occurrence. Horticulturae 2021, 7, 124. [Google Scholar] [CrossRef]
  6. Basak, B.B.; Maity, A.; Biswas, D.R. Cycling of natural sources of phosphorus and potassium for environmental sustainability. In Biogeochemical Cycles: Ecological Drivers and Environmental Impact; John Wiley & Sons: Hoboken, NJ, USA, 2020; pp. 285–299. ISBN 978-1-119-413332. [Google Scholar]
  7. Kumar, R.R.; Cho, J.Y. Reuse of hydroponic waste solution. Environ. Sci. Pollut. Res. 2014, 21, 9569–9577. [Google Scholar] [CrossRef] [PubMed]
  8. Graber, A.; Junge, R. Aquaponic Systems: Nutrient recycling from fish wastewater by vegetable production. Desalination 2009, 246, 147–156. [Google Scholar] [CrossRef]
  9. Pradhan, S.K.; Nerg, A.M.; Sjöblom, A.; Holopainen, J.K.; Heinonen-Tanski, H. Use of human urine fertilizer in cultivation of cabbage (Brassica oleracea)—Impacts on chemical, microbial, and flavor quality. J. Agric. Food Chem. 2007, 55, 8657–8663. [Google Scholar] [CrossRef]
  10. Songthanasak, K.; Klongtroujrok, C.; Swattdipat, Y.; Sumphunprateep, S.; Lawchod, T. Preliminary Study on Urine-Compost Extract as Bio-Liquid Fertilizer for Hydroponics. 4th Int. Dry. Toilet. Conf. 2012, 1–7. Available online: http://resources.cwis.com.s3.amazonaws.com/evidence/files/2-1618-44-preliminary-study-on-urine-compost-extract-as-bio-liquid-fertiliser-for-hydroponics-k-songthanasak-c-klongtroujrok-y-swattdipat-s-sumphunprateep-t-lawchod-.pdf (accessed on 5 June 2021).
  11. Dumitrescu, V.A. Comparative Analysis of Biogas Slurry and Urine as Sustainable Nutrient Sources for Hydroponic Vertical Farming. Master’s Thesis, Linköping University, Linköping, Sweden, 2013. [Google Scholar]
  12. Monsees, H.; Suhl, J.; Paul, M.; Kloas, W.; Dannehl, D.; Würtz, S. Lettuce (Lactuca sativa, variety Salanova) production in decoupled aquaponic systems: Same yield and similar quality as in conventional hydroponic systems but drastically reduced greenhouse gas emissions by saving inorganic fertilizer. PLoS ONE 2019, 14, e0218368. [Google Scholar] [CrossRef]
  13. Ferreira, F.P.; Caldart, E.T.; Freire, R.L.; Mitsuka-Breganó, R.; de Freitas, F.M.; Miura, A.C.; Mareze, M.; Martins, F.D.C.; Urbano, M.R.; Seifert, A.L.; et al. The effect of water source and soil supplementation on parasite contamination in organic vegetable gardens. Braz. J. Vet. Parasitol. 2018, 27, 327–337. [Google Scholar] [CrossRef]
  14. Bourn, D.; Prescott, J. A comparison of the nutritional value, sensory qualities, and food safety of organically and conventionally produced foods. Crit. Rev. Food Sci. Nutr. 2002, 42, 1–34. [Google Scholar] [CrossRef]
  15. Gorenjak, A.H.; Koležnik, U.R.; Cencič, A. Nitrate content in dandelion (Taraxacum officinale) and lettuce (Lactuca sativa) from organic and conventional origin: Intake assessment. Food Addit. Contam. Part. B Surveill. 2012, 5, 93–99. [Google Scholar] [CrossRef]
  16. Stoknes, K.; Beyer, D.M.; Norgaard, E. Anaerobically digested food waste in compost for Agaricus bisporus and Agaricus subrufescens and its effect on mushroom productivity. J. Sci. Food Agric. 2013, 93, 2188–2200. [Google Scholar] [CrossRef]
  17. Stoknes, K.; Scholwin, F.; Krzesiński, W.; Wojciechowska, E.; Jasińska, A. Efficiency of a novel “Food to waste to food” system including anaerobic digestion of food waste and cultivation of vegetables on digestate in a bubble-insulated greenhouse. Waste Manag. 2016, 56, 466–476. [Google Scholar] [CrossRef] [PubMed]
  18. Dasgan, H.Y.; Yucebilgic, A.; Altuntas, O. The organic nutrition on hydroponically grown greenhouse melon. Acta Hortic. 2017, 1164, 549–553. [Google Scholar] [CrossRef]
  19. Rogers, M.A. Organic vegetable crop production in controlled environments using soilless media. Horttechnology 2017, 27, 166–170. [Google Scholar] [CrossRef]
  20. Texier, W. Hydroponic Plant Cultivation Procedure Uses Nutrient Liquid Containing Biological Fertilizer Seeded with Bacteria or Enzymes. Patent FR2893226A1, 18 May 2007. [Google Scholar]
  21. Williams, K.A.; Nelson, J.S. Challenges of using organic fertilizers in hydroponic production systems. Acta Hortic. 2016, 1112, 365–370. [Google Scholar] [CrossRef]
  22. Lee, S.; Lee, J. Beneficial bacteria and fungi in hydroponic systems: Types and characteristics of hydroponic food production methods. Sci. Hortic. 2015, 195, 206–215. [Google Scholar] [CrossRef]
  23. Shinohara, M.; Aoyama, C.; Fujiwara, K.; Watanabe, A.; Ohmori, H.; Uehara, Y.; Takano, M. Microbial ecosystem constructed in water for successful organic hydroponics. Soil. Sci. Plant. Nutr. 2011, 3, 1–14. [Google Scholar] [CrossRef]
  24. Maucieri, C.; Nicoletto, C.; Junge, R.; Schmautz, Z.; Sambo, P.; Borin, M. Hydroponic systems and water management in aquaponics: A review. Ital. J. Agron. 2018, 13, 1–11. [Google Scholar] [CrossRef]
  25. Schmautz, Z.; Espinal, C.A.; Smits, T.H.M.; Frossard, E.; Junge, R. Nitrogen transformations across compartments of an aquaponic system. Aquac. Eng. 2021, 92, 102145. [Google Scholar] [CrossRef]
  26. Reinhold, G.; König, V.; Herold, L. Auswirkungen der Biogaserzeugung auf die Eigenschaften der Gärsubstrate. 116 VDLUFA-Kongr. 2004, p. 8. Available online: www.tll.de/ainfo/pdf/bio10904.pdf (accessed on 2 May 2020).
  27. Vaneeckhaute, C.; Lebuf, V.; Michels, E.; Belia, E.; Vanrolleghem, P.A.; Tack, F.M.G.; Meers, E. Nutrient recovery from digestate: Systematic technology review and product classification. Waste Biomass Valorization 2017, 8, 21–40. [Google Scholar] [CrossRef]
  28. Paradelo, R.; Villada, A.; Barral, M.T. Heavy metal uptake of lettuce and ryegrass from urban waste composts. Int. J. Environ. Res. Public. Health 2020, 17, 2887. [Google Scholar] [CrossRef]
  29. Michalska, M.; Asp, H. Influence of lead and cadmium on growth, heavy metal uptake, and nutrient concentration of three lettuce cultivars grown in hydroponic culture. Commun. Soil. Sci. Plant. Anal. 2001, 32, 571–583. [Google Scholar] [CrossRef]
  30. Shinohara, M.; Aoyama, C.; Fujiwara, K.; Watanabe, A.; Ohmori, H.; Uehara, Y.; Takano, M. Microbial mineralization of organic nitrogen into nitrate to allow the use of organic fertilizer in hydroponics. Soil. Sci. Plant. Nutr. 2011, 57, 190–203. [Google Scholar] [CrossRef]
  31. National Organic Standards Board. Organic Hydroponic and Aquaponic Task. Force Report. 2016. Available online: https://www.ams.usda.gov/content/organic-hydroponic-and-aquaponic-task-force-report (accessed on 4 April 2021).
  32. Sanosil AG: Hydrokultur, Hydroponic, Pflanzenzüchtung. Available online: https://www.sanosil.com/de/anwendungsbereiche/landwirtschaft/agrikultur/homegrow-hydrokultur/ (accessed on 2 May 2021).
  33. Paulitz, T.C. Biological Control of Root Pathogens in Soilless and Hydroponic Systems. HortScience 1997, 32, 193–195. [Google Scholar] [CrossRef]
  34. Martin, F.N.; Loper, J.E. Soil-Borne Plant Diseases Caused by Pythium spp.: Ecology, Epidemiology, and Prospects for Biological Control; Taylor Francis: Abingdon, UK, 1999; Volume 18, ISBN 0735268999130. [Google Scholar]
  35. Schnitzler, W.H. Pest and disease management of soilless culture. Acta Hortic. 2004, 648, 191–203. [Google Scholar] [CrossRef]
  36. Zinnen, T.M. Assessment of plant diseases in hydroponic culture. Plant. Dis. 1988, 72, 96–100. [Google Scholar] [CrossRef]
  37. Jenkins, J.S.F.; Averre, C.W. Root diseases of vegetables in hydroponic culture systems in north carolina greenhouses. Plant. Dis. 1983, 67, 968–970. [Google Scholar] [CrossRef]
  38. Whipps, J.M.; Lumsden, R.D. Biological control of Pythium species. Biocontrol Sci. Technol. 1991, 1, 75–90. [Google Scholar] [CrossRef]
  39. Harman, G.E.; Howell, C.R.; Viterbo, A.; Chet, I.; Lorito, M. Trichoderma species—Opportunistic, avirulent plant symbionts. Nat. Rev. Microbiol. 2004, 2, 43–56. [Google Scholar] [CrossRef]
  40. Stewart, A.; Hill, R. Biotechnology and Biology of Trichoderma—Applications of Trichoderma in Plant Growth Promotion; Elsevier: Amsterdam, The Netherlands, 2014; ISBN 9780444595768. [Google Scholar]
  41. Sirakov, I.; Lutz, M.; Graber, A.; Mathis, A.; Staykov, Y.; Smits, T.H.M.; Junge, R. Potential for Combined Biocontrol Activity against Fungal Fish and Plant Pathogens by Bacterial Isolates from a Model Aquaponic System. Water 2016, 8, 518. [Google Scholar] [CrossRef]
  42. Burr, T.J. Increased potato yields by treatment of seedpieces with specific strains of Pseudomonas fluorescens and P. putida. Phytopathology 1978, 68, 1377–1383. [Google Scholar] [CrossRef]
  43. Mazzola, M.; Cook, R.J.; Thomashow, L.S.; Weller, D.M.; Pierson, L.S. Contribution of phenazine antibiotic biosynthesis to the ecological competence of fluorescent pseudomonads in soil habitats. Appl. Environ. Microbiol. 1992, 58, 2616–2624. [Google Scholar] [CrossRef] [PubMed]
  44. Hagn, A.; Engel, M.; Kleikamp, B.; Munch, J.C.; Schloter, M.; Bruns, C. Microbial community shifts in Pythium ultimum-inoculated suppressive substrates. Biol. Fertil. Soils 2008, 44, 481–490. [Google Scholar] [CrossRef]
  45. Lutz, M.P.; Michel, V.; Martinez, C.; Camps, C. Lactic acid bacteria as biocontrol agents of soil-borne pathogens. IOBC-WPRS Bull. 2012, 78, 285–288. [Google Scholar]
  46. Chinta, Y.D.; Kano, K.; Widiastuti, A.; Fukahori, M.; Kawasaki, S.; Eguchi, Y.; Misu, H.; Odani, H.; Zhou, S.; Narisawa, K.; et al. Effect of corn steep liquor on lettuce root rot (Fusarium oxysporum f.sp. lactucae) in hydroponic cultures. J. Sci. Food Agric. 2014, 94, 2317–2323. [Google Scholar] [CrossRef] [PubMed]
  47. MycoSolutions, AG. Treating Roses with Trichoderma atrobrunneum increases the Size of Flower Heads Significantly. St. Gallen, Switzerland, 2021; unpublished. [Google Scholar]
  48. MycoSolutions, AG. Effect of Trichoderma atrobrunneum Strain T-720 on Growth of Lettuce (Lactuca sativa L.) under Greenhouse Conditions. St. Gallen, Switzerland, 2020; unpublished. [Google Scholar]
  49. Hermosa, R.; Viterbo, A.; Chet, I.; Monte, E. Plant-beneficial effects of Trichoderma and of its genes. Microbiol. 2012, 158, 17–25. [Google Scholar] [CrossRef] [PubMed]
  50. Vinale, F.; Sivasithamparam, K.; Ghisalberti, E.L.; Marra, R.; Woo, S.L.; Lorito, M. Trichoderma-plant-pathogen interactions. Soil. Biol. Biochem. 2008, 40, 1–10. [Google Scholar] [CrossRef]
  51. Combalbert, S.; Capdeville, M.J.; Bellet, V.; Rajagopal, R.; Motte, J.C.; Balaguer, P.; Béline, F. Fate of antibiotics, steroid hormones and multiple endocrine activities during biological treatment of swine manure under anaerobic and aerobic/anoxic conditions. In Proceedings of the 13th World Congress on Anaerobic Digestion, Santiago de Compostela, Spain, 25–28 June 2018; pp. 1–4. Available online: https://agris.fao.org/agris-search/search.do?recordID=FR2021080384 (accessed on 5 April 2021).
  52. Visca, A.; Barra Caracciolo, A.; Grenni, P.; Patrolecco, L.; Rauseo, J.; Massini, G.; Mazzurco Miritana, V.; Spataro, F. Anaerobic digestion and removal of Sulfamethoxazole, Enrofloxacin, Ciprofloxacin and their antibiotic resistance fenes in a full-scale biogas plant. Antibiotics 2021, 10, 502. [Google Scholar] [CrossRef]
  53. Landesamt Umwelt Landwirtschaft und Geologie Sachsen. Hygienisierung von Wirtschaftsdünger und Gärresten. Schriftenr. Des. LfULG 2014, 37, 1–109. [Google Scholar]
  54. Schwermer, C.U.; Krzeminski, P.; Wennberg, A.C.; Vogelsang, C.; Uhl, W. Removal of antibiotic resistant E. coli in two Norwegian wastewater treatment plants and by nano- and ultra-filtration processes. Water Sci. Technol. 2018, 77, 1115–1126. [Google Scholar] [CrossRef]
  55. Rakocy, J.E.; Masser, M.P.; Losordo, T.M. Recirculating aquaculture tank production systems: Aquaponics- integrating fish and plant culture. SRAC Publ. South. Reg. Aquac. Cent. 2006, 454, 16. [Google Scholar]
  56. Fernandez, D. HydroBuddy, v1.62; An Open Source Nutrient Calculator for Hydroponics and General Agriculture. 2017. Available online: https://scienceinhydroponics.com/2016/03/the-first-free-hydroponic-nutrient-calculator-program-o.html (accessed on 15 January 2020).
  57. Metrohm AG Switzerland. IC Application Note No. S-173: Nitrite and Nitrate in A Plant Extract. 2004. Available online: https://www.metrohm.com/de_ch/applications/application-notes/aa-s-001-100/an-s-173.html (accessed on 17 April 2021).
  58. Zhang, W.; Tu, J.C. Effect of ultraviolet disinfection of hydroponic solutions on Pythium root rot and non-target bacteria. Eur. J. Plant. Pathol. 2000, 106, 415–421. [Google Scholar] [CrossRef]
  59. Sametz-Baron, L.; Berrocal, T.G.M.; Amit, R.; Herrera-Estrella, A.; Horwitz, B.A. Photoreactivation of UV-inactivated spores of Trichoderma harzianum. Photochem. Photobiol. 1997, 65, 849–854. [Google Scholar] [CrossRef]
  60. Sutton, J.C.; Yu, H.; Grodzinski, B.; Johnstone, M. Relationships of ultraviolet radiation dose and inactivation of pathogen propagules in water and hydroponic nutrient solutions. Can. J. Plant. Pathol. 2000, 22, 300–309. [Google Scholar] [CrossRef]
  61. R Core Team. R: A Language and Environment for Statistical Computing; R Foundation for Statistical Computing: Vienna, Austria, 2020; pp. 235–276. [Google Scholar]
  62. Robinson, D. Broom: An R Package for Converting Statistical Analysis Objects Into Tidy Data Frames. arXiv 2014, arXiv:1412.3565. [Google Scholar] [CrossRef]
  63. Searle, S.R.; Speed, F.M.; Milliken, G.A. Population Marginal Means in the Linear Model: An Alternative to Least Squares Means. Am. Stat. 1980, 34, 216–221. [Google Scholar] [CrossRef]
  64. Kassambara, A. Ggpubr: Ggplot2 Based Publication Ready Plots. 2020. Available online: https://cran.r-project.org/web/packages/ggpubr/readme/README.html (accessed on 6 November 2020).
  65. Auguie, B. GridExtra: Miscellaneous Functions for “Grid” Graphics. 2017. Available online: https://rdrr.io/cran/gridExtra/ (accessed on 6 November 2020).
  66. Lenth, R.V. Least-Squares Means: The R package lsmeans v2.30-0. J. Stat. Softw. 2016, 69, 1–33. [Google Scholar] [CrossRef]
  67. Grolemund, G.; Wickham, H. Dates and Times Made Easy with lubridate. J. Stat. Softw. 2011, 40, 1–25. [Google Scholar] [CrossRef]
  68. Hothorn, T.; Bretz, F.; Westfall, P. Simultaneous Inference in General Parametric Models. Biom. J. 2008, 50, 346–363. [Google Scholar] [CrossRef]
  69. Spencer, G.; Piepho, H.-P.; Dorai-Raj, L.; Selzer, S. MultcompView: Visualizations of Paired Comparison. R package v0.1-8. 2019. Available online: https://cran.r-project.org/web/packages/multcompView/ (accessed on 6 November 2020).
  70. Schauberger, P.; Walker, A. Openxlsx: Read, Write and Edit xlsx Files. 2021. Available online: r-project.org (accessed on 6 November 2020).
  71. Neuwirth, E. RColorBrewer: ColorBrewer palettes. R package v1.1-2. 2014. Available online: https://cran.r-project.org/web/packages/RColorBrewer/index.html (accessed on 6 November 2021).
  72. Bryan, H.W.; Readxl, J. Read Excel Files. R package v1.3.1. 2019. Available online: https://cran.r-project.org/web/packages/readxl/index.html (accessed on 6 November 2020).
  73. Kassambara, A. Rstatix: Pipe-Friendly Framework for Basic Statistical Tests. R package v0.7.0. 2021. Available online: https://cran.r-project.org/web/packages/rstatix/index.html (accessed on 6 November 2020).
  74. Wickham, H.; Averick, M.; Bryan, J.; Chang, W.; McGowan, L.D.A.; François, R.; Grolemund, G.; Hayes, A.; Henry, L.; Hester, J.; et al. Welcome to the tidyverse. J. Open. Source Softw. 2019, 4, 1686. [Google Scholar] [CrossRef]
  75. XLSTAT: Excel Statistik Software. Available online: https://www.xlstat.com/de/ (accessed on 21 March 2021).
  76. Lucas, J.S.; Southgate, P.C.; Aquaculture, T.C.S. Farming Aquatic Animals and Plants, 3rd ed.; John Wiley & Sons: Hoboken, NJ, USA, 2019; ISBN 978-1-119-23086-1. [Google Scholar]
  77. El Sheshtawy, A.; Salah, A.; Rahman Ibrahim, M.A.; Mocuta, D.N.; Turek Rahoveanu, A.; Hossu, A.M. The nitrification capacity of different types of biological filters—An overview. Risk Contemp. Econ. 2017, 1, 321–328. [Google Scholar] [CrossRef]
  78. Joshi, J.A.; Hogan, J.A.; Cowan, R.M.; Strom, P.F.; Finstein, M.S. Biological removal of gaseous ammonia in biofilters: Space travel and earth-based applications. J. Air Waste Manag. Assoc. 2000, 50, 1647–1654. [Google Scholar] [CrossRef] [PubMed]
  79. Voogt, W.; Diaz-Ismael, A.; Nina Oud, R.L. Dealing with Na accumulation in soilless grown crops with recirculation of drainwater: A case study with sweet pepper (Capsicum annuum). In Proceedings of the ISHS hydro2020, Lemesos, Cyprus, 19–22 March 2021. [Google Scholar]
  80. Han, H.-J.; Kim, H.J.; Jung, D.-H.; Cho, W.-J.; Cho, Y.-Y.; Lee, G.-I. Real-time Nutrient Monitoring of Hydroponic Solutions Using an Ion-selective Electrode-based Embedded System. Prot. Hortic. Plant. Factory. 2020, 29, 141–152. [Google Scholar] [CrossRef]
  81. Goddek, S.; Schmautz, Z.; Scott, B.; Delaide, B.; Keesman, K.; Wuertz, S.; Junge, R. The effect of anaerobic and aerobic fish sludge supernatant on hydroponic lettuce. Agronomy 2016, 6, 37. [Google Scholar] [CrossRef]
  82. Wongkiew, S.; Hu, Z.; Lee, J.W.; Chandran, K.; Nhan, H.T. Nitrogen recovery via aquaponics—Bioponics: Engineering considerations and perspectives. ACS EST Eng. 2021, 1, 326–339. [Google Scholar] [CrossRef]
  83. Sörensen, M.; Zurell, S.; Frimmel, F.H. Degradation pathway of the photochemical oxidation of Ethylenediaminetetraacetate (EDTA) in the UV/H2O2-process. Acta Hydrochim. Hydrobiol. 1998, 26, 109–115. [Google Scholar] [CrossRef]
  84. Sörensen, V.M.; Weckenmann, J.; Hofmann, R.; Pagel, J.; Weber, A. Konzept, Technologie und Praxisbericht der Referenzkunden Multek und Shipley Zerstörung von komplexem Cu-EDTA Konzept, Technologie und Praxisbericht. Galvanotechnik 2002, 93, 1–8. [Google Scholar]
  85. Pérez-gálvez, A.; Viera, I.; Roca, M. Carotenoids and chlorophylls as antioxidants. Antioxidants 2020, 9, 505. [Google Scholar] [CrossRef]
  86. Pushnik, J.C.; Miller, G.W.; Manwaring, J.H. The role of iron in higher plant chlorophyll biosynthesis, maintenance and chloroplast biogenesis. J. Plant. Nutr. 1984, 7, 733–758. [Google Scholar] [CrossRef]
  87. Song, J.; Huang, H.; Hao, Y.; Song, S.; Zhang, Y.; Su, W.; Liu, H. Nutritional quality, mineral and antioxidant content in lettuce affected by interaction of light intensity and nutrient solution concentration. Sci. Rep. 2020, 10, 2796. [Google Scholar] [CrossRef]
  88. Atkin, K.; Nichols, M.A. Organic hydroponics. In Acta Horticulturae, Proceedings of the International Society for Horticultural Science (ISHS), Leuven, Belgium, 10 February 2003; Acta Horticulturae: Liège, Belgium, 2004; pp. 121–127. [Google Scholar] [CrossRef]
  89. Nozzi, V.; Graber, A.; Schmautz, Z.; Mathis, A.; Junge, R. Nutrient management in aquaponics: Comparison of three approaches for cultivating lettuce, mint and mushroom herb. Agronomy 2018, 8, 27. [Google Scholar] [CrossRef]
  90. Tahboub, A.B.; Abu-Zahra, T.R.; Al-Abbadi, A.A. Chemical composition of lettuce (Lactuca sativa) grown in soils amended with different sources of animal manure to simulate organic farming conditions. J. Food Agric. Environ. 2010, 8, 736–740. [Google Scholar]
  91. Fallovo, C.; Rouphael, Y.; Cardarelli, M.; Rea, E.; Battistelli, A.; Colla, G. Yield and quality of leafy lettuce in response to nutrient solution composition and growing season. J. Food Agric. Environ. 2009, 7, 456–462. [Google Scholar]
  92. López-Bucio, J.; Cruz-Ramírez, A.; Herrera-Estrella, L. The role of nutrient availability in regulating root architecture. Curr. Opin. Plant. Biol. 2003, 6, 280–287. [Google Scholar] [CrossRef] [PubMed]
  93. Tilman, D. Plant Strategies and the Dynamics and Structure of Plant Communities; Princeton University Press: Princeton, NJ, USA, 1988. [Google Scholar]
  94. Fernandez, D. Inner Leaf Tipzburn in Hydroponic Lettuce. Available online: https://scienceinhydroponics.com/2020/11/inner-leaf-tipburn-in-hydroponic-lettuce.html (accessed on 16 June 2021).
  95. Sago, Y. Effects of light intensity and growth rate on tipburn development and leaf calcium concentration in butterhead lettuce. HortScience 2016, 51, 1087–1091. [Google Scholar] [CrossRef]
  96. Hoque, M.; Ajwa, H.; Othman, M.; Smith, R.; Cahn, M. Yield and postharvest quality of lettuce in response to nitrogen, phosphorus, and potassium fertilizers. HortScience 2010, 45, 1539–1544. [Google Scholar] [CrossRef]
  97. Swiss Confederation. Gesetzgebung—Anhang 2 der Verordnung des EDI über die Höchstgehalte für Pestizidrückstände in Oder auf Erzeugnissen Pflanzlicher und Tierischer Herkunft (VPRH) (XLS, 4 MB, 29 June 2020). Available online: https://www.blv.admin.ch/blv/de/home/lebensmittel-und-ernaehrung/rechts-und-vollzugsgrundlagen/gesetzgebung-lme.html (accessed on 1 May 2021).
  98. Pavlovic, J.; Kostic, L.; Bosnic, P.; Kirkby, E.A.; Nikolic, M. Interactions of Silicon With Essential and Beneficial Elements in Plants. Front. Plant. Sci. 2021, 12, 697592. [Google Scholar] [CrossRef]
  99. Voogt, W.; Sonneveld, C. Chapter 6 Silicon in Horticultural Crops Grown in Soilless Culture; Datnoff, L.E., Snyder, G.H., Korndörfer, G.H., Eds.; Elsevier: Amsterdam, The Netherlands, 2001; Volume 8, pp. 115–131. [Google Scholar] [CrossRef]
  100. Weightman, R.M.; Dyer, C.; Buxton, J.; Farrington, D.S. Effects of light level, time of harvest and position within field on the variability of tissue nitrate concentration in commercial crops of lettuce (Lactuca sativa) and endive (Cichorium endiva). Food Addit. Contam. 2006, 23, 462–469. [Google Scholar] [CrossRef]
  101. Alexander, J.; Benford, D.; Cockburn, A.; Cravedi, J.; Dogliotti, E.; Domenico, A.D.; Fernández-Cruz, M.L.; Fink-Gremmels, J.; Fürst, P.; Galli, C.; et al. Nitrate in vegetables—Scientific opinion of the panel on contaminants in the food chain. EFSA J. 2008, 6, 1–79. [Google Scholar] [CrossRef]
  102. Europäische Kommission. Verordnung (EG) Nr. 1881/2006 der Kommission vom 19. Dezember 2006 zur Festsetzung der Höchstgehalte für bestimmte Kontaminanten in Lebensmitteln. Amtsbl. Der Eur. Union. 2006, 1881, 5–24. [Google Scholar]
  103. Kanton Thurgau. Nitrat in Wintersalaten Untersuchungsziele und Methodik Proben und Resultate Beurteilung und Zusammenfassung. 2021. Available online: https://kantlab.tg.ch/public/upload/assets/64524/201804A_Nitrat_in_Wintersalaten.pdf (accessed on 8 December 2020).
  104. Kappel, N.; Boros, I.F.; Ravelombola, F.S.; Sipos, L. EC sensitivity of hydroponically-grown lettuce (Lactuca sativa L.) types in terms of nitrate accumulation. Agriculture 2021, 11, 315. [Google Scholar] [CrossRef]
  105. Manzocco, L.; Foschia, M.; Tomasi, N.; Maifreni, M.; Dalla Costa, L.; Marino, M.; Cortella, G.; Cesco, S. Influence of hydroponic and soil cultivation on quality and shelf life of ready-to-eat lamb’s lettuce (Valerianella locusta L. Laterr). J. Sci. Food Agric. 2011, 91, 1373–1380. [Google Scholar] [CrossRef] [PubMed]
  106. Bulgari, R.; Cocetta, G.; Prinsi, B.; Espen, L.; Ferrante, A. Influence of different ammonium and nitrate ratio on yield and quality of rocket. In Proceedings of the ISHS Hydro 2020, Lemesos, Cyprus, 19–22 March 2021. [Google Scholar]
  107. Blom-Zandstra, G.; Lampe, J.E.M. The effect of chloride and sulphate salts on the nitrate content in lettuce plants (Lactuca sativa L.). J. Plant. Nutr. 1983, 6, 611–628. [Google Scholar] [CrossRef]
  108. Giuffrida, F.; Scuderi, D.; Noto, G. Effects of nutrient solution EC on yield, quality and shelf-life of lettuce grown in floating system. Acta Hortic. 2009, 807, 221–226. [Google Scholar]
  109. Markou, G.; Wang, L.; Ye, J.; Unc, A. Using agro-industrial wastes for the cultivation of microalgae and duckweeds: Contamination risks and biomass safety concerns. Biotechnol. Adv. 2018, 36, 1238–1254. [Google Scholar] [CrossRef]
  110. De Gelder, L.; Audenaert, K.; Willems, B.; Schelfhout, K.; De Saeger, S.; De Boevre, M. Processing of mycotoxin contaminated waste streams through anaerobic digestion. Waste Manag. 2018, 71, 122–128. [Google Scholar] [CrossRef]
  111. Congilosi, J.L.; Aga, D.S. Review on the fate of antimicrobials, antimicrobial resistance genes, and other micropollutants in manure during enhanced anaerobic digestion and composting. J. Hazard. Mater. 2021, 405. [Google Scholar] [CrossRef]
  112. Mook, W.T.; Chakrabarti, M.H.; Aroua, M.K.; Khan, G.M.A.; Ali, B.S.; Islam, M.S.; Abu Hassan, M.A. Removal of total ammonia nitrogen (TAN), nitrate and total organic carbon (TOC) from aquaculture wastewater using electrochemical technology: A review. Desalination 2012, 285, 1–13. [Google Scholar] [CrossRef]
  113. Al-Huqail, A.; El-Dakak, R.M.; Sanad, M.N.; Badr, R.H.; Ibrahim, M.M.; Soliman, D.; Khan, F. Effects of climate temperature and water stress on plant growth and accumulation of antioxidant compounds in sweet basil (Ocimum Basilicum L.) Leafy Vegetable. Scientifica 2020, 2020. [Google Scholar] [CrossRef]
Figure 1. System overview: bioponic (BP), hydroponic (HP) and soil (SO) cultivation with different treatments, with and without addition of T. atrobrunneum, and with and without UV-C treatment.
Agronomy 13 01436 g001
Figure 2. System setup for bioponic (BP) and hydroponic (HP) systems with the reservoirs for the nutrient solution. In the BP systems (*) sump 1 contained a bag with biochar and in sump 2, biochips were used. Each system contained three nutrient film technique (NFT) channels with total 34 lettuces. One lettuce in the inflow, middle, and outflow of each channel were sampled for further analyses. Created with BioRender.com.
Agronomy 13 01436 g002
Figure 3. System setup for soil cultivation (SO) with a reservoir for the nutrient solution. Each system contained three nutrient film technique (NFT) channels with total 34 lettuces. One lettuce in the inflow, middle and outflow of each channel was sampled for further analyses. Created with BioRender.com.
Agronomy 13 01436 g003
Figure 4. Development of pH, EC, TOC, TN, NH4+-N, NO3-N, PO43−-P, and K+ in nutrient solution over time. From left to right, data from trials A, B, and C are shown, and fertilizer additions are indicated with arrows. Values for NO2-N were for most samplings <0.01 mg L−1.
Agronomy 13 01436 g004
Figure 5. Development of Na+, Ca2+, Mg2+, Cl, SO42-S, Fe and Mn levels in nutrient solution over time. From left to right, data from trials A, B, and C are shown, and fertilizer additions are indicated with arrows.
Agronomy 13 01436 g005
Figure 6. Principal component analysis (PCA) with 95% confidence ellipses of nutrient solution for (A) temperature, pH, electrical conductivity and oxygen saturation explaining 68.4%, and (B) nutrients TOC, TN, NH4+-N, NO3-N, PO43−-P, K+, Na+, Ca2+, Mg2+, Cl, SO42−-S, Fe, and Mn, explaining 54.8% of data variance in bioponic (BP) and hydroponic (HP) systems.
Agronomy 13 01436 g006
Figure 7. Principal component analysis (PCA) with 95% confidence ellipses of (A) plant shoot growth parameters (lettuce height, lettuce diameter, fresh weight, total fresh biomass per system (yield), and dry matter fraction) explaining 67.7%, and (B) plant root growth (root length, fresh weight, total fresh biomass per system, and dry matter fraction) explaining 68.5% of data variance in bioponic (BP), hydroponic (HP), and soil (SO) cultivation.
Agronomy 13 01436 g007
Table 1. HP nutrient solution measured concentration.
Mixture of Tap Water and Deionized Water (1:1)Biogas Digestate ConcentrateHP Nutrient Solution
TOC [mg L−1]1.51722-
TN [mg L−1]1.15434-
NO3-N [mg L−1]0.6<LOD66.9
NH4+-N [mg L−1]<LOD57305.0
PO43−-P [mg L−1]<LOD11317.0
K+ [mg L−1]<LOD11,58996.5
Na+ [mg L−1]4.42897-
Ca2+ [mg L−1]9.3267152.3
Mg2+ [mg L−1]6.0<LOD19.5
Cl [mg L−1]3.979698.5
S [mg L−1]--39.0
Fe [mg L−1]--4.0
Mn [mg L−1]--0.45
Zn [mg L−1]--0.3
B [mg L−1]--0.05
Cu [mg L−1]--0.03
Mo [mg L−1]--0.02
Abbreviation: <LOD, below the level of detection.
Table 2. Addition of biogas effluent concentration in the BP system.
First AdditionSecond AdditionThird Addition
Trial A800 mLDay 11150 mLDay 141150 mLDay 16
Trial B800 mLDay 11150 mLDay 101150 mLDay 15
Trial C1150 mLDay 1800 mLDay 121150 mLDay 15
Table 3. Overview of measured parameters, samples, place of measurement, measurement interval, sample preparation and lab equipment.
ParameterSystemAnalyzed SamplePlace of MeasurementMeasurement IntervalSample PreparationLab EquipmentCompany
pH [-], T [°C]BP, HPNutrient solutionDirect, in the sumpDaily-Probe PHC10103 and HQ40d portable multimeterHach Lange, Loveland, CO, USA
Dissolved oxygen
[mg L−1]
AllNutrient solutionDirect, in the sumpThree times per week-Probe LDO10101 and HQ40d portable multimeterHach Lange, Loveland, CO, USA
Electrical conductivity
[μS cm−1]
AllNutrient solutionDirect, in the sumpThree times per week-Probe CDC40103 and HQ40d portable multimeterHach Lange, Loveland, CO, USA
NH4+-N, NO2-N, NO3-N, TN, PO43−-P
[mg L−1]
BP, HPNutrient solutionDirect, in the laboratoryTrial A: At system start and after 7 and 12 daysFiltered with 0.45 μm
(not for TN)
LCK tests no. 304, 341, 339, 138, 349; DR 3800 VIS SpectrophotometerWhatman Maidstone, UK;
Hach Lange, Loveland, CO, USA
TN
[mg L−1]
BP, HPNutrient solutionDirect, in the laboratoryTrial B and C: At system start-LCK tests no. 138; DR 3800 VIS SpectrophotometerHach Lange, Loveland, CO, USA
TOC and TN
[mg L−1]
BP, HPNutrient solutionDirect, in the laboratoryThree times per week1:2 dilutedTOC-L Analyser and ASI-LShimadzu Europa GmbH, Duisburg, Germany
NH4+, Na+, K+, Ca2+, Mg2+
[mg L−1]
BP, HPNutrient solutionStored at −20 °C in 15 mL falcon tube, laboratoryThree times per weekFiltered with 0.45 μm, 1 μL 2 M HNO3 per 1 mL sample930 Compact IC flexWhatman Maidstone, UK;
Metrohm Schweiz AG, Zofingen, Switzerland
Cl, NO2, NO3, PO43, SO42
[mg L−1]
BP, HPNutrient solutionStored in 15 mL falcon tube, laboratoryThree times per weekFiltered with 0.45 μm930 Compact IC flexMetrohm Schweiz AG, Zofingen, Switzerland
Fe, Mn
[mg L−1]
BP, HPNutrient solutionStored in 50 mL falcon tube, laboratoryThree times per weekFiltered with 0.45 μm,
5% HNO3 (end concentration)
ICP-OES, Varian Vista AX CCD SimultaneousAgilent Technologies, Santa Clara, CA, USA
Chlorophyll, Flavonoid, Anthocyanin [µg cm−2]AllLettuce leavesDirectly on living plant, epidermis of lettuceAt end of each trial-Dualex® ScientificForceA, Université Paris Sud, Orsay Cedex, France
NO3 [mg kg−1]AllLettuce leavesDirect, in the laboratoryAt end of each trialLettuce leave incubated in hot water for 15 min, extract measured930 Compact IC flexMetrohm Schweiz AG, Zofingen, Switzerland
K+, Ca2+, Mg2+, Na+, NH4+, NO3, TN,
Cl, S, P, Si, Fe, Mn, Zn, B, Cu, Mo, Al [mg kg−1]
AllLettuce leavesIn external laboratoryAt start, middle and end of each trialPlant sap analysisConfidentialNovaCropControl, Oisterwijk, The Netherlands
TransmissionBP2, BP4, HP1, HP3Nutrient solutionStored at −20 °C in 50 mL falcon tube, laboratoryTrial A: middle and end of trial; Trial B and C: start, middle, and end of trials-UV-1600 PC SpectrophotometerVWR International, Radnor, PA, USA
Presence/absence of
T. atrobrunneum T720
AllNutrient solution and soilIn external laboratoryAt start, middle and end of each trial-Agar plates, Visual inspectionMycoSolutions AG, St. Gallen, Switzerland
Table 4. Averages and ranges (MIN-MAX) of daily temperature, humidity, and global radiation during three successive trials. The values for global radiation were averaged over the daylight period. Significant differences (Kruskal–Wallis) were obtained for air temperature, air humidity, and daily radiation, and located using a Tukey’s range test (α = 5%; levels a, b, and c).
Trial ATrial BTrial C
n15 June–10 July 202013 July–7 August 202010 August–4 September 2020
Air temperature [°C]20824.2 (6.0–41.4) a25.2 (7.1–45.1) b24.0 (14.2–44.4) c
Air humidity [%]47859.7 (24.9–86.2) a59.4 (24.1–86.0) a61.1 (25.2–86.0) b
Daily radiation271088.5 (348.7–1520.5) a977.2 (168.8–1430.3) ab856.1 (82.8–1237.2) b
Table 5. Characteristics of nutrient solution in bioponic (BP) and hydroponic (HP) systems were reported as mean ± SD. Significant differences (Kruskal–Wallis) were obtained for temperature and oxygen and located using a Tukey’s range test (α = 5%; levels a and b) (n = 144). pH and electrical conductivity showed no significant differences.
BPHP
Temp [°C]23.8 ± 3.5 b21.1 ± 3.3 a
pH [-]6.9 ± 1.17.4 ± 0.4
EC [μS cm−1]846.4 ± 282.5832.6 ± 212.9
Oxygen [%]96.8 ± 6.6 a100.5 ± 2.2 b
Table 6. Lettuce growth parameters per trial in bioponic (BP), hydroponic (HP), and soil (SO) systems, reported as MEAN ± SD. Significant differences were obtained for shoot and root fresh weight and shoot dry matter fraction (one-way ANOVA), and shoot diameter, height, yield, and root length (Kruskal–Wallis), and located using a Tukey’s range test (α = 5%; levels a, b, and c). Other parameters showed no significant differences.
Height/LengthDiameterFresh WeightYield per TrailDry Matter FractionShelf-Life
[cm][cm][g][kg m−2][%][% Remaining]
n = BP/HP/SO108/108/54108/108/54108/107/543/3/3108/107/5424/24/12
ShootBP15.0 ± 1.9 b22.1 ± 2.2 b186.5 ± 39.3 b3.09 ± 0.46 b3.7 ± 0.7 b83.1 ± 11.1
HP15.4 ± 1.5 b22.1 ± 1.9 b257.7 ± 40.9 c4.26 ± 0.27 c2.9 ± 0.5 a79.1 ± 12.8
SO12.4 ± 2.3 a21.3 ± 2.4 a147.6 ± 26.5 a2.83 ± 0.82 a3.9 ± 0.5 b81.4 ± 9.6
n = BP/HP108/108-108/10812/1212/12-
RootBP30.0 ± 9.0 a-18.8 ± 7.2 b0.35 ± 0.093.5 ± 0.4-
HP47.5 ± 13.3 b-15.9 ± 10.5 a0.30 ± 0.083.3 ± 0.6-
SO------
Table 7. Lettuce shoot plant leaf sap composition (NovaCropControl) of fresh weight per trial in bioponic (BP), hydroponic (HP), and soil (SO) cultivation for pH, EC, sugar, and TN, reported as MEAN ± SD. Significant differences (one-way ANOVA) were obtained and located using a Tukey’s range test (α = 5%; levels a and b).
pHECSugarTNSi
[-][µS cm−2][%][mg kg−1][mg kg−1]
n = BP/HP/SO12/12/612/12/612/12/612/12/612/12/6
Young leavesBP6.02 ± 0.07 b8.37 ± 1.01 b1.16 ± 0.251328.59 ± 203.194.04 ± 1.19 b
HP5.93 ± 0.09 a6.46 ± 1.14 a1.45 ± 0.311243.91 ± 111.010.79 ± 0.33 a
SO5.91 ± 0.07 a8.63 ± 1.73 b1.38 ± 0.741169.04 ± 277.614.79 ± 1.55 b
n = BP/HP12/12/612/12/612/12/612/12/612/12/6
Old leavesBP5.82 ± 0.1612.75 ± 1.440.39 ± 0.12852.35 ± 191.22 a7.85 ± 2.00 b
HP5.84 ± 0.1312.12 ± 1.700.41 ± 0.201313.95 ± 132.24 b2.28 ± 1.25 a
SO5.81 ± 0.1111.83 ± 0.580.55 ± 0.221022.58 ± 317.54 a8.88 ± 2.74 b
Table 8. Lettuce shoot plant leaf sap composition (NovaCropControl) of fresh weight in bioponic (BP), hydroponic (HP), and soil (SO) cultivation for NO3, NH4, and Cl, reported as MEAN ± SD. Significant differences for NO3 and Cl of young leaves, and NO3 and Cl of old leaves (Kruskal–Wallis), as well as NH4 of old leaves (one-way ANOVA) were obtained and located using a Tukey’s range test (α = 5%; levels a, b, and c).
NO3NH4+Cl
[mg kg−1][mg kg−1][mg kg−1]
n = BP/HP/SO12/12/612/12/612/12/6
Young leavesBP983.61 ± 267.07 a79.80 ± 32.511474.33 ± 229.59 c
HP1997.79 ± 629.54 b61.78 ± 15.32307.57 ± 69.46 a
SO1848.42 ± 1189.95 ab49.72 ± 13.97619.76 ± 171.83 b
n = BP/HP12/12/612/12/612/12/6
Old leavesBP1442.923 ± 526.13 a33.51 ± 5.28 b2441.71 ± 414.57 c
HP4173.663 ± 470.762 b25.44 ± 3.35 a609.08 ± 232.91 a
SO3010.397 ± 1197.552 ab20.70 ± 5.45 a1087.75 ± 323.12 b
Table 9. Lettuce shoot plant leaf sap composition (NovaCropControl) of fresh weight in bioponic (BP), hydroponic (HP), and soil (SO) cultivation for Cd, Mn, Pd, Cu, and Al reported as MEAN ± SD. Significant differences were obtained for Cu in young leaves (one-way-ANOVA) and Cu and Al in old leaves (Kruskal–Wallis), and located using a Tukey’s range test (α = 5%; levels a, b, and c). <LOD means value below level of detection.
CdMnPbCuAl
[mg kg−1][mg kg−1][mg kg−1][mg kg−1][mg kg−1]
n = BP/HP/SO12/12/612/12/612/12/612/12/612/12/6
Young leavesBP<LOD<LOD<LOD0.65 ± 0.15 b0.14 ± 0.07
HP<LOD<LOD<LOD0.45 ± 0.28 b0.08 ± 0.03
SO<LOD<LOD<LOD0.19 ± 0.07 a0.14 ± 0.07
n = BP/HP12/12/612/12/612/12/612/12/612/12/6
Old leavesBP<LOD<LOD<LOD0.42 ± 0.21 c0.33 ± 0.17 b
HP<LOD<LOD<LOD0.24 ± 0.11 b0.13 ± 0.04 a
SO<LOD<LOD<LOD0.12 ± 0.03 a0.14 ± 0.04 a
Disclaimer/Publisher’s Note: The statements, opinions and data contained in all publications are solely those of the individual author(s) and contributor(s) and not of MDPI and/or the editor(s). MDPI and/or the editor(s) disclaim responsibility for any injury to people or property resulting from any ideas, methods, instructions or products referred to in the content.

