Article

A Comparative Transcriptome Analysis of Avocado Embryogenic Lines Susceptible or Resistant to Rosellinia necatrix Exudate

by
Ana Moreno-Pérez
1,2,
Adela Zumaquero
1,
Elsa Martínez-Ferri
3,
Carlos López-Herrera
4,
Fernando Pliego-Alfaro
5,
Elena Palomo-Ríos
5,* and
Clara Pliego
1,*
1
Department of Genomics and Biotechnology (IFAPA), Fruticultura Subtropical y Mediterránea Unidad Asociada de I + D + i al CSIC, 29140 Málaga, Spain
2
Faculty of Sciences, University of Málaga, Campus de Teatinos s/n, 29071 Málaga, Spain
3
Department of Crop Ecophysiology (IFAPA), Fruticultura Subtropical y Mediterránea Unidad Asociada de I + D + i al CSIC, 29140 Málaga, Spain
4
Institute for Sustainable Agriculture, Spanish Research Council, CSIC, 14004 Córdoba, Spain
5
Department of Botany and Plant Physiology, IHSM-UMA-CSIC La Mayora, 29010 Málaga, Spain
*
Authors to whom correspondence should be addressed.
Agronomy 2023, 13(5), 1354; https://doi.org/10.3390/agronomy13051354
Submission received: 5 March 2023 / Revised: 3 May 2023 / Accepted: 10 May 2023 / Published: 12 May 2023
(This article belongs to the Special Issue Sustainability of Tropical Crops in a Changing Environment)

Abstract

:
Avocado embryogenic cultures were selected for resistance to the culture filtrate (CF) of Rosellinia necatrix, the causal agent of White Root Rot disease. A resistant callus line was obtained through recurrent selections in progressively increasing concentrations of fungal CF (from 60% to 80%). RNA sequencing (RNA-Seq) technology was used to compare the transcriptomic profiles of the avocado embryogenic-callus-resistant line L3 (capable to survive in the presence of 80% CF) and control line AN-9 (not exposed to CF), after 24 h of growth in a medium containing 40% CF. A total of 25,211 transcripts were obtained, of which 4,918 and 5,716 were differentially expressed in the resistant and control line, respectively. Interestingly, exposure of embryogenic callus lines to 40% of R. necatrix exudates induced genes previously reported to be related to avocado defense against fungal diseases (lignin biosynthesis, Pathogenesis Related (PR) proteins, WRKY (WRKYGQK) Transcription Factor (TF), NAC (NAM, ATAF1/2, and CUC2) TF, proteinase inhibitors and Ethylene Response Transcription Factor (ERF), among others), which were accumulated in greater amounts in the resistant line in comparison to the susceptible one. This research will contribute to the understanding of avocado defense against this pathogen, thereby aiding in the selection of resistant avocado rootstocks.

1. Introduction

Avocado (Persea americana Mill.), a member of the Lauraceae family, is an economically important fruit crop consumed in more than 60 countries. Worldwide, the production and harvested area of avocado have shown average increases of ~7.91% and ~6.84%, respectively, over the last few years [1]; however, avocado crop yields are rising at a slower rate (~1.07% increase per year) [1]. This difference could be explained by the incidence of avocado diseases. Two of the most important soil-borne pathogens affecting avocado orchards in Spain are the oomycete Phytophthora cinnamomi Rands, causing Phytophthora Root Rot (PRR), and the ascomycete Rosellinia necatrix Prill, causing White Root Rot disease (WRR) [2]. P. cinnamomi affects avocado orchards worldwide, but the disease caused by R. necatrix has a higher incidence in temperate regions [2]. Nevertheless, the fact that R. necatrix can colonize over 170 different plant hosts [3], some of them of economic importance, and the presence of this fungus in other areas such as California, México, Korea, South Africa and, particularly, Spain, have increased the interest in this pathogen [4].
Avocado trees affected by R. necatrix can show aerial and root symptoms, both because of damaged roots when hyphae invade and penetrate the primary and secondary xylem and due to the release of toxic compounds inside the vascular system [2]. As mechanical actions, enzymatic and toxigenic activities also appear to be important in R. necatrix infection [5] and could be related to aerial symptoms observed in plants [6]. This pathogen produces different metabolites with phytotoxic effects such as rosellichalasin [7,8] diketopiperazines, rosellic acid and rosnecatrone [7], and cytochalasin E, which has a direct effect on photosynthesis [9], although their roles in pathogenicity need to be clarified [10]. Zumaquero et al. [11], in their analyses of the R. necatrix transcriptome during infection of susceptible avocado, observed the up-regulation of genes related to the production of fungal toxins, two of them previously related to the biosynthesis of aflatoxin, a very toxic and carcinogenic mycotoxin.
Fungal features complicate the control of WRR disease; e.g., R. necatrix shows resistance to drought and soil acidity, is capable of penetrating deeply into the soil, and is tolerant to several common fungicides [4,5]. Current control approaches involve the use of chemicals such as the fungicide fluazinam [5]; physical control through solarization; biological control with some bacteria, especially species of Agrobacterium and Pseudomonas, which have shown an antagonistic effect against this fungus [12]; and cultural methods to prevent fungal infection. Nevertheless, an integrated approach using biological control and tolerant rootstocks is highly recommended for better and sustainable control of this pathogen [12,13]. However, there are currently no tolerant selections available to growers. To overcome this problem, IFAPA-Málaga has been involved for over a decade in a breeding program to obtain avocado rootstocks tolerant to WRR, and some selections are being evaluated under field conditions (A. Barceló-Muñoz, IFAPA-Málaga, personal communication, February 2023).
Avocado breeding programs require a long time to obtain the genotype of interest; hence, attempts are being made to help in the selection of trees, such as molecular studies of avocado/pathogen interaction [13,14,15,16] to identify markers that can speed up the selection process.
In vitro cell culture has been shown to be a valid tool to elucidate plant defense mechanisms against fungi. In Cicer arietinum, cell cultures of resistant and susceptible cultivars showed different behavior following exposure to an Ascochyta rabiei-derived elicitor, with a highly inducible protein drastically increased in the resistant cultivar. Moreover, this cultivar also accumulated a higher amount of phytoalexins [17]. Using grape calli, Ramirez-Suero et al. [18] demonstrated that extracellular compounds produced by Neofusicoccum parvum were more aggressive than those of Diplodia seriata; among these compounds, proteins seem to play a key role and could be involved in the induction of more defense genes in calli exposed to N. parvum [19]. Using an autoclaved biomass fungal extract of Phaemoniella chlamydospora to elicit grape cell cultures, Lima et al. [20] found the overexpression of classes 6 and 10 pathogenesis-related (PR) genes in these cells, concluding that this system was a reliable approach to study this interaction.
The in vitro cell culture system is generally associated with the occurrence of somaclonal variation [21]. The selection of cell lines through recurrent selection pressure, such as exposure to gradually increased concentrations of fungal culture filtrate, phytotoxins, or secreted elicitors, has been used to obtain cell lines and regenerated plants with disease resistance [22,23,24,25]. During this process, genetic changes have occurred, which will be inherited by the offspring. According to Lestari [26], this approach has the advantage of being more accurate for obtaining resistance to a specific type of stress; in addition, it shortens the time required to select for desirable traits [27].
This investigation attempted to obtain an avocado cell line resistant to R. necatrix filtrate through recurrent exposures to the filtrate. Afterward, a comparative transcriptomic study was carried out to evaluate the response of resistant vs susceptible cells, after a new exposure to the fungal filtrate. Obtained responses were compared to those observed on susceptible and tolerant genotypes following inoculation with this pathogen under greenhouse conditions. This study will help to evaluate the usefulness of avocado cell cultures to study avocado–R. necatrix interaction and will shed light on the role played by extracellular compounds on the pathogenicity of this fungus and subsequent response at the cell level.

2. Materials and Methods

2.1. Plant Material

The avocado embryogenic callus line AN-9, derived from an immature zygotic embryo of cv. “Anaheim”, susceptible to R. necatrix, was used in this study. This line had been established in Murashige and Skoog (MS) medium [28] supplemented with 30 g L−1 sucrose and 0.1 mg L−1 picloram (MSP medium) and solidified with 6 g L−1 agar in darkness at 25 ± 1 °C [29]. Callus was maintained in the same medium used for culture initiation with subcultures at 4-week intervals. The medium pH was adjusted to 5.74 before autoclaving at 0.1 MPa and 121 °C for 20 min.

2.2. Preparation of Crude Filtrate from Rosellinia necatrix

The virulent CH53 fungal strain of R. necatrix, isolated at Almuñecar (Granada, Spain) [2] was cultured on potato dextrose agar (PDA; OXOID) in darkness at 25 °C. To obtain the fungal filtrate, six 0.5 × 1 cm fragments of PDA with fungal mycelium were incubated on the surface of 200 mL of Potato Dextrose Broth (PDB; DifcoTM, Líbano, 2025) in 2 L Erlenmeyer flasks over 21 days at 25 °C in darkness. This medium was filtered out through 2 layers of filter paper to eliminate hyphae and debris from the fungus; the medium obtained, containing the fungal exudates, was sterilized through Whatman ® 0.2 μm filters (LLG Labware, Germany, 2026), frozen in liquid nitrogen, and stored at −80 °C until use.

2.3. Obtainment of a Callus Line Resistant to Fungal Filtrate

For this assay, a small fraction of the embryogenic culture was used. This fraction was obtained following incubation of 0.4 g embryogenic callus into 40 mL of liquid MSP medium for 9 days at 120 rpm and 25 °C in darkness; thereafter, the culture was sequentially sieved through a 2 mm and then a 1 mm pore mesh, selecting the retained fraction over the 1 mm pore.
Initially, an experiment to test the effect of the fungal culture filtrate (CF) and of the medium used to grow the fungus (PDB) on avocado embryogenic callus proliferation was carried out. 200 milligrams of AN-9 embryogenic callus were incubated for 1 week in 20 mL of liquid MSP supplemented with 0, 20, 40, 60, and 80% (v/v) of PDB or R. necatrix CF, both sterilized through 0.2 µm filters at 120 rpm and 25 °C in darkness, followed by 1 month of culture on solid MSP medium. Afterward, the increase in callus weight was recorded. Three replicates were used for each treatment.
To obtain a cell line resistant to R. necatrix CF, 400 mg of this fine fraction was incubated in 40 mL MSP medium supplemented with 60% (v/v) R. necatrix CF for 1 week at 120 rpm and 25 °C in darkness; afterward, the embryogenic callus was cultured on solid MSP medium without fungal filtrate for cell recovery. The callus was recultured monthly (3 or 4 times) until a sufficient amount of newly grown callus was obtained; afterward, a small fraction of this callus was obtained and further exposed to 60% CF with subsequent culture in solid MSP medium, as previously indicated. The small callus fraction of the newly grown callus was further exposed twice to a higher concentration of CF (80%), as previously indicated, for the 60% CF treatment. The callus growing after the second exposure to 80% CF was selected as a resistant embryogenic line (L3). The experiment was initiated with 6 flasks. Figure 1a shows the workflow followed to obtain the resistant embryogenic line.

2.4. Experimental Design

To evaluate differential gene expression between susceptible (AN-9) and resistant (L3) lines to R. necatrix CF, embryogenic calli of both lines were incubated in an MSP liquid medium containing 40% of R. necatrix filtrate for 24 h at 120 rpm and 25 °C in darkness. Controls were obtained by growing the callus of both lines in the MSP liquid medium without fungal filtrate. After the incubation period, the embryogenic calli were removed from the medium, weighed, and frozen in liquid nitrogen. The experiment was laid out in a randomized block design with three biological replicates per treatment in which each biological replicate consisted of three embryogenic callus groups that were 0.4 g each (Figure 1b).

2.5. RNA Extraction

For RNA extraction, the embryogenic calli from L3 and AN-9 exposed and not exposed to fungal exudates were macerated with liquid nitrogen using a pestle, and 0.1 g of frozen powder was collected in a 2 mL Eppendorf. Afterward, RNA was extracted using a Spectrum plant RNA kit (Sigma Aldrich, St. Louis, MI, USA) following the manufacturer’s instructions.
DNAse I (DNAse I, Thermo, Waltham, MA, USA) treatment was carried out after the extraction process. RNA was purified using a NucleoSpin RNA kit (Macherey-Nagel, Germany) following the manufacturer’s instructions.
RNA quantity and quality were determined based on absorbance ratios at 260 nm/280 nm and 260 nm/230 nm using a NanoDrop® ND-1000 (Nanodrop Technologies, Inc., Wilmington, NC, USA) spectrophotometer. RNA integrity was confirmed with the appearance of ribosomal RNA bands and lack of degradation products after separation on a 1.2% agarose gel and Red Safe (Intron Biotechnology, WA, USA) staining.

2.6. Transcriptome Analysis

The integrity and quantitation of RNA were assessed using the RNA Nano 6000 Assay Kit of the Bioanalyzer 2100 system (Agilent Technologies, CA, USA). A total of 1 microgram of RNA from each sample was used for RNA preparations. Sequencing libraries were generated using NEBNext® UltraTM RNA Library Prep Kit for Illumina® (NEB, MA, USA) according to the manufacturer. Index codes were added to attribute sequences to each sample. A cBot Cluster Generation System was employed to perform the clustering of the index-coded samples using the PE Cluster Kit cBot-HS (Illumina) following the manufacturer’s instructions. Paired-end reads were generated by sequencing the library preparations on an Illumina platform. Raw data in a FASTQ format were processed using fastp. Raw reads were processed to remove reads containing adapter and poly-N sequences and reads with low quality, and the Q20, Q30, and GC content of the clean data (clean reads) were calculated. High-quality paired-end clean reads were mapped to the reference genome downloaded from the genome website browser (NCBI) using HISAT2 software. Featured counts were used to quantify the read numbers mapped of each gene. Reads Per Kilobase of exon model per Million mapped reads (RPKM) of each gene were calculated based on the length of the gene and the reads count mapped to this gene. Differential expression analysis of three biological replicates per condition was performed using the DESeq2 R package. Benjamin and Hochberg’s approach was used to adjust p-values for controlling the False Discovery Rate (FDR) and to select genes with an adjusted p-value < 0.05 as differentially expressed genes (DEGs). The DEGs were identified using the following conditions: |fold change (FC)| > 2 and Padjust < 0.05. The data from this study are available from the NCBI Gene Expression Omnibus under accession number GSE228295.

2.7. Gene Predictions and Annotation

Gene Ontology (GO) and KEGG enrichment analysis of differentially expressed genes were implemented with the cluster Profiler R package. Afterward, the gene length bias was corrected. GO terms were considered significantly enriched by differentially expressed genes with corrected p-value < 0.05.

2.8. Quantitative Real Time-PCR

Gene expression levels from transcriptome analysis were validated by qRT-PCR. Single-stranded cDNA was synthesized using the iScript cDNA synthesis kit (BIO-RAD, CA, USA), following the manufacturer’s instructions. The concentration and purity of cDNA were determined using a NanoDrop® ND-1000 (Nanodrop Technologies, Inc., Montchanin, DE, USA), and cDNA integrity was confirmed by separation on a 1.2% agarose gel and Red Safe (Intron Biotechnology) staining. The expression of 6 avocado genes was studied. Actin was used as an endogenous control gene for normalization. Primer pairs were chosen to generate fragments between 50 and 150 bp with a melting temperature of 60 °C and designed using Primer 3 software [30,31,32]. Primers are presented in supplementary Table S1.
Primer specificity was tested, firstly by performing a conventional PCR, and confirmed by the presence of a single melting curve during qRT-PCR. Serial dilutions (1:10, 1:20, 1:50, 1:200) were made from a pool of cDNA from each treatment and time-point, and calibration curves were performed for each gene. For qRT-PCR, the reaction mixture consisted of cDNA first-strand template, primers (500 nmol final concentration), and SYBR Green Master Mix (SsoAdvanced Universal SYBR Green Supermix, Bio-Rad) in a total volume of 20 μL. The PCR conditions were as follows: 30 s at 95 °C, followed by 40 cycles of 15 s at 95 °C and 30 s at 60 °C, 3 min at 72 °C, and 1 min at 95 °C. The reactions were performed using an iQ5 real-time PCR detection system (Bio-Rad). Relative quantification of the expression levels for the target was analyzed using the ΔΔCt method [33,34]. The expression data are the mean of three biological replicates. Reactions were performed in triplicate. The statistical significance of the data comparing callus exposed to fungal exudates vs control callus not exposed was determined using Student’s t-test (p < 0.05) and statistically significant differences between resistant and susceptible callus lines were studied with one-way ANOVA (p < 0.05), carried out with the analytical software STATISTICA 7 (StatSoft, Inc., Tulsa, OK, USA).

3. Results

3.1. Obtaining a Callus Line Resistant to Rosellinia necatrix Filtrate

A preliminary experiment to test the effect of fungal CF and the PDB on embryogenic callus proliferation was carried out. After 1 week of incubation in a liquid medium, no change in callus weight was found; however, the callus exposed to CF showed a dark brown color. After 1 month of culture on solid MSP medium, all embryogenic callus previously cultured in liquid medium supplemented with PDB (from 20% to 80% v/v) showed the same color and growth as control callus cultured in MSP medium; however, the weight of callus previously exposed to CF decreased as the amount of CF added to the medium increased (76% and 41% of growth in relation to the control at 20% and 40% CF, respectively); however, at higher concentrations, i.e., 60% and 80% CF, callus was necrotic and no new growth could be observed.
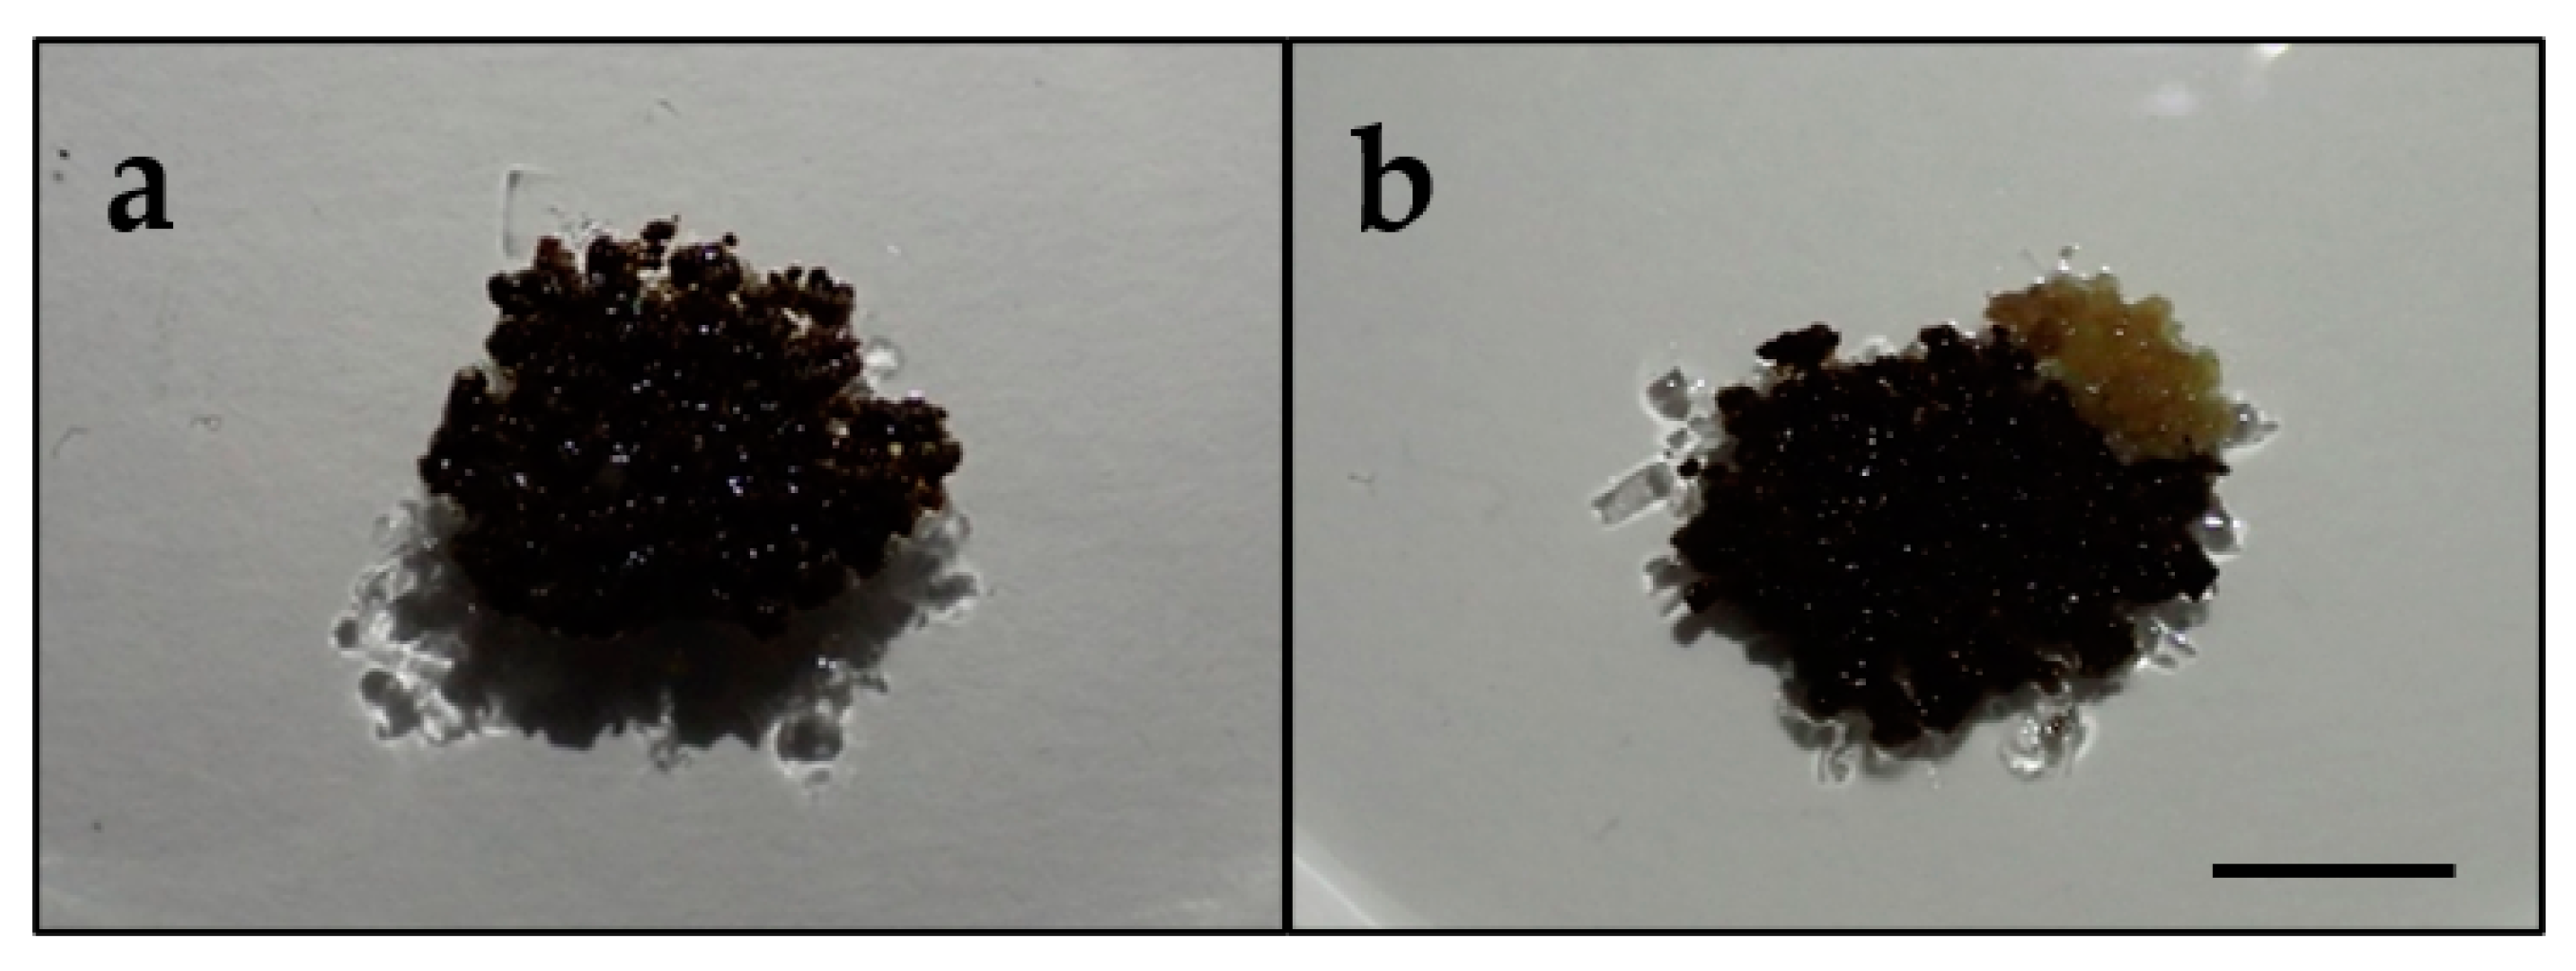
To obtain an embryogenic callus line resistant to CF, 6 flasks with 0.4 g of 1–2 mm embryogenic callus were incubated for 1 week in the presence of MSP medium supplemented with 60% (v/v) of R. necatrix CF at 120 rpm in darkness and later transferred for 1 month onto solid MSP medium. After this period, calli from all flasks showed a necrotic aspect, with a black color, and did not show any growth; however, after the second and third months of culture, one out of the six flasks showed new somatic embryos (Figure 2). After several recultures, this callus showed active proliferation allowing its recovery; hence, it was considered a cell line (L3) with putative somatic variations. To confirm its tolerance to 60% (v/v) CF, it was exposed again to this CF concentration. Afterward, when enough embryogenic callus was obtained, it was incubated in the presence of a higher percentage, 80% (v/v) CF, and again, after recovery, a new exposure to this concentration of CF was carried out. The L3 line showed noticeable growth after the second exposure to 80% (v/v) CF; therefore, it was selected as an embryogenic-resistant line to 80% (v/v) CF and was chosen for use in transcriptomic analysis.

3.2. Comparative Transcriptome Analysis of Resistant and Susceptible Callus Lines Exposed to Fungal Filtrate

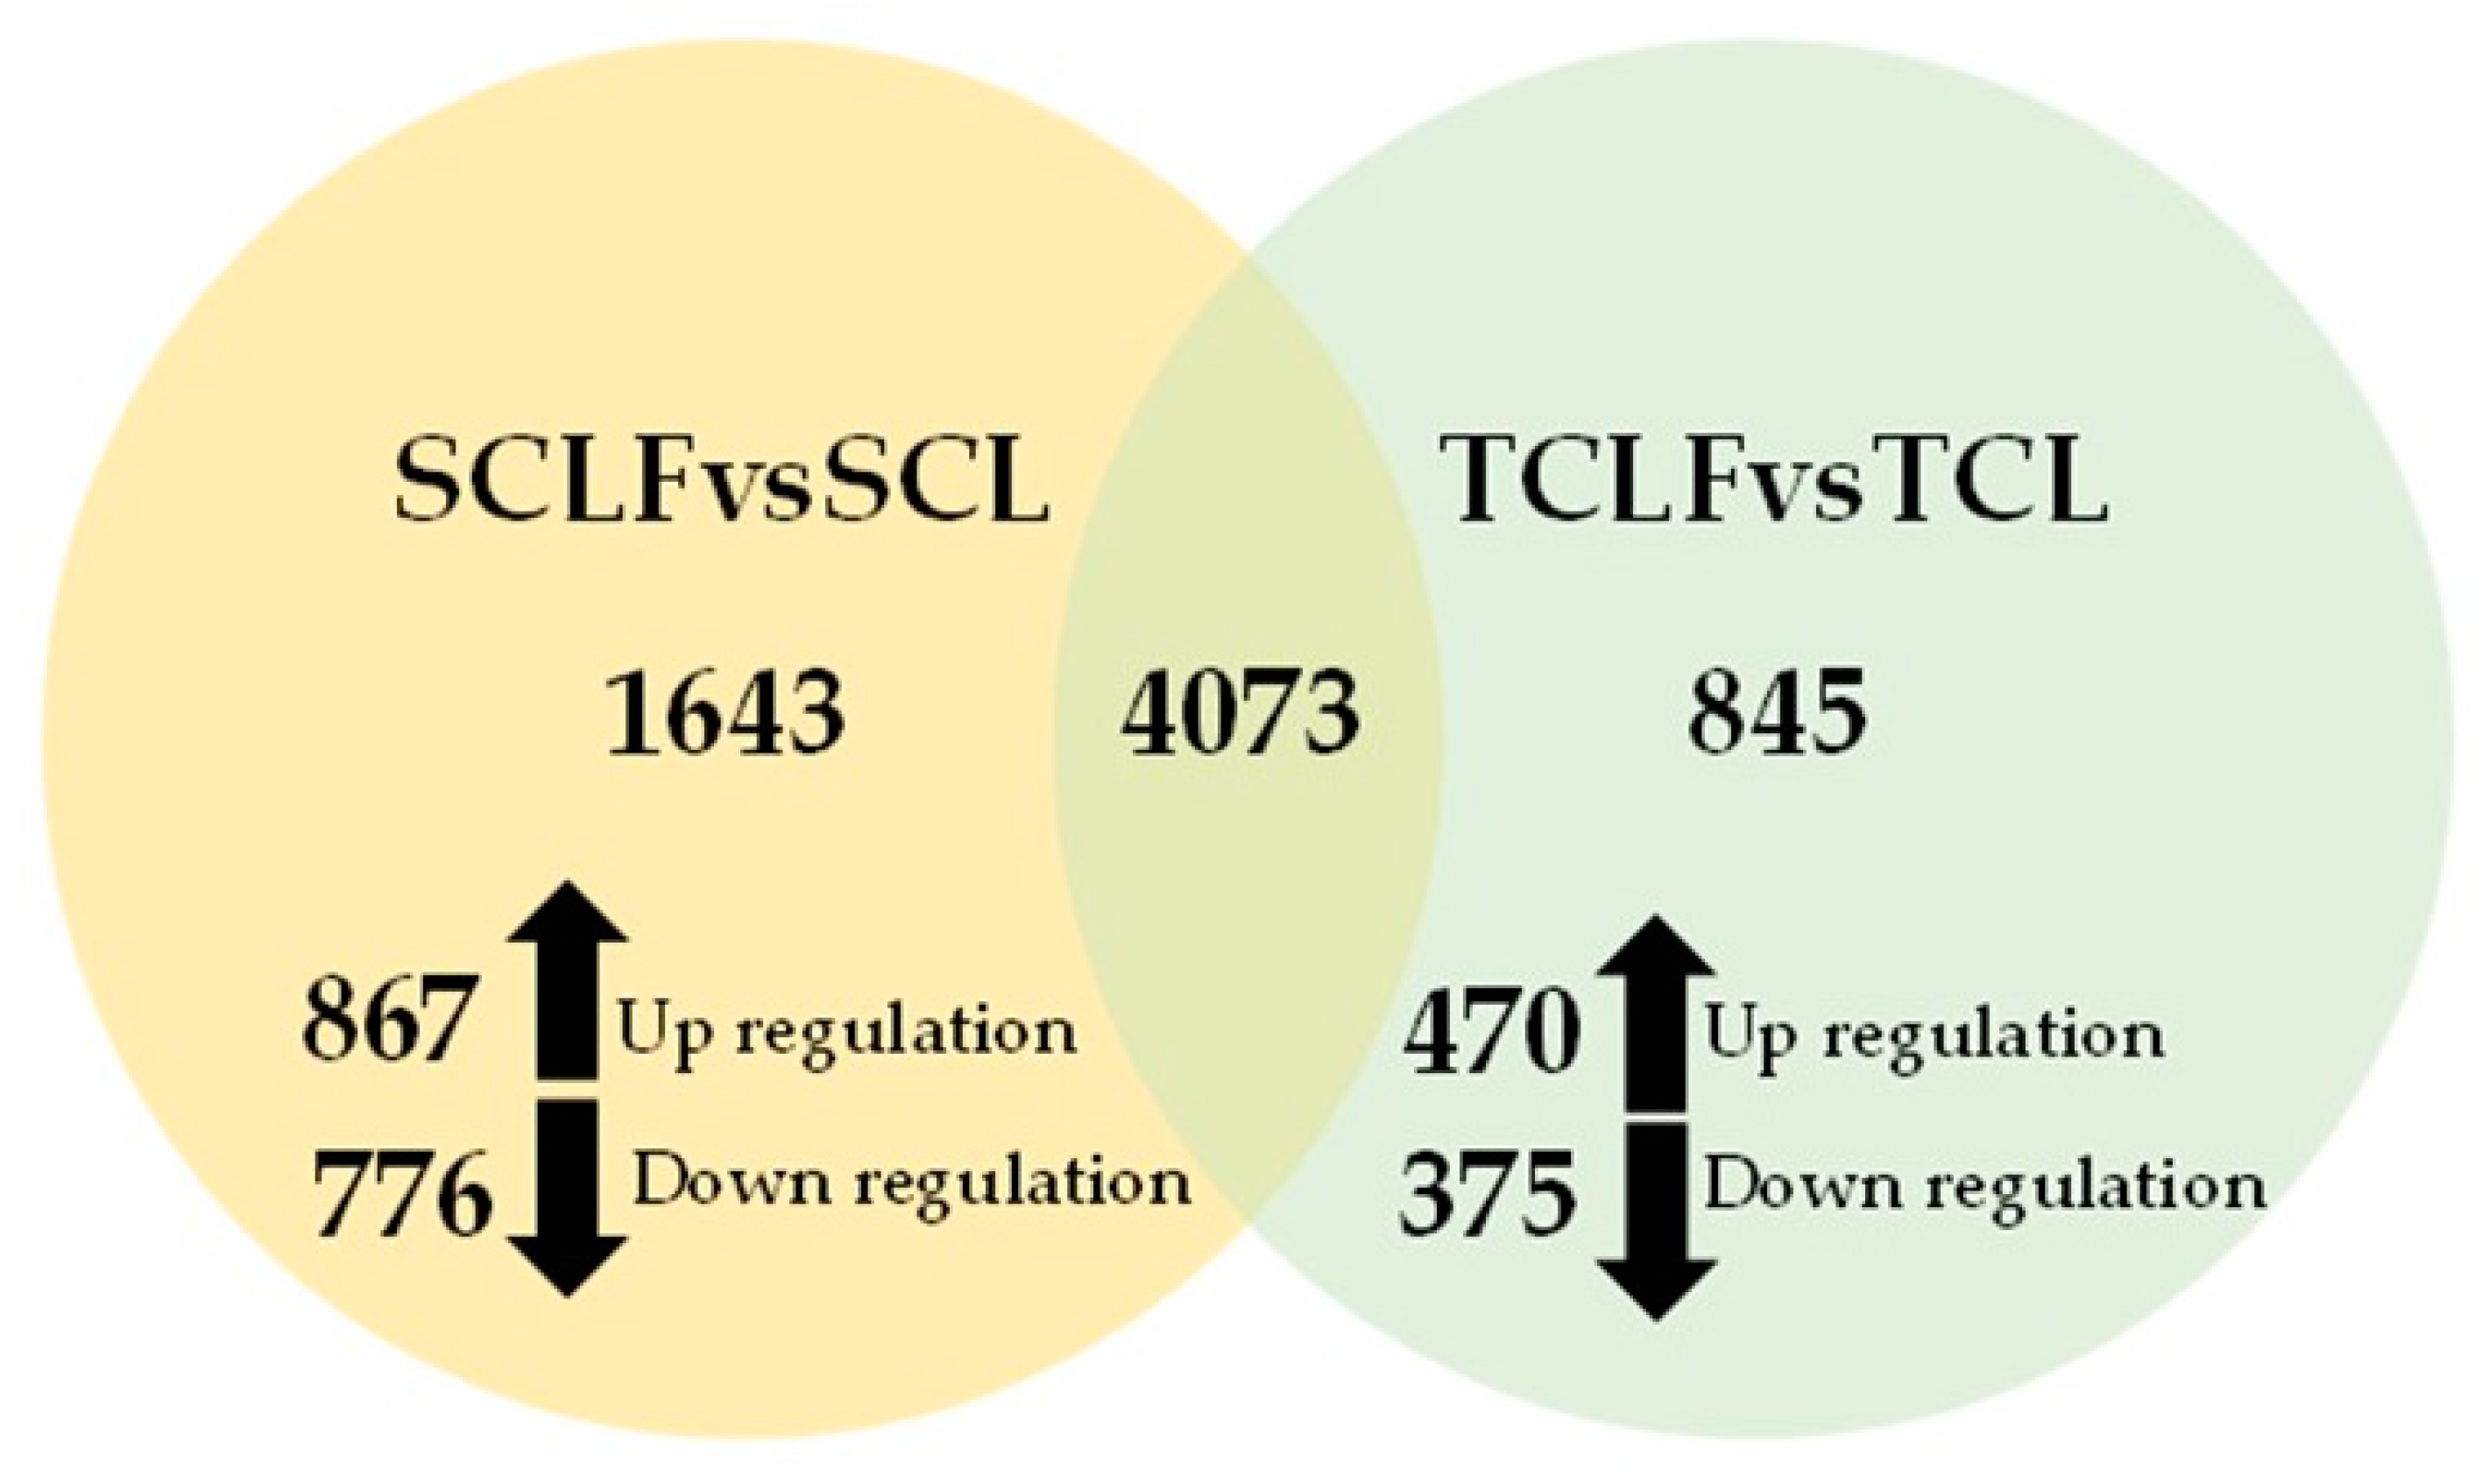
To analyze the avocado response to R. necatrix exudates in resistant and susceptible avocado callus lines, a transcriptome analysis was carried out to compare their expression profiles. The RNA sequencing (RNA-Seq) data were analyzed, including the raw reads from three biological replicates of resistant callus line (L3) exposed (TCLF1, TCLF2, TCLF3) and non-exposed (TCL1, TCL2, TCL3) to fungal filtrate and three biological replicates of the susceptible callus line (AN-9) exposed (SCLF1, SCLF2, SCLF3) and non-exposed to fungal filtrate (SCL1, SCL2, SCL3). A total of 25,211 genes were subjected to statistical analysis to evaluate differential gene expression between TCLF vs TCL and SCLF vs SCL. Analyses resulted in 6,561 differentially expressed genes (DEGs), of which 845 were only found in the resistant line (55.62% induced and 44.38% repressed) and 1,643 in the susceptible (52.77% induced and 47.23% repressed) (|fold change (FC)| > 2; p-value < 0.05) (Figure 3). According to the results shown in the Venn diagram, the number of genes with significantly altered expression observed in the susceptible callus line was higher than that of the resistant material L3 line following exposure to fungal filtrate.
A heat map of DEGs shows consistency in expression patterns among treatments, supporting the reliability of the RNA-Seq data (Figure 4).

3.3. RNA-Seq Analysis Validation

Differences found in gene expression profiles between resistant vs susceptible lines were further verified through a quantitative real-time PCR (qRT-PCR) assay on total cDNA samples from the calli of three biological replicates. For this purpose, six randomly selected genes were analyzed. The actin gene was used as a reference gene for data normalization. The expression levels of these genes amplified by qRT-PCR are shown in Table 1. Different expression values were obtained from qRT-PCR than those observed on the RNA-Seq; however, the results corroborated the overall differences found between the two samples (resistant and susceptible) in the RNA-Seq analysis.

3.4. Functional Annotation and Pathway Analysis of Differentially Expressed Genes (DEGs)

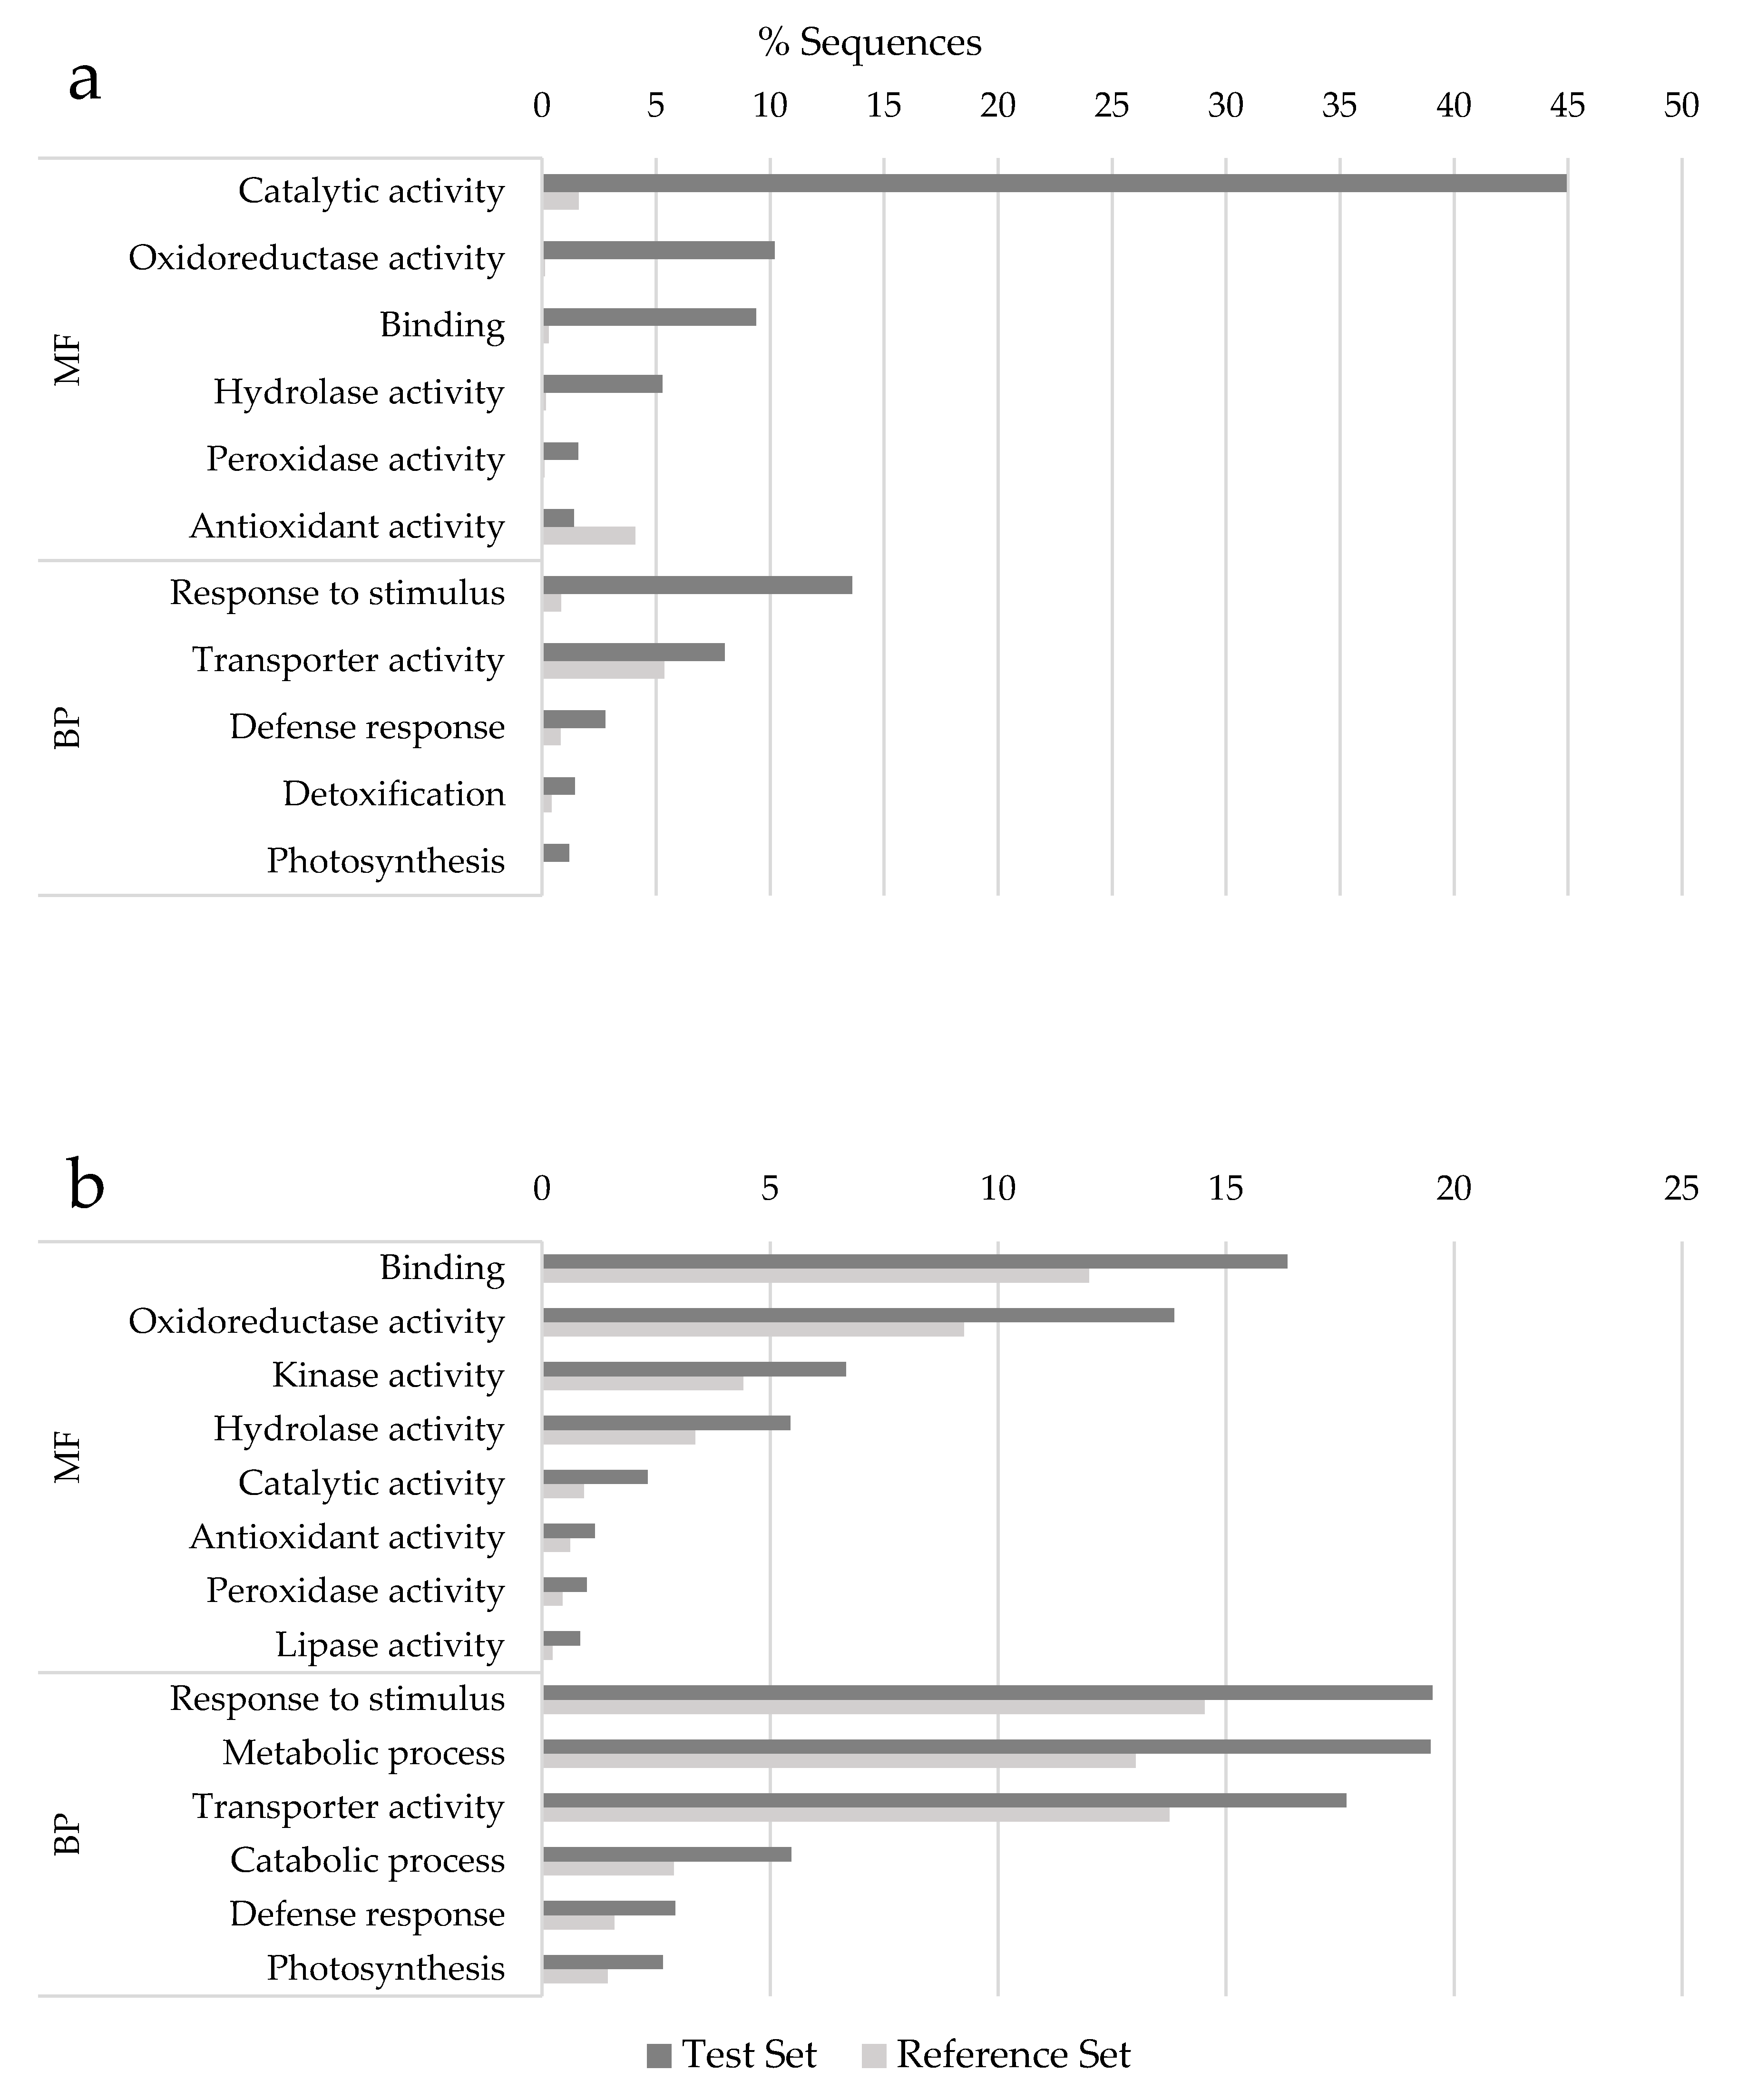
To better understand the behavior of resistant and susceptible callus lines exposed to the fungal filtrate, Blast2GO software (p-value < 0.05) was used to enrich and categorize DEGs based on blast sequence homologies and gene ontology. DEGs of resistant (Figure 5a) and susceptible (Figure 5b) callus lines were significantly grouped into the regulation of six and eight molecular functions (MF), respectively; six MF were shared among both lines, i.e., catalytic activity (GO:0003824), oxidoreductase activity (GO:0016684, GO:0016491), binding (GO:0020037, GO:0005506, GO:0001071, GO:0043565, GO:0046906, GO:0003700), hydrolase activity (GO:0016788, GO:0008081, GO:0042578), peroxidase activity (GO:0004601), and antioxidant activity (GO:0016209), while molecular functions related to lipase activity (GO:0004630, GO:0004620, GO:0070290, GO:0016298) and kinase activity (GO:0046522, GO:0004674, GO:0004672, GO:0016301) were only found in the susceptible callus line.
Regarding biological processes (BP), response to stimulus (GO:0034605, GO:0009408, GO:0009266, GO:0050896, GO:0006979), transporter activity (GO:0022804, GO:0006865, GO:0006820, GO:0015297, GO:0046942, GO:0098661, GO:0015849, GO:0015711, GO:0015291, GO:0015293, GO:0055085, GO:0022857, GO:0005215, GO:0042910), defense response (GO:0006952), and photosynthesis (GO:0015979) were present in both lines; however, detoxification (GO:1990748, GO:0098869, GO:0098754) was represented only in the resistant line, while catabolic (GO:0046208, GO:0044712, GO:0009395, GO:1901565, GO:0046475, GO:0046503, GO:0042402, GO:0009310) and metabolic processes (GO:0005991, GO:0005985, GO:0044723, GO:0009445, GO:0009446, GO:0006595, GO:0006793, GO:0006796, GO:0009311, GO:0005984, GO:0044262, GO:0006576, GO:0005975, GO:0097164, GO:0006040, GO:0009308) were found only in the susceptible AN-9 line.

3.5. Potential Genes Related to Avocado Embryogenic Callus Defense against Fungal Exudates

Genes previously reported to be important in plant defense against biotic and abiotic stress were shown to be up-regulated in the resistant avocado embryogenic line in comparison with the susceptible one (Table 2). Five genes were involved in cell wall remodeling; in particular, two of them, cinnamoyl-CoA reductase (Pag55749) and a lignin-forming anionic peroxidase (Pag191108), were included in the top 20 induced genes of the L3 line exposed to fungal exudates (Table 3). Interestingly, five genes were related to detoxification and disease resistance proteins and five encoded for PR proteins, among which PR-4 showed a higher induction with an FC value of 18.65 in the resistant line.
In addition, the exposure of callus lines to fungal filtrate resulted in the accumulation of protease and protease inhibitor proteins, which was much more noticeable in the resistant callus line, i.e., the proteinase inhibitor (Pag64949) and the subtilisin-like protein protease (Pag341255) were induced 2 and 6 times more in the L3 line in comparison with the AN-9 line, respectively.
Transcription factors are key elements in the response to abiotic and biotic stresses; in this study, 15 defense-related transcription factors (TFs) were up-regulated in the L3 line, 5 WRKY (WRKYGQK) (Pag345989, Pag306446, Pag307121, Pag28154, Pag46518,) 6 MYB (myeloblastosis-related proteins) (Pag51890, Pag121997, Pag389501, Pag240398, Pag190993, and Pag276502), 1 MYC (Myelocytomatosis) (Pag296108), and 3 NAC (NAM, ATAF and CUC) (Pag223376, Pag201669, Pag262640). All of them, except for Pag345989, Pag306446, and Pag307121, were overexpressed in the resistant callus line but could not be detected in susceptible AN-9, in which the transcription factor MYB1R1-like protein isoform X2 was the one showing the higher induction with an FC of 27.15.
According to the comprehensive analyses, the hormonal balance was disordered in both resistant and susceptible callus lines, where the genes encoding responsive proteins for ethylene, abscisic acid, gibberellin, and auxin regulation are highlighted. Out of the 36 up-regulated genes, 16 showed higher overexpression in L3 than in the susceptible AN-9 line (Table 2), and 7 genes encoded ERF (ethylene-responsive transcription factors) proteins that were related to ethylene regulation; specifically, the ethylene-responsive transcription factor ERF020 protein (Pag26291) was the one showing the higher expression in both lines (FC of 60.92 in L3; 45.99 in AN-9 line).
Genes involved in the detoxification of harmful reactive oxygen species (ROS) generated during callus exposure to fungal filtrate were also found. The resistant line overexpressed 60 genes encoding cytochrome P450 (CYT P450), peroxidases, and oxygenase proteins, among which 16 showed higher induction than the AN-9 line (10 CYTP450, 3 peroxidases, and 3 oxygenases). CYT P450 704B1 (Pag378827) and Peroxidase 68 (Pag254946) were the ones showing the higher FC values (FC of 35.03 and FC of 34.50, respectively). The susceptible line responded to the redox environment by deregulating 60 genes, among which cytochrome c oxidase subunit 6a was the one exhibiting the higher FC value (70.32).

4. Discussion

Fungal culture filtrate (CF) generally contain non-host-specific toxins causing harmful effects in plant cells [35], e.g., R. necatrix is known to exude at least two toxins, cytochalasins E and rosnecatrone [7,36], both believed to be involved in the appearance of symptoms in plants infected with this pathogen [37]. Several studies have proved that released exudates induce defense reactions in plant cells [38]. Camarosporomyces flavigenus CF elicited the synthesis of paclitaxel in Corylus avellana suspension cultures [39]; this compound is known to have a potent effect on fungi affecting the bark of yew trees [40], while in Linum album cell cultures, exposure to Fusarium graminearum CF increased PAL (Phenylalanine Ammonia Lyase) activity and synthesis of the antifungal phenolic compound phodophyllotoxin [41]. According to Barz et al. [42], the induced accumulation of these defense compounds merits consideration when studying specific plant–fungi pathosystems.
The present work aims to evaluate differences in gene expression profiles between calli that are resistant and susceptible to R. necatrix crude filtrate following exposure to this filtrate; differential gene expression profiles may account for survival or death in this medium. The resistant line could have arisen as a consequence of a somaclonal variation event, as shown in other cell systems following culture in the presence of fungal filtrates [22,23]. Transcriptome analysis revealed a lower number of genes, with significantly altered expression in the resistant callus L3 line in comparison to the susceptible one, AN-9 line, which could be attributed to a better performance of the L3 line during CF exposure. These results agree with molecular studies carried out under greenhouse conditions, in tolerant and susceptible avocado plants upon infection with R. necatrix, in which a lower number of DEGs were found to be deregulated in the tolerant BG83 genotype when compared with the susceptible “Dusa” rootstock [13]. Similar results have also been observed in tolerant and susceptible tomato, wheat, olive, and rice genotypes following infection with Phytophthora parasítica [43], Rhizoctonia cerealis [44], Verticillium wilt [45], and Rhizoctonia solani [46], respectively.
Gene ontology categories associated with redox activity were significantly enriched in the up-regulated gene sets of both lines and were more noticeable in the susceptible AN-9 line than in resistant L3 line, probably in response to a higher reduction–oxidation status reached in the susceptible line after exposure to CF. Similar results were obtained in a molecular analysis of compatible and incompatible onion/Alternaria porri interaction and Brassica napus/Sclerotia sclerotium interaction [47,48]. In contrast, L3 line showed a much higher catalytic activity compared to the AN-9 line.
The exposure of embryogenic callus lines to 40% R. necatrix exudates induced genes previously reported to be related to plant defense against fungal diseases. Interestingly, transcripts of these genes were accumulated in greater amounts in the resistant line in comparison to the susceptible one (Table 2; Supplementary Figure S1). The induction of genes representing enzymes of the phenyl propanoid isoflavonoid pathway, such as the cinnamoyl-CoA reductase and the gene encoding the lignin-forming anionic peroxidase, which are two key enzymes in lignin biosynthesis [49,50], highlights the importance of lignin production for protection against R. necatrix exudates. Avocado defense mechanisms against P. cinnamomi have also been shown to include structural responses such as strengthening cell walls by depositing callose and lignin [51]. Fungal cell-wall-degrading enzymes such as endochitinases and glucanases have also been detected in the tolerant avocado rootstock “Dusa” following infection with P. cinnamomi [16]. In this research, β-1,3- glucosidase proteins and endochitinase-like proteins could be identified. Activities of these proteins were previously detected in mango embryogenic cultures exposed to Colletotrichum gloeosporioides CF [52], while β-glucanase was increased in a cell line of Cicer arietinum exposed to CF of Fusarium oxysporum [53]. These defense proteins have also been detected in plants regenerated from these cells, and this observation has been correlated with resistance to the pathogen under in vivo conditions [54,55], although this does not always occur, since there are cases in which the expression of resistance to the toxin in in vitro conditions could differ from the reaction observed in vivo [22].
Other PR proteins were also noticeable in avocado embryogenic callus exposed to R. necatrix CF. Specifically, transcripts encoding PR-4 (Pag289080), pathogenesis-related protein STH-21 (Pag168264), and thaumatin-like proteins (PR-5) (Pag154162, Pag154170) were induced 1.5 times more in the resistant line compared to the susceptible line. The presence of PR-5 proteins in the medium of grape cells elicited with fungal filtrate of Elsinoe ampelina was related to the inhibition of fungal growth in a dual culture system [54]. In the case of avocado, PR-4 and thaumatin-like proteins have not been described to be related to tolerance to either R. necatrix or P. cinnamomi; however, it has been reported that their early induction after a priming event could represent a benefit for avocado plants in overcoming R. necatrix infection [56].
Transcriptome analysis also showed the induction of genes regulating ethylene, abscisic acid, gibberellin, and auxin production. Genes encoding ERF proteins were the most represented in the resistant L3 line compared to the susceptible one. This fact could be related to an improved capacity of the L3 line to integrate hormones and redox signaling in the plant response to stress caused by CF since ERFs are known to have a role in molecular response to pathogen attack by regulating hormone cross-talk and redox signaling [57]. In addition, a significant induction of defense-related transcription factors (TFs) such as MYB, WRKY, MYC, and NAC was observed in embryogenic callus incubated with CF. Interestingly, among the TFs showing higher overexpression in the resistant line compared to the susceptible one are the WRKY and NAC domain-containing proteins, whose role in avocado defense against P. cinnamomi and R. necatrix has recently been reported [13,16].
The induction of protease inhibitors in plant defense against fungal pathogens has been extensively reported [58]. One important finding of this work was the overexpression of the proteinase inhibitor gene (Pag64949), which was two times higher in the L3 line than in the AN-9 line. The same result was obtained under greenhouse conditions, where the expression of this gene (Pa_Contig05213) was 2.6 times higher in tolerant BG83 avocado rootstock compared to the susceptible “Dusa” after infection with R. necatrix, suggesting the important role that these proteins could play in the defense of avocado rootstocks against this pathogen [13,56].

5. Conclusions

This study provides new insights into the different mechanisms involved in avocado tolerance responses to R. necatrix CF. In resistant callus line L3, CF induced a set of general defense-related transcripts (genes involved in lignin biosynthesis, PR proteins, WRKY, NAC, proteinase inhibitors, etc.) that are also induced in the tolerant response of avocado rootstocks to R. necatrix. Interestingly, the proteinase inhibitor (Pag64949) shared the same coding sequence with the one identified by Zumaquero et al. [13] in greenhouse experiments, in the interaction tolerant BG83 avocado rootstock/R. necatrix (Pa_Contig05213), supporting the use of this gene as a potential marker to speed up avocado rootstock breeding programs. This research will contribute to the understanding of avocado defense against this pathogen, thereby aiding in the selection of tolerant avocado rootstocks and supporting the use of in vitro cell culture techniques for studying avocado–R. necatrix interaction.

Supplementary Materials

The following supporting information can be downloaded at https://www.mdpi.com/article/10.3390/agronomy13051354/s1. Table S1: qRT-PCR primer sequences used in this study. Figure S1: Comparative model of the exposure of susceptible (AN-9) and resistant (L3) callus lines to 40% of Rosellinia necatrix culture filtrate.

Author Contributions

Conceptualization, C.P., E.P.-R. and F.P.-A.; methodology, A.M.-P. and A.Z.; validation, A.Z., A.M.-P. and C.P.; formal analysis, C.P. and E.P.-R.; investigation, A.M.-P., A.Z., C.P., C.L.-H. and E.P.-R.; data curation, E.M.-F. and E.P.-R.; writing—original draft preparation, A.M.-P., E.P.-R. and C.P.; writing—review and editing, A.M.-P., E.P.-R., F.P.-A. and C.P.; visualization, F.P.-A., E.P.-R., E.M.-F. and C.P.; supervision, E.P.-R., F.P.-A. and C.P.; project administration, C.P. and F.P.-A.; funding acquisition, C.P. and F.P.-A. All authors have read and agreed to the published version of the manuscript.

Funding

This research was funded by RTA2017–00040–00-00 (INIA-AEI), AVA201601.14 and AVA2019.008 (20% Junta de Andalucía, 80% FEDER) and Ministerio de Ciencia e Innovación, Grant AGL2017-83368-C2-1-R. A.M.-P. is financed by a PhD FPI contract.

Data Availability Statement

All data generated or analyzed during this study are included in this published article. The data from this study are available from the NCBI Gene Expression Omnibus under accession number GSE228295.

Conflicts of Interest

The authors declare no conflict of interest.

References

  1. FAOSTAT. Data. 2023. Available online: https://www.fao.org/faostat/es/#data (accessed on 21 February 2023).
  2. López-Herrera, C.J.; Zea-Bonilla, T. Effects of benomyl, carbendazim, fluazinam and thiophanate methyl on white root rot of avocado. Crop Prot. 2007, 26, 1186–1192. [Google Scholar] [CrossRef]
  3. Khan, A.H. Biology and pathogenicity of Rosellinia necatrix (Hart.) Berl. Biologia 1955, 5, 199–425. [Google Scholar]
  4. Pliego, C.; López-Herrera, C.; Ramos, C.; Cazorla, F.M. Developing tools to unravel the biological secrets of Rosellinia necatrix, an emergent threat to woody crops. Mol. Plant Pathol. 2012, 13, 226–239. [Google Scholar] [CrossRef]
  5. Pérez-Jiménez, R.M. A review of the biology and pathogenicity of Rosellinia necatrix–the cause of white root rot disease of fruit trees and other plants. J. Phytopathol. 2006, 154, 257–266. [Google Scholar] [CrossRef]
  6. Arjona-Girona, I.; López-Herrera, C.J. First report of Rosellinia necatrix causing white root rot in mango trees in Spain. Plant Dis. 2018, 102, 2639. [Google Scholar] [CrossRef]
  7. Edwards, R.L.; Maitland, D.J.; Scowen, I.J.; De Sousa, A.J.T.; Whalley, A.J.S. Metabolites of the higher fungi. Part 32. A phytotoxic bicyclo[4.1.0]hept-3-en-2-one from the fungus Rosellinia necatrix Prill. J. Chem. Soc. Perkin Trans. 2001, 1, 537–542. [Google Scholar] [CrossRef]
  8. Kimura, Y.; Nakajima, H.; Hamasaki, T. Structure of rosellichalasin, a new metabolite produced by Rosellinia necatrix. Agric. Biol. Chem. 1989, 53, 1699–1701. [Google Scholar] [CrossRef]
  9. Kshirsagar, A.; Reid, A.J.; McColl, S.M.; Saunders, V.A.; Whalley, A.J.S.; Evans, E.H. The effect of fungal metabolites on leaves as detected by chlorophyll fluorescence. New Phytol. 2001, 151, 451–457. [Google Scholar] [CrossRef]
  10. Kanematsu, S.; Hayashi, T.; Kudo, A. Isolation of Rosellinia necatrix mutants with impaired cytochalasin E production and its pathogenicity. Jpn. J. Phytopathol. 1997, 63, 425–431. [Google Scholar] [CrossRef] [Green Version]
  11. Zumaquero, A.; Kanematsu, S.; Nakayashiki, H.; Matas, A.; Martínez-Ferri, E.; Barceló-Muñóz, A.; Pliego-Alfaro, F.; López-Herrera, C.; Cazorla, F.M.; Pliego, C. Transcriptome analysis of the fungal pathogen Rosellinia necatrix during infection of a susceptible avocado rootstock identifies potential mechanisms of pathogenesis. BMC Genom. 2019, 20, 1016. [Google Scholar] [CrossRef] [Green Version]
  12. Ten Hoopen, G.M.; Krauss, U. Biology and control of Rosellinia bunodes, Rosellinia necatrix and Rosellinia pepo: A review. Crop Prot. 2006, 25, 89–107. [Google Scholar] [CrossRef]
  13. Zumaquero, A.; Martínez-Ferri, E.; Matas, A.J.; Reeksting, B.; Olivier, N.A.; Pliego-Alfaro, F.; Barceló, A.; van den Berg, N.; Pliego, C. Rosellinia necatrix infection induces differential gene expression between tolerant and susceptible avocado rootstocks. PLoS ONE 2019, 14, e0212359. [Google Scholar] [CrossRef] [PubMed] [Green Version]
  14. Engelbrecht, J.; van den Berg, N. Expression of defence-related genes against Phytophthora cinnamomi in five avocado rootstocks. S. Afr. J. Sci. 2013, 109, 1–8. [Google Scholar] [CrossRef] [Green Version]
  15. Reeksting, B.J.; Coetzer, N.; Mahomed, W.; Engelbrecht, J.; van den Berg, N. De novo sequencing, assembly, and analysis of the root transcriptome of Persea americana (Mill.) in response to Phytophthora cinnamomi and flooding. PLoS ONE 2014, 9, e86399. [Google Scholar] [CrossRef] [PubMed]
  16. van den Berg, N.; Mahomed, W.; Olivier, N.A.; Swart, V.; Crampton, B.G. Transcriptome analysis of an incompatible Persea americana-Phytophthora cinnamomi interaction reveals the involvement of SA- and JA-pathways in a successful defense response. PLoS ONE 2018, 13, e0205705. [Google Scholar] [CrossRef]
  17. Daniel, S.; Barz, W. Elicitor-induced metabolic changes in cell cultures of chickpea (Cicer arietinum L.) cultivars resistant and susceptible to Ascochyta rabiei. Planta 1990, 182, 279–286. [Google Scholar] [CrossRef]
  18. Ramirez-Suero, M.; Bénard-Gellon, M.; Chong, J.; Laloue, H.; Stempien, E.; Abou-Mansour, E.; Fontaine, F.; Larignon, P.; Mazet-Kieffer, F.; Farine, S.; et al. Extracellular compounds produced by fungi associated with Botryosphaeria dieback induce differential defence gene expression patterns and necrosis in Vitis vinifera cv. Chardonnay cells. Protoplasma 2014, 251, 1417–1426. [Google Scholar] [CrossRef] [Green Version]
  19. Bénard-Gellon, M.; Farine, S.; Goddard, M.L.; Schmitt, M.; Stempien, E.; Pensec, F.; Laloue, H.; Mazet-Kieffer, F.; Fontaine, F.; Larignon, P.; et al. Toxicity of extracellular proteins from Diplodia seriata and Neofusicoccum parvum involved in grapevine Botryosphaeria dieback. Protoplasma 2015, 252, 679–687. [Google Scholar] [CrossRef]
  20. Lima, M.R.M.; Ferreres, F.; Dias, A.C.P. Response of Vitis vinifera cell cultures to Phaeomoniella chlamydospora: Changes in phenolic production, oxidative state and expression of defence-related genes. Eur. J. Plant Pathol. 2012, 132, 133–146. [Google Scholar] [CrossRef]
  21. Larkin, P.J.; Scowcroft, W.R. Somaclonal variation—A novel source of variability from cell cultures for plant improvement. Theor. Appl. Genet. 1981, 60, 197–214. [Google Scholar] [CrossRef]
  22. Svabova, L.; Lebeda, A. In vitro selection for improved plant resistance to toxin-producing pathogens. J. Phytopathol. 2005, 153, 52–64. [Google Scholar] [CrossRef]
  23. Rai, M.K.; Kalia, R.K.; Singh, R.; Gangola, M.P.; Dhawan, A.K. Developing stress tolerant plants through in vitro selection—An overview of the recent progress. Environ. Exp. Bot. 2011, 71, 89–98. [Google Scholar] [CrossRef]
  24. Krishna, H.; Alizadeh, M.; Singh, D.; Singh, U.; Chauhan, N.; Eftekhari, M.; Sadh, R.K. Somaclonal variations and their applications in horticultural crops improvement. 3 Biotech 2016, 6, 54. [Google Scholar] [CrossRef] [PubMed] [Green Version]
  25. Anil, V.S.; Bennur, S.; Lobo, S. Somaclonal variations for crop improvement: Selection for disease resistant variants in vitro. Plant Sci. Today 2018, 5, 44–54. [Google Scholar] [CrossRef]
  26. Lestari, E.G. In vitro selection and somaclonal variation for biotic and abiotic stress tolerance. Biodiversitas 2006, 7, 297–301. [Google Scholar] [CrossRef]
  27. Jain, S.M. Tissue culture-derived variation in crop improvement. Euphytica 2001, 118, 153–166. [Google Scholar] [CrossRef]
  28. Murashige, T.; Skoog, F. A revised medium for rapid growth and bio-assays with tobacco tissue cultures. Physiol. Plant. 1962, 15, 473–497. [Google Scholar] [CrossRef]
  29. Pliego-Alfaro, F.; Murashige, T. Somatic embryogenesis in avocado (Persea americana Mill.) in vitro. Plant Cell Tissue Organ Cult. 1988, 112, 61–66. [Google Scholar] [CrossRef]
  30. Koressaar, T.; Remm, M. Enhancements and modifications of primer design program Primer3. Bioinformatics 2007, 23, 1289–1291. [Google Scholar] [CrossRef] [Green Version]
  31. Untergasser, A.; Cutcutache, I.; Koressaar, T.; Ye, J.; Faircloth, B.C.; Remm, M.; Rozen, S.G. Primer3-new capabilities and interfaces. Nucleic Acids Res. 2012, 40, 115. [Google Scholar] [CrossRef] [Green Version]
  32. Kõressaar, T.; Lepamets, M.; Kaplinski, L.; Raime, K.; Andreson, R.; Remm, M. Primer3_masker: Integrating masking of template sequence with primer design software. Bioinformatics 2018, 34, 1937–1938. [Google Scholar] [CrossRef] [PubMed] [Green Version]
  33. Livak, K.J.; Schmittgen, T.D. Analysis of relative gene expression data using real-time quantitative PCR and the 2−ΔΔCT method. Methods 2001, 25, 402–408. [Google Scholar] [CrossRef] [PubMed]
  34. Pfaffl, M.W. A new mathematical model for relative quantification in real-time RT-PCR. Nucleic Acids Res. 2001, 29, e45. [Google Scholar] [CrossRef]
  35. Abbas, H.K.; Boyette, C.D.; Hoagland, R.E. Phytotoxicity of Fusarium, other fungal isolates, and of the phytotoxins fumonisin, fusaric acid and moniliformin to jimsonweed. Phytoprotection 1995, 76, 17–25. [Google Scholar] [CrossRef] [Green Version]
  36. Edwards, R.L.; Maitland, D.J.; Whalley, A.J.S. Metabolites of the higher fungi. Part 24. Cytochalasin N, O, P, Q, and R. New cytochalasins from the fungus Hypoxylon terricola Mill. J. Chem. Soc. Perkin Trans. 1989, 1, 57–65. [Google Scholar] [CrossRef]
  37. Whalley, A.J.S. The xylariaceous way of life. Mycol. Res. 1996, 100, 897–922. [Google Scholar] [CrossRef]
  38. Knogge, W. Molecular basis of specificity in host/fungus interactions. Eur. J. Plant Pathol. 1996, 102, 807–816. [Google Scholar] [CrossRef]
  39. Salehi, M.; Moieni, A.; Safaie, N.; Farhadi, S. Whole fungal elicitors boost paclitaxel biosynthesis induction in Corylus avellana cell culture. PLoS ONE 2020, 15, e0236191. [Google Scholar] [CrossRef]
  40. Young, D.H.; Michelotti, E.L.; Swindell, C.S.; Krauss, N.E. Antifungal properties of Taxol and various analogues. Experientia 1992, 48, 882–885. [Google Scholar] [CrossRef] [PubMed]
  41. Kumar, K.A.; Singh, S.K.; Kumar, B.S.; Doble, M. Synthesis, anti-fungal activity evaluation and QSAR studies on podophyllotoxin derivatives. Open Chem. 2007, 5, 880–897. [Google Scholar] [CrossRef] [Green Version]
  42. Barz, W.; Daniel, S.; Hinderer, W.; Jaques, U.; Kessmann, H.; Köster, J.K.; Tiemann, K. Elicitation and metabolism of phytoalexins in plant cell cultures. In Plant Cell Biotechnology; NATO ASI Series; Pais, M.S.S., Mavituna, F., Novais, J.M., Eds.; Springer: Berlin/Heidelberg, Germany, 1988; Volume 18. [Google Scholar] [CrossRef]
  43. Naveed, Z.A.; Ali, G.S. Comparative transcriptome analysis between a resistant and a susceptible wild tomato accession in response to Phytophthora parasitica. Int. J. Mol. Sci. 2018, 19, 3735. [Google Scholar] [CrossRef] [PubMed] [Green Version]
  44. Geng, X.; Gao, Z.; Zhao, L.; Zhang, S.; Wu, J.; Yang, Q.; Liu, S.; Chen, X. Comparative transcriptome analysis of resistant and susceptible wheat in response to Rhizoctonia cerealis. BMC Plant Biol. 2022, 22, 235. [Google Scholar] [CrossRef]
  45. Ramírez-Tejero, J.A.; Jiménez-Ruiz, J.; Serrano, A.; Belaj, A.; León, L.; de la Rosa, R.; Mercado -Blanco, J.; Luque, F. Verticillium wilt resistant and susceptible olive cultivars express a very different basal set of genes in roots. BMC Genom. 2021, 22, 229. [Google Scholar] [CrossRef]
  46. Yang, Q.; Yang, L.; Wang, Y.; Chen, Y.; Hu, K.; Yang, W.; Zuo, S.; Xu, J.; Kang, Z.; Xiao, X.; et al. A High-Quality genome of Rhizoctonia solani, a devastating fungal pathogen with a wide host range. Mol. Plant-Microbe Interact. 2022, 35, 954–958. [Google Scholar] [CrossRef] [PubMed]
  47. Khandagale, K.; Roylawar, P.; Kulkarni, O.; Khambalkar, P.; Ade, A.; Kulkarni, A.; Singh, M.; Gawande, S. Comparative Transcriptome Analysis of Onion in Response to Infection by Alternaria porri (Ellis) Cifferi. Front. Plant Sci. 2022, 13, 857306. [Google Scholar] [CrossRef] [PubMed]
  48. Chittem, K.; Yajima, W.R.; Goswami, R.S.; del Río-Mendoza, L.E. Transcriptome analysis of the plant pathogen Sclerotinia sclerotiorum interaction with resistant and susceptible canola (Brassica napus) lines. PLoS ONE 2020, 15, e0229844. [Google Scholar] [CrossRef] [Green Version]
  49. Lagrimini, L.M.; Vaughn, J.; Erb, W.A.; Miller, S.A. Peroxidase overproduction in tomato: Wound-induced polyphenol deposition and disease resistance. HortScience 1993, 28, 218–221. [Google Scholar] [CrossRef] [Green Version]
  50. Kawasaki, T.; Koita, H.; Nakatsubo, T.; Hasegawa, K.; Wakabayashi, K.; Takahashi, H.; Umemura, K.; Umezawa, T.; Shimamoto, K. Cinnamoyl-CoA reductase, a key enzyme in lignin biosynthesis, is an effector of small GTPase Rac in defense signaling in rice. Proc. Natl. Acad. Sci. USA 2006, 103, 230–235. [Google Scholar] [CrossRef] [Green Version]
  51. van den Berg, N.; Christie, J.B.; Aveling, T.A.S.; Engelbrecht, J. Callose and β-1, 3-glucanase inhibit Phytophthora cinnamomi in a resistant avocado rootstock. Plant Pathol. 2018, 67, 1150–1160. [Google Scholar] [CrossRef]
  52. Jayasankar, S.; Litz, R.E. Characterization of embryogenic mango cultures selected for resistance to Colletotrichum gloeosporoides culture filtrate and phytotoxin. Theor. Appl. Genet. 1998, 96, 823–831. [Google Scholar] [CrossRef]
  53. Singh, R.; Sindhu, A.; Singal, H.R.; Singh, R. Biochemical basis of resistance in chickpea (Cicer arietinum L.) against Fusarium wilt. Acta Phytopathol. Entomol. Hung. 2003, 38, 13–19. [Google Scholar] [CrossRef]
  54. Jayasankar, S.; Li, Z.; Gray, D.J. In vitro selection of Vitis vinífera ‘Chardonnay’ with Elsinoe ampelina culture filtrate is accompanied by fungal resistance and enhanced secretion of chitinase. Planta 2000, 211, 200–208. [Google Scholar] [CrossRef] [PubMed]
  55. Jayasankar, S.; Li, Z.; Gray, D.J. Constitutive expression of Vitis vinifera thaumatin-like protein after in vitro selection and its role in anthracnose resistance. Funct. Plant Biol. 2003, 30, 1105–1115. [Google Scholar] [CrossRef] [PubMed]
  56. Martínez-Ferri, E.; Moreno-Ortega, G.; van den Berg, N.; Pliego, C. Mild water stress-induced priming enhance tolerance to Rosellinia necatrix in susceptible avocado rootstocks. BMC Plant Biol. 2019, 19, 458. [Google Scholar] [CrossRef] [Green Version]
  57. Müller, M.; Munné-Bosch, S. Ethylene response factors: A key regulatory hub in hormone and stress signaling. Plant Physiol. 2015, 169, 32–41. [Google Scholar] [CrossRef] [PubMed] [Green Version]
  58. Jashni, M.K.; Mehrabi, R.; Collemare, J.; Mesarich, C.H.; de Wit, P.J.G.M. The battle in the apoplast: Further insights into the roles of proteases and their inhibitors in plant–pathogen interactions. Front. Plant Sci. 2015, 6, 584. [Google Scholar] [CrossRef] [PubMed] [Green Version]
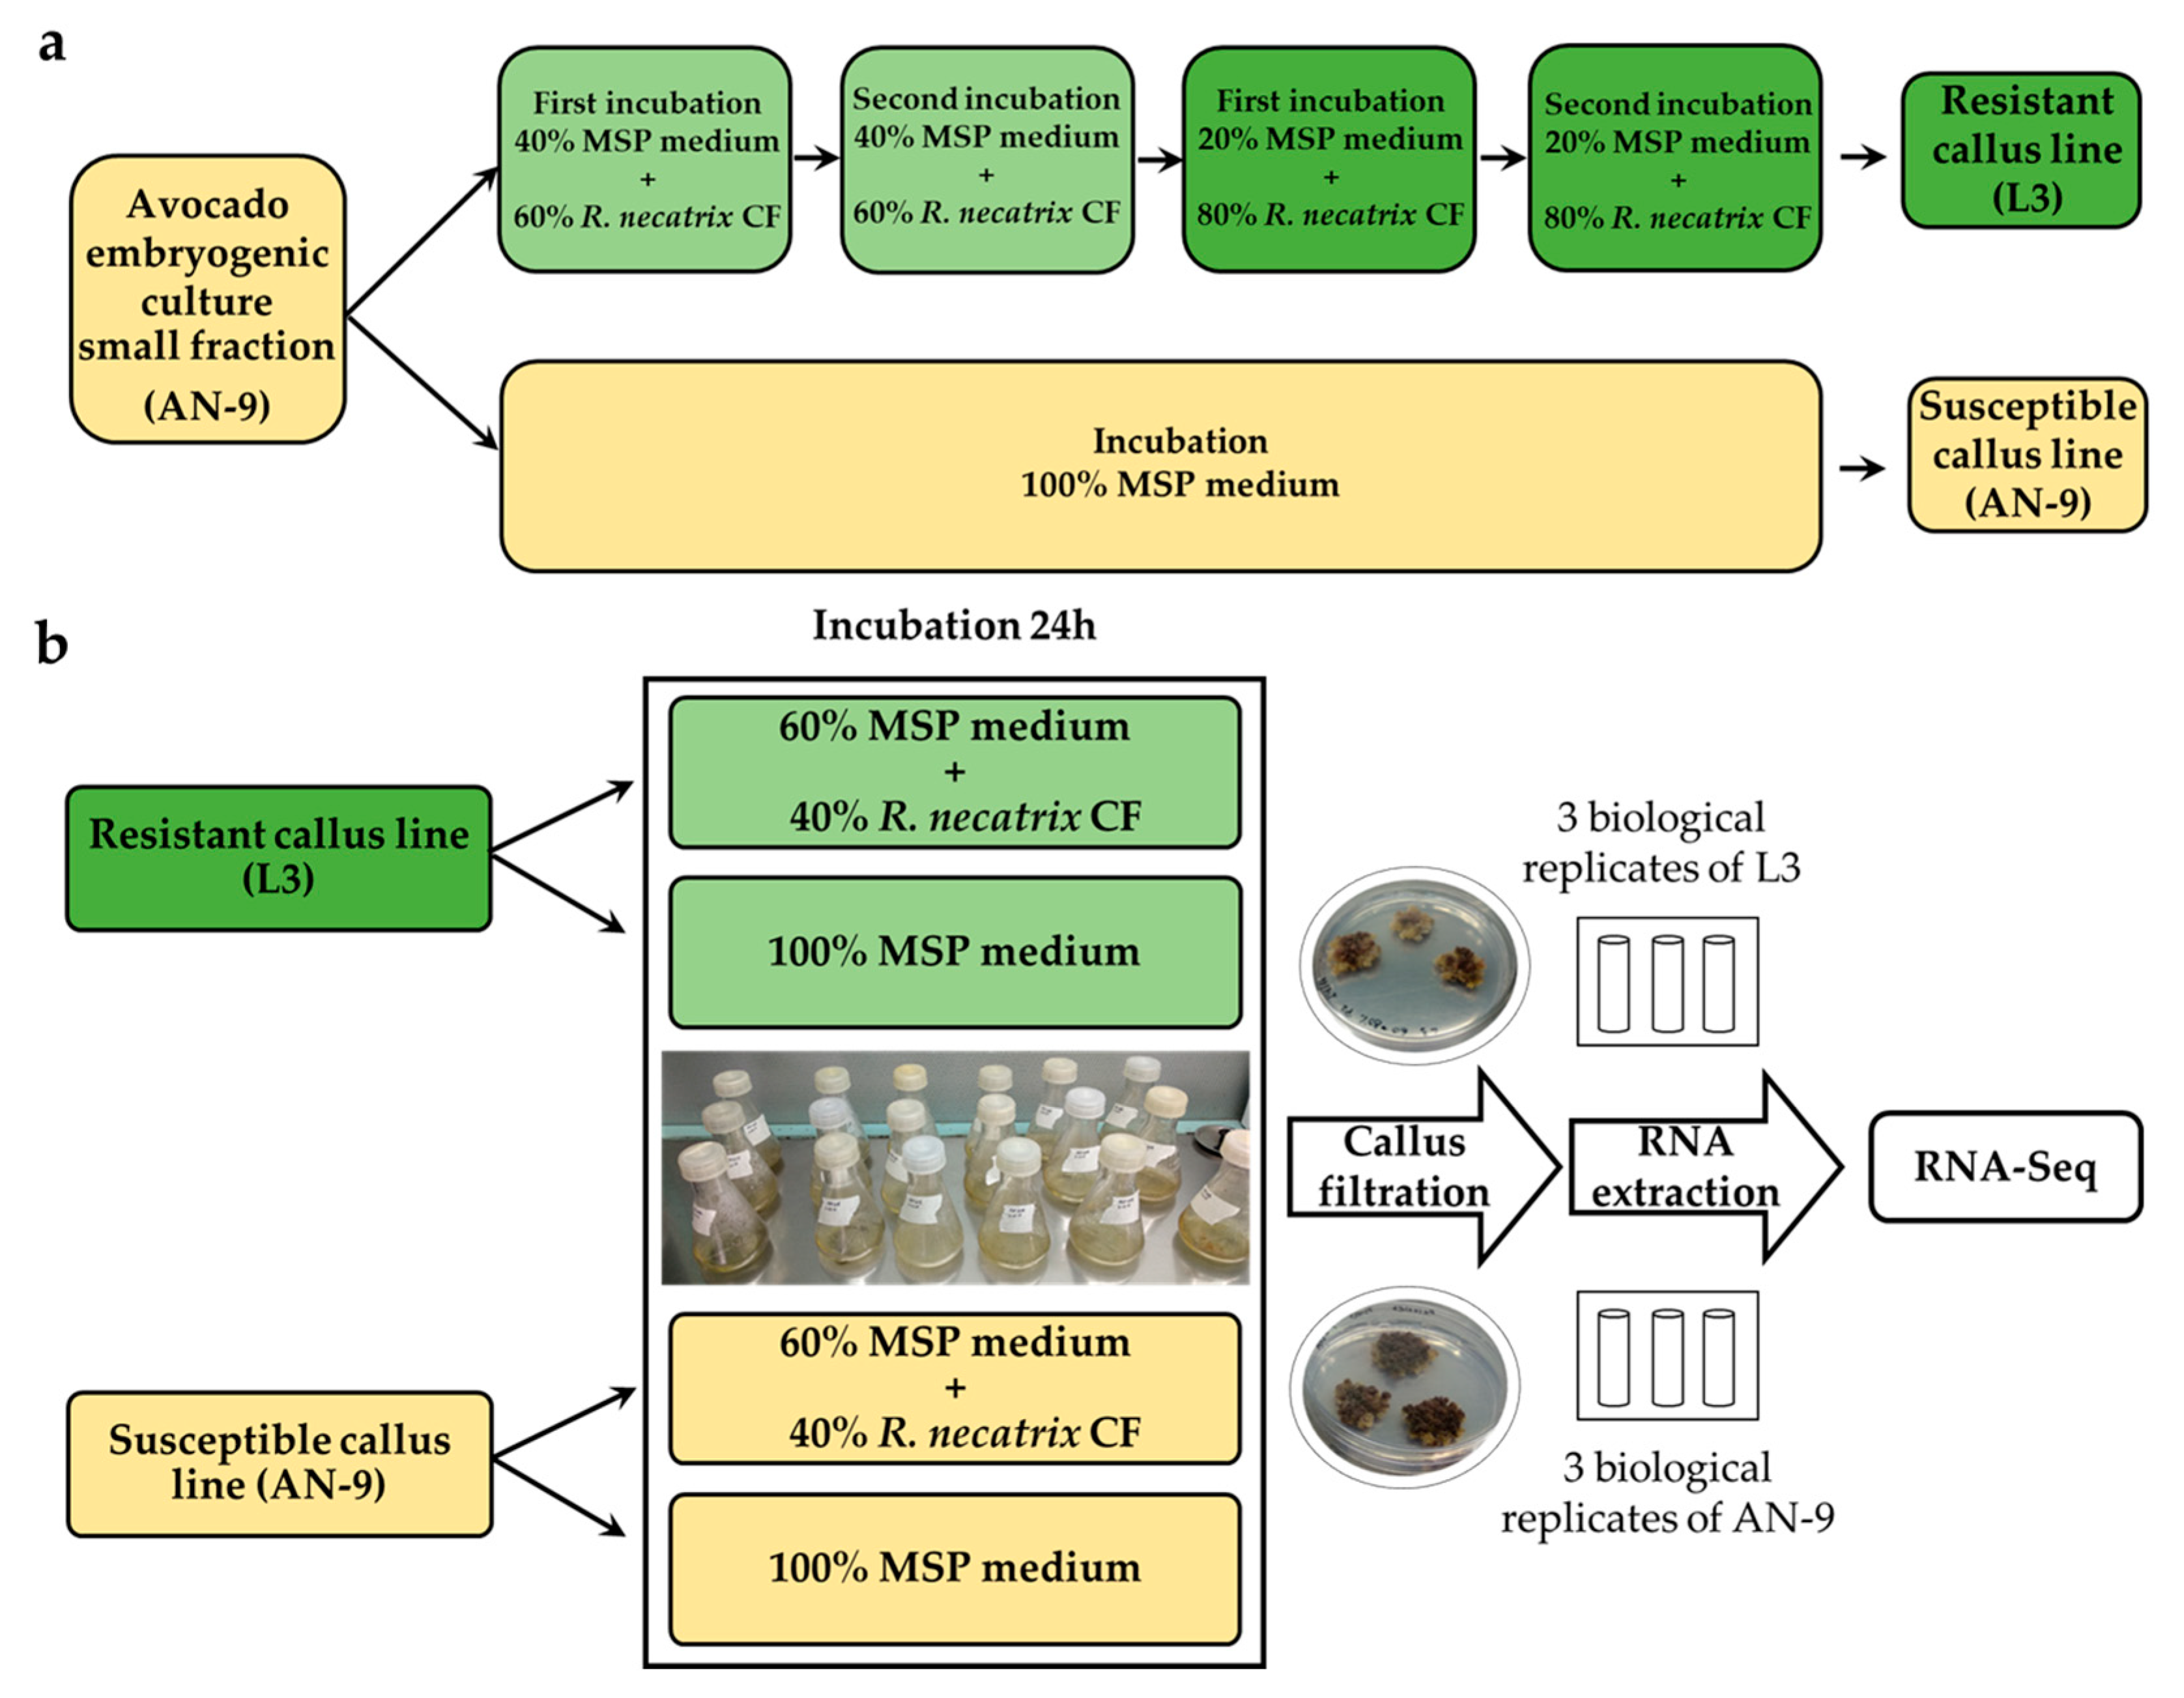
Figure 1. (a) Workflow to obtain a resistant avocado embryogenic line to R. necatrix culture filtrate (CF). The line was considered resistant after being exposed twice to Murashige and Skoog medium with 0.1 mg L−1 picloram (MSP) supplemented with 60% (v/v) CF, followed by two exposures to MSP supplemented with 80% (v/v) CF. A small 1–2 mm fraction of embryogenic callus was used throughout the process. (b) Schematic representation of the transcriptome analysis carried out in resistant (L3) and susceptible (AN-9) avocado callus lines after 24 h of growth in MSP medium and MSP medium containing 40% of R. necatrix CF.
Agronomy 13 01354 g001
Figure 2. Callus exposed to 60% (v/v) R. necatrix culture filtrate for 1 week followed by culture on solid MSP (Murashige and Skoog supplemented with Picloram medium) for 1 month (a) and 2 months (b). Bar 1 cm.
Agronomy 13 01354 g002
Figure 3. Venn diagram of differentially expressed genes (DEGs) during resistant and susceptible callus growth on medium supplemented, or not, with R. necatrix culture filtrate (CF). DEGs obtained in the transcriptome analysis of a resistant callus line exposed and not exposed to fungal CF (TCLF and TCL, respectively) in comparison with a susceptible callus line (AN-9) exposed and non-exposed to CF (SCLF and SCL, respectively). Unique DEGs are shown in only one of the ovals, while shared DEGs are illustrated where the ovals overlap. Arrows show up- and down-regulated DEGs.
Agronomy 13 01354 g003
Figure 4. Hierarchical clustering (HCL) of differentially expressed genes (DEGs) obtained in the transcriptome analysis of resistant callus line exposed and not exposed to fungal culture filtrate (TCLF and TCL, respectively) and susceptible callus line (AN-9) exposed and not exposed to fungal culture filtrate (SCLF and SCL, respectively). Blue and red indicate up- and down-regulation, respectively.
Agronomy 13 01354 g004
Figure 5. Gene Ontology (GO) enrichment analysis of differentially expressed genes (DEGs). GO enrichment analysis of DEGs in resistant (a) and susceptible (b) callus lines exposed to R. necatrix exudates. Enrichment GO terms were obtained by Blast2GO using a cut-off of 0.05. (MF) molecular function; (BP) biological process.
Agronomy 13 01354 g005
Table 1. qRT-PCR expression data of selected contigs from resistant and susceptible callus lines exposed to R. necatrix exudates. Data are displayed as fold change (FC), calculated by comparing calli exposed to fungal exudates with control, non-exposed calli. The expression data are the mean of three biological replicates. Bold numbers indicate statistically significant differences (t-test, p < 0.05), and letters indicate statistically significant differences between resistant and susceptible callus line (ANOVA, p < 0.05). ND: Not Detected.
Gene IDDescriptionResistant Callus Line (L3)Susceptible Callus Line (AN-9)
RNA-Seq FCqRT-PCR FCRNA-Seq FCqRT-PCR FC
Pag64949 Proteinase inhibitor48.5038.54 ± 2.00 a22.2914.60 ± 1.43 b
Pag115909Tumor related protein6.7911.59 ± 0.40 a5.206.61 ± 0.58 b
MSTRG.18398Pathogenesis-related protein P2ND−1.64 ± 0.19ND−1.99 ± 0.20
Pag191108Lignin-forming anionic peroxidase78.3664.88 ± 3.93 a26.9521.30 ± 5.46 b
Pag291312Heat shock transcription factor 3019.7525.15 ± 5.55 b86.4662.00 ± 11.23 a
Pag275152Translocon-associated protein subunit beta−2.88−1.76 ± 0.11−4.79−2.52 ± 0.38
Table 2. Differentially expressed genes (DEGs) from a resistant callus line exposed and not exposed to fungal culture filtrate (TCLF and TCL, respectively) and a susceptible callus line (AN-9) exposed and non-exposed to R. necatrix culture filtrate (SCLF and SCL, respectively). (FC, fold change; ND, Not Detected). PR (pathogenesis related) MYB (myeloblastosis-related proteins), WRKY (WRKYGQK), MYC (Myelocytomatosis), NAC (NAM, ATAF and CUC), ERF (Ethylene-responsive transcription factor).
Gene IDDescription (Blast NCBI)TCLFvsTCL FCSCLFvsSCL FC
Cell wall
Pag55749Cinnamoyl-CoA reductase 194.2379.56
Pag191108Lignin-forming anionic peroxidase78.3626.95
Pag66455Glucan 1,3-beta-glucosidase A-like protein43.2329.77
Pag116557Endonuclease-8-like protein45.048.59
Pag44234Basic endochitinase-like-protein2.33ND
Detoxification and disease-resistance proteins
Pag255058Disease resistance protein RPM1-like18.05ND
Pag319424Pleiotropic drug resistance protein 3-like protein isoform X110.085.72
Pag279361Detoxification 49 protein7.654.96
Pag352089Putative disease resistance protein4.76ND
Pag297678Pleiotropic drug resistance protein 2-like protein 2.06ND
Pathogenesis-related proteins
Pag289080Pathogenesis-related protein PR-4-like protein18.6515.79
Pag154162Thaumatin-like protein9.446.37
Pag168264Pathogenesis-related protein STH-217.974.64
Pag154170Thaumatin-like protein 17.675.11
Pag103568Pathogenesis-related genes transcriptional activator PTI5-like2.31ND
Protease and protease inhibitor activity
Pag64949Proteinase inhibitor48.5022.29
Pag341255Subtilisin-like protein protease41.137.70
Pag231368Cysteine proteinase RD21A-like protein7.664.94
Pag26660Serine carboxypeptidase-like protein6.11ND
Pag136044Subtilisin-like protein protease SBT5.35.72ND
Pag214427Subtilisin-like protease SBT5.62.60ND
Pag297773Serine carboxypeptidase 242.00ND
Transcription factor MYB, WRKY, MYC and NAC
Pag51890Transcription factor MYB1R1-like protein isoform X227.15ND
Pag121997RWR3 transcription factor MYB108-like protein 119.25ND
Pag345989Putative WRKY transcription factor 7517.156.68
Pag306446WRKY6412.485.64
Pag307121Putative WRKY transcription factor 72 Isoform X17.434.58
Pag28154WRKY transcription factor 553.22ND
Pag223376NAC domain-containing protein 96-like protein3.22ND
Pag389501SANT/Myb domain-containing protein2.64ND
Pag46518WRKY672.56ND
Pag240398MYB108-like protein2.56ND
Pag190993MYB family transcription factor APL2.46ND
Pag201669NAC domain-containing protein2.32ND
Pag276502SANT/Myb domain-containing protein2.31ND
Pag262640NAC domain-containing protein2.16ND
Pag296108Transcription factor MYC2-like protein2.01ND
Hormonal regulation
Pag26291Ethylene-responsive transcription factor (ERF) 02060.9245.99
Pag169786Abscisic acid-insensitive 5-like protein 637.65ND
Pag204839Ethylene-responsive transcription factor ERF109-like protein35.06ND
Pag204844AP2/ERF domain-containing protein33.3223.44
Pag174105Abscisic acid 8’hydroxylase 222.6211.51
Pag212858Gibberellin 20 oxidase12.743.58
Pag120094Auxin-responsive protein SAUR71-like protein8.023.97
Pag197469Ethylene-responsive transcription factor 1B-like protein7.052.18
Pag157588Auxin-induced protein 5.51ND
Pag70205Auxin transporte-like protein 54.22ND
Pag101088AP2/ERF domain-containing protein3.03ND
Pag75125Ethylene-responsive transcription factor RAP2-11 like protein2.80ND
Pag46880Gibberellic acid methyltransferase 2 isoform X22.54ND
Pag227350Auxin-responsive protein SAUR71 2.26ND
Pag75115Ethylene-responsive transcription factor 1A2.09ND
Pag362340Auxin-induced protein AUX222.04ND
Redox homeostasis
Pag378827Cytochrome P450 704B135.038.60
Pag254946Peroxidase 6834.50ND
Pag236665Beta-amyrin 28-oxidase-like protein27.32ND
Pag268581Protein DMR6-Like oxygenase 2-like protein26.8916.06
Pag364610Protein DMR6-Like oxygenase 2-like protein25.6118.95
Pag264980Cytochrome P450 71A123.6216.60
Pag323404P450 domain-containing protein17.10ND
Pag260376Cytochrome P450 94C1-like protein16.8314.05
Pag255004Cationic peroxidase 1-like protein14.798.31
Pag88265Cytochrome P450 78a5-Like protein13.079.38
Pag171020Allene oxidase synthase 111.227.42
Pag281952Cytocrome B6-f complex iron-sulfur subunit 2.10.23ND
Pag171015Allene oxidase synthase 19.807.62
Pag34770Protein DMR6-Like oxygenase 28.604.90
Pag339287Plant peroxidase7.21ND
Pag236679Cytochrome P4506.53ND
Pag19781Cytochrome P4505.243.29
Pag357969NADPH-cytochrome P450 reductase-like3.86ND
Pag369777Cytochrome P450 87A32.83ND
Pag377126Cytochrome P450 cyp72A219-like protein2.09ND
Table 3. Top 20 avocado callus contigs overexpressed in a resistant callus line exposed and not exposed to fungal culture filtrate (TCLF and TCL, respectively) and a susceptible callus line (AN-9) exposed and not exposed to the R. necatrix culture filtrate (SCLF and SCL, respectively). The expression data are the mean of three biological replicates (FC, fold change; ND, Not Detected).
Gene IDAnnotationTCLFvsTCL FCGene IDAnnotationSCLFvsSCL FC
Pag246776Hypothetical protein188.08Pag344126Protein P21-like protein644.07
Pag92571Heme peroxidase177.29Pag234412Hypothetical protein CKAN_00293900287.37
Pag162432Photosystem II reaction center W protein145.81Pag242850Nicotianamine synthase260.95
Pag21497Protein chlororespiratory reduction 7140.12Pag92571Heme peroxidase242.25
Pag147146Putative transcription factor bHLH041131.20Pag108159Glyco-hydro 9 domain-containing protein182.57
Pag321196Phosphoribosylformylglycinamidine cyclo-ligase, chloroplastic130.83Pag81308Small heat shock protein 22K166.87
Pag275645Vacuolar amino acid transporter protein118.48Pag102350Sugar/inositol transport protein155.56
Pag308947Protein P21-like113.78Pag44452ABC transporter G family member153.64
Pag127237Hypothetical protein CKAN_02343900111.18Pag246776Hypothetical protein143.79
Pag55749Cinnamoyl-CoA reductase94.23Pag102899F-box protein FBW2135.27
Pag369420Omega-hydroxypalmitate O-feruloyl transferase88.77Pag308947Protein P21-like 117.13
Pag102899F-box protein FBW287.72Pag275645Vacuolar amino acid transporter protein112.13
Pag380545Monocopper oxidase-like protein SKU582.92Pag12929717.3 kDa class II heat shock protein103.24
Pag147154Putative transcription factor bHLH04179.00Pag21497Protein chlororespiratory reduction 7102.12
Pag191108Lignin-forming anionic peroxidase78.36Pag104432Transcription initiation factor IIF subunit alpha100.13
Pag112733Cysteine-rich receptor-like protein kinase 276.61Pag147146Putative transcription factor bHLH04190.97
Pag385754TOX high mobility group box family member 4-A, Putative isoform74.68Pag288015Alpha carbonic anhydrase 1. chloroplastic88.85
Pag226385Ethylene-responsive transcription factor ERF09663.20Pag365527Heat shock factor protein HSF3088.83
Pag26291Ethylene-responsive transcription factor ERF02060.92Pag4786422.0 kDa class IV heat shock protein87.44
Pag48634Lysine histidine transporter-like 560.09Pag291312Heat shock factor protein HSF3086.46
Disclaimer/Publisher’s Note: The statements, opinions and data contained in all publications are solely those of the individual author(s) and contributor(s) and not of MDPI and/or the editor(s). MDPI and/or the editor(s) disclaim responsibility for any injury to people or property resulting from any ideas, methods, instructions or products referred to in the content.