Article

Economic Impact of the Persea Mite in Spanish Avocado Crops

by
Eduardo Torres
1,
Carlos Álvarez-Acosta
1,
Modesto del Pino
2,
María Eva Wong
2,
Juan Ramón Boyero
2,
Estrella Hernández-Suárez
1,* and
José Miguel Vela
2
1
Department of Plant Protection, Canarian Institute of Agricultural Research (ICIA), Ctra. El Boquerón s/n, 38270 La Laguna, Spain
2
Laboratory of Agricultural Entomology, Andalusian Institute for Research and Training in Agriculture, Fishery, Food and Ecological Production (IFAPA), Cortijo de la Cruz s/n, 29140 Málaga, Spain
*
Author to whom correspondence should be addressed.
Agronomy 2023, 13(3), 668; https://doi.org/10.3390/agronomy13030668
Submission received: 18 January 2023 / Revised: 21 February 2023 / Accepted: 21 February 2023 / Published: 24 February 2023
(This article belongs to the Special Issue Sustainability of Tropical Crops in a Changing Environment)

Abstract

:
The Persea mite, Oligonychus perseae Tuttle, Baker & Abbatiello (Acari: Tetranychidae), is an economically important foliar pest of avocados in Spain. The effects of this mite on the foliar damage, production losses and economic impact were assessed in two avocado, cv. Hass, orchards located in the main growing areas of Spain (Northern Tenerife and Málaga) for 3 and 5 consecutive years, respectively. The economic injury level (EIL) for the optimization of the use of acaricides to control this mite was also established, considering three spraying strategies: (i) mite-free treatment (<50 mites per leaf), (ii) conventional treatment (50–150 mites per leaf), and (iii) control treatment (the absence of spraying). Persea mite populations were sampled fortnightly and foliar damage was estimated. At the end of each season, fruits were harvested, weighed and production losses were quantified. The cumulate mite-days (CMDs) had a significant effect on the percentage of leaf area damaged (PLAD) and yield reduction. High numbers of the Persea mite caused extensive damage to leaves, so a loss in tree yield was evident. However, for the middle population level, there was no evidence of yield losses. The quantitative EIL was estimated at a PLAD of 17%, equivalent to a CMDs of 178 mites per leaf, which is the amount of damage that should not be exceeded. In Northern Tenerife, with a mild climate, the Persea mite can reach significant populations that are maintained throughout the months. In avocado orchards in Málaga, the summer is hotter and drier, so the presence of the mite exists for a shorter duration in the seasons, with less damage to the leaves. In Tenerife, yield loss can be compensated by chemical treatments that permit pest control.

1. Introduction

Avocado (Persea americana Mill.) is an important evergreen tropical fruit tree native to Mexico and Central America that belongs to the Lauraceae family [1]. It is grown commercially in several tropical and subtropical regions, with a global production of more than 8 million tons in 2020 [2]. The Americas, including the Caribbean, is the dominant producing region, at about 72.2% of total production, followed by Africa (13.3%), Asia (11.7%), Oceania (1.4%), and Europe (1.4%). Mexico is the major avocado-producing country, with nearly 2.4 million tons in 2020 [2]. The avocado cultivation area worldwide has been significantly extended in the last decades due to increased consumer demand, especially in North America and Europe, because of Avocado’s nutritional benefits [3].
Spain is the largest producer of avocado in Europe and the seventeenth largest in the world, with a production area covering more than 15,850 ha, a total production of about 99,125 tons and a production value of approximately EUR 220.5 million in 2020 [4]. Most of the Spanish avocado production is in Andalusia (84.2%) and the Canary Islands (12.2%), with ‘Hass’ being the most extended cultivar, as it occupies 90% of the cultivated avocado area [4]. Most of the production is exported to other European Union countries such as France (38.6%), The Netherlands (14.6%), and Germany (11%) [5].
Avocado trees in Spain were free from important pests until the discovery of the Persea mite, Oligonychus perseae Tuttle, Baker & Abattiello (Acari: Tetranychidae) in the avocado production areas of Andalusia (provinces of Málaga and Granada) in 2004 [6,7], and subsequently in the Canary Islands in 2006 [8,9]. Since its arrival, this exotic pest has rapidly spread to all Spanish avocado-growing regions, becoming the most damaging foliar pest of the susceptible cultivar ‘Hass’ [8,10]. The Persea mite is an important pest of avocados native to Mesoamerica [11], from where it has spread and established in other avocado-growing areas worldwide, probably through the trade of plant material [12]. This pest has been reported to cause significant damage to avocados in Mexico [13], the USA (California, Florida, Hawaii) [13,14], Costa Rica [15,16], Israel [17], mainland Spain [7,10], Portugal (mainland and Madeira) [18], the Canary Islands [8,9], Italy [19], and Morocco [20]. In addition to avocado, O. perseae is an oligophagous species that can develop on a wide range of fruit species, ornamentals, and weeds [21].
Motile stages of the Persea mite feed and establish colonies on the underside of avocado leaves, building dense silken nests, mainly along the midrib and main nerves, where they develop and reproduce [13,22]. Among other functions, nests protect mites against attack from some species of natural enemies and against adverse environmental conditions [23]. Feeding damage produces characteristic circular brown necrotic spots (of about 1–5 mm2) that can extend to up to 90% of the leaf area, affecting the photosynthesis and transpiration efficiency of the tree and, consequently, the fruit yield [13]. In some growing regions such as California or the Canary Islands, high mite populations (>100–500 mites per leaf) and subsequent feeding can cause partial or total tree defoliation [8,9,13,24], which opens the canopy, increasing the risk of sunburn to young fruit, premature fruit drop, and yield losses [24,25]. Chemical control has been shown to be the only tool available to Spanish growers to prevent high mite populations and the risk of tree defoliation [7,8,9,10], sulphur being the most common active ingredient used in the Canary Islands [8,9]. However, in Andalusia, this damages is less dramatic, and there is generally no such evidence of tree defoliation with high mite populations [7,10].
Since the appearance of O. perseae in Spain, several strategies have been developed according to the principles of Integrated Pest Management (IPM) [8,9,10] established in the current European Union regulations for the sustainable use of pesticides (European Directive, 2009/128/EEC). These principles include the establishment of threshold values [i.e., economic injury level (EIL) and economic threshold (ET)] [26] as the basis for pest control decision-making. EIL has been defined as the lowest pest density at which the cost of reducing the pest population equals the economic loss prevented by implementing control measures [27,28]. ET, which is a direct function of the EIL, is the pest population at which control measures should be applied to prevent an increasing pest population from reaching EIL [29]. Effective decision-making in IPM also relies on understanding the relationships between pest numbers, plant responses to injury, and the resultant economic losses [30]. There are very few studies dealing with the relationship between leaf damage produced by herbivores and fruit yield reduction, though negative relationships between Tetranychus urticae Koch (Acari: Tetranychidae) density and yield and fruit damage was shown in citrus [31]. With respect to O. perseae, an ET of 50–100 motile O. perseae per leaf in Hass avocados is used for timing management decisions in Israel [32]. In California, an ET of 50 mites per leaf throughout the period of the growing season (i.e., April–September in California) is the amount mentioned by Lara and Hoddle [33] to be monitored for potential control. However, accurate estimates of pest-induced losses on avocado crops in Spain are not available. Determining the production losses and economic impact caused by O. perseae in the Spanish avocado crops is necessary for pest control decision making.
The objective of the present study was to determine the incidence of O. perseae on avocado tree development as well as to estimate the damage, production losses and economic impact of this pest in the main avocado-producing areas of Spain.

2. Materials and Methods

2.1. Study Site and Experimental Design

The experiment was conducted in two avocado orchards located in the two main growing areas of Spain. The first one was in Tenerife, Canary Islands (Coord x: 352433.32; Coord y: 3142194.07) on 3.5-year-old West Indian rootstock grafted with “Hass”. The second orchard was in Málaga, Andalusia (Coord x: 339644.0146; Coord y: 4053847.47) on 5-year-old clonal “Duke 7” rootstock grafted with “Hass”. Mite sampling was conducted between the years 2011–2013 in the first orchard (Tenerife), and between the years 2011–2015 in the second orchard (Málaga). Both avocado orchards were drip irrigated. Trees were maintained following the cultural practices routinely employed in these avocado cultivation areas.
In Tenerife, the experimental design consisted of a plot with 12 rows, each with 17 avocado trees. Three treatments were applied in the plot, one to each grouping of four rows: (i) Mite-free treatment: this consisted in spraying the trees to down the pest population below a level of 50 mites per leaf (Table 1); (ii) Conventional treatment: the trees were sprayed to get between 50–150 mites per leaf (Table 1); and (iii) Control treatment, which involved the absence of spraying and letting the Persea mite populations develop freely. To obtain different levels of mite damage, the trees were sprayed with Sulphur 80% WG (Azufre Flow SC, Cheminova Agro, S.A., Madrid, Spain; 1.0 g/L) when mite levels exceeded the designated levels, in agreement to the different treatments and the published pest management guidelines [26]. In each grouping of four rows, only the two central ones were sampled for each treatment.
In Málaga, the experimental design consisted of a plot of six rows, each with 17 avocado trees. Two treatments were applied in the plot, one to each grouping of three rows, where only the middle row was sampled: (i) Mite-free treatment; and (ii) Control treatment, both as described above. To obtain different levels of mite damage, the mite-free treatment was sprayed with Abamectin 1.8% EC (Vertimec, Syngenta España S.A., Madrid, Spain; 1.2 l/ha), Fenpyroximate 6.24% + Hexythiazox 3.12% SC (Mitacid Plus, Sipcam Iberia, Valencia, Spain; 1.2 l/ha) or Tebufenpyrad 20% WP (Shirudo, Certis Belchim B.V., Utrecht, The Netherlands; 0.5 kg/ha).
In both orchards, spraying was carried out using a skid-mounted sprayer at the mean rate of 3.5 L per tree to ensure complete coverage of all parts of the tree. No treatments were applied against other arthropod pests during the sampling period. The number of treatments applied was different from one year to another in each orchard, because the population dynamics were influenced by climate (Table 1). Of each row of 17 trees, the trees at the end were not sampled due to the border effect.

2.2. Sampling Method for Oligonychus perseae Populations

In both orchards, pest mite populations were monitored fortnightly, taking a random sample of six leaves from the outer canopy of the tree, from waist to eye level, around the tree (15 replicates × 6 leaves = 90 leaves per treatment). Pest mites were counted in the laboratory under a stereoscopic microscope using the fast field counting method developed by Machlitt [34]. All motile stages adjacent to the distal side of the second vein to the left of the midrib (UML2) were counted. More recently, Lara et al. [35] proposed an exponential equation to predict the mite population in the leaves. As that equation was optimized for California’s conditions, we sampled 101 leaves of 20 trees in 2017 from the same experimental field in Tenerife and 394 leaves in Málaga. All motile stages were counted, in addition to those along vein UML2. According to the exponential equation proposed by Lara et al. [35], we adjusted the parameters α and β for our conditions, and the resultant equations for Tenerife (1) and Málaga (2) were:
y = exp [3.985 + 0.409 ln (xi + 0.31)],
y = exp [3.001 + 0.750 ln (xi + 0.31)],
where y is the expected mean of total O. perseae counts on a leaf given the presence of random effects and xi is the partial count of O. perseae along vein UML2. In Tenerife, the mean counted mites were 112.92 ± 69.49 (Mean ± SD), whereas the mean predicted mites were 111.86 ± 41.72. A Pearson’s r data analysis revealed a significant (p < 0.001) moderate positive correlation, r = 0.56. In Málaga, the mean counted mites were 26.19 ± 48.51, whereas the mean predicted mites was 26.17 ± 35.43. A Pearson’s r data analysis revealed a significant (p < 0.001) strong positive correlation, r = 0.73. Mite-days (of all motile stages) for two consecutive counts were calculated by multiplying the mean number of mites in two sampling dates by the number of days between counts [36]. Summing these mites’ days over a season gave the cumulative mite-days (CMDs).

2.3. Estimating Foliar Damage

To assess foliar damage, 90 leaves were sampled at harvest from each treatment. The samples were taken at the beginning of the trial (2011) and after the harvest (2012, 2013 and 2014). All leaves were scanned using a flatbed colour scanner (HP Scanjet 7400c; resolution 150 dpi) and saved as TIFF format files. Image analysis software (WinFOLIATM 2014, Régent Instruments Inc., Quebec, Canada) was used to quantify total and damaged leaf areas. With the total area and the damaged area of each leaf, the percentage of leaf area damaged (PLAD) was calculated.
To calculate the prediction of CMDs on PLAD, the Nash-Sutcliffe Efficiency (NSE) index was used, which ranges from 1 (perfect model), 0 (a performance no better than simply using the mean) to negative values (a worse performance) [36,37].

2.4. Estimation of Economic Losses Caused by O. perseae

Direct economic losses were estimated by sampling the fruits of each plant of the different treatments. The number of fruits per plant was counted, and the total yield per plant was obtained. In the Tenerife orchard, a hundred fruits were randomly taken from each treatment to determine the polar and equatorial diameter, the average weight of the fruit, and the fruit gauge. In the Málaga orchard, 30 fruits per tree were measured and weighed.

2.5. Estimated Costs of Control

The costs derived from O. perseae control on avocado were estimated following the established methodology [38,39]. To calculate the acaricide cost, the prices of the phytosanitary products were obtained from local distributors. The application rates and the frequency of treatments were those recommended by the manufacturer on avocado cultivation. As the implementation costs are variable, we calculated the total cost as a function of the price of the acaricide, the dose applied, the volume of each treatment, and the labour costs (€/h and €/ha) (Table 2).

2.6. Statistical Analysis

Data were summarized as mean ± SE. The normality and homoscedastic hypotheses were tested and considered significant when p < 0.05. Data were analyzed with SPSS 20 (SPSS, Chicago, IL, USA) using a two-way repeated measures ANOVA to compare treatments and years for CMDs, and a two-way ANOVA for the rest of the measured variables, i.e., leaf damage, fruits per tree, and yield. Means separation (of years, treatments, or treatment × years) was performed by Tukey’s HSD multiple range test (p < 0.05) when data followed a normal distribution and were homoscedastic, and a Dunnett’s test (p < 0.05) when data was normal but not homoscedastic. When normality was not fulfilled, even with transformations of the parameters, the Kruskal-Wallis test was used. Linear regression was used to evaluate the effect of CMDs on foliar damage using the average of each tree for three years and to compare foliar damage with the maximum estimation of motile O. perseae per leaf.

3. Results

3.1. Oligonychus perseae Populations

The population of O. perseae (measured as CMDs) throughout the years 2011, 2012 and 2013 was significantly higher (F = 33.59; p > 0.0001) in Tenerife (11308.5 ± 505.13) compared to Málaga (6935 ± 451.53). Consequently, the leaf damage was also significantly higher in Tenerife (18.50 ± 0.73%) than in Málaga (8.14 ± 0.29%; F = 119.48; p < 0.0001). However, a significant treatment × year interaction was revealed (Table 3).
In Tenerife, CMDs and leaf damage in the years 2011 and 2013 were higher in the control (no treatment) compared to the conventional, and in the conventional they were higher than in the mite-free. In 2012 the highest CMDs and leaf area were for the conventional treatment compared to control, and were higher under the control than under the mite-free treatment (Table 4).
The number of fruits per tree and yield showed a similar pattern in the three years of study. In 2011 there were no significant differences between the treatments. However, in 2012 and 2013, trees with mite-free treatment showed a higher number of fruits and yield than the other treatments, but not different compared with the conventional one (Table 4). According to the Kruskal-Wallis test, there was no difference in flowering between trees in the different treatments, and therefore the difference in yield was not caused by the number of flowers produced by the trees of different treatments. The CMDs in the control treatment were higher in 2011 (1211.74 mite-days) than in the following years, decreasing by ca. 15% in 2012 (1034.38 mite-days) and 33% in 2013 (810.88 mite-days). In contrast, the CMDs in conventional treatment were highest in the year 2012 (1299.8 mite-days) compared to the other treatments. The CMDs in the mite-free treatment were always lower than in the other treatments.
In Málaga, CMDs were higher in the control than in the mite-free treatment. In spite of that, the differences were not significant in the years 2012 and 2015 (Table 5). The leaf damage was also higher in the control compared to the mite-free treatment in the studied years for this variable, i.e., 2011 and 2012. Interestingly, the number of fruits per tree and the yield were not affected by the different CMDs and leaf damage between the treatments (Table 5).
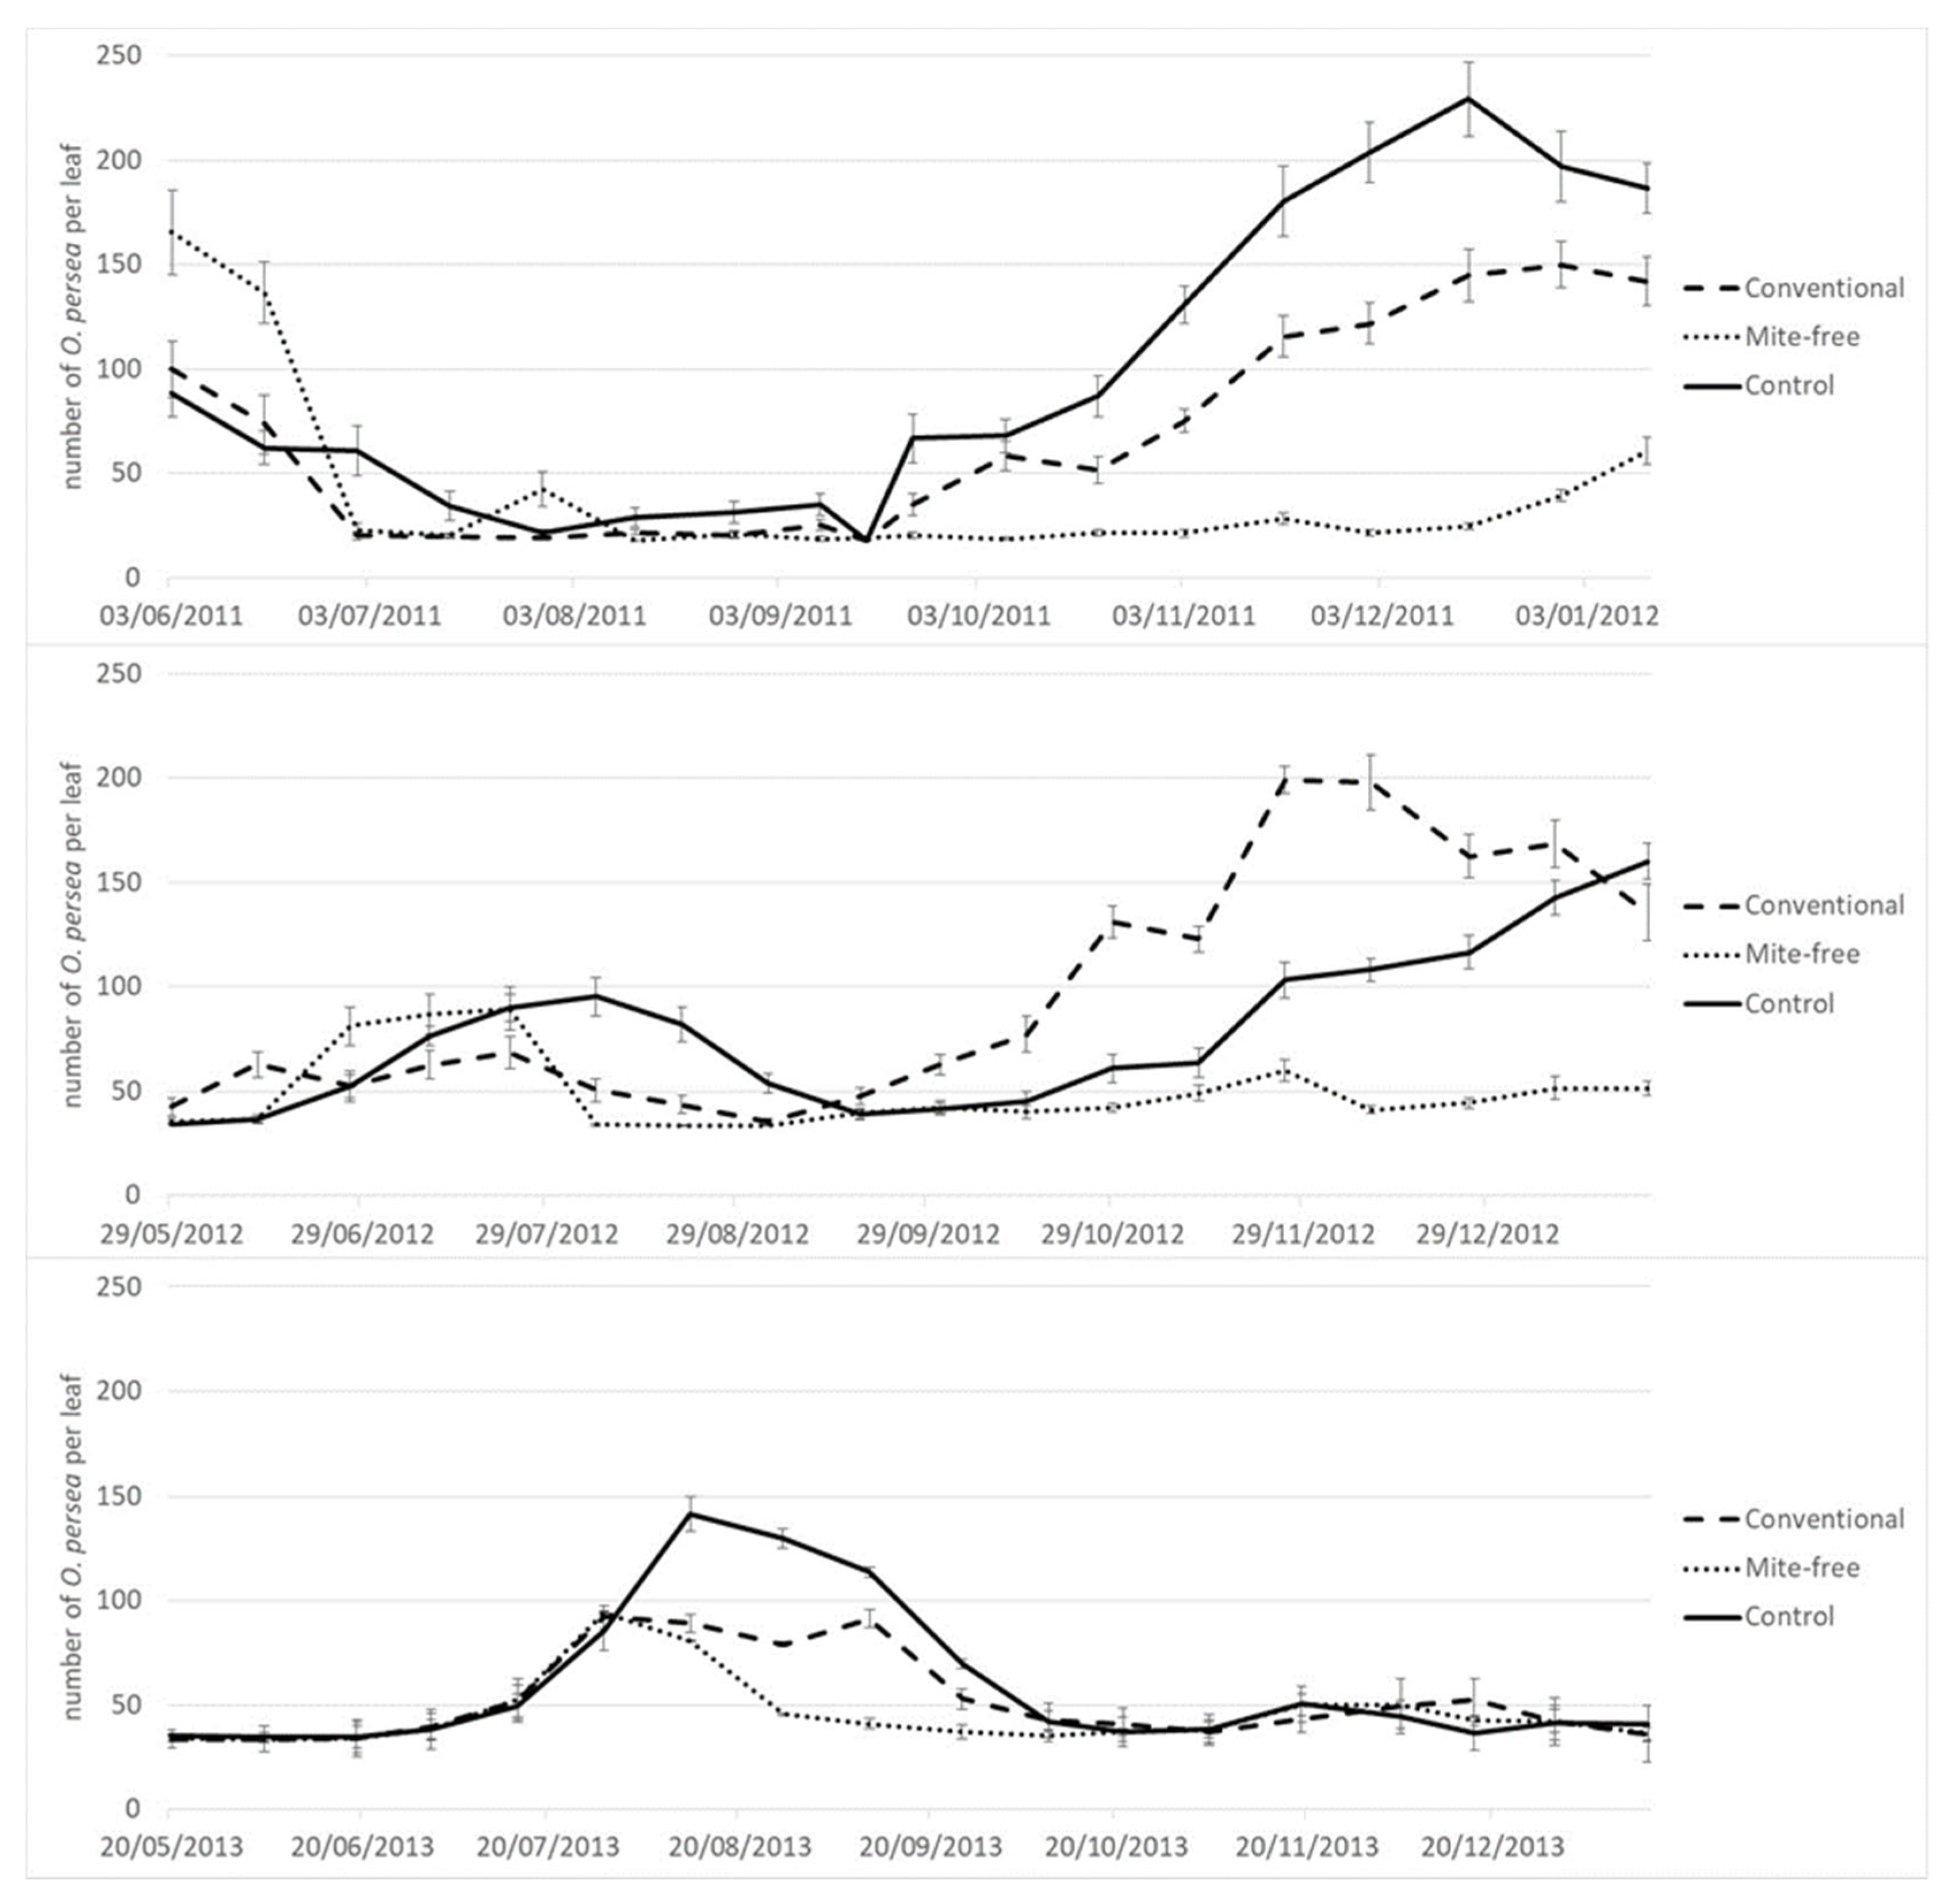
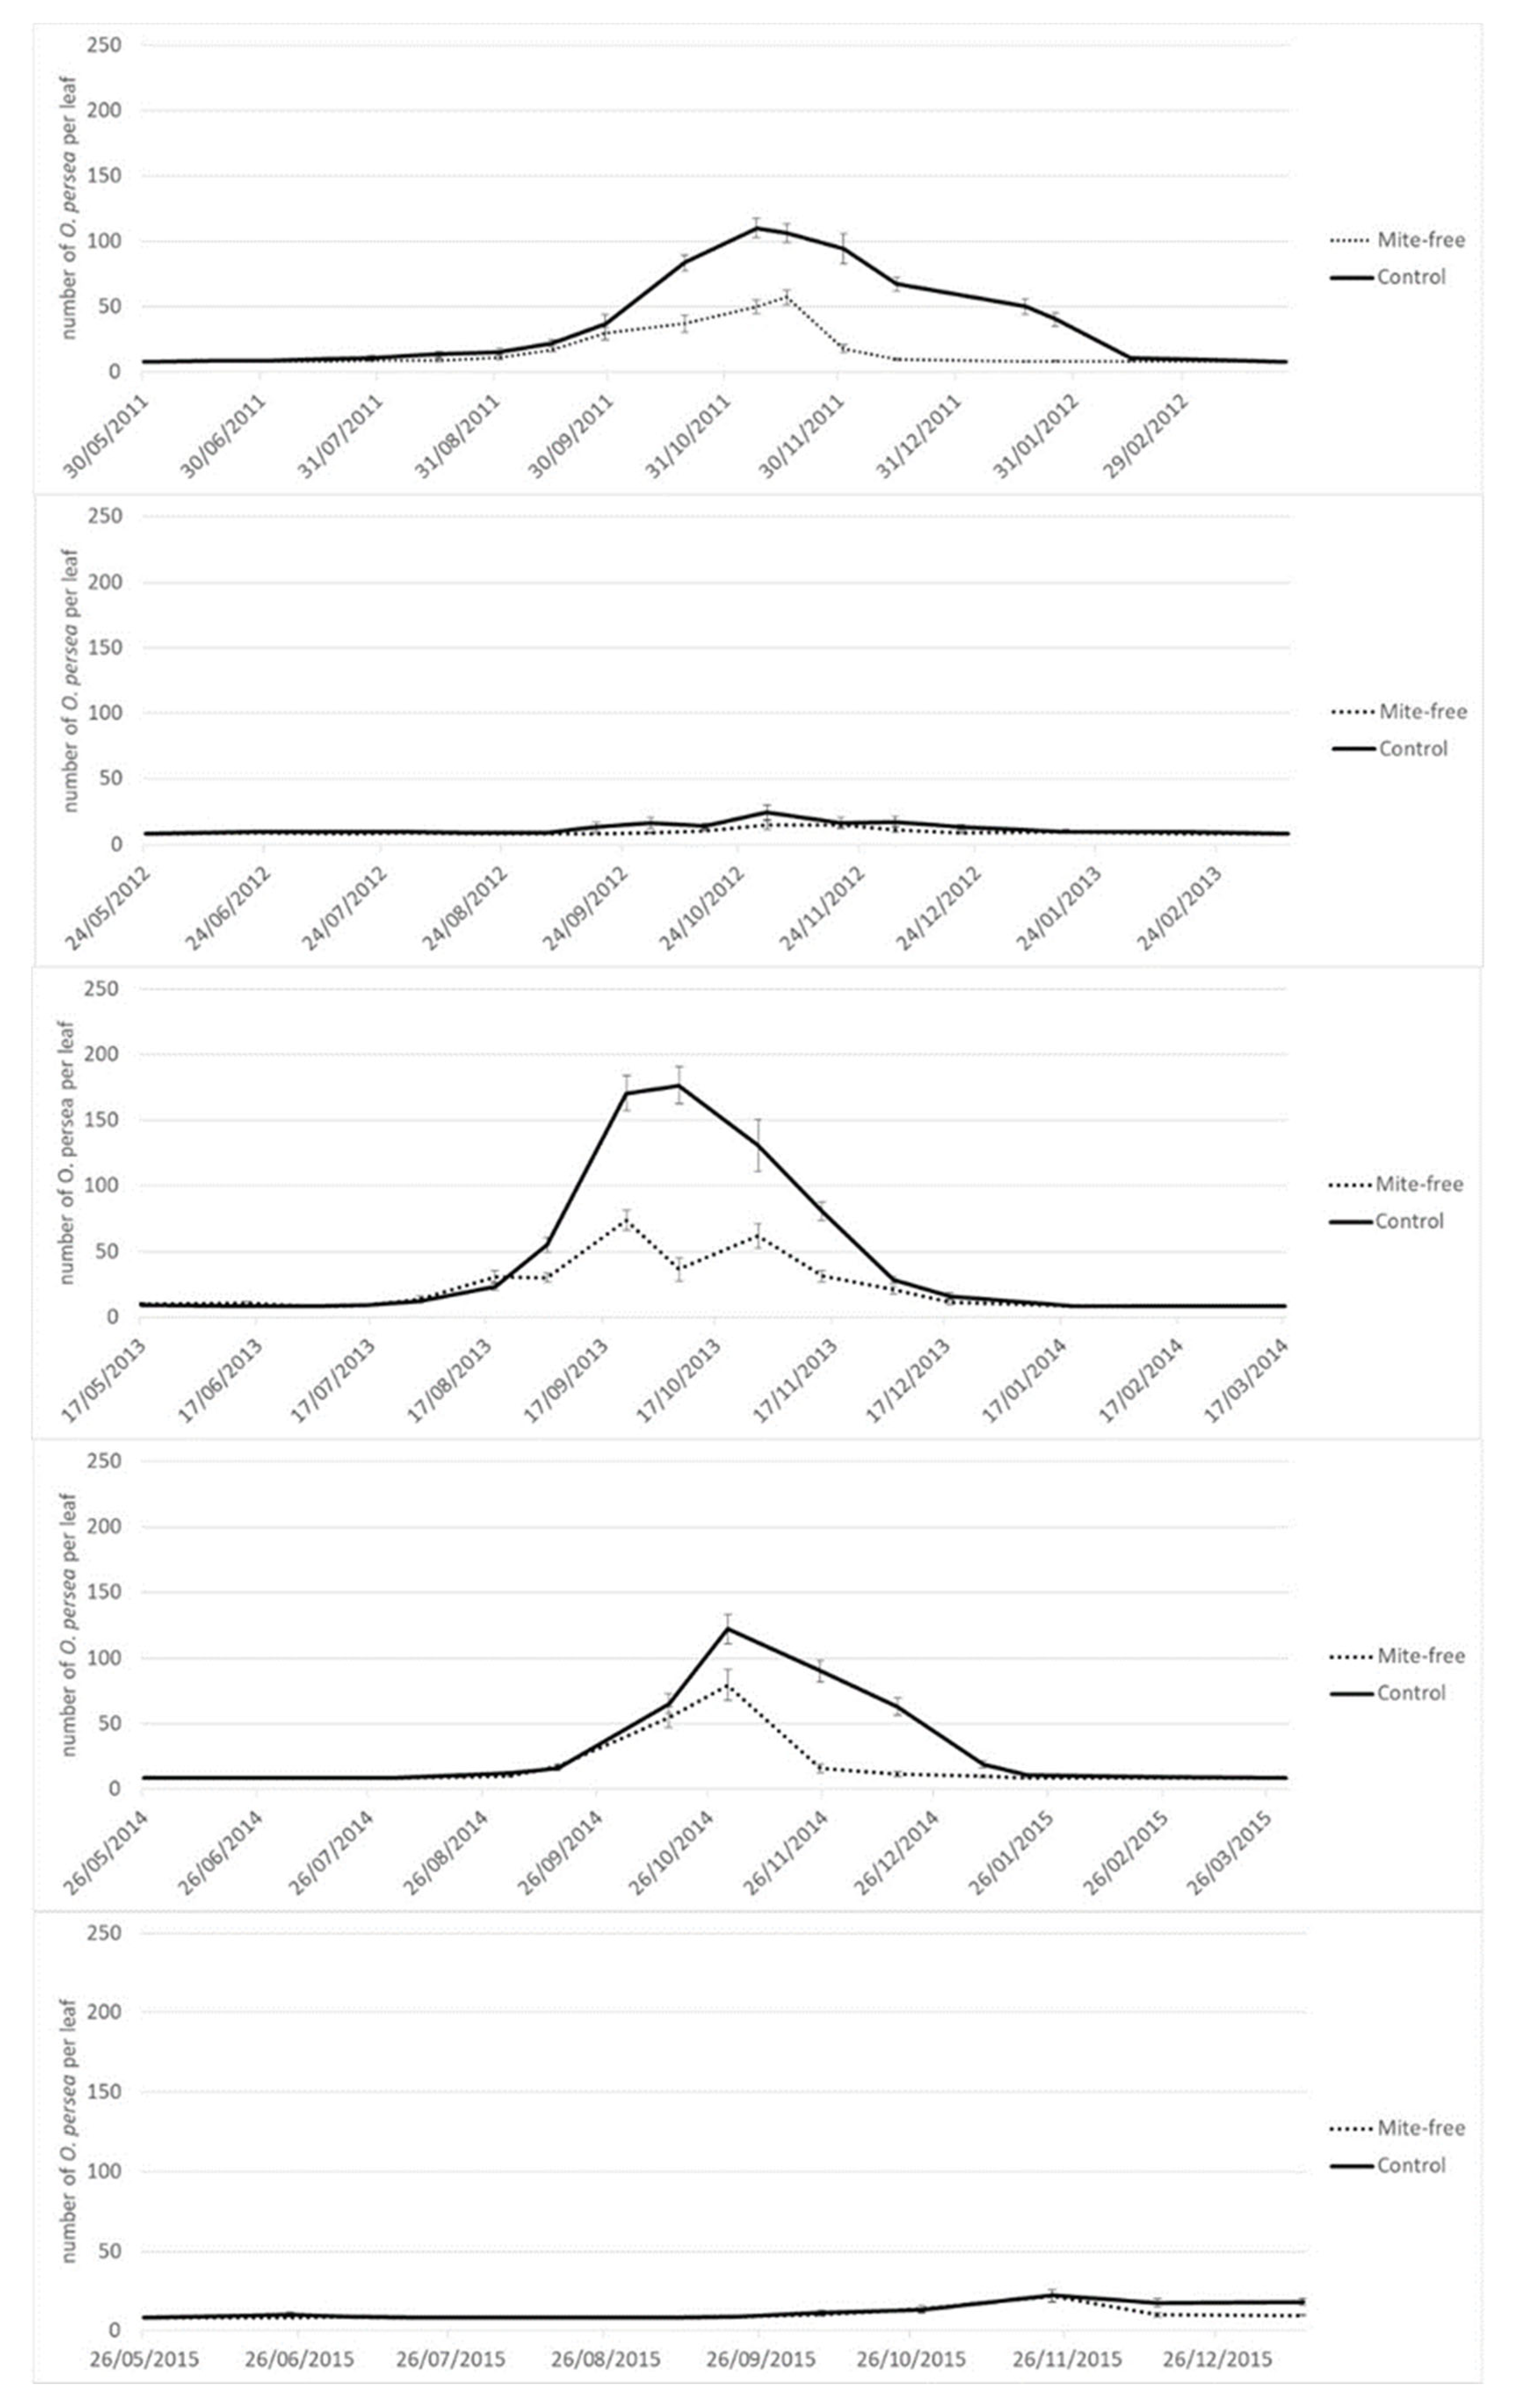
The peaks of infestation differed between years in Tenerife. In 2011 there were two peaks, a smaller infestation peak at the beginning of the trial in June, and a higher one in late December. In 2012 the higher peak was also in December, but the lower one shifted to early August, whereas in 2013 there was only one peak of infestation in August (Figure 1). Contrary to this, the timing of infestation did not vary throughout the years in Málaga (Figure 2). The peak of mite infestation started in mid-October to early November (autumn peak) in the years 2011, 2013 and 2014. A very low population was detected in the years 2012 and 2015.

3.2. Estimating Foliar Damage

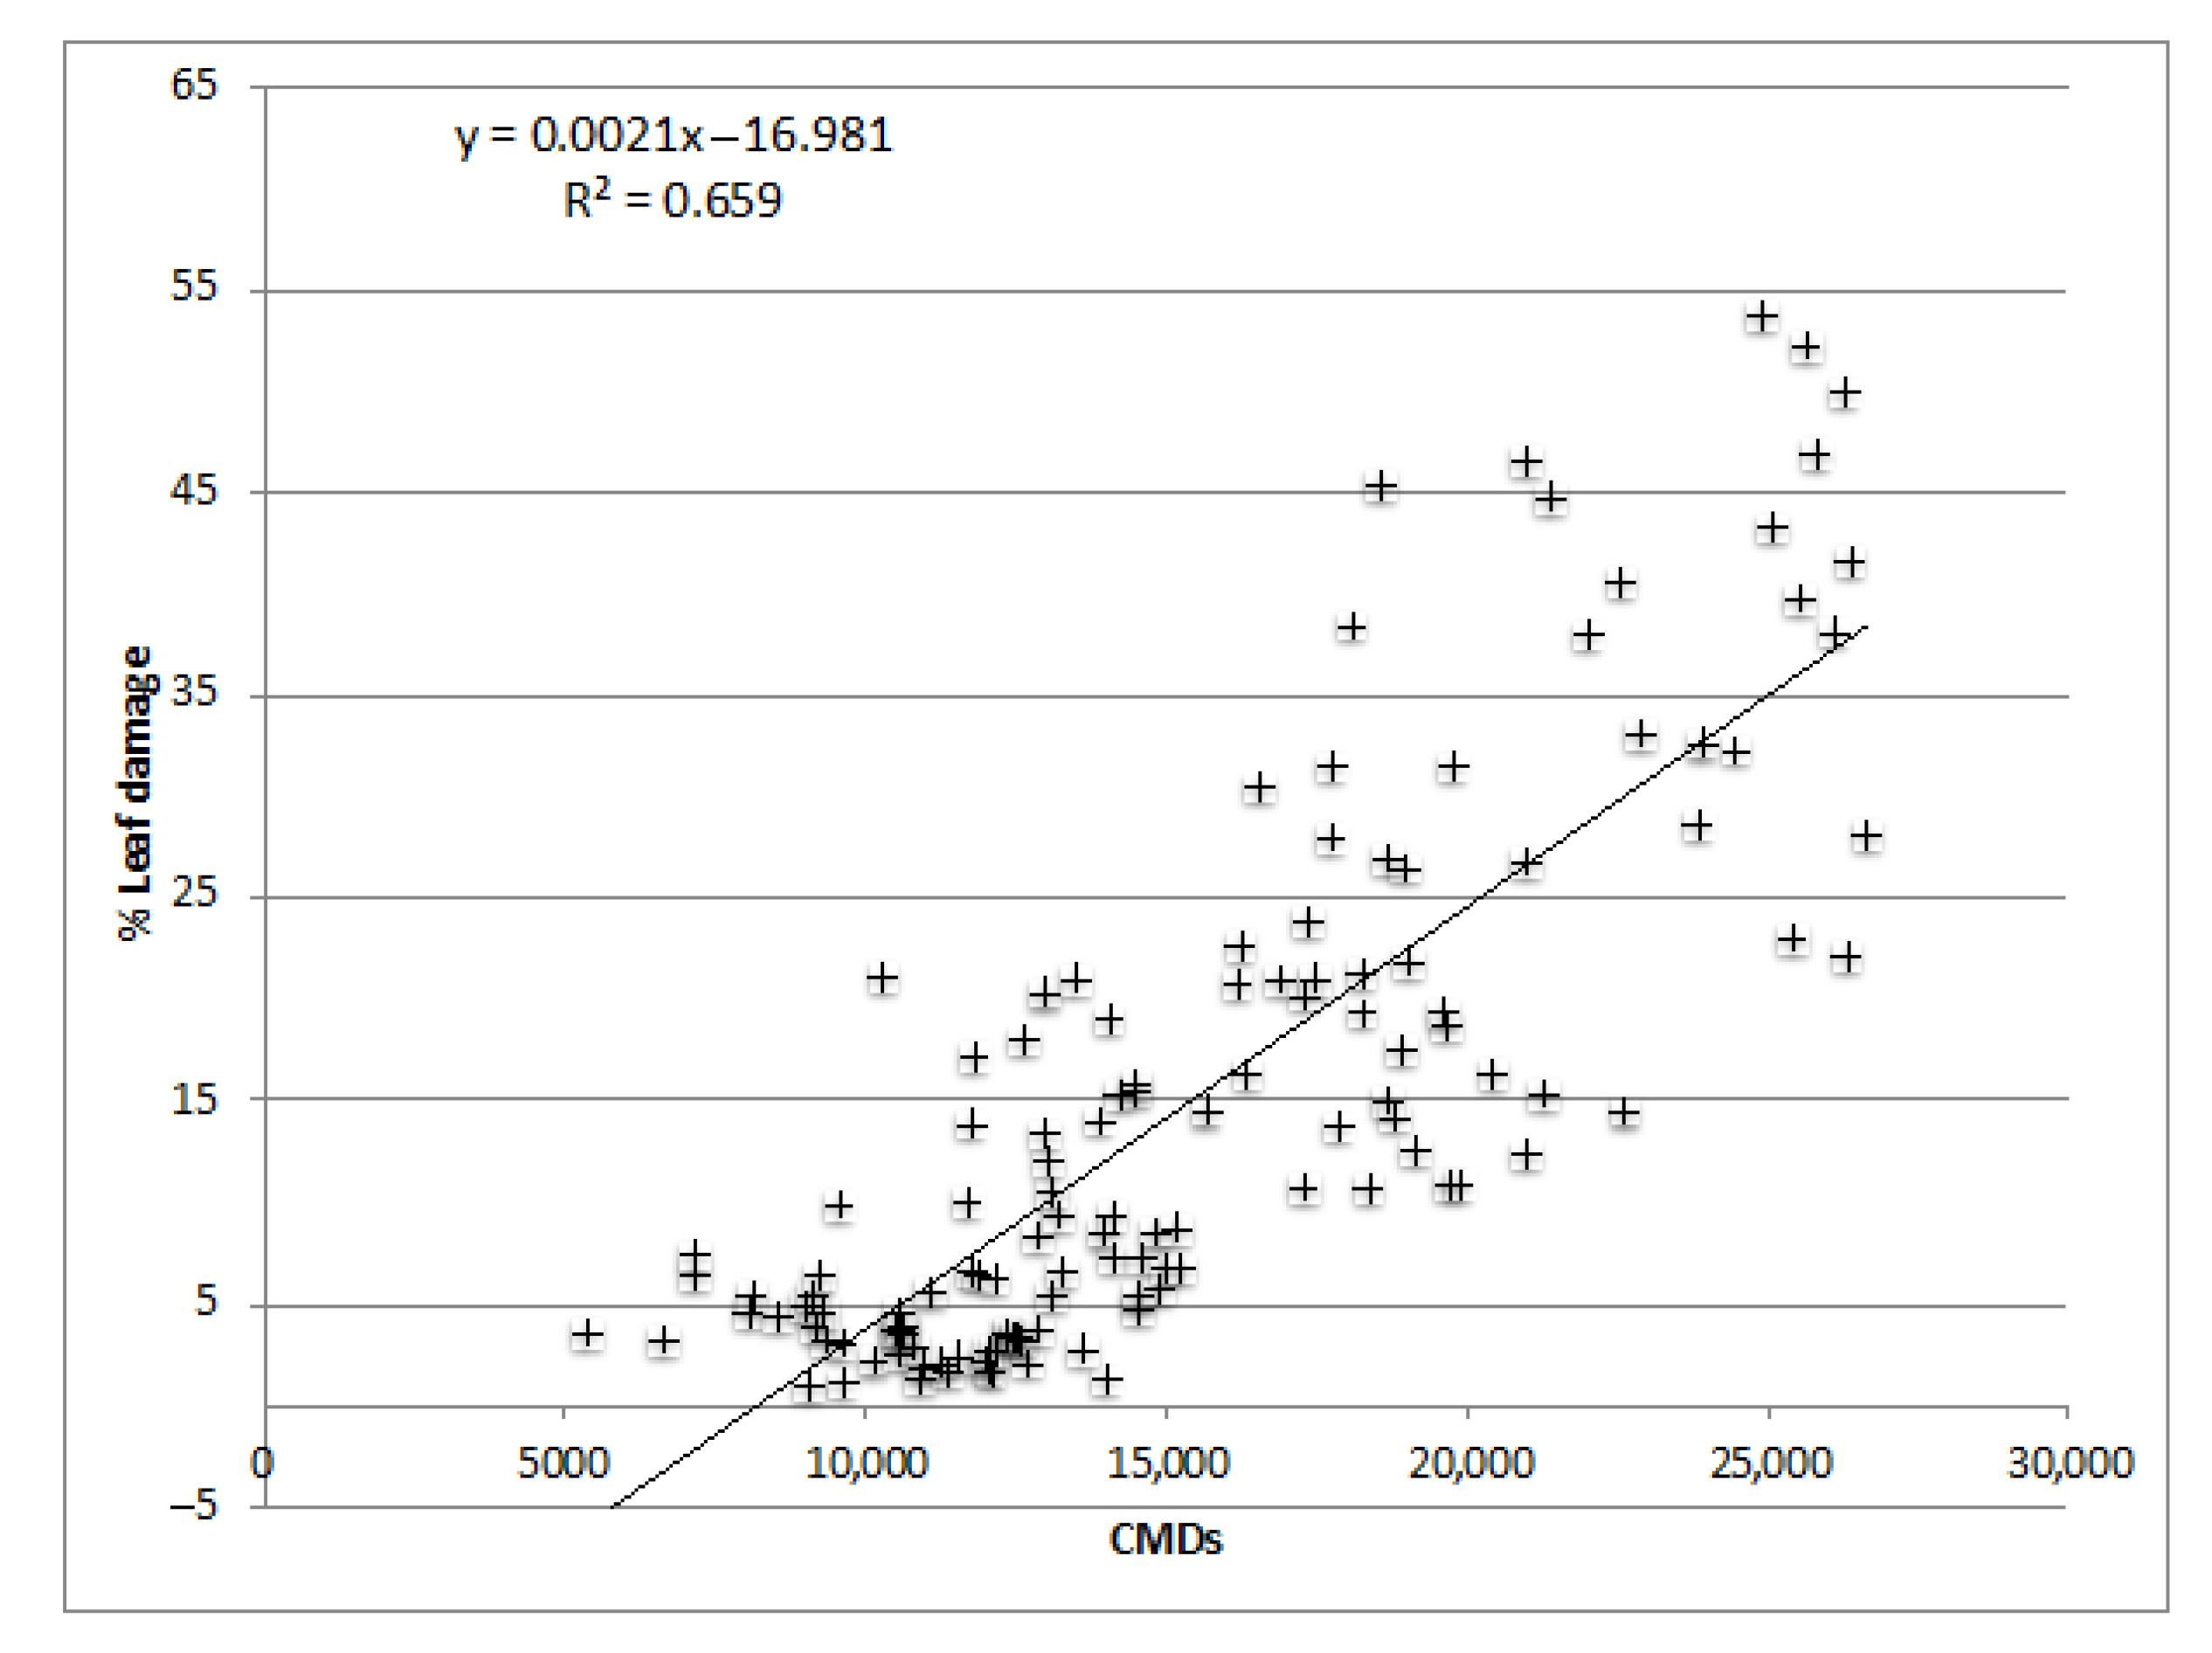
A linear regression for PLAD vs seasonal CMDs is shown in Figure 3. There was a significant correlation between PLAD and seasonal CMDs (F1,130 = 250.99, p < 0.0001, adjusted R2 = 0.66). Seasonal CMDs explained 65.9% (Nash-Sutcliffe efficiency index = 0.658) of the variation of PLAD, and the equation is PLAD = 0.002 CMDs–17. It has been demonstrated that under Tenerife’s conditions with a level of infestation of ca. 18,300 ± 565 (seasonal CMDs per leaf), there is a yield reduction, and with ca. 17,000 ± 768 such a reduction was not demonstrated. Therefore, using the linear regression equation, we can propose an EIL of ca 17 PLAD that must not be exceeded in Tenerife.
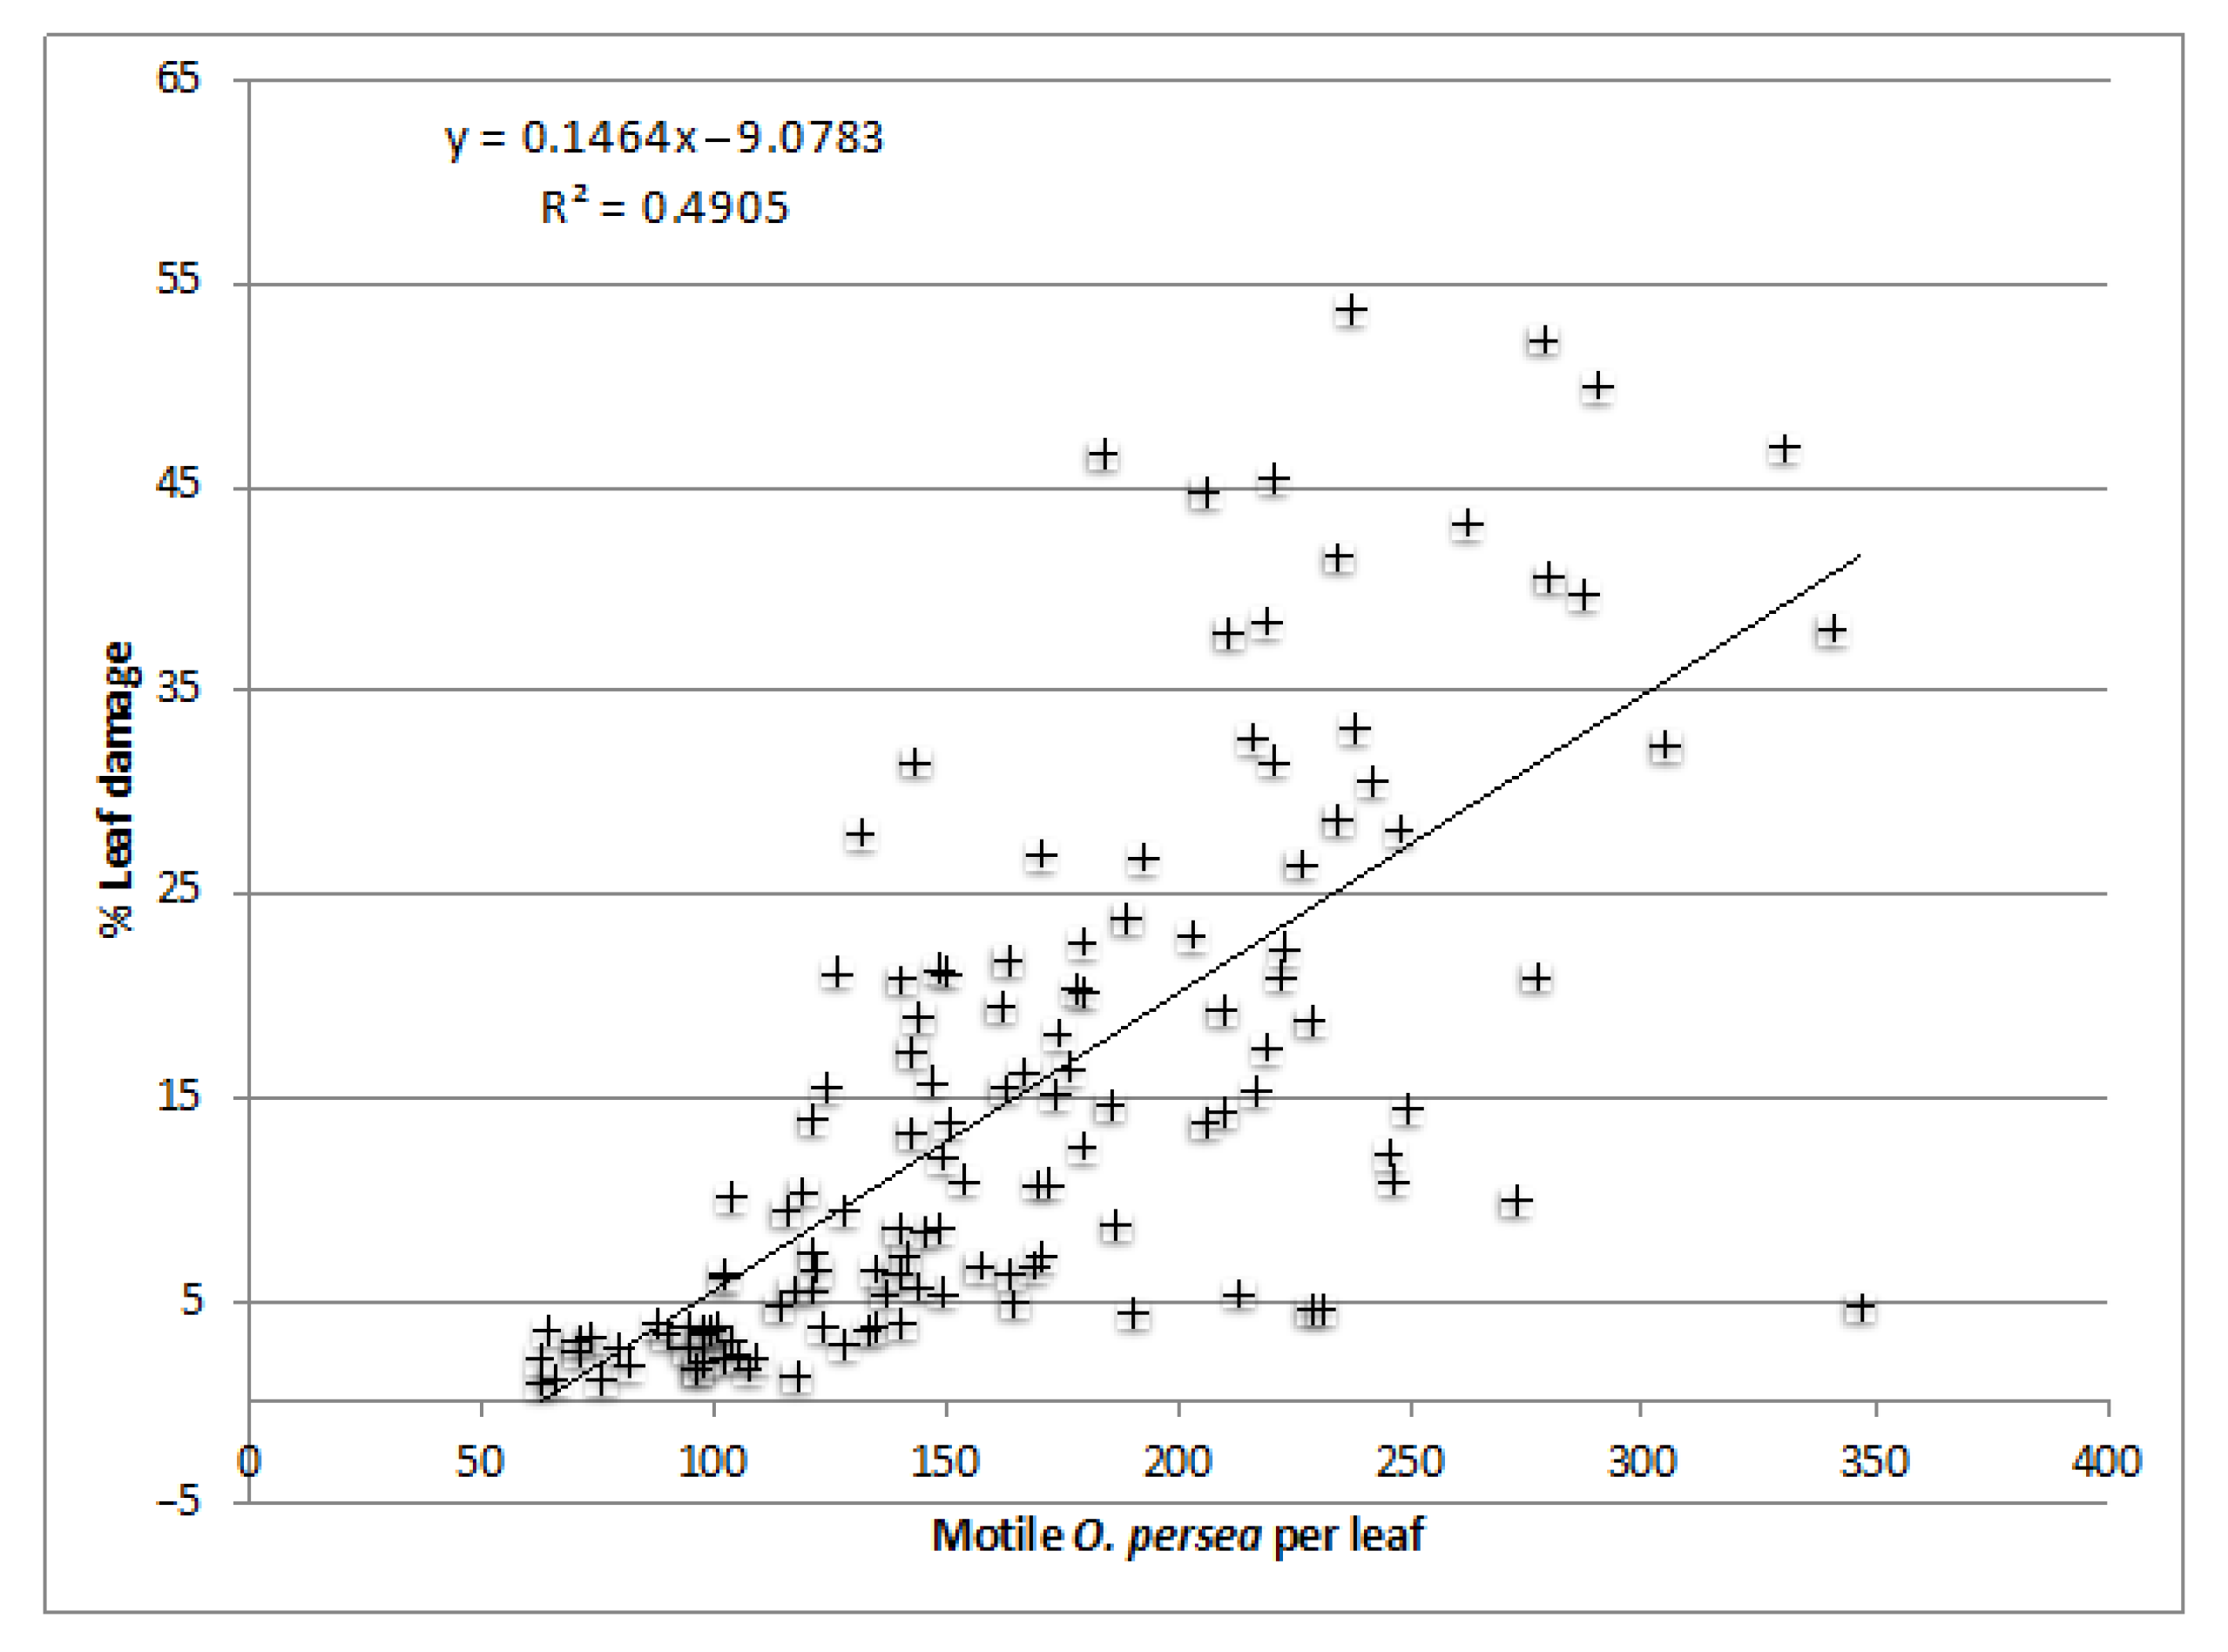
Although the Nash-Sutcliffe efficiency of the regression analysis comparing the maximum estimated motile O. perseae per leaf and leaf damage was low (0.49), it is a significant regression, as it explained a significant (F = 124.7; d.f. = 1; p < 0.001) amount of the variance of leaf damage (Figure 4). According to the linear regression (using the inverse equation) with a PLAD of 17, the maximum motile O. perseae per leaf is estimated at 178, and using the inverse Equation (1), we propose a maximum count on the upper side of the second vein to the left of the midrib (UML2) of 18 O. perseae. In the case of Málaga, no correlation was identified between CMDs and leaf damage, so a reliable PLAD cannot be recommended for this area according to our data.

3.3. Differences in Fruit Size between Treatments

The yield of each tree was collected and classified into two groups: fruit for export (>235 g) and fruit for the local market (<235 g). This was done in Tenerife during the years 2012 and 2013. According to a repeated-measures ANOVA, the trees under the treatment “mite-free” showed a higher yield per tree than the control (no treatment) (F = 6.515; d.f. = 2; p = 0.003). No difference was observed between the amount of fruit per tree for export or for the local market. Nor was an interaction between treatment and fruit gauge demonstrated, therefore no difference in yield was observed for export fruit or for local market fruit between any treatments, and no difference was found between the amount of fruit for export or for the local market under each treatment.
A significant Treatment × Year interaction was revealed according to a univariate ANOVA for polar and equatorial diameter and for the average weight of the fruits of each tree (Table 6).
A t-test was performed to compare average fruit weight and average equatorial and polar diameter between Tenerife and Málaga for three years (2011, 2012 and 2013). The equatorial diameter was higher (t = 31.89; d.f. = 2769.42; p < 0.0001) for the fruits of Tenerife (6.53 ± 0.018 cm) compared to Málaga (5.84 ± 0.012 cm). The polar diameter was similar in both locations and the average weight of the avocados was higher (t = 30.09; d.f. = 2453.09; p < 0.0001) in Tenerife (0.213 ± 0.001 kg) compared to Málaga (0.162 ± 0.001 kg).
In Tenerife, the polar diameter showed an erratic pattern, being lower in 2011 under conventional treatment compared to mite-free and control, but higher in 2013 compared to mite-free (Table 7). The equatorial diameter was higher under the control treatment in 2011 and 2012 compared to the conventional and mite-free treatments, respectively. In 2013 the highest equatorial diameter was measured in the fruits of the conventional treatment. An unclear pattern was observed for average weight, being lower under conventional treatment compared to control in the year 2011, lower under control compared to conventional in 2012, and lower under mite-free compared to conventional in 2013.
In Málaga, the polar diameter showed an erratic pattern, being lower in 2011 under conventional treatment compared to the mite-free and control, but higher in 2013 compared to mite-free (Table 8). The equatorial diameter was higher under the control treatment in 2011 and 2012 compared to the conventional and mite-free treatments, respectively. In 2013 the highest equatorial diameter was measured in the fruits of the conventional treatment. An unclear pattern was observed for average weight being lower under conventional treatment compared to control in the year 2011, lower under control compared to conventional in 2012, and lower under mite-free compared to conventional in 2013. Polar and equatorial diameter, as well as average weight, were constantly higher throughout the 5 years under the control management level compared to the mite-free. An exception was in the year 2012, where the equatorial diameter was similar under both treatments, and in 2014 where the polar diameter was similar under both management levels.

3.4. Estimation of Economic Losses Caused by Oligonychus perseae

Table 9 shows the increment in yield needed to pay for the different number of phytosanitary sprays. For example, if the avocados are sold at 1.9 €/kg and six phytosanitary sprays were made (which cost €2119, data for Tenerife), an increase of 1115 kg of avocados is needed to pay for those phytosanitary applications.
Yield difference between treatments in Tenerife is shown in Table 10. It is necessary to calculate the yield increase hoped for with respect to the total cost of all treatments. Table 9 shows that the yield increased. The estimated yield increase if avocados are sold at 1.9 €/kg is higher in the mite-free and conventional treatments in the years 2012 and 2013. In 2011, the increase in mite-free was lower than the one needed to pay for the sulphur spraying. However, in 2012 and 2013, the yield increment in mite-free treatment was 41% and 93% higher (respectively) than the yield increment required. In the conventional treatment, the yield increased was always higher than the yield increment required, at 44% in 2011, 3% in 2012, and 87% in 2013.
In the case of the Málaga orchard, no differences in yield were found between treatments, and therefore, no economic losses were detected.

4. Discussion

There is a striking difference in Persea mite abundance between populations from northern Tenerife and the coast of Málaga, being higher in Tenerife than in Málaga. Northern Tenerife, where the Canary Islands experimental plot is situated, is affected by trade winds, which produce a higher humidity during the summer months as compared to the orchards in southern Spain, where the climate is characterized by high summer temperatures and low humidity. The average daily maximum temperature is 29.8 °C, and the average relative humidity (RH) is 61.3% (in Málaga Airport). By contrast, in northern Tenerife, the average maximum temperature is 25.1 °C, with an RH of 69.6% [40]. This means that summer periods are less favorable for O. perseae in Málaga because of the high temperatures and low humidity, conditions which are a well-established mortality factor for the pest [41]. In fact, the number of Persea mites per leaf was demonstrated to be significantly affected by the minimum temperature and average relative humidity in Tenerife [9]. Furthermore, mild weather conditions in northern Tenerife cause the avocado trees to produce larger size fruits than in Málaga, as factors such as temperature, relative humidity, light intensity, and plant water potential directly influence elementary processes within the leaf, such as the assimilation of CO2 into carbohydrates and other metabolites, storage as starch, and transport to other parts of the growing tree, including fruit [42].
There is a correlation between mite feeding damage and photosynthesis inhibition. Mite feeding implies removing the leaf cells content and therefore a reduction in leaf chlorophyll [43,44]. For example, Oligonychus yothersi (McGregor) feeding on the upper surface of avocado leaves can cause up to a 30% reduction in the photosynthetic activity of leaves, many of which often fall to the ground within 45–60 days after infestation, thus average populations of 245 mites per day can lead to a yield reduction of 36.45% [45]. The high number of mites producing this damage over time can reduce the yield [46,47,48]. As the leaf area damaged is cumulative over time, it increases as the local mite population grows. Hence, the PLAD recorded in the present study correlated with CMDs.
Because of the higher Persea mite populations in Tenerife, we have here reported values of PLAD ranging from 11.73 to 34.98, whilst in Málaga, values ranged from 8.93 to 13.98. High PLAD in Tenerife may explain why both the number of fruits per tree and the yield (in 2012 and 2013) were significantly higher in the mite-free treatment, in which acaricide applications depleted Persea mite populations. In Málaga, no increase was recorded either in fruits per tree or in the yield under mite-free treatment with respect to the control. This was likely due to the harsher environmental conditions in Málaga which were less suitable for Persea mite survival. In addition, the trees in Málaga, being older than in Tenerife, were more resistant to mite infestation.
A significant linear relationship was found between PLAD and CMDs, but there was no linear correlation between CMDs and yield. The Persea mite is a very important factor negatively affecting yield, but there are likely other factors involved, such as climatic conditions, alternative bearing, stress, etc. Therefore, mite infestation cannot be considered the only cause responsible for yield reduction [25]. However, we have estimated for the Northern Tenerife orchard an economic injury level (EIL) of 17 PLAD, which is the damage that should not be exceeded. This means a maximum of 178 motile forms of Persea mite per leaf. In Israel, Maoz et al. [25] established an EIL of ca. 15 PLAD, or 50–100 mites per leaf, which is a lower threshold than that in Tenerife.
Relative to the individual characteristics of fruit sizing, i.e., polar and equatorial diameters and weight, in Tenerife only small differences were found between control and mite-free treatments in the equatorial diameter (2012), but there were no differences in weight. On the contrary, the avocados from Málaga were heavier in the control trees than in the mite-free treatment. This fact was counteracted by a somewhat insignificant lesser number of fruits in the control than in the treatment mite-free (from 2012 to 2015) group. Finally, the yield in Málaga was nearly the same in the mite-free treatment and in the control. The lesser individual fruit weight in the mite-free treatment, i.e., in trees subjected to acaricide applications, may be a result of a lesser mite infestation, but may also be due to a negative impact of the chemical compounds applied.
In the Tenerife orchard, the yield was significantly higher in mite-free treatment than in the control or conventional treatments in the last two years of the study. This means that high populations of the Persea mite are responsible for a significant production loss, and that control measures are necessary on the island. Similar results were observed in the state of Guerrero, Mexico, where the size and weight of avocados from treatments with Persea mite populations below the control threshold were larger and showed significant differences compared to the control [49].
During the first season (2011), the results may have been obscured due to the resilience of the trees to the treatments, i.e., the trees need time to incorporate the changes produced by the treatments to their physiology, in this case to the yield. However, in 2012 and 2013, the yield changed in the order of mite-free treatment > conventional > control. In this way, an increased yield of 372 kg/ha is enough to compensate for acaricide treatments, and between 558–1115 kg/ha is sufficient to compensate for the treatments necessary to achieve a mite population below EIL.
The yield loss observed in Tenerife could be related to the defoliation observed in the control treatment during the summer season and during flowering (spring). Processes such as photosynthesis and transpiration are negatively affected as the percentage of damaged leaf area increases [42]. Therefore, the loss of leaf from the tree canopy implies a total reduction of the photosynthetic area of the plant, thus decreasing CO2 assimilation. In addition, the processes carried out in the leaf depend on the age of the leaf [43], and this is different at the times when leaf fall is observed, affecting carbon assimilation and storage.
5. Conclusions

High numbers of the Persea mite may produce a yield loss in avocado orchards and, thus, a negative economic impact on growers. Therefore, control measures are needed to reduce mite populations. Our current study demonstrated that acaricide applications might compensate (and even overcompensate) for the possible yield losses without other control measures. On the other hand, intermediate levels of mite leaf damage lesser than 17 % of leaf area are well supported by avocado trees and may not result in yield losses.

Author Contributions

Conceptualization, J.R.B., J.M.V. and E.H.-S.; methodology, E.T., E.H.-S., J.M.V. and J.R.B.; software, C.Á.-A.; validation, E.H.-S., E.T., J.R.B. and J.M.V.; formal analysis, C.Á.-A., E.T., J.R.B. and J.M.V.; investigation, E.T., E.H.-S., J.R.B., M.E.W. and J.M.V.; resources, E.T.; data curation, C.Á.-A., E.T., J.R.B. and J.M.V.; writing—original draft preparation, E.T., C.Á.-A., M.d.P. and J.M.V.; writing—review and editing, M.d.P., J.M.V. and E.T.; visualization, E.T. and J.M.V.; supervision, E.H.-S. and J.M.V.; project administration, E.H.-S., J.R.B. and J.M.V.; funding acquisition, E.H.-S. and J.R.B. All authors have read and agreed to the published version of the manuscript.

Funding

The research of the IFAPA team was funded by the Regional Government of Andalusia (Spain) and 80% cofinanced by the European Regional Development Fund (ERDF), within the ERDF Regional Operational Program for Andalusia 2014–2020, grants number AVA.AVA201301.13, and AVA.AVA2019.038. The research of the ICIA team was supported by the Spanish Ministry of Economy and Competitiveness (INIA RTA2010-00037-C02 project). E.T. was funded by a predoctoral grant supported by ACIISI (Plan Canario I+D+i+d 2007-2010) through the collaboration agreement between the Canarian Institute for Agricultural Research (ICIA) and the avocado marketing company Agro-Rincón S.L. M.d.P. is currently supported by an INIA-CCAA postdoctoral contract, 20% co-financed by the Spanish National Institute for Agricultural and Food Research and Technology (INIA), and 80% by ERDF.

Data Availability Statement

The data presented in this study are available on request from the corresponding author.

Acknowledgments

The authors thank all colleagues of the respective laboratories for help in field sampling and data acquisition, as well as Mario Porcel (IFAPA, Málaga) for his language corrections and suggestions.

Conflicts of Interest

The authors declare that they have no conflict of interest.

References

  1. Purseglove, J.W. Tropical Crops: Dicotyledons; Longmans, Green & Co. Ltd.: London, UK, 1968; 332p. [Google Scholar]
  2. FAOSTAT. Food and Agriculture Organization (FAO) of the United Nations. Available online: http://www.fao.org/faostat/es/#home (accessed on 28 June 2022).
  3. Araújo, R.G.; Rodriguez-Jasso, R.M.; Ruiz, H.A.; Pintado, M.M.E.; Aguilar, C.N. Avocado by-products: Nutritional and functional properties. Trends Food Sci. Technol. 2018, 80, 51–60. [Google Scholar] [CrossRef]
  4. MAPA. Statistical Yearbook 2021; Ministerio de Agricultura, Pesca y Alimentación: Madrid, Spain, 2021. [Google Scholar]
  5. FEPEX. Federación Española de Asociaciones de Productores Exportadores de Frutas, Hortalizas, Flores y Plantas vivas. Available online: https://www.fepex.es/inicio.aspx (accessed on 29 June 2022).
  6. Alcázar, M.D.; Aranda, G.; Márquez, A.L.; Sánchez, L.; Ruiz, C. Oligonychus perseae (Acari: Tetranychidae) una nueva plaga en el aguacate en el Sur de España. In Proceedings of the IV Congreso Nacional de Entomología Aplicada, Braganza, Portugal, 17–21 October 2005; Volume 213. [Google Scholar]
  7. Vela, J.M.; González-Fernández, J.J.; Wong, E.; Montserrat, M.; Farré, J.M.; Boyero, J.R. El ácaro del aguacate (Oligonychus perseae): Estado actual del problema e investigación en Andalucía. Agrícola Vergel 2007, 26, 301–308. [Google Scholar]
  8. Torres, E.; Perera, S.; Ramos, C.; Álvarez, C.; Carnero, A.; Boyero, J.R.; Vela, J.M.; Wong, M.E.; Hernández, E. Avances en el Manejo Integrado de Oligonychus Perseae Tuttle, Baker & Abatiello en Canarias. Manual Técnico Nº 2; Instituto Canario de Investigaciones Agrarias: Tenerife, Spain, 2018; 70p. [Google Scholar]
  9. Torres, E.; Hernández-Suárez, E.; Alvarez-Acosta, C.; Ferragut, F. Oligonychus perseae Tuttle, Baker & Abbatiello (Acari: Tetranychidae) population dynamics and associated phytoseiid mites (Acari: Phytoseiidae) in avocado orchards in the Canary Islands (Spain). Int. J. Acarol. 2022, 48, 551–563. [Google Scholar] [CrossRef]
  10. Bienvenido, C.; Boyero, J.R.; del Pino, M.; Calderón, E.; Rodríguez, M.C.; Vela, J.M.; Wong, M.E. Manejo sostenible del ácaro cristalino, Oligonychus perseae, en el cultivo del aguacate. Phytoma España 2021, 326, 52–61. [Google Scholar]
  11. Tuttle, D.M.; Baker, E.W.; Abbatiello, M. Spider mites of Mexico (Acarina: Tetranychidae). Int. J. Acarol. 1976, 2, 1–102. [Google Scholar] [CrossRef]
  12. Monserrat, M.; Sahún, R.M.; Guzmán, C. Can climate change jeopardize predator control of invasive herbivore species? A case study in avocado agro-ecosystems in Spain. Exp. Appl. Acarol. 2013, 59, 27–42. [Google Scholar] [CrossRef]
  13. Aponte, O.; McMurtry, J. Damage on ‘Hass’ avocado leaves, webbing and nesting behaviour of Oligonychus perseae (Acari: Tetranychidae). Exp. Appl. Acarol. 1997, 21, 265–272. [Google Scholar] [CrossRef]
  14. Baker, E.W.; Tuttle, D.M. A Guide to the Spider Mites (Tetranychidae) of the United States; Indira Publishing House: West Bloomfield, MI, USA, 1994; 347p. [Google Scholar]
  15. Salas, L.A. Algunas notas sobre las arañitas rojas (Tetranychidae: Acari) halladas en Costa Rica. Agron. Costarric. 1978, 2, 47–59. [Google Scholar]
  16. Ochoa, R.; Aguilar, H.; Vargas, C. Ácaros Fitófagos de América Central; CATIE: Turrialba, Costa Rica, 1991; 251p. [Google Scholar]
  17. Maoz, Y.; Gal, S.; Aragov, Y.; Berkeley, M.; Zilbertein, M.; Noy, M.; Izhar, Y.; Abrahams, J.; Coll, M.; Palevsky, E. Biological control of the newly introduced persea mite with indigenous and exotic predators. Integrated Control of Plant-Feeding Mites. IOBC WPRS Bull. 2007, 30, 73–79. [Google Scholar]
  18. Ferreira, M.A.; Brazao, C.I.; Franquinho Aguilar, A.M. Ocorrencia de Oligonychus perseae Tuttle, Baker & Abbatiello (Acari: Tetranychidae) naIlha da Madeira. Agron. Lusit. 2006, 51, 219–222. [Google Scholar]
  19. Zappalà, L.; Kreiter, S.; Russo, A.; Tropea Garzia, G.; Auger, P. First record of the persea mite Oligonychus perseae (Acari: Tetranychidae) in Italy with a review of the literature. Int. J. Acarol. 2015, 41, 97–99. [Google Scholar] [CrossRef]
  20. Smaili, M.C.; Benyahia, H. Alerte! Invasion et la recrudescence des dégâts d’un nouveau ravageur émergent sur avocatier au Maroc: Oligonychus perseae (Acari: Tetranychidae). Agric. Maghreb 2018, 115, 88–89. [Google Scholar]
  21. EPPO Global Database. European and Mediterranean Plant Protection Organization (EPPO). Available online: https://gd.eppo.int/taxon/OLIGPA/documents (accessed on 22 July 2022).
  22. Aponte, O.; McMurtry, J.A. Biology, life table and mating behavior of Oligonychus perseae (Acari: Tetranychidae). Int. J. Acarol. 1997, 23, 199–207. [Google Scholar] [CrossRef]
  23. Montserrat, M.; de la Peña, F.; Hormaza, J.I.; González-Fernández, J.J. How do Neoseiulus californicus (Acari: Phytoseiidae) females penetrate densely webbed spider mite nests? Exp. Appl. Acarol. 2008, 44, 101–106. [Google Scholar] [CrossRef]
  24. Bender, G.S. A new mite problem in avocados. In California Avocado Society Yearbook; General Books LLC: Kennesaw, GA, USA, 1993; Volume 77, pp. 73–77. [Google Scholar]
  25. UC IPM. University of California Integrated Pest Management. Agriculture: Avocado Pest Management Guidelines, Persea Mite, Oligonychus perseae. Available online: https://www2.ipm.ucanr.edu/agriculture/avocado/Persea-mite/ (accessed on 1 September 2022).
  26. Stern, V.M.; Smith, R.F.; van den Bosch, R.; Hagen, K.S. The integration of chemical and biological control of the spotted alfalfa aphid: The integrated control concept. Hilgardia 1959, 29, 81–101. [Google Scholar] [CrossRef] [Green Version]
  27. Ramirez, O.A.; Saunders, J.L. Estimating economic thresholds for pest control: An alternative procedure. J. Econ. Entomol. 1999, 92, 391–401. [Google Scholar] [CrossRef]
  28. Stejskal, V. Economic injury level and preventive pest control. J. Pest Sci. 2003, 76, 170–172. [Google Scholar] [CrossRef]
  29. Pedigo, L.P.; Hutchins, S.H.; Higley, L.G. Economic injury levels in theory and practice. Annu. Rev. Entomol. 1986, 31, 341–368. [Google Scholar] [CrossRef]
  30. Higley, L.G.; Pedigo, L.P. Economic injury level concepts and their use in sustaining environmental quality. Agr. Ecosyst. Environ. 1993, 46, 233–243. [Google Scholar] [CrossRef]
  31. Pascual-Ruiz, S.; Aguilar-Fenollosa, E.; Ibáñez-Gual, V. Economic threshold for Tetranychus urticae (Acari: Tetranychidae) in clementine mandarins Citrus clementina. Exp. Appl. Acarol. 2014, 62, 337–362. [Google Scholar] [CrossRef]
  32. Maoz, Y.; Gal, S.; Zilberstein, M.; Izhar, Y.; Alchanatis, V.; Coll, M.; Palevsky, E. Determining an economic injury level for the persea mite, Oligonychus perseae, a new pest of avocado in Israel. Entomol. Exp. Appl. 2011, 138, 110–116. [Google Scholar] [CrossRef]
  33. Lara, J.R.; Hoddle, M.S. Comparison and field validation of binomial sampling plans for Oligonychus perseae (Acari: Tetranychidae) on Hass Avocado in Southern California. J. Econ. Entomol. 2015, 108, 2074–2089. [Google Scholar] [CrossRef]
  34. Machlitt, D. Persea mite on avocados—A quick field counting method. Subtrop. Fruit News 1998, 6, 1–4. [Google Scholar]
  35. Lara, J.R.; Saremi, N.T.; Castillo, M.J.; Hoddle, M.S. Sampling method evaluation and empirical model fitting for count data to estimate densities of Oligonychus perseae (Acari: Tetranychidae) on ‘Hass’ avocado leaves in southern California. Exp. Appl. Acarol. 2016, 68, 455–475. [Google Scholar] [CrossRef] [PubMed]
  36. Ruppel, R.F. Cumulative insect-days as an index of crop protection. J. Econ. Entomol. 1983, 76, 375–377. [Google Scholar] [CrossRef]
  37. Nash, E.; Sutcliffe, J.V. River flow forecasting through conceptual models. Part I—A discussion of principles. J. Hydrol. 1970, 10, 282–290. [Google Scholar] [CrossRef]
  38. Bennett, N.D.; Croke, B.F.W.; Guariso, G.; Guillaume, J.H.A.; Hamilton, S.H.; Jakeman, A.J.; Marsili-Libelli, S.; Newham, L.T.H.; Norton, J.P.; Perrin, C.; et al. Characterising per-formance of environmental models. Environ. Model. Softw. 2013, 40, 1–20. [Google Scholar] [CrossRef]
  39. Bielza, P.; Lacasa, A. Cálculo del umbral económico de daño del trips del trigo, Haplothrips tritici (Kurdjumov). Bol. San. Veg. Plagas 1998, 24, 239–250. [Google Scholar]
  40. AEMET. Agencia Estatal de Meteorología. Guía Resumida del Clima en España (1981–2010). Available online: https://www.aemet.es/es/conocermas/recursos_en_linea/publicaciones_y_estudios/publicaciones/detalles/guia_resumida_2010 (accessed on 15 December 2022).
  41. Hoddle, M. Persea Mite Biology and Control. Avoresearch 2002, 1–4. Available online: https://www.avocadosource.com/papers/Research_Articles/HoddleMark0001.pdf (accessed on 15 December 2022).
  42. Heath, R.L.; Arpaia, M.L. Avocado Tree Physiology—Understanding the Basis of productivity. In Proceedings of the California Avocado Research Symposium, Riverside, CA, USA, 4 November 2006; Univertity of California. Sponsored by the California Avocado Comission. pp. 93–107. Available online: https://www.avocadosource.com/ARAC/Symposium_2006/HeathRobert2006b.pdf (accessed on 17 January 2023).
  43. Sances, F.V.; Toscano, N.C.; Hoffmann, M.P.; Lapré, L.F.; Johnson, M.W.; Bailey, J.B. Physiological responses of avocado leaves to avocado brown mite feeding injury. Environ. Entomol. 1982, 11, 516–518. [Google Scholar] [CrossRef]
  44. Schaffer, B.; Pena, J.; Lara, S.P.; Buisson, D. Net photosynthesis, transpiration, and stomatal conductance of avocado leaves infested by avocado red mites. Proc. Interam. Soc. Trop. Hortic. 1986, 30, 73–82. [Google Scholar]
  45. Peña, J. Pest of avocado in Florida. In Proceedings of the V World Avocado Congress (Actas V Congreso Mundial del Aguacate), Málaga, Spain, 19–24 October 2003; pp. 487–494. [Google Scholar]
  46. Hoyt, S.C.; Tanigoshi, L.K.; Browne, R.W. Economic injury level studies in relation to mites on apple. Recent Adv. Acarol. 1979, 1, 3–12. [Google Scholar]
  47. Palevsky, E.; Oppenheim, D.; Reuveny, H.; Gerson, U. Impact of European red mite on Golden Delicious and Oregon Spur apples in Israel. Exp. Appl. Acarol. 1996, 20, 343–354. [Google Scholar] [CrossRef]
  48. Bound, S.A. The influence of severity and time of foliar damage on yield and fruit quality in apple (Malus domestica Borkh.). Eur. J. Hortic. Sci. 2021, 86, 270–279. [Google Scholar] [CrossRef]
  49. Cantú-Díaz, D.; Hernandez-Castro, E.; Damián-Nava, A.; Sotelo-Nava, H.; Otero-Colina, G.; Palemon-Alberto, F.; Villegas-Torres, G.O.; Chino-Cantor, A. Control of Mites and Thrips and its Impact on the Yield of Avocado cv.”Hass” in Filo de Caballos, Guerrero, Mexico. Int. J. Environ. Agric. Res. 2016, 2, 14–20. [Google Scholar]
Figure 1. Population dynamics of the Persea mite on avocado trees in Tenerife subjected to different treatments in 2011–2013.
Agronomy 13 00668 g001
Figure 2. Population dynamics of the Persea mite on avocado trees in Málaga subjected to different treatments from 2011–2015.
Agronomy 13 00668 g002
Figure 3. Linear regression for seasonal (2011–2013) percentage leaf area damage (PLAD) as a function of seasonal cumulative mite days (CMDs) of O. perseae per leaf.
Agronomy 13 00668 g003
Figure 4. Linear regression for the seasonal (2011–2013) percentage leaf area damage (PLAD) as a function of the maximum motile Persea mite estimated per leaf (2011–2013).
Agronomy 13 00668 g004
Table 1. Spray dates for two treatments (mite-free and conventional), over 3 years (Tenerife) and 5 years (Málaga).
LocationYearTreatments
Mite-Free (<50 Mites/Leaf))Conventional
(>50–150< Mites/Leaf)
Tenerife201120/1; 15/7; 1/8; 26/9; 21/11 (sulphur)20/6; 15/7 (sulphur)
201223/7; 20/8; 10/10; 13/11; 5/12; 17/12 (sulphur)23/7; 10/10 (sulphur)
20136/8; 10/9; 26/12 (sulphur)6/8; 26/12 (sulphur)
Málaga201122/9 (Abamectin); 14/10 (Abamectin); 16/11 (fenpiroximato 6.24% + hexitiazox 3.12%)
2012-
201326/8 (Tebufenpirad)
16/9 (fenpiroximato 6.24% + hexitiazox 3.12%); 26/9 (Tebufenpirad); 11/10 (fenpiroximato 6.24% + hexitiazox 3.12%)
201424/10 (fenpiroximato 6.24% + hexitiazox 3.12%); 18/11 (Tebufenpirad)
20153/12 (Tebufenpirad)
Table 2. Plant protection products used in O. perseae control, dose, price per 100 L (hl), acaricide cost and total cost of treatment, based on interviews of field technicians on the Canary Islands (at the time of this study).
Acaricide aPrice (€) b (Mean ± SE)Dose c
(l/hl)
Price (€/hl) (Mean ± SE)Acaricide Cost (€/ha) dTotal Cost (€/ha) e
Sulphur 80% p/v SC3.08 ± 0.400.501.54 ± 0.2063.26€352.26
Abamectin 1.8% p/v EC26.25 ± 1.130.051.31 ± 0.0553.81€342.81
Azadirachtin 3.2% SC (Align®)101.00 ± 9.000.1515.15 ± 1.35622.36€911.36
a Acaricides permitted at the time of this study; b Price of the product obtained from distributors; c Dose recommended by the manufacturer; d Acaricide cost is related to the volume of treatment used, for adult plants it was 41.08 ± 8.36 hl/ha; e The total cost represented the summary of the acaricide cost and the labour cost, which was 289 €/ha.
Table 3. Two-way ANOVA for CMDs (repeated measures) and for leaf damage, number of fruits, and yield for avocado trees subjected to three treatments during a period of three years (2011–2013) in Tenerife and two treatments during a period of five years (2011–2015) in Málaga.
Location CMDsLeaf DamageFruits per TreeYield
d.f.Fpd.f.Fpd.f.Fpd.f.Fp
TenerifeTreatments2180.89<0.00012266.40<0.000129.97<0.000129.621<0.0001
Years269.01<0.00012113.75<0.0001237.434<0.0001244.667<0.0001
Treatments × Year447.91<0.0001466.39<0.000143.8690.00543.2860.013
Treatments1188.84<0.00011137.57<0.000110.640.4210.010.92
MálagaYears4148.06<0.0001123.31<0.000140.260.9041.960.10
Treatments × Years428.60<0.0001113.03<0.000140.600.6740.580.68
Table 4. Mean (±SE) of CMDs, leaf damaged area (%), number of fruits per tree, and yield (kg) for avocado trees subjected to three treatments in Tenerife. Different letters mean significant differences (Tukey’s HSD multiple range test, p < 0.05).
YearVariableTreatments
Mite-FreeConventionalControl
2011CMDs465.13 ± 32.17 a830.83 ± 45.31 b1211.74 ± 69.73 c
Leaf damage (%)5.37 ± 0.27 a16.49 ± 1.08 b34.98 ± 1.65 c
Number of fruits/tree37.71 ± 13.11 a44.00 ± 8.17 a32.07 ± 6.67 a
Yield (kg/tree)7.55 ± 2.39 a8.66 ± 1.74 a6.45 ± 1.34 a
2012CMDs664.62 ± 19.46 a1299.8 ± 54.96 c1034.38 ± 36.61 b
Leaf damage (%)4.11 ± 0.62 a32.79 ± 1.99 c17.45 ± 1.12 b
Number of fruits/tree34.33 ± 9.46 b9.53 ± 4.67 a6.27 ± 1.79 a
Yield (kg/tree)7.17 ± 1.84 b2.37 ± 1.13 a1.41 ± 0.40 a
2013CMDs618.16 ± 18.17 a711.97 ± 22.14 b810.88 ± 33.50 c
Leaf damage (%)3.91 ± 0.35 a6.19 ± 0.75 a11.73 ± 0.91 b
Number of fruits/tree141.57 ± 18.53 b74.47 ± 16.24 ab68.33 ± 20.61 a
Yield (kg/tree)32.42 ± 3.93 b18.28 ± 3.37 ab15.18 ± 4.20 a
Table 5. Mean (±SE) CMDs, leaf area damage (%), number of fruits per tree, and yield (kg) for avocado trees subjected to two treatments in Málaga. Different letters mean significant differences (Tukey’s HSD multiple range test, p < 0.05).
YearParameterThresholds
Mite-FreeControl
2011CMDs286.71 ± 15.41 a652.72 ± 39.65 b
Leaf damage (%)5.18 ± 0.30 a8.93 ± 0.46 b
Number of fruits/tree116.33 ± 19.32134.20 ± 19.05
Yield (kg/tree)22.24 ± 3.1226.31± 3.05
2012CMDs193.70 ± 5.12 a239.17 ± 9.68 a
Leaf damage (%)5.91 ± 0.46 a13.98 ± 0.89 b
Number of fruits/tree137.73 ± 22.2695.07 ± 21.14
Yield (kg/tree)19.70 ± 3.1214.60 ± 3.09
2013CMDs421.67 ± 23.90 a823.38 ± 65.59 b
Leaf damage (%)--
Number of fruits/tree124.93 ± 25.44122.93 ± 17.19
Yield (kg/tree)19.26 ± 3.8820.33 ± 2.65
2014CMDs388.82 ± 29.87 a671.92 ± 52.36 b
Leaf damage (%)--
Number of fruits/tree130.67 ± 18.51105.93 ± 18.05
Yield (kg/tree)24.06 ± 3.3822.44 ±3.78
2015CMDs208.20 ± 9.98 a236.84 ± 13.14 a
Leaf damage (%)--
Number of fruits/tree107.20 ± 31.74104.67 ± 16.24
Yield (kg/tree)15.86 ± 4.4218.47 ± 2.81
Table 6. Univariate ANOVA for average weight of fruit, polar and equatorial diameter for avocado trees subjected to three treatments over a period of three years (2011–2013) in Tenerife, and two treatments over a period of five years (2011–2015) in Málaga.
Location Polar DiameterEquatorial DiameterAverage Weight
d.f.Fpd.f.Fpd.f.Fp
TenerifeTreatments20.680.9329.39<0.000124.780.008
Year2333.38<0.00012101.42<0.00012241.62<0.0001
Treatments × Year45.48<0.000144.410.00244.640.001
Treatments170.04<0.00011131.53<0.00011137.65<0.0001
MálagaYear465.37<0.00014220.75<0.00014149.18<0.0001
Treatments × Year43.280.011411.68<0.000145.68<0.0001
Table 7. Mean (±SE) average weight (kg), polar and equatorial diameter (cm) for avocado trees subjected to three treatments over a period of three years in Tenerife. SE followed by letters compares differences between treatments for each variable and year, and when the letters are different, the difference is significant according to Tukey’s HSD multiple range test: p < 0.05.
YearVariableTreatments
Mite-FreeConventionalControl
2011Polar diameter (cm)9.13 ± 0.07 b8.81 ± 0.07 a9.22 ± 0.08 b
Equatorial diameter (cm)6.39 ± 0.04 ab6.36 ± 0.04 a6.50 ± 0.04 b
Average Weight (kg)0.19 ± 0.003 ab0.19 ± 0.003 a0.20 ± 0.003 b
2012Polar diameter (cm)10.42 ± 0.13 a10.25 ± 0.13 a10.18 ± 0.11 a
Equatorial diameter (cm)6.24 ± 0.06 a6.53 ± 0.06 b6.46 ± 0.06 b
Average Weight (kg)0.23 ± 0.01 ab0.24 ± 0.01 b0.22 ± 0.001 a
2013Polar diameter (cm)10.76 ± 0.08 a11.18 ± 0.10 b10.94 ± 0.10 ab
Equatorial diameter (cm)6.86 ± 0.04 a7.18 ± 0.04 b7.01 ± 0.05 a
Average Weight (kg)0.25 ± 0.004 a0.28 ± 0.01 b0.26 ± 0.005 ab
Table 8. Mean (±SE) average weight (kg), polar and equatorial diameter (cm) for avocado trees subjected to two treatments over a period of five years in Málaga. SE followed by letters compares differences between treatments for each variable and year, and when the letters are different, the difference is significant according to Tukey’s HSD multiple range test: p < 0.05.
YearParameterThresholds
Mite-FreeControl
2011Polar diameter (cm)8.94 ± 0.09 a9.23 ± 0.06 b
Equatorial diameter (cm)5.62 ± 0.05 a5.84 ± 0.03 b
Average Weight (kg)0.14 ± 0.003 a0.16 ± 0.002 b
2012Polar diameter (cm)9.84 ± 0.06 a10.31 ± 0.06 b
Equatorial diameter (cm)5.76 ± 0.02 a5.76 ± 0.02 a
Average Weight (kg)0.16 ± 0.001 a0.16 ± 0.001 b
2013Polar diameter (cm)9.41 ± 0.06 a9.82 ± 0.05 b
Equatorial diameter (cm)5.87 ± 0.03 a6.07 ± 0.03 b
Average Weight (kg)0.16 ± 0.002 a0.18 ± 0.002 b
2014Polar diameter (cm)9.56 ± 0.05 a9.66 ± 0.04 a
Equatorial diameter (cm)6.29 ± 0.03 a6.64 ± 0.02 b
Average Weight (kg)0.19 ± 0.002 a0.21 ± 0.002 b
2015Polar diameter (cm)9.24 ± 0.06 a9.54 ± 0.05 b
Equatorial diameter (cm)5.89 ± 0.03 a6.16 ± 0.03 b
Average Weight (kg)0.16 ± 0.002 a0.18 ± 0.002 b
Table 9. Increase of yield/ha necessary to pay for a certain number of phytosanitary sprays.
Fruit Price (€/kg)No. Treatments and Cost (€/ha)
123456
€353€706€1060€1413€1766€2119
1.523547170694211771413
1.720841662383110391247
1.91863725587449301115
2.11683365056738411009
2.3154307461614768921
2.5141283424565706848
2.7131262392523654785
2.9122244365487609731
3.1114228342456570684
3.3107214321428535642
3.5101202303404505606
Table 10. Yields in Tenerife according to treatments and years with the number of phytosanitary sprays and the yield increase necessary to pay for those applications.
YearTreatmentYield (kg)Yield (kg/ha)Yield IncreaseNumber of SpraysYI a
2011Control90.212405.60-0
Conventional121.793247.73842.132372
Mite-free105.672817.87412.275930
2012Control21.06561.60-0
Conventional35.46945.55383.952372
Mite-free102.172724.642163.0461115
2013Control168.444491.73-0
Conventional274.537320.802829.072372
Mite-free475.3512,676.008184.273558
a YI: Yield Increase per ha necessary for 1.9 €/kg fruit price.
Disclaimer/Publisher’s Note: The statements, opinions and data contained in all publications are solely those of the individual author(s) and contributor(s) and not of MDPI and/or the editor(s). MDPI and/or the editor(s) disclaim responsibility for any injury to people or property resulting from any ideas, methods, instructions or products referred to in the content.