Abstract
To efficiently improve the productivity of strawberries under growing environmental change, the photosynthesis, root growth, and nitrogen allocation of strawberries (Fragaria × ananassa Duch. cv. Toyonoka) were investigated in a factorial design of CO2, temperature, and nitrogen supply. Elevated CO2 decreased the maximum CO2 assimilation rate (Amax), maximum CO2 carboxylation capacity per unit leaf area (Vcmax), and maximum CO2 carboxylation capacity per unit leaf mass (Vcm-m) by 20%, 24%, and 44%, respectively. Meanwhile, it reduced the SPAD value, maximal fluorescence level in the dark-adapted state (Fm), and maximal photochemical efficiency of PSII (Fv/Fm). Moreover, root branches, root number, root dry weight, and nitrogen-use efficiency were further increased in response to elevated CO2 under low nitrogen. When elevated CO2 was applied together with nitrogen nutrients, the Vcm-m and root nitrogen concentration (RNC) declined by 32% and 12%, respectively, but the total root dry weight (TRDW) increased by 88%. If the nitrogen nutrient was individually applied, the TRDW decreased by 16%, while the RNC increased by 21%. When the high temperature was individually applied, the TRDW increased by 104%, but the RNC decreased by 5%. Overall, elevated CO2 exacerbated photosynthetic down-regulation and significantly affected nitrogen redistribution among strawberry organs, reducing leaf nitrogen concentration and accelerating leaf senescence. However, it could increase seed quantity and improve its quality as well. In other words, under nitrogen-deficient conditions, elevated CO2 could improve the survival of offspring via the cost of the mother plant’s growth capacity.
1. Introduction
Elevated CO2 is an environmental factor that could affect the yields and nutritional quality of plants [1,2,3]. It has been proved that elevated CO2 could reduce stomatal conductance and transpiration to improve water use efficiency [4,5], as well as decrease the activity of key enzymes in the photosynthetic carbon reduction cycle and non-photochemical quenching of fluorescence (NPQ) for improving nutrient use efficiency [6,7]. Even at low N-concentration, elevated CO2 could enhance the photosynthesis rate [8]. In addition, the response of photosynthesis to elevated CO2 and enriched nitrogen nutrients appeared to be more sensitive under high-temperature conditions [9]. Higher temperatures can accelerate the photosynthesis rate of plants by affecting the activity of the enzymes involved [8]. Since concomitant increases in temperature and CO2 levels in the atmosphere will likely occur because of global climate change, it is of great interest to evaluate the response of photosynthesis to elevated CO2 and high temperatures in fruit crops. Jayawardena et al. pointed out that elevated CO2 and chronic warming can act synergistically to decrease nitrogen uptake and the activities of nitrogen-uptake and -assimilatory proteins in tomato roots [10].
Under elevated CO2 conditions, the root growth of crop plants is commonly accelerated and may have a greater accelerated extent than photosynthetic organs [11,12]. When crops were exposed to high CO2, root growth was enhanced and root mass, length, area and density increase [13]. Additionally, environmental temperatures and soil nitrogen concentrations also influence the growth of roots. Temperature affects the phenology of root length, diameter, and branching patterns [14]. It has been reported that nitrogen deficiency could increase the root/shoot ratio [15].
Commonly, enriched CO2 would decrease nitrogen concentrations in tissues of C3-plants considerably [16,17], due to the enhancement of nitrogen use efficiency (NUE) of green tissues which decreases the relative nitrogen demand per unit mass of green tissues at elevated CO2 [18]. With elevated CO2, the interacting effects of a reduction in ribulose-1,5-bisphosphate carboxylase/oxygenase (Rubisco) protein content and the depression of the photorespiratory pathway will reduce the total nitrogen demand of green tissues per unit mass [19,20]. Moreover, nitrogen nutrients are one of the reasons to influence the photosynthesis of plants [21]. The reduction of the nitrogen demand in green tissues, and the redistribution of nitrogen from vegetative organs to generative organs, may also occur in the strawberry during the fruit development stage under elevated CO2 conditions.
Strawberry (Fragaria × ananassa Duch.) is one of the most important fruit crops throughout the world, and has been widely planted in North and Central America, the European Union, and Asia [22]. Strawberry, like lemon and other plants, is a rich source of a wide variety of nutritive compounds such as anthocyanins and flavonoids, and is a health promoter [23,24]. However, unlike other crops, strawberry cultivation shows a low requirement for temperatures [25]. Hence, the response of strawberries to increased temperature may therefore be different from other crops. Strawberry productivity decreases when elevated CO2 is combined with elevated temperature [26]. Himali et al. reported that an increase in the intercellular to atmospheric CO2 ratio (Ci/Ca) at high temperatures may reduce photosynthesis, and thus reduce strawberry yield. However, the effect of high temperature, elevated CO2 and nitrogen supply on strawberry growth were not analyzed [27]. In previous studies, we have investigated the effects of CO2, temperature, and nitrogen concentration on the yield and fruit quality of strawberries [28]. In the context of the increasingly significant trend of global warming, we continued to study the effects of CO2, temperature, and nitrogen application on leaf photosynthesis, root growth, and tissue nitrogen to analyze the physiological adaptation of strawberry under the action of these three factors. For this purpose, the performance of photosynthetic acclimation was preliminarily examined under elevated CO2 combined with different temperatures and nitrogen-supplied levels. Simultaneously, their effects on root architectural traits and the biomass allocation of strawberries were also detected. In addition, the nitrogen redistribution between vegetative organs and fruits was analyzed. This will provide some suggestions for strawberry cultivation while promoting the continuous fruit production of strawberries.
2. Materials and Methods
2.1. Plant Material and Experimental Design
Strawberry (Fragaria × ananassa Duch. cv. Toyonoka) was used in this study. Strawberry seedlings with 3 true leaves were planted in 25 cm × 18 cm pots using field soil with a total nitrogen content of 0.96 g/kg. The experimental design consisted of a three-way randomized block with four replications. During the growth of strawberry plants, the treatments consisted of two day/night temperature levels [20/15 °C (TA), 25/20 °C (TA + 5 °C)], two CO2 concentrations [360 and 720 μmol CO2 mol−1 air], and two nitrogen application levels [0% (distilled water) and 0.01% NH4NO3]. Strawberry seedlings were cultured in a CO2 light incubator (2.20 m height, 1.0 m2 growth area) and CO2 concentrations were measured using an individual LICOR infrared gas analyzer (LI-COR, Lincoln, NE, USA). The factorial design in each incubator was consistent with our previous study [28]. All plants exposed to treatments of different temperature and CO2 concentrations were watered daily and fertilized weekly with 150 mL per plant of 0.1% Peters fertilizer (20:20:20, N/P/K) at the beginning of 1 November, which lasted for nearly 6 months, respectively. The treatment of increasing nitrogen supply used 50 mL of 0.01% NH4NO3 applied twice a week.
2.2. Leaf Gas Exchange and Parameters Estimated from the Biochemical Model of Leaf Photosynthesis
Photosynthetic CO2 response curves were generated using a GFS-3000 portable photosynthesis system (WALZ, Effeltrich, Germany) in April of the following year. These curves were generated using fourteen different CO2 concentrations from 150 to 2000 μmol mol−1, with saturating light conditions (1000 μmol m−2 s−1) in the leaf cuvette.
Data obtained above were fitted to the photosynthesis model [29,30]. To evaluate changes in photosynthetic capacity in leaves, maximum CO2 assimilation rate (Amax), net photosynthetic rate (Pn), maximum CO2 carboxylation capacity per unit leaf area (Vcmax), maximum CO2 carboxylation capacity per unit leaf mass (Vcm-m), maximum electron transport capacity per unit leaf area (Jmax) and triose phosphate utilization (TPU) were analyzed.
2.3. Chlorophyll Fluorescence
Chlorophyll fluorescence parameters were measured immediately after gas exchange measurements with a portable pulse amplitude modulation fluorometer (MINI-PAM, Walz, Effeltrich, Germany). Plants were dark-adapted for approximately 30 min before measurements of quantum yield of PSII (Yield), electron transport rate (ETR), photochemical quenching (qP), and NPQ. Data were obtained under a wide range of photosynthetic photon flux density (PPFD) values from 0 to 2900 μmol m−2 s−1. Three leaves in each plant were measured, and a total of four plants were determined in each treatment.
To acquire firm-specific information about the change in electron transport components in different treatments, curves of ETR, Yield, qP, and NPQ were mathematically fitted to a double exponential decay function using a Marquardt–Levenberg regression algorithm [31]. Three new parameters were obtained from each of these individually fitted curves, viz., the amount of increment or decrement of the curve (increment of ETR and NPQ, ETRm and NPQm, respectively; decrement of Yield and qP, Yieldm and qPm, respectively), the inflection point of the curve corresponding to light (Ek, Yk, Qk, and Nk) and the initial slope of the curve at low light intensity (Es, Ys, Qs, and Ns). ETRm and NPQm were equal to the maximum electron transport rate and the maximum non-photochemical quenching, respectively. Yieldm was calculated by subtracting the minimum value of Yield from the initial one, and qPm was obtained in the same way. The increases in ETRm and NPQm indicated the rapid ascent of these curves, but the increases in Yieldm and qPm meant the quick descent of the curves.
2.4. SPAD Index Measurements
SPAD index, a color-dependent parameter, was used as an indicator of chlorophyll content since there is a correlation between SPAD index and chlorophyll content [32,33]. After the measurements of photosynthesis and chlorophyll fluorescence, the mean of three SPAD value readings from a chlorophyll meter (SPAD-502, Konica Minolta, Japan) was obtained around the midpoint of each leaf blade, and all fully expanded leaves per plant were measured.
2.5. Analysis of Root Growth
After harvest, root systems were carefully washed and fine roots were separated. The fresh weight of fine root (FRFW), fractal dimension (FD), total root number (TRN), and total root dry weight (TRDW) were measured on each plant [34]. Three photos of each fresh fine root were taken to conduct fractal analysis using a Canon EOS 50D camera equipped with a Canon EF-S 18–55 mm f/3.5–5.6 IS lens (Canon, Japan). FD was obtained using Image J software. Because FRFW varied significantly (p < 0.0001), both between treatments and individual plants, the fine roots were graded in three size classes (grade 1 < 1 g, 1 ≤ grade 2 ≤ 2 g, grade 3 > 2 g) and their corresponding FDs were averaged.
2.6. Analysis of Nitrogen Content in Different Organs
Upon harvesting, the leaves, roots, and fruits of each plant were oven-dried separately at 70 °C to constant weights. The dried samples were weighed and then ground. The concentrations of total nitrogen in different tissues were determined by the Kjeldahl method, with modifications [35]. Briefly, 0.5 g dry fine powder of leaves, roots, and fruits was added into mico-Kjedlahl flasks containing the catalyst mixture (0.3% TiO2, 0.3% CuSO4, and 10% K2SO4) with 10 mL concentrated sulfuric acid, respectively, and then heated for 1.5 h. After cooling, the supernatant was diluted to 50 mL with distilled water. Then, 4 mL diluted supernatant was transferred into an outer chamber of a clean Conway dish, and 3 mL of 20 mg/mL H3BO3 solution was added to its inner chamber. The covered Conway dishes were sealed and incubated at 40 °C for 24 h. The absorbed ammonia in the H3BO3 solution was titrated with 0.02 mol/L HCl solution. The nitrogen content was defined as milligrams per gram of dry weight of strawberries.
2.7. Statistical Analyses
In this study, all data were subjected to analysis of variance (ANOVA) [36]. Multivariate general linear model function (MGLM) was performed to analyze the main effects of CO2 concentration, air temperature, and nitrogen input, combined with their interactions on the parameters of strawberry, as described above [28,37]. Meanwhile, the relationships between total nitrogen content and total dry weight of different organs (leaf, root, and fruit) were also tested. All statistical analyses were conducted using SAS software (SAS Institute Inc., Cary, NC, USA) [24,38].
3. Results
3.1. Photosynthetic Acclimation
The CO2 response curves showed that the high temperature had no significant effect on the leaf CO2 assimilation rate (A). Elevated CO2 could significantly decrease A under the low-nitrogen condition, but did not in the high-nitrogen treatment (Figure 1). In the low-nitrogen treatment, Amax was significantly decreased by 20% at elevated CO2, while in the high-nitrogen treatment the reduction in Amax was not significant at elevated CO2 (Figure 2a, p < 0.05). These data implied that the elevated CO2 could enhance the acclimation of photosynthesis under low nitrogen conditions. The Pn, Vcmax, Vcm-m, Jmax, and TPU were detected to evaluate the relationship between the acclimation of photosynthesis and the change in carboxylation, electron transportation, and Pi-regeneration. Strawberries grown under CO2-enriched conditions had higher Pn and lower Vcmax, Vcm-m, Jmax, and TPU, especially in the low-nitrogen treatment (Figure 2b–f). Vcmax and Vcm-m were significantly decreased, by 24% and 44%, respectively, when 720 ppm CO2 was added in the presence of low nitrogen. Contrastingly, Vcmax, and Vcm-m under high CO2 concentration and high nitrogen condition were only decreased by 5% and 32%, respectively, compared to those values under low CO2 concentration and low-nitrogen condition (p < 0.05). Similarly, the reductions in Jmax and TPU in high CO2 concentration and low nitrogen condition were greater than the ones in high CO2 concentration and high nitrogen condition.
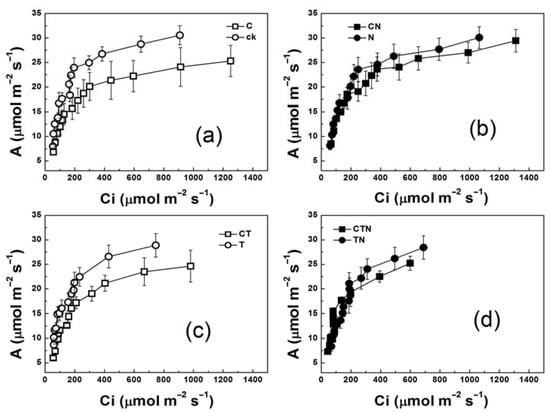
Figure 1.
Leaf CO2 assimilation rate(A)/Ci curves (a–d) of strawberry plants grown at different levels of CO2, temperature, and nitrogen. ck, control (360 ppm × 20 °C/15 °C × without nitrogen input); C, high CO2 concentration, low temperature, and low nitrogen; N, high nitrogen, low CO2 concentration, and low temperature; T, high temperature, low CO2 concentration, and low nitrogen; CT, high CO2 concentration, high temperature, and low nitrogen; CN, high CO2 concentration, high nitrogen, and low temperature; TN, high temperature, high nitrogen, and low CO2 concentration; CTN, high CO2 concentration, high temperature, and high nitrogen.
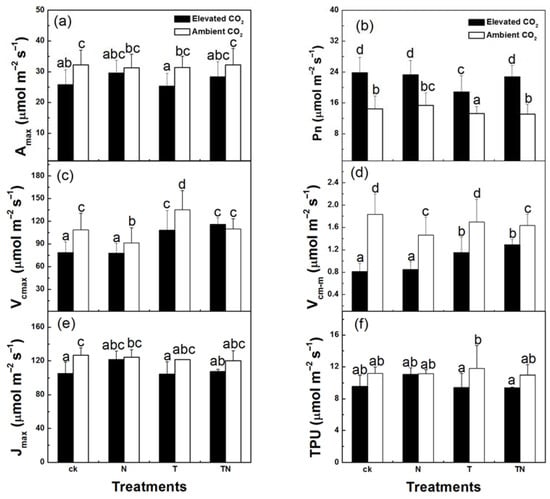
Figure 2.
Maximum CO2 assimilation rate (Amax) (a), net photosynthetic rate (Pn) (b), maximum CO2 carboxylation capacity per unit leaf area (Vcmax) (c), maximum CO2 carboxylation capacity per unit leaf mass (Vcm-m) (d), maximum electron transport capacity per unit leaf area (Jmax) (e), and rate of triose phosphate utilization (TPU) (f) of strawberry plants at different levels of CO2, temperature, and nitrogen. Columns with the same letter are not significantly different (p > 0.05). ck, low temperature and low nitrogen; N, high nitrogen and low temperature; T, high temperature and low nitrogen; TN, high temperature and high nitrogen.
Elevated CO2 had a significant effect on SPAD (p < 0.001) and caused a 4% decrease in SPAD (Table 1). Both Fm and Fv/Fm were significantly decreased in the presence of elevated CO2, by 11% and 3%, respectively (Table 1, p < 0.05). There was no significant effect of these treatments on the minimal fluorescence level in the dark-adapted state (Fo), the maximal fluorescence level in the light-adapted state (F’m), or the photochemical efficiency of open PSII reaction centers (F’v/F’m). Pearson’s correlation test suggested that Fv/Fm (r = 0.718, p < 0.05) and Fo (r = −0.82, p < 0.05) significantly correlated with SPAD, implying that the changes in these chlorophyll fluorescence parameters might be related to the changes in leaf chlorophyll.

Table 1.
Effects of CO2, temperature, and nitrogen treatments on SPAD index, minimal and maximal fluorescence level in the dark-adapted state (Fo and Fm), maximal photochemical efficiency (Fv/Fm), maximal fluorescence in the light-adapted state (F’m), and photochemical efficiency of open PSII reaction centers (F’v/F’m) on strawberry.
Except for the chlorophyll fluorescence parameters mentioned above, strawberries grown under elevated CO2 conditions decreased in ETR, Yield, qP, and NPQ values. Furthermore, the extents of these reductions were greater in ETR and NPQ than in Yield and qP (Figure 3a–d). In contrast, ETR, Yield, and qP decreased to similar extents at high temperatures, but NPQ showed an increasing trend. High nitrogen supply could not promote the increases of these four parameters, and even caused slight decreases. Further analysis of the parameters obtained from the curve-fitting of ETR, Yield, qP, and NPQ suggested that enriched CO2 and high temperature both decreased the electron-transport capacity of strawberry at high light intensity (Figure 4, Table 2). Growth at elevated CO2 and high temperature and the decreased ETRm and Ek combining with the similar Es suggested that the ETR curves were lowered under these conditions. In addition, the increased Yieldm and qPm combining with the decreased Yk and Qk suggested that the curves of Yield and qP decreased faster in high CO2 and high temperature treatments as light intensity increased. Surprisingly, though the pattern of NPQm was similar to ETRm, NPQk was greater in high CO2 and high temperature treatments than in low CO2 and low temperature treatments.
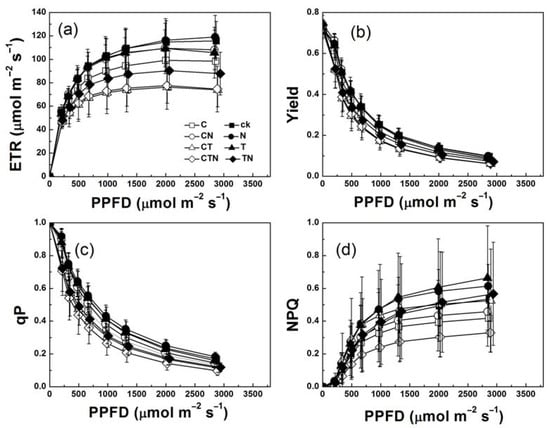
Figure 3.
Responses to photosynthetic photon flux density (PPFD) of (a) electron transport rate (ETR), (b) quantum yield of PSII (Yield), (c) photochemical quenching of fluorescence (qP), and (d) non-photochemical quenching of fluorescence (NPQ) of strawberry plants grown under different levels of CO2, temperature, and nitrogen.

Figure 4.
Curve-fit analysis of ETR, Yield, qP, and NPQ, including increment or decrement of curves (ETRm, Yieldm, qPm, and NPQm, (a–d)), minimum saturating irradiance (Ek, Yk, Qk, and Nk, (e–h)), and initial slope of curves (Es, Ys, Qs, and Ns, (i–l)) of strawberry plants at different levels of CO2, temperature, and nitrogen. Columns with the same letter were not significantly different (p > 0.05). ck, low temperature and low nitrogen; N, high nitrogen and low temperature; T, high temperature and low nitrogen; TN, high temperature and high nitrogen.
Table 2.
MGLM analysis of different treatments and their interactions on chlorophyll fluorescence parameters such as Fm, Fv/Fm, Es, Ek, decrement of curves (qPm and Yieldm), increment of curves (NPQm), minimum saturating irradiance (Qk and Nk) and initial slope of curves (Qs and Ys) of strawberry cultivated at ambient (360 ppm) and elevated (720 ppm) CO2, high and low temperature, and high and low nitrogen.
Overall, the CO2 assimilation was greatly affected by elevated CO2 and low nitrogen concentration, while the photosynthetic electron transport was greatly affected by elevated CO2 and high temperature.
3.2. Root Growth
It was found that about 80% of the fresh weights of the fine roots were less than 1 g. When the elevated CO2 treatment was individually applied, the frequency distribution (FDS) of grade 1 decreased by 2% (Table 3). Contrastingly, the FDS of grade 3 was nearly 1.25 times greater. Correspondingly, the mean FDS of grade 3 increased by 1%. Additionally, the fruit nitrogen concentration (FNC), root nitrogen concentration (RNC), TRDW, and TRN dramatically increased by 27%, 100%, 155%, and 16%, respectively. When the elevated CO2 and nitrogen supply treatments were applied together, the Vcm-m and RNC declined only by 32% and 12%, respectively, while the TRDW increased by 88%. In addition, when the nitrogen supply treatment was individually applied, the TRDW decreased by 16% while the RNC increased by 21%. A high temperature presented similar effects to nitrogen supply treatment. If the high temperature was individually applied, the TRDW increased by 104%, but the RNC decreased by 5%. In contrast, under high temperatures combined with elevated CO2 and nitrogen supply, TRDW increased by 26% while reducing RNC by 18%. However, TRN showed no significant difference after individually elevated CO2 treatment (Table 3). The increased FD and FDS values of grade 3 roots under elevated CO2 conditions suggested that enriched CO2 promoted the growth of the fine-root system. Indeed, elevated CO2 did increase TRDW under low-temperature conditions, while decreasing it under high-temperature conditions. Interestingly, the plants under low nitrogen conditions showed greater TRDW values compared to those cultured under a high nitrogen supply. Moreover, the increases in TRDW under low nitrogen conditions were further enhanced when combined with elevated CO2 treatment.
Table 3.
Fine root grading and its corresponding fractal dimension (FD), total root number (RN), and total root dry weight (TRW) of strawberry plants grown at ambient (360 ppm) and elevated (720 ppm) CO2, high and cool temperature, and high and low nitrogen in growth chambers. The fine root was graded in three size classes depending on the fresh weight of the fine root (FRFW < 1 g, grade 1; 1 ≤ FRFW ≤ 2 g, grade 2; FRFW > 2 g, grade 3).
3.3. Nitrogen Allocation
The mass-based leaf nitrogen concentrations (LNm) and the mass-based RNC were dramatically decreased in response to CO2 enrichment under low-temperature conditions (Figure 5a–c; Table 4; p < 0.001). In addition, plants grown under elevated CO2 conditions had no significant effect on mass-based FNC, combined with either low or high nitrogen treatment. A linear regression analysis was performed between total leaf dry weight (TLDW) and total leaf nitrogen (TLN), between TRDW and TRN, and between total fruit dry weight (TFDW) and total fruit nitrogen (TFN), respectively (Figure 5d). The result showed that TFDW was positively correlated with TFN (r2 = 0.783, p < 0.001), but there was no significant correlation either between TLDW and TLN or between TRDW and TRN (r2 = 0.332, p = 0.003; r2 = 0.358, p = 0.001, respectively).
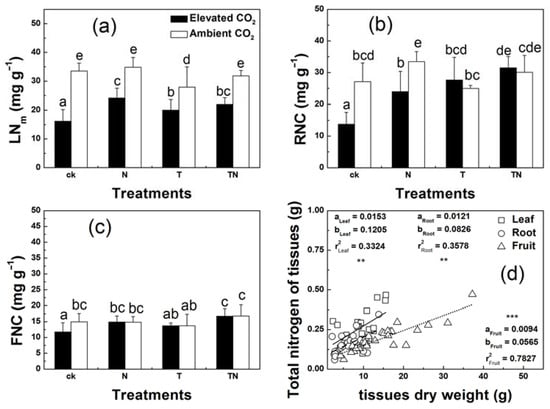
Figure 5.
Leaf nitrogen concentration (LNm) (a), root nitrogen concentration (RNC) (b), and fruit nitrogen concentration (FNC) (c) of strawberry cultivated in a factorial combination of CO2, nitrogen, and temperature. Relationships between total dry weight and total nitrogen of leaf, root, and fruit (d). Columns with the same letter were not significantly different (p > 0.05). Regression lines: solid line, leaf; broken line, root; dotted line, fruit. Regression lines: y = ax + b. ** p < 0.01; *** p < 0.001. ck, low temperature and low nitrogen; N, high nitrogen, and low temperature; T, high temperature and low nitrogen; TN, high temperature and high nitrogen.
Table 4.
MGLM analysis of different treatments and their interactions on Vcmax, Vcm-m, Amax, Jmax, TPU, SPAD, TRW, LNm, RNC, and FNC of strawberry cultivated at ambient (360 ppm) and elevated (720 ppm) CO2, high and cool temperature, and high and low nitrogen.
4. Discussion
Wang et al. found that raising atmospheric CO2 could enhance nutrient use efficiency [39]. The results of our study supported this viewpoint, and further showed that the photosynthetic rate of strawberries was greatly promoted by enriched CO2. Compared with the greatly enhanced photosynthetic rate, the significantly decreased LNC (leaf nitrogen concentration) implied that photosynthetic nitrogen-use efficiency (PNUE) was greatly improved under elevated CO2 conditions. However, photosynthesis was significantly downregulated after long-term treatment with elevated CO2 and low nitrogen, suggesting that photosynthetic acclimation has occurred in strawberries adapting to this condition. In this condition, the decreased Vcmax, Vcm-m, Jmax, and TPU might play important roles during the acclimation process. Under elevated CO2 conditions, the activity and activation of Rubisco (measured as Vcmax and Vcm-m) were both decreased and further caused the downregulation of photosynthesis under low nitrogen conditions [40]. The reason for these declines was that prolonged exposure to high concentrations of CO2 led to decreased levels of transcripts of proteins involved in photosynthesis [41]. Meanwhile, the decreased electron transport components (measured as Jmax) limited the improvement of the photosynthetic rate under elevated CO2 conditions, indicating a low-level activity of the PSII reaction center [42,43]. In addition, the reduction in TPU might be another factor in photosynthetic acclimation in strawberries. Under elevated CO2 conditions, the nitrogen deficiency would limit the translocation of soluble carbohydrates, and then the reduction of TPU would stimulate plants to adjust photochemical requirements, finally causing a decrease in the photosynthetic rate [44].
As indicated above, elevated CO2 substantially decreased the performance of electron transport components, especially after enriched CO2 and high-temperature treatments. In these treatments, the critical value of qP = 0.4 was achieved earlier with increasing PPFD, which indicated a higher degree of PSII over-reduction [45]. Meanwhile, Fv/Fm also showed a significant decrease after elevated CO2 treatment. The downtrends of PPFD and Fv/Fm suggested that CO2 enrichment and high temperature would increase the risk of photoinhibition [46]. Surprisingly, NPQ values under-enriched CO2 and high-temperature conditions were remarkably reduced. There might be two reasons contributing to these changes. Firstly, at elevated CO2, the decreased chlorophyll-binding proteins, including CP29, CP26, and CP24 [47], which provided binding sites of xanthophylls and appeared to be involved in qE [48,49,50], might have negative effects on the formation of NPQ. Secondly, it is tempting to infer that the dramatic decrease in the activity of xanthophyll cycle pigments at the late stages of leaf senescence might be involved in the reduction of NPQ [51]. The pool size and composition of these pigments determined the extent of NPQ [52].
Overall, the decreases in qP and NPQ under enriched CO2 and high-temperature conditions imply an increase in energy decaying via the triplet state (3Chl*), and eventually an increase in reactive oxygen species (ROS) [53]. Considering the decreased chlorophyll content and Rubisco with the possible increase in ROS, it is implied that leaf senescence had been promoted by elevated CO2 and high temperature under low nitrogen conditions [54,55]. Commonly, the short time stimulus from elevated CO2 can improve PNUE in plant leaves. However, the long-term treatment of high CO2 and high temperature under low nitrogen conditions might induce photosynthetic acclimation, to accelerate leaf senescence and eventually injure the CO2 fertilization effect on PNUE.
Interestingly, the increases of TRDW at low nitrogen were further enhanced when the strawberry plants were treated with elevated CO2. To date, there are conflicting reports on the effect of nitrogen supply on root growth [56,57]. Under the treatment of high CO2 and low nitrogen, the increase of TRDW might be due to the formation of root cortical aerenchyma (RCA). RCA could reallocate nutrients and reduce respiration, and eventually reduce the metabolic costs of soil exploration with increased root biomass [58]. Overall, the significantly decreased nitrogen concentration in the fine root, with a dramatic increase in biomass, suggested that the NUE of the strawberry root was improved in response to the high CO2 and low nitrogen treatment.
Generally, the distinct magnitude of the decline in organ nitrogen concentrations implied that different mechanisms might be involved in nitrogen allocation in leaves, roots, and shoots. Compared to the substantial reduction in LNC (41%) and RNC (21%), FNC was reduced to a much smaller extent (11%) after elevated CO2. The increased concentrations of photosynthate-derived compounds were supposed to dilute the nitrogen concentrations, especially in vegetative organs [59].
This assumption could be supported by the negative correlations between total nitrogen (TLDW or TRDW) and total dry weight (TLN or TRN) in vegetative organs, which were remarkably weaker (r2 = 0.332, p = 0.003; r2 = 0.358, p = 0.001, respectively). However, the stronger correlation between TFDW and TFN (r2 = 0.783, p < 0.001) could not be explained by this assumption. It suggested that the dilution assumption was not a sufficient factor to cause the fluctuation in nitrogen concentration in fruits. It might be a reasonable explanation for the redistribution of nitrogen nutrients from these vegetative organs to fruits. Han et al. found the fruit burden led to a 34% and 38% reduction in the biomass of mature leaves and their 15N content per dry mass, compared with non-fruiting Fagus crenata Blume trees [60]. This implied that fruits have a relatively high priority for nitrogen allocation to meet their enhanced growth under favorable conditions such as elevated CO2 and low temperature.
A low nitrogen supply would trigger the redistribution of nitrogen from vegetative organs to reproductive organs. This redistribution seemed to be enhanced by elevated CO2, which could further increase fruit yield and improve the NUE of leaves and roots [6,28,61,62]. The increased NUE in leaves and roots might enhance the capacity of plants to allocate more nitrogen away from these vegetative organs to reproductive organs.
To sum up, plants could transfer more nutrients to their offspring in response to stress conditions, and the highly effective nutrient salvage mechanism would be activated in these vegetative organs [63]. The fruiting stage is a crucial period in the response to stress conditions, and can impact the number of flowers and the fruit yield [3,28]. It was tempting to speculate here that there might be an important trade-off strategy: under nutrient-deficient conditions, elevated CO2, individually or along with factors favoring reproductive organ growth, will increase the benefit to the survival of offspring by the cost of the mother plant’s growth capacity (down-regulated photosynthesis capacity and accelerated leaf senescence).
5. Conclusions
This study elucidated the effects of CO2 concentration, nitrogen concentration, and temperature changes on photosynthetic characteristics, root growth, and nitrogen partitioning in strawberry plants. Photosynthetic acclimation occurs in strawberry plants grown under high CO2 and low nitrogen conditions. However, photosynthetic acclimation was alleviated with increasing nitrogen supply. Specifically, under conditions of low nitrogen supply and high CO2 concentration, Amax significantly decreased by 20%, but this reduction was not significant under high nitrogen supply and high CO2 concentration. Such a process could, to a certain extent, alleviate rising atmospheric CO2 levels. Moreover, under low-temperature and low nitrogen conditions, elevated CO2 increased root growth and facilitated the allocation of C to below-ground biomass. The different patterns of nitrogen concentrations between vegetative organs and reproductive organs were attributed to the relatively high priority nitrogen sink of fruits and the increases of leaf and root nitrogen use efficiencies. Notably, when we have a better understanding of the mechanisms of strawberry plants to changes in CO2 concentration, nitrogen concentration and temperature, we can optimize various environmental factors to improve the growth of strawberry plants in response to the greenhouse effect and global warming, further contributing to a sustainable fruit production.
Author Contributions
Conceptualization, H.L. (Hongfei Lu); Methodology, P.S.; Validation, X.W.; Formal analysis, X.H., Z.Z., H.L. (Heqiang Lou) and B.J.; Investigation, H.L. (Heqiang Lou); Resources, Y.S. and H.L. (Hongfei Lu); Data curation, P.S.; Writing—original draft, M.Y. and P.S.; Writing—review and editing, M.Y., P.S. and N.M.; Visualization, M.Y.; Project administration, Z.S. All authors have read and agreed to the published version of the manuscript.
Funding
This research received no external funding.
Data Availability Statement
Not applicable.
Acknowledgments
This work was supported by the Zhejiang Provincial Top Key Discipline of Biology and the Zhejiang Provincial Universities Key Discipline of Botany. We thank Dan Sun, Yueqing Zhu, and Ting Dong for participating in some of the experimental work.
Conflicts of Interest
The authors declare no conflict of interest.
References
- Bhargava, S.; Mitra, S. Elevated atmospheric CO2 and the future of crop plants. Plant Breed. 2021, 140, 1–11. [Google Scholar] [CrossRef]
- Dong, J.; Gruda, N.; Lam, S.K.; Li, X.; Duan, Z. Effects of elevated CO2 on nutritional quality of vegetables: A review. Front. Plant Sci. 2018, 9, 924. [Google Scholar] [CrossRef] [PubMed]
- Tagawa, A.; Ehara, M.; Ito, Y.; Araki, T.; Ozaki, Y.; Shishido, Y. Effects of CO2 enrichment on yield, photosynthetic rate, translocation and distribution of photoassimilates in strawberry ‘Sagahonoka’. Agronomy 2022, 12, 473. [Google Scholar] [CrossRef]
- Shimono, H.; Nakamura, H.; Hasegawa, T.; Okada, M. Lower responsiveness of canopy evapotranspiration rate than of leaf stomatal conductance to open-air CO2 elevation in rice. Glob. Chang. Biol. 2013, 19, 2444–2453. [Google Scholar] [CrossRef] [PubMed]
- Yu, L.; Dong, H.; Huang, Z.; Korpelainen, H.; Li, C. Elevated CO2 causes different growth stimulation, water and nitrogen use efficiencies and leaf ultrastructure responses in two conifer species under intra- and interspecific competition. Tree Physiol. 2021, 41, 2082–2095. [Google Scholar] [CrossRef] [PubMed]
- Dusenge, M.E.; Madhavji, S.; Way, D.A. Contrasting acclimation responses to elevated CO2 and warming between an evergreen and a deciduous boreal conifer. Glob. Chang. Biol. 2020, 26, 3639–3657. [Google Scholar] [CrossRef] [PubMed]
- Gámez, A.L.; Han, X.; Aranjuelo, I. Differential effect of Free-Air CO2 Enrichment (FACE) in different organs and growth stages of two cultivars of durum wheat. Plants 2023, 12, 686. [Google Scholar] [CrossRef]
- Zaghdoud, C.; Carvajal, M.; Ferchichi, A.; Martínez-Ballesta, M.C. Water balance and N-metabolism in broccoli (Brassica oleracea L. var. Italica) plants depending on nitrogen source under salt stress and elevated CO2. Sci. Total Environ. 2016, 571, 763–771. [Google Scholar] [CrossRef]
- Liu, C.; Zou, D. Responses of elevated CO2 on photosynthesis and nitrogen metabolism in Ulva lactuca (Chlorophyta) at different temperature levels. Mar. Biol. Res. 2015, 11, 1043–1052. [Google Scholar] [CrossRef]
- Jayawardena, D.M.; Heckathorn, S.A.; Bista, D.R.; Mishra, S.; Boldt, J.K.; Krause, C.R. Elevated CO2 plus chronic warming reduce nitrogen uptake and levels or activities of nitrogen-uptake and -assimilatory proteins in tomato roots. Physiol. Plant. 2017, 159, 354–365. [Google Scholar] [CrossRef]
- Uddin, S.; Löw, M.; Parvin, S.; Fitzgerald, G.J.; Tausz-Posch, S.; Armstrong, R.; O’Leary, G.; Tausz, M. Elevated CO2 mitigates the effect of surface drought by stimulating root growth to access sub-soil water. PLoS ONE 2018, 13, e0198928. [Google Scholar] [CrossRef]
- Hachiya, T.; Sugiura, D.; Kojima, M.; Sato, S.; Yanagisawa, S.; Sakakibara, H.; Terashima, I.; Noguchi, K. High CO2 triggers preferential root growth of Arabidopsis thaliana via two distinct systems under low pH and low N stresses. Plant Cell Physiol. 2014, 55, 269–280. [Google Scholar] [CrossRef] [PubMed]
- Sánchez-Bermúdez, M.; Del Pozo, J.C.; Pernas, M. Effects of combined abiotic stresses related to climate change on root growth in crops. Front. Plant Sci. 2022, 13, 918537. [Google Scholar] [CrossRef]
- Gray, S.B.; Brady, S.M. Plant developmental responses to climate change. Dev. Biol. 2016, 419, 64–77. [Google Scholar] [CrossRef] [PubMed]
- Liu, X.; Yin, C.; Xiang, L.; Jiang, W.; Xu, S.; Mao, Z. Transcription strategies related to photosynthesis and nitrogen metabolism of wheat in response to nitrogen deficiency. BMC Plant Biol. 2020, 20, 448. [Google Scholar] [CrossRef] [PubMed]
- Zhao, H.L.; Chang, T.G.; Xiao, Y.; Zhu, X.G. Potential metabolic mechanisms for inhibited chloroplast nitrogen assimilation under high CO2. Plant Physiol. 2021, 187, 1812–1833. [Google Scholar] [CrossRef]
- Igarashi, M.; Yi, Y.; Yano, K. Revisiting why plants become N deficient under elevated CO2: Importance to meet N demand regardless of the fed-form. Front. Plant Sci. 2021, 12, 726186. [Google Scholar] [CrossRef] [PubMed]
- Wang, Z.; Wang, C. Magnitude and mechanisms of nitrogen-mediated responses of tree biomass production to elevated CO2: A global synthesis. J. Ecol. 2021, 109, 4038–4055. [Google Scholar] [CrossRef]
- Byeon, S.; Song, W.; Park, M.; Kim, S.; Kim, S.; Lee, H.; Jeon, J.; Kim, K.; Lee, M.; Lim, H.; et al. Canopy height affects the allocation of photosynthetic carbon and nitrogen in two deciduous tree species under elevated CO2. J. Plant Physiol. 2022, 268, 153584. [Google Scholar] [CrossRef] [PubMed]
- South, P.F.; Cavanagh, A.P.; Lopez-Calcagno, P.E.; Raines, C.A.; Ort, D.R. Optimizing photorespiration for improved crop productivity. J. Integr. Plant Biol. 2018, 60, 1217–1230. [Google Scholar] [CrossRef]
- Mu, X.; Chen, Y. The physiological response of photosynthesis to nitrogen deficiency. Plant Physiol. Biochem. 2021, 158, 76–82. [Google Scholar] [CrossRef] [PubMed]
- Simpson, D. The economic importance of strawberry crops. In The Genomes of Rosaceous Berries and Their Wild Relatives; Springer: Berlin/Heidelberg, Germany, 2018; pp. 1–7. [Google Scholar] [CrossRef]
- Giampieri, F.; Forbes-Hernandez, T.Y.; Gasparrini, M.; Alvarez-Suarez, J.M.; Afrin, S.; Bompadre, S.; Quiles, J.L.; Mezzetti, B.; Battino, M. Strawberry as a health promoter: An evidence based review. Food Funct. 2015, 6, 1386–1398. [Google Scholar] [CrossRef] [PubMed]
- Li, X.; Lyu, J.; Zheng, H.; Pang, Z.; Sun, Y.; Quan, Y.; Xu, T.; Lu, H. Optimization of blending ratios in asparagus-lemon juice using response surface methodology. Food Sci. Technol. 2023, 43, e108622. [Google Scholar] [CrossRef]
- Khammayom, N.; Maruyama, N.; Chaichana, C. The effect of climatic parameters on strawberry production in a small walk-in greenhouse. AgriEngineering 2022, 4, 104–121. [Google Scholar] [CrossRef]
- Menzel, C.M. Effect of global warming on the yields of strawberry in Queensland: A mini-review. Horticulturae 2023, 9, 142. [Google Scholar] [CrossRef]
- Balasooriya, H.N.; Dassanayake, K.B.; Seneweera, S.; Ajlouni, S. Interaction of elevated carbon dioxide and temperature on strawberry (Fragaria × ananassa) growth and fruit yield. Int. J. Sci. Eng. Technol. 2018, 12, 279–287. [Google Scholar] [CrossRef]
- Sun, P.; Mantri, N.; Lou, H.; Hu, Y.; Sun, D.; Zhu, Y.; Dong, T.; Lu, H. Effects of elevated CO2 and temperature on yield and fruit quality of strawberry (Fragaria × ananassa Duch.) at two levels of nitrogen application. PLoS ONE 2012, 7, e41000. [Google Scholar] [CrossRef]
- Farquhar, G.D.; von Caemmerer, S.; Berry, J.A. A biochemical model of photosynthetic CO2 assimilation in leaves of C3 species. Planta 1980, 149, 78–90. [Google Scholar] [CrossRef]
- Harley, P.C.; Thomas, R.B.; Reynolds, J.F.; Strain, B.R. Modelling photosynthesis of cotton grown in elevated CO2. Plant Cell Environ. 1992, 15, 271–282. [Google Scholar] [CrossRef]
- Ralph, P.J.; Gademann, R. Rapid light curves: A powerful tool to assess photosynthetic activity. Aquat. Bot. 2005, 82, 222–237. [Google Scholar] [CrossRef]
- Borges, C.S.; Vega, R.R.A.; Chakraborty, S.; Weindorf, D.C.; Lopes, G.; Guimarães Guilherme, L.R.; Curi, N.; Li, B.; Ribeiro, B.T. Pocket-sized sensor for controlled, quantitative and instantaneous color acquisition of plant leaves. J. Plant Physiol. 2022, 272, 153686. [Google Scholar] [CrossRef] [PubMed]
- Kandel, B.P. Spad value varies with age and leaf of maize plant and its relationship with grain yield. BMC Res. Notes 2020, 13, 475. [Google Scholar] [CrossRef] [PubMed]
- Xu, L.; Li, J.; Najeeb, U.; Li, X.; Pan, J.; Huang, Q.; Zhou, W.; Liang, Z. Synergistic effects of EDDS and ALA on phytoextraction of cadmium as revealed by biochemical and ultrastructural changes in sunflower (Helianthus annuus L.) tissues. J. Hazard. Mater. 2021, 407, 124764. [Google Scholar] [CrossRef] [PubMed]
- El-Nakhel, C.; Pannico, A.; Kyriacou, M.C.; Petropoulos, S.A.; Giordano, M.; Colla, G.; Troise, A.D.; Vitaglione, P.; De Pascale, S.; Rouphael, Y. Dataset on the organic acids, sulphate, total nitrogen and total chlorophyll contents of two lettuce cultivars grown hydroponically using nutrient solutions of variable macrocation ratios. Data Brief. 2020, 29, 105135. [Google Scholar] [CrossRef]
- Xu, L.; Cao, M.; Wang, Q.; Xu, J.; Liu, C.; Ullah, N.; Li, J.; Hou, Z.; Liang, Z.; Zhou, W.; et al. Insights into the plateau adaptation of Salvia castanea by comparative genomic and WGCNA analyses. J. Adv. Res. 2022, 42, 221–235. [Google Scholar] [CrossRef]
- Kim, J.; Zhang, Y.; Day, J.; Zhou, H. MGLM: An R package for multivariate categorical data analysis. R J. 2018, 10, 73–90. [Google Scholar] [CrossRef]
- Xu, L.; Zhang, W.; Ali, B.; Islam, F.; Zhu, J.; Zhou, W. Synergism of herbicide toxicity by 5-aminolevulinic acid is related to physiological and ultra-structural disorders in crickweed (Malachium aquaticum L.). Pestic. Biochem. Physiol. 2015, 125, 53–61. [Google Scholar] [CrossRef]
- Wang, P.; Ma, J.; Wang, X.; Tan, Q. Rising atmospheric CO2 levels result in an earlier cyanobacterial bloom-maintenance phase with higher algal biomass. Water Res. 2020, 185, 116267. [Google Scholar] [CrossRef]
- Lee, Y.H.; Sang, W.G.; Baek, J.K.; Kim, J.H.; Shin, P.; Seo, M.C.; Cho, J.I. The effect of concurrent elevation in CO2 and temperature on the growth, photosynthesis, and yield of potato crops. PLoS ONE 2020, 15, e0241081. [Google Scholar] [CrossRef]
- Zong, Y.; Shangguang, Z. Increased sink capacity enhances C and N assimilation under drought and elevated CO2 conditions in maize. J. Integr. Agric. 2016, 15, 2775–2785. [Google Scholar] [CrossRef]
- Zheng, Y.; Li, F.; Hao, L.; Yu, J.; Guo, L.; Zhou, H.; Ma, C.; Zhang, X.; Xu, M. Elevated CO2 concentration induces photosynthetic down-regulation with changes in leaf structure, non-structural carbohydrates and nitrogen content of soybean. BMC Plant Biol. 2019, 19, 255. [Google Scholar] [CrossRef] [PubMed]
- Hussain, S.; Ulhassan, Z.; Brestic, M.; Zivcak, M.; Zhou, W.; Allakhverdiev, S.; Yang, X.; Safdar, M.E.; Yang, W.; Liu, W. Photosynthesis research under climate change. Photosynth. Res. 2021, 150, 5–19. [Google Scholar] [CrossRef] [PubMed]
- McClain, A.M.; Cruz, J.A.; Kramer, D.M.; Sharkey, T.D. The time course of acclimation to the stress of triose phosphate use limitation. Plant Cell Environ. 2023, 46, 64–75. [Google Scholar] [CrossRef] [PubMed]
- Marek, M.V.; Šprtová, M.; De Angelis, P.; Scarascia-Mugnozza, G. Spatial distribution of photosynthetic response to long-term influence of elevated CO2 in a mediterranean macchia mini-ecosystem. Plant Sci. 2001, 160, 1125–1136. [Google Scholar] [CrossRef] [PubMed]
- Hymus, G.J.; Baker, N.R.; Long, S.P. Growth in elevated CO2 can both increase and decrease photochemistry and photoinhibition of photosynthesis in a predictable manner. Dactylis glomerata grown in two levels of nitrogen nutrition. Plant Physiol. 2001, 127, 1204–1211. [Google Scholar] [CrossRef] [PubMed]
- van Bezouwen, L.; Caffarri, S.; Kale, R.; Kouřil, R.; Thunnissen, A.M.; Oostergetel, G.; Boekema, E. Subunit and chlorophyll organization of the plant photosystem II supercomplex. Nat. Plants 2017, 3, 17080. [Google Scholar] [CrossRef]
- Garcia-Mendoza, E.; Ocampo-Alvarez, H. Govindjee Photoprotection in the brown alga Macrocystis pyrifera: Evolutionary implications. J. Photochem. Photobiol. B 2011, 104, 377–385. [Google Scholar] [CrossRef]
- Ahn, T.K.; Avenson, T.J.; Ballottari, M.; Cheng, Y.C.; Niyogi, K.K.; Bassi, R.; Fleming, G.R. Architecture of a charge-transfer state regulating light harvesting in a plant antenna protein. Science 2008, 320, 794–797. [Google Scholar] [CrossRef]
- Johnson, M.P.; Pérez-Bueno, M.L.; Zia, A.; Horton, P.; Ruban, A.V. The zeaxanthin-independent and zeaxanthin-dependent qE components of nonphotochemical quenching involve common conformational changes within the photosystem II antenna in Arabidopsis. Plant Physiol. 2009, 149, 1061–1075. [Google Scholar] [CrossRef]
- Lacour, T.; Babin, M.; Lavaud, J. Diversity in xanthophyll cycle pigments content and related Nonphotochemical Quenching (NPQ) among microalgae: Implications for growth strategy and ecology. J. Phycol. 2020, 56, 245–263. [Google Scholar] [CrossRef]
- Fréchette, E.; Wong, C.Y.S.; Junker, L.V.; Chang, C.Y.Y.; Ensminger, I. Zeaxanthin-independent energy quenching and alternative electron sinks cause a decoupling of the relationship between the photochemical reflectance index (PRI) and photosynthesis in an evergreen conifer during spring. J. Exp. Bot. 2015, 66, 7309–7323. [Google Scholar] [CrossRef] [PubMed]
- Liu, P.; Wu, X.; Gong, B.; Lü, G.; Li, J.; Gao, H. Review of the mechanisms by which transcription factors and exogenous substances regulate ROS metabolism under abiotic stress. Antioxidants 2022, 11, 2106. [Google Scholar] [CrossRef] [PubMed]
- Agüera, E.; De la Haba, P. Leaf senescence in response to elevated atmospheric CO2 concentration and low nitrogen supply. Biol. Plant 2018, 62, 401–408. [Google Scholar] [CrossRef]
- Li, L.; Wang, X.; Manning, W.J. Effects of elevated CO2 on leaf senescence, leaf nitrogen resorption, and late-season photosynthesis in Tilia americana L. Front. Plant Sci. 2019, 10, 1217. [Google Scholar] [CrossRef]
- Wang, R.; Wang, H.; Jiang, G.; Liu, J.; Yin, H.; Xie, B.; Che, Z.; Jiang, F.; Zhang, T. Effect of nitrogen application on root and yield traits of chinese spring wheat (Triticum aestivum L.) under drip irrigation. Agronomy 2022, 12, 2618. [Google Scholar] [CrossRef]
- Qi, D.; Hu, T.; Song, X.; Zhang, M. Effect of nitrogen supply method on root growth and grain yield of maize under alternate partial root-zone irrigation. Sci. Rep. 2019, 9, 8191. [Google Scholar] [CrossRef] [PubMed]
- Postma, J.A.; Lynch, J.P. Root cortical aerenchyma enhances the growth of maize on soils with suboptimal availability of nitrogen, phosphorus, and potassium. Plant Physiol. 2011, 156, 1190–1201. [Google Scholar] [CrossRef]
- Taub, D.R.; Wang, X. Why are nitrogen concentrations in plant tissues lower under elevated CO2? A critical examination of the hypotheses. J. Integr. Plant Biol. 2008, 50, 1365–1374. [Google Scholar] [CrossRef]
- Han, Q.; Kabeya, D.; Inagaki, Y. Influence of reproduction on nitrogen uptake and allocation to new organs in Fagus crenata. Tree Physiol. 2017, 37, 1436–1443. [Google Scholar] [CrossRef]
- Kızıldeniz, T.; Mekni, I.; Santesteban, H.; Pascual, I.; Morales, F.; Irigoyen, J.J. Effects of climate change including elevated CO2 concentration, temperature and water deficit on growth, water status, and yield quality of grapevine (Vitis vinifera L.) cultivars. Agric. Water Manag. 2015, 159, 155–164. [Google Scholar] [CrossRef]
- Li, C.; Zhu, J.; Sha, L.N.; Zhang, J.; Zeng, Q.; Liu, G. Rice (Oryza sativa L.) growth and nitrogen distribution under elevated CO2 concentration and air temperature. Ecol. Res. 2017, 32, 405–411. [Google Scholar] [CrossRef]
- Gong, Z.; Xiong, L.; Shi, H.; Yang, S.; Herrera-Estrella, L.R.; Xu, G.; Chao, D.Y.; Li, J.; Wang, P.Y.; Qin, F.; et al. Plant abiotic stress response and nutrient use efficiency. Sci. China Life Sci. 2020, 63, 635–674. [Google Scholar] [CrossRef] [PubMed]
Disclaimer/Publisher’s Note: The statements, opinions and data contained in all publications are solely those of the individual author(s) and contributor(s) and not of MDPI and/or the editor(s). MDPI and/or the editor(s) disclaim responsibility for any injury to people or property resulting from any ideas, methods, instructions or products referred to in the content. |
© 2023 by the authors. Licensee MDPI, Basel, Switzerland. This article is an open access article distributed under the terms and conditions of the Creative Commons Attribution (CC BY) license (https://creativecommons.org/licenses/by/4.0/).