


Data Mining and Machine Learning Algorithms for Optimizing Maize Yield Forecasting in Central Europe

 ,
,  , ,
, ,  and
and 
Abstract
1. Introduction
2. Materials and Methods
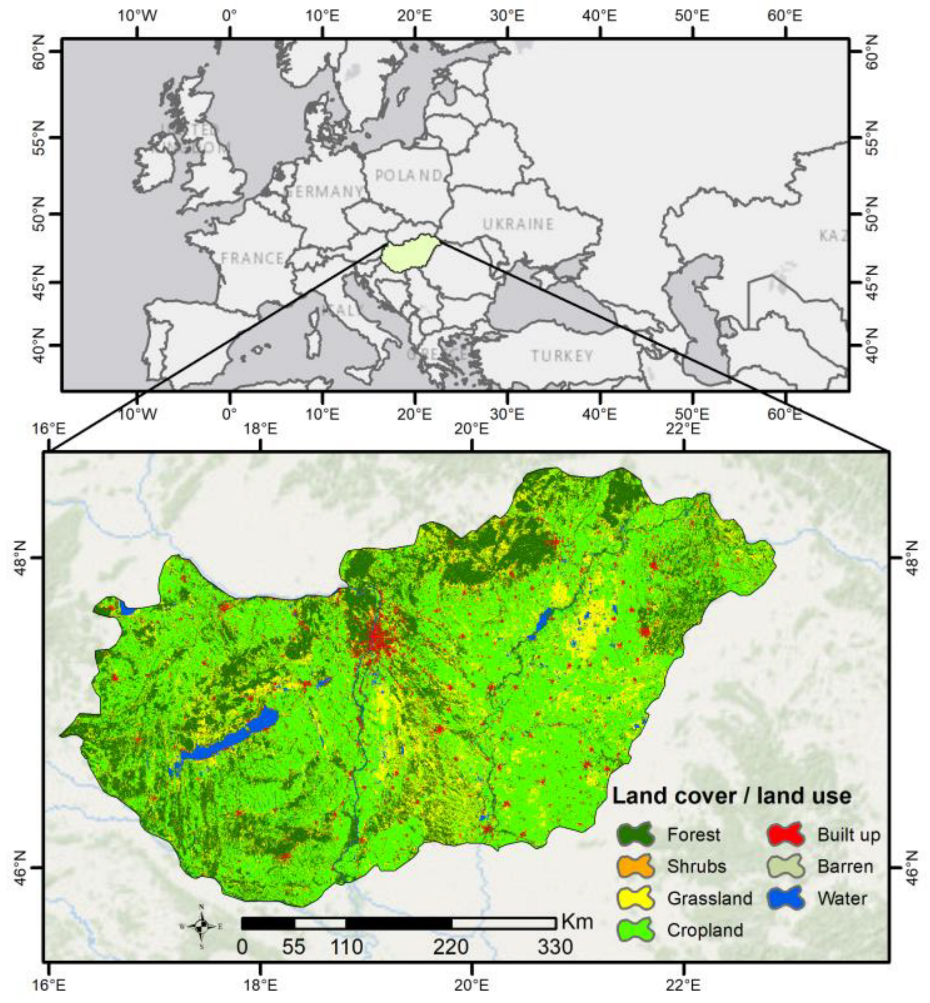
2.1. Study Area
2.2. The Data Set
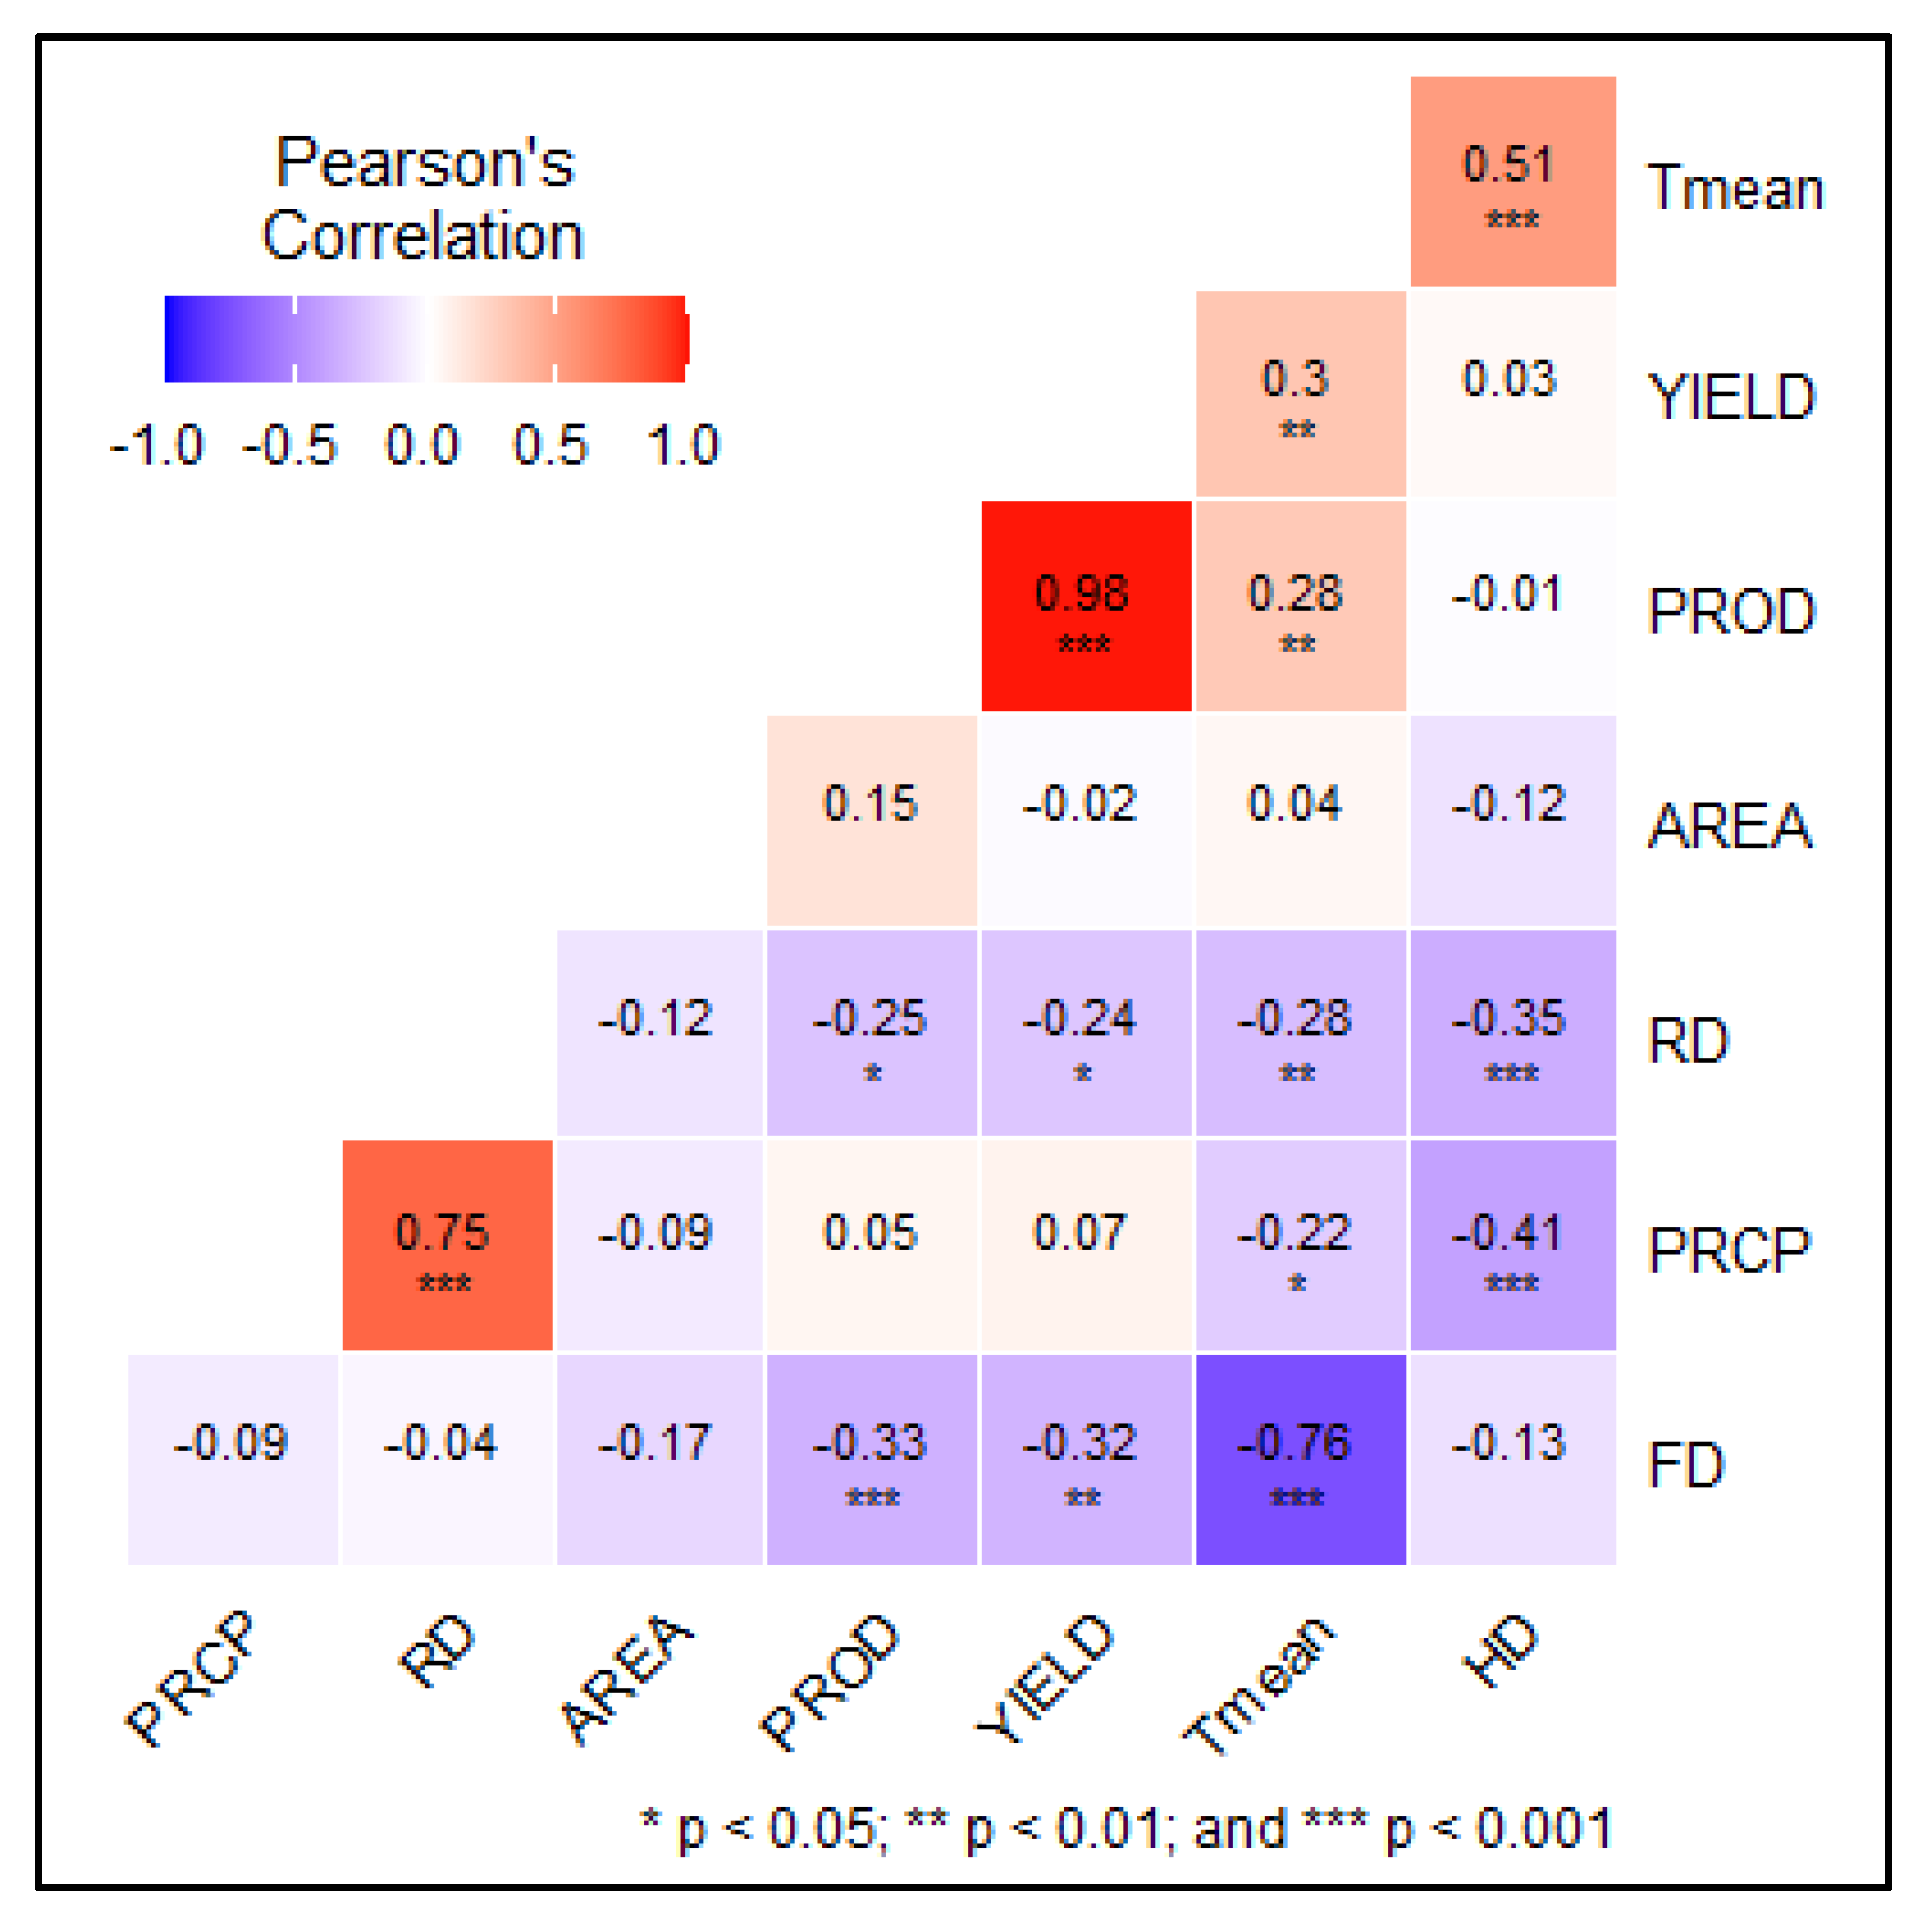
2.3. Trend (Mann–Kendall, Sen’s Slope and Sequential Mann–Kendall) and Correlation Analysis
2.4. The Methodology and Machine Learning Models Used for Maize Yield Prediction
2.4.1. The Bagging Algorithm
2.4.2. The Decision Table Algorithm
2.4.3. The Random Forest Algorithm
2.4.4. Artificial Neural Network-Multi Layer Perceptron (ANN-MLP)
2.4.5. ML Performance
3. Results
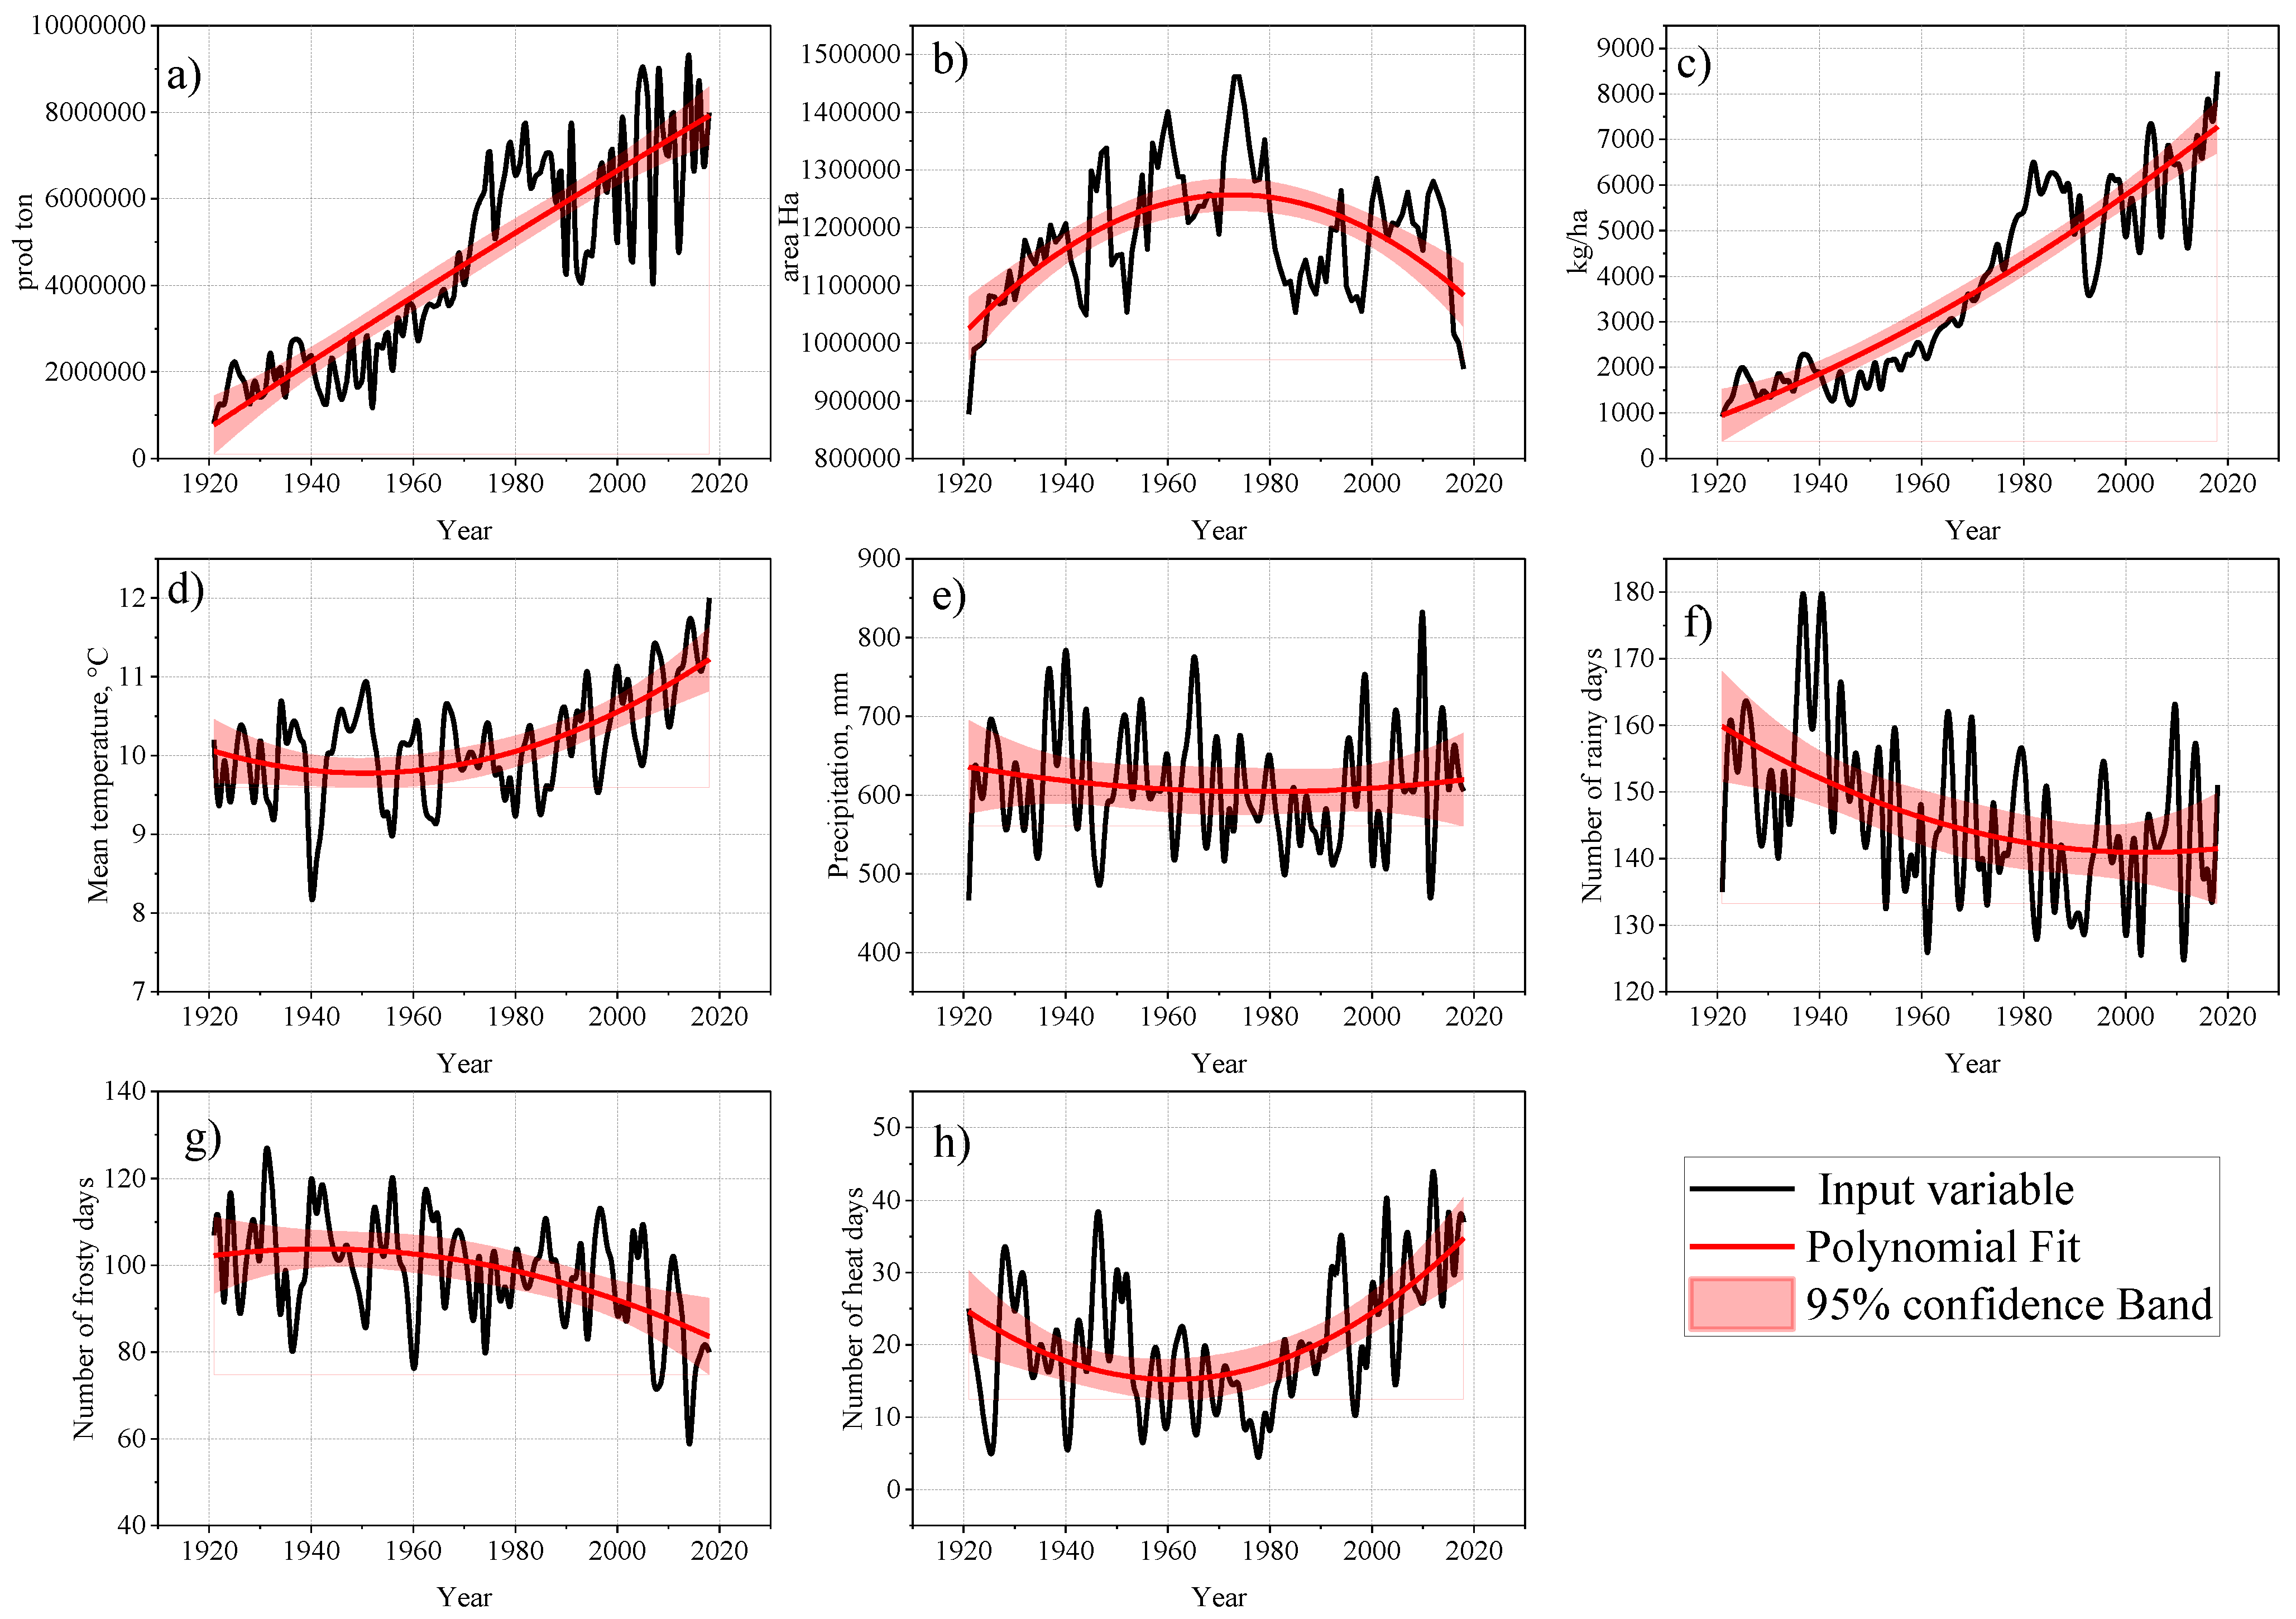
3.1. Trend Analysis of Variables
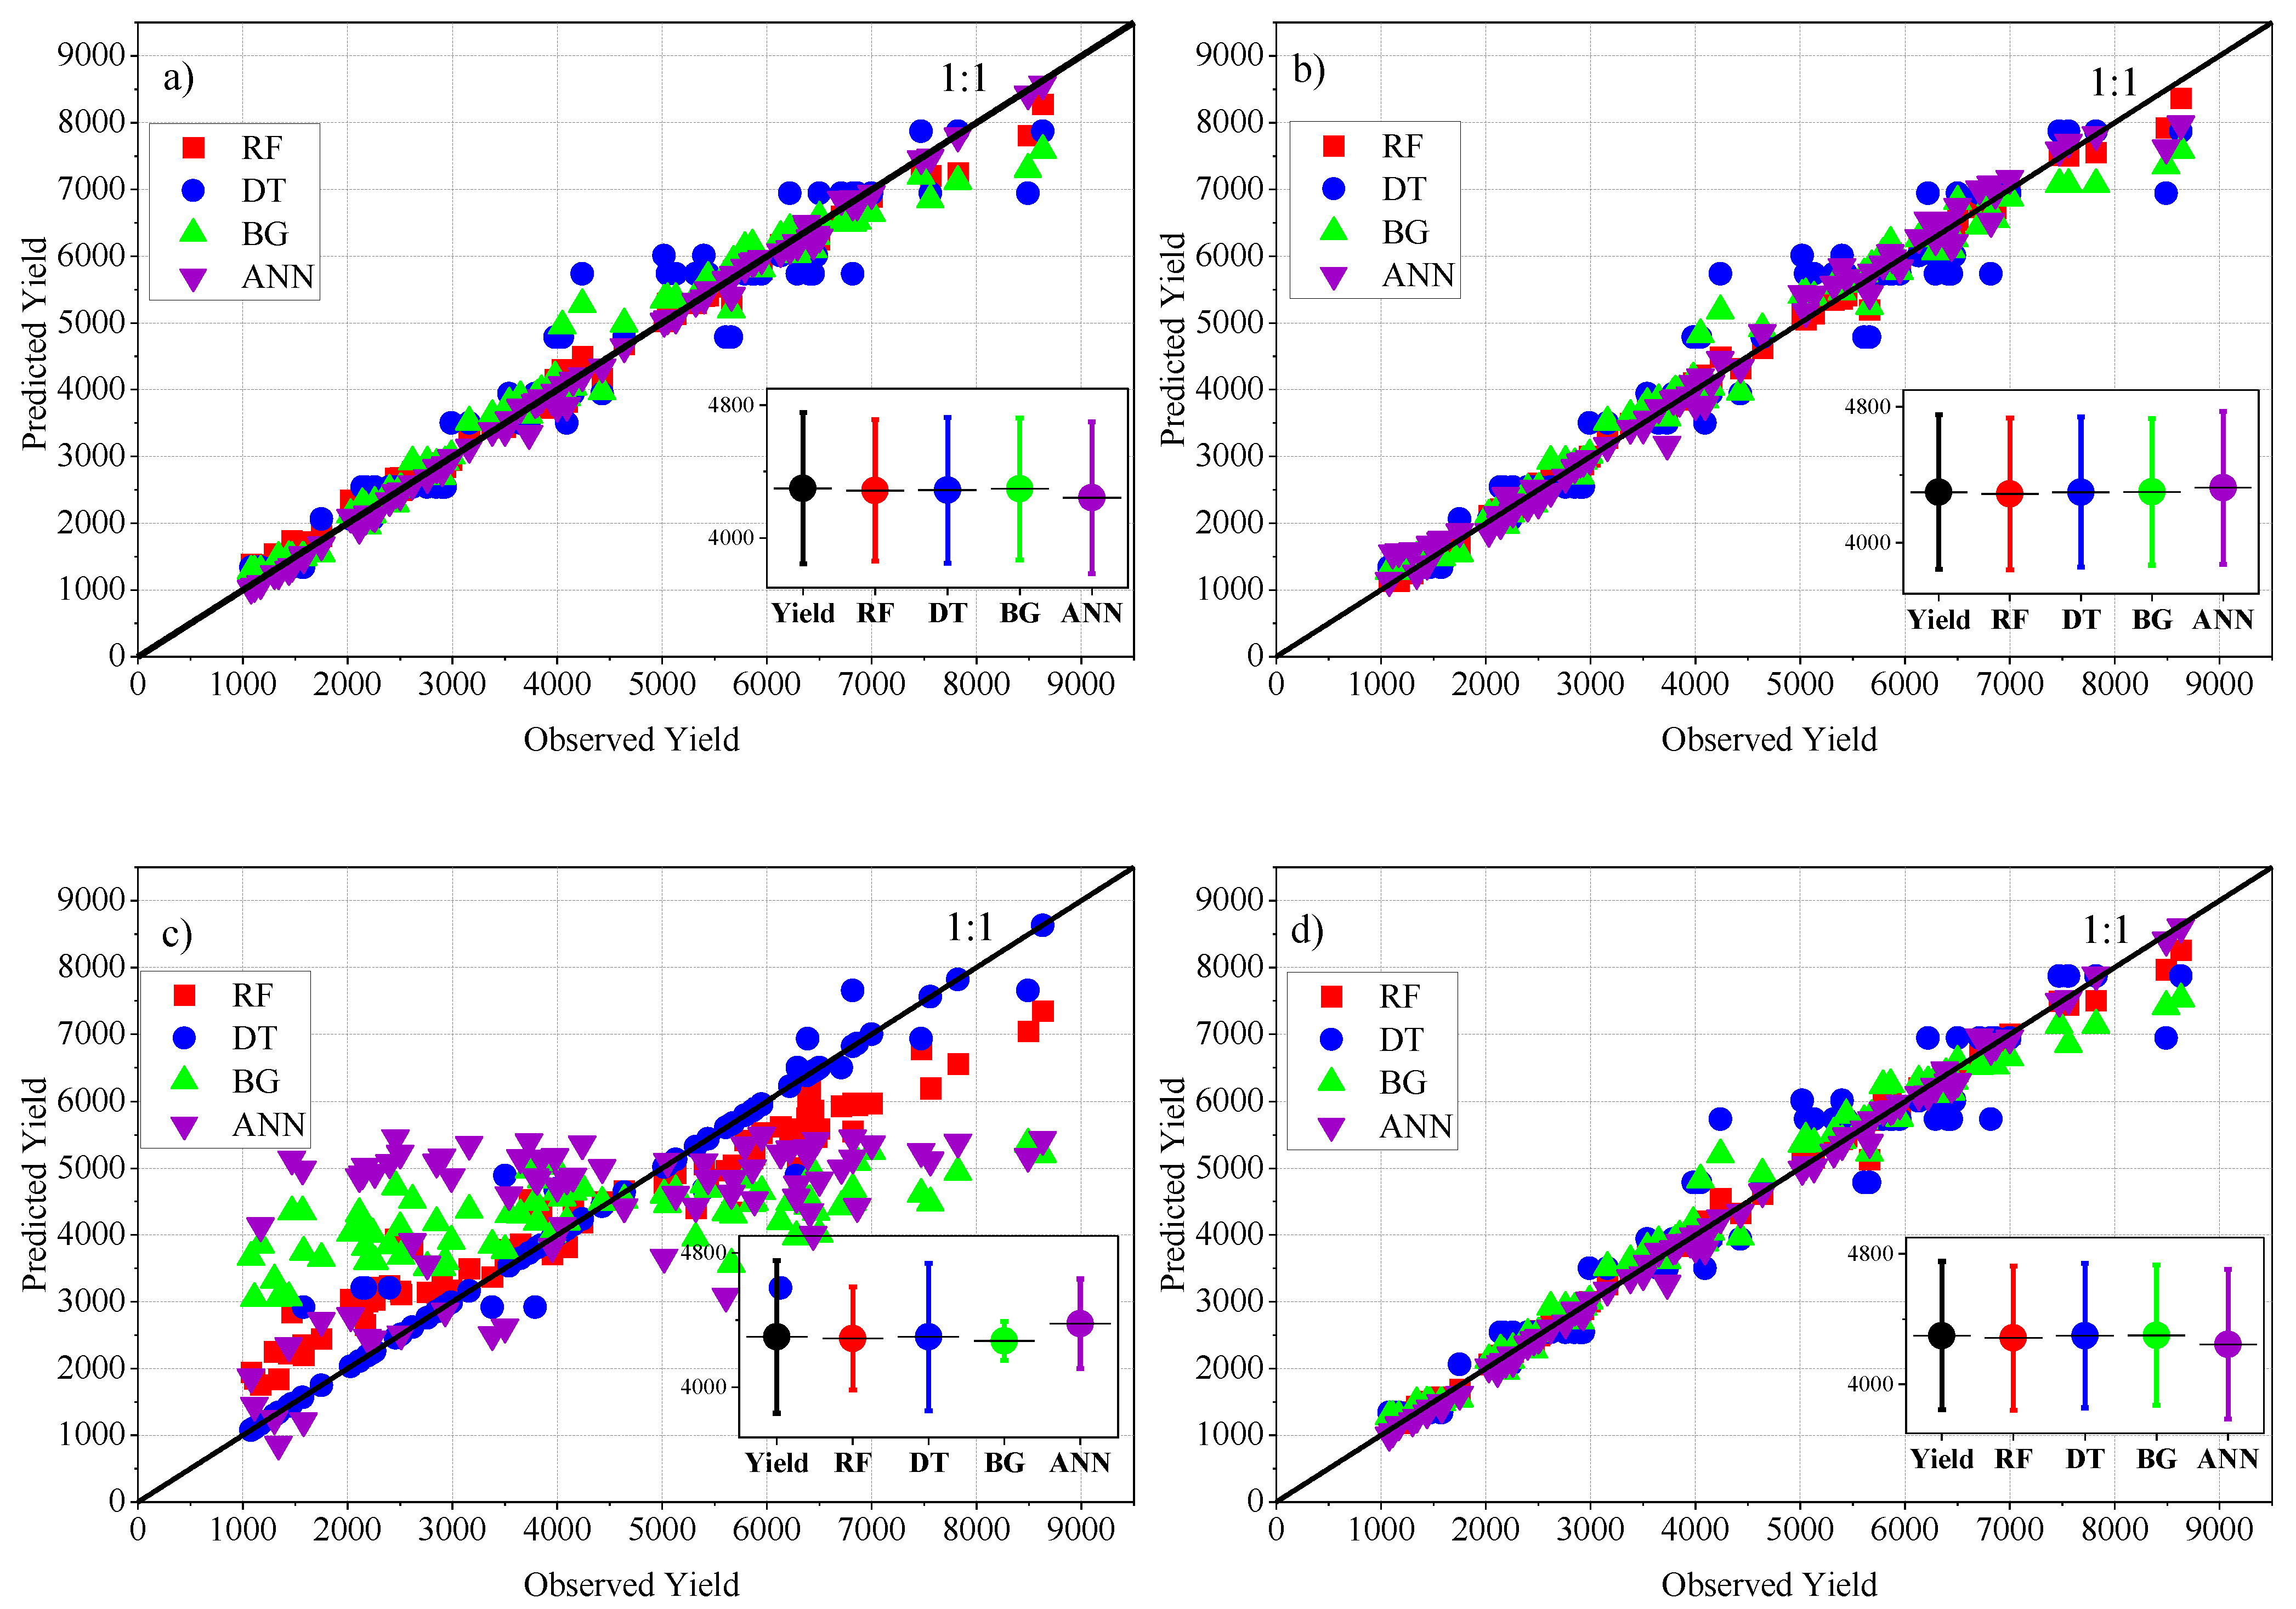
3.2. ML Performance in the Training and Testing Stage
3.3. ML Performance in the Cross-Validation Stage
3.4. Exploring the Flexibility of Machine Learning Algorithms for Predicting Maize Yield at a Regional Scale in Hungary
4. Discussion
4.1. Climatic Influence on Maize Yield Prediction
4.2. Machine Learning Algorithms for Better Optimization of Maize Yield
5. Research Limitations and Model Uncertainties
6. Conclusions
- Maize production and area were significantly increased across Hungary between 1921 and 2018, as shown by Sen’s slopes of 1.78 and 10.35 (p < 0.05), respectively. Similar positive rising trends were observed for the Tmean and HD (Sen’s slopes: of 0.01 and 0.094, respectively). In contrast, PRCP, RD and FD exhibited declining trends with negative Sen’s slopes of −0.24, −0.18 and −0.191, respectively.
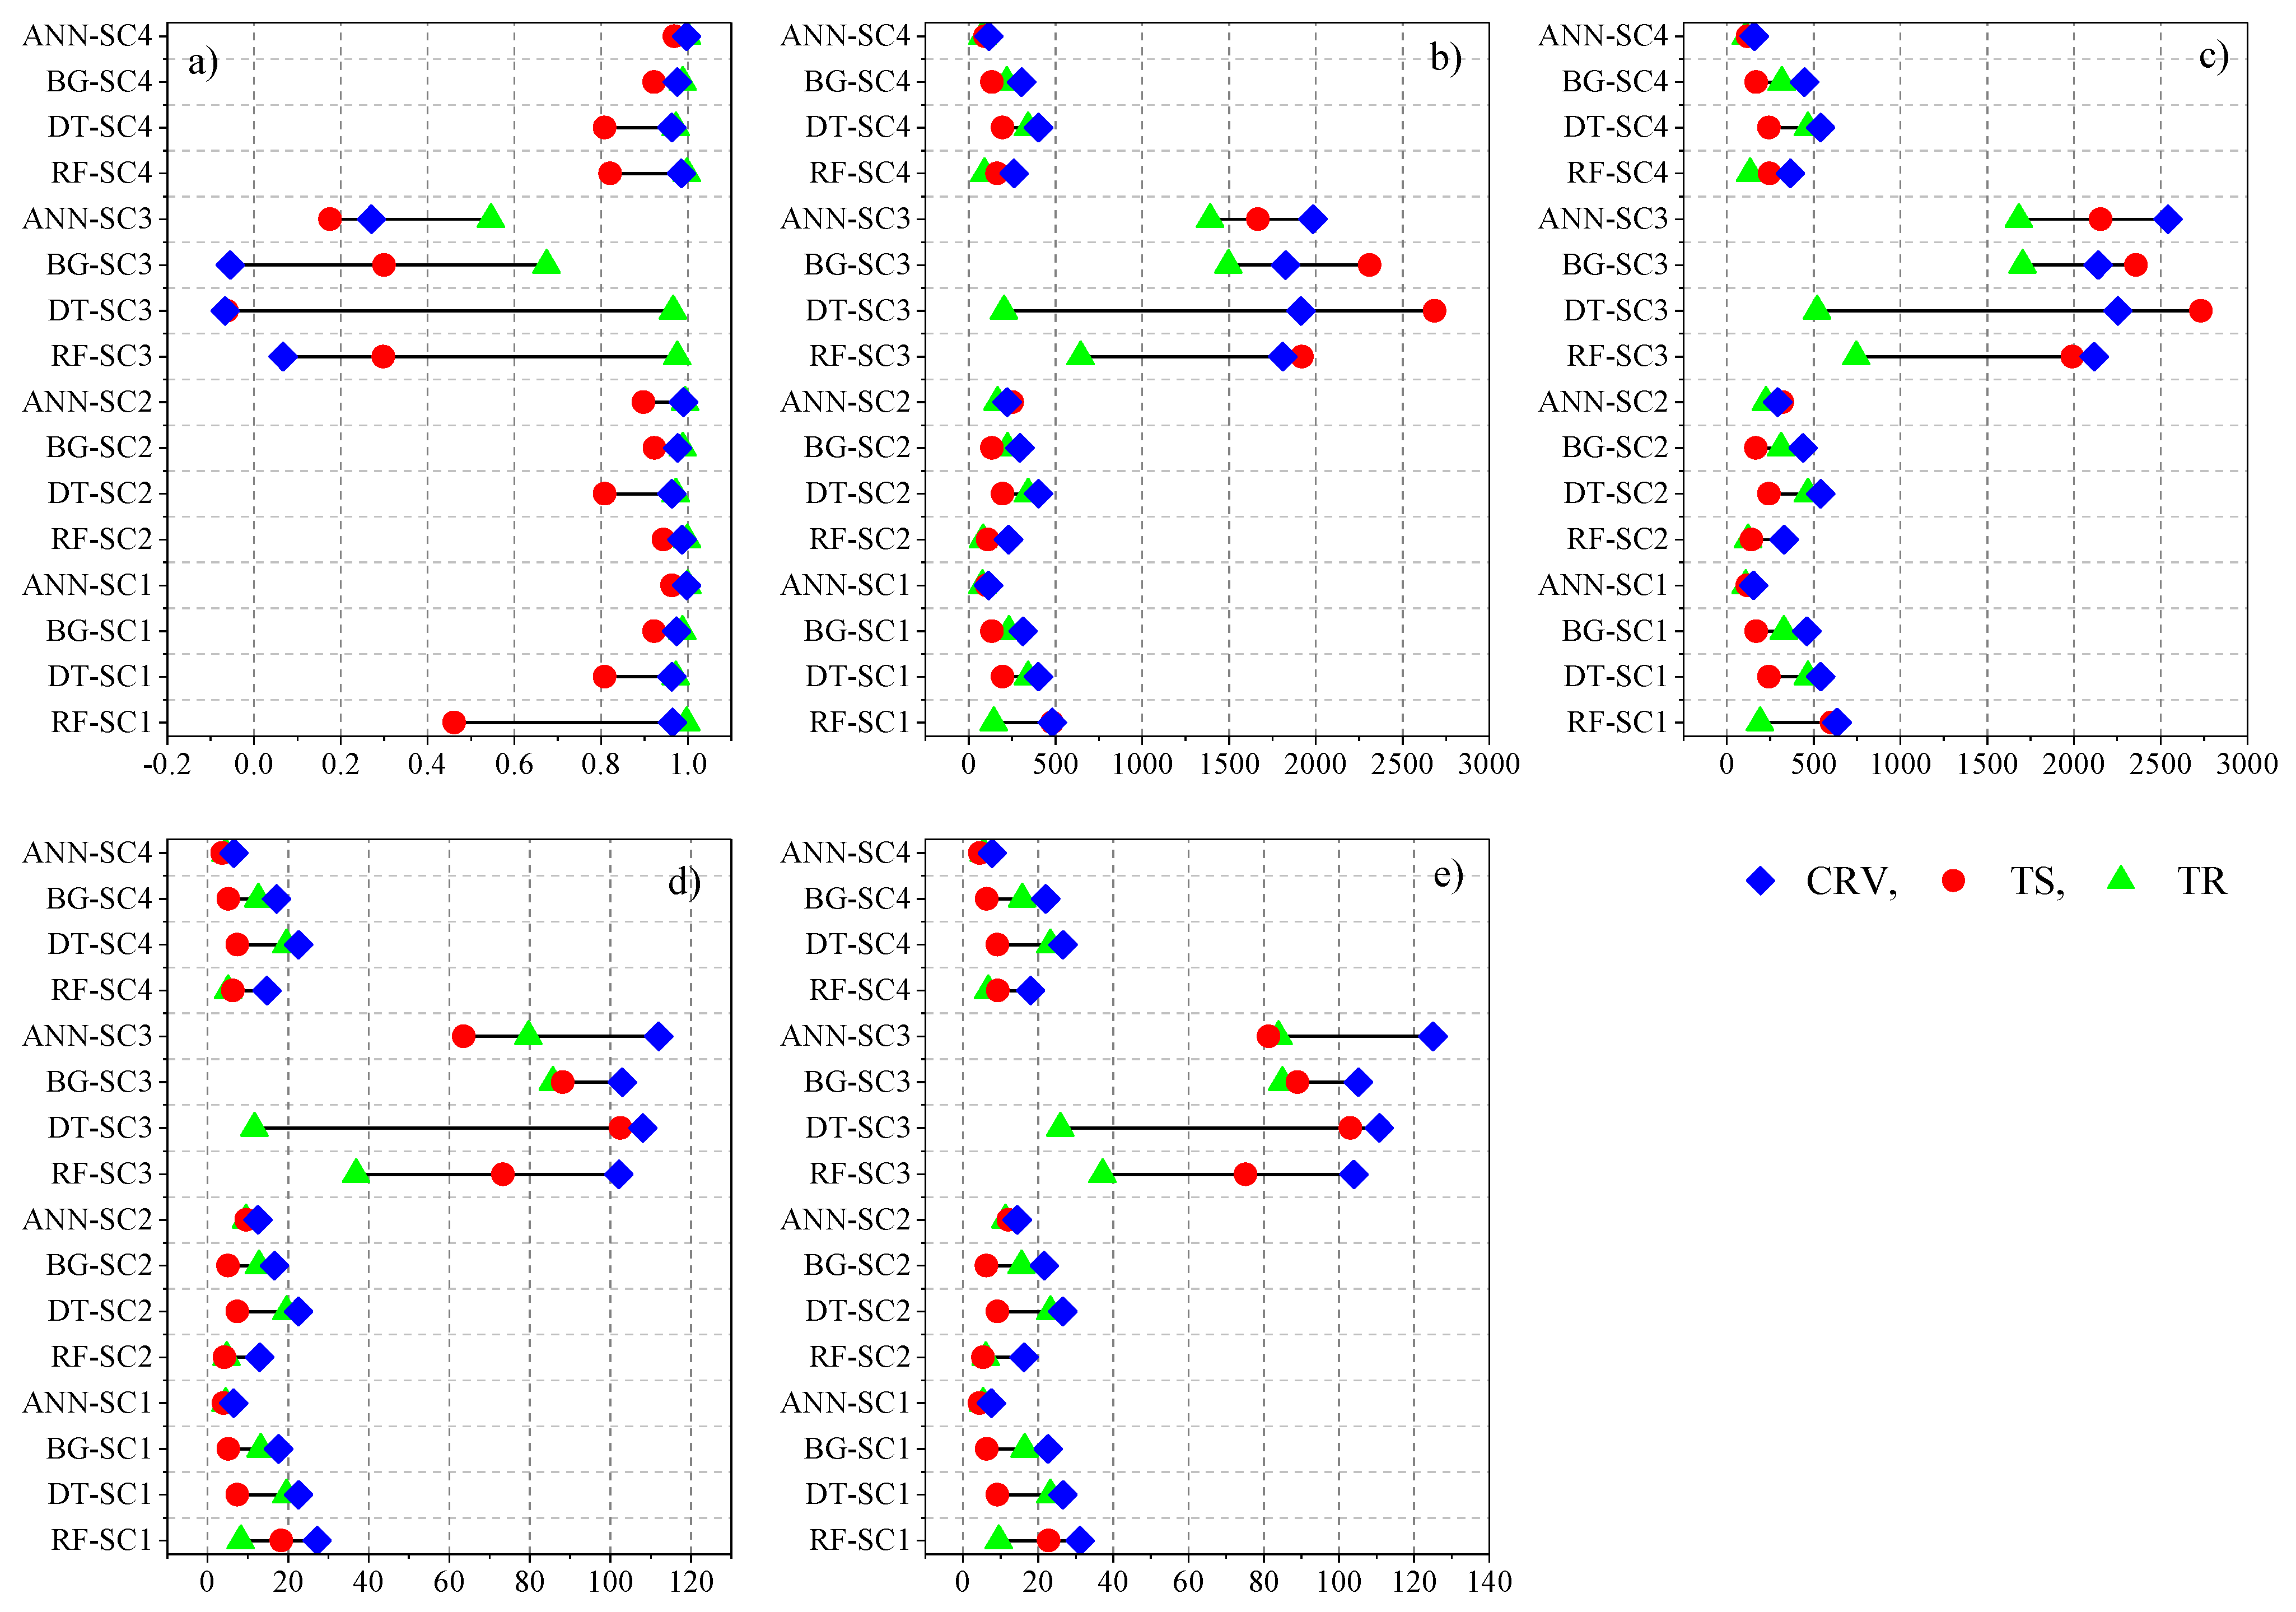
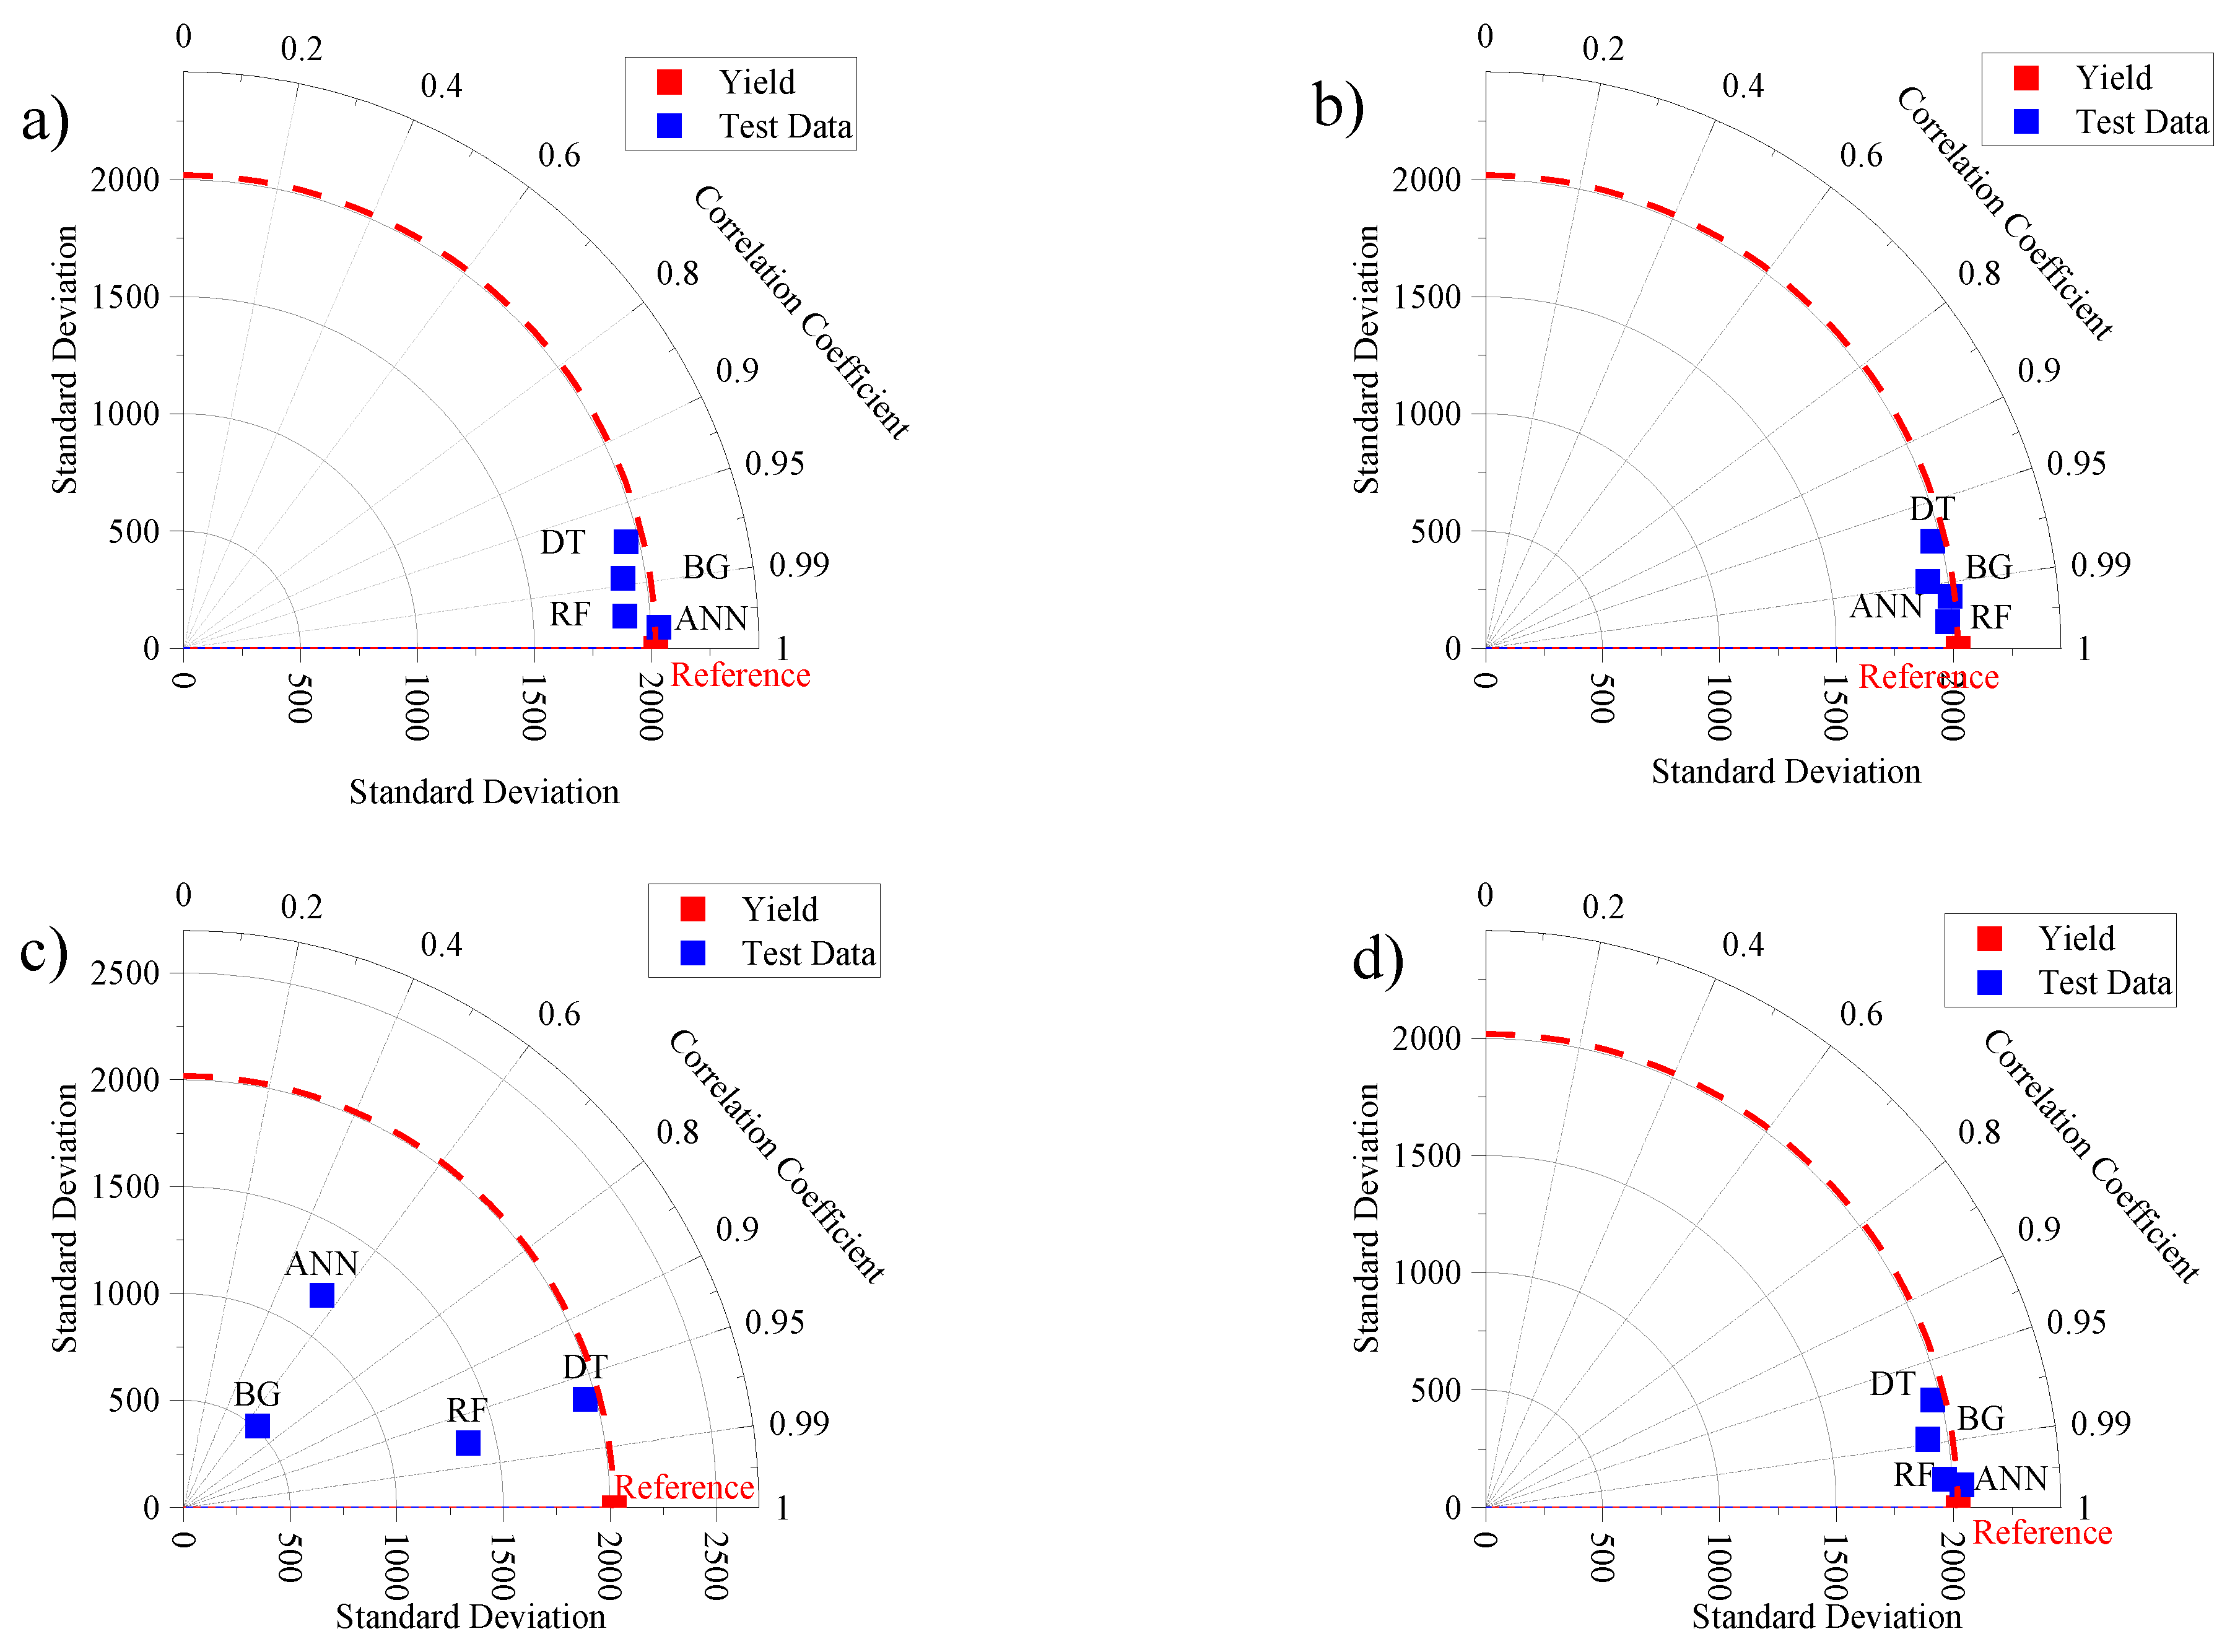
- In the training stage, the majority of the algorithms showed a high flexibility in predicting maize yield regardless of the applied scenario, where the r value ranged between 0.99 (ANN-MLP-SC4, ANN-MLP-SC1, RF-SC1, RF-SC2, RF-SC3 and RF-SC4) and 0.54 (ANN-MLP-SC3), and the RMSE ranged between 107.9 (ANN-MLP-SC1) and 1704.8 (BG-SC3);
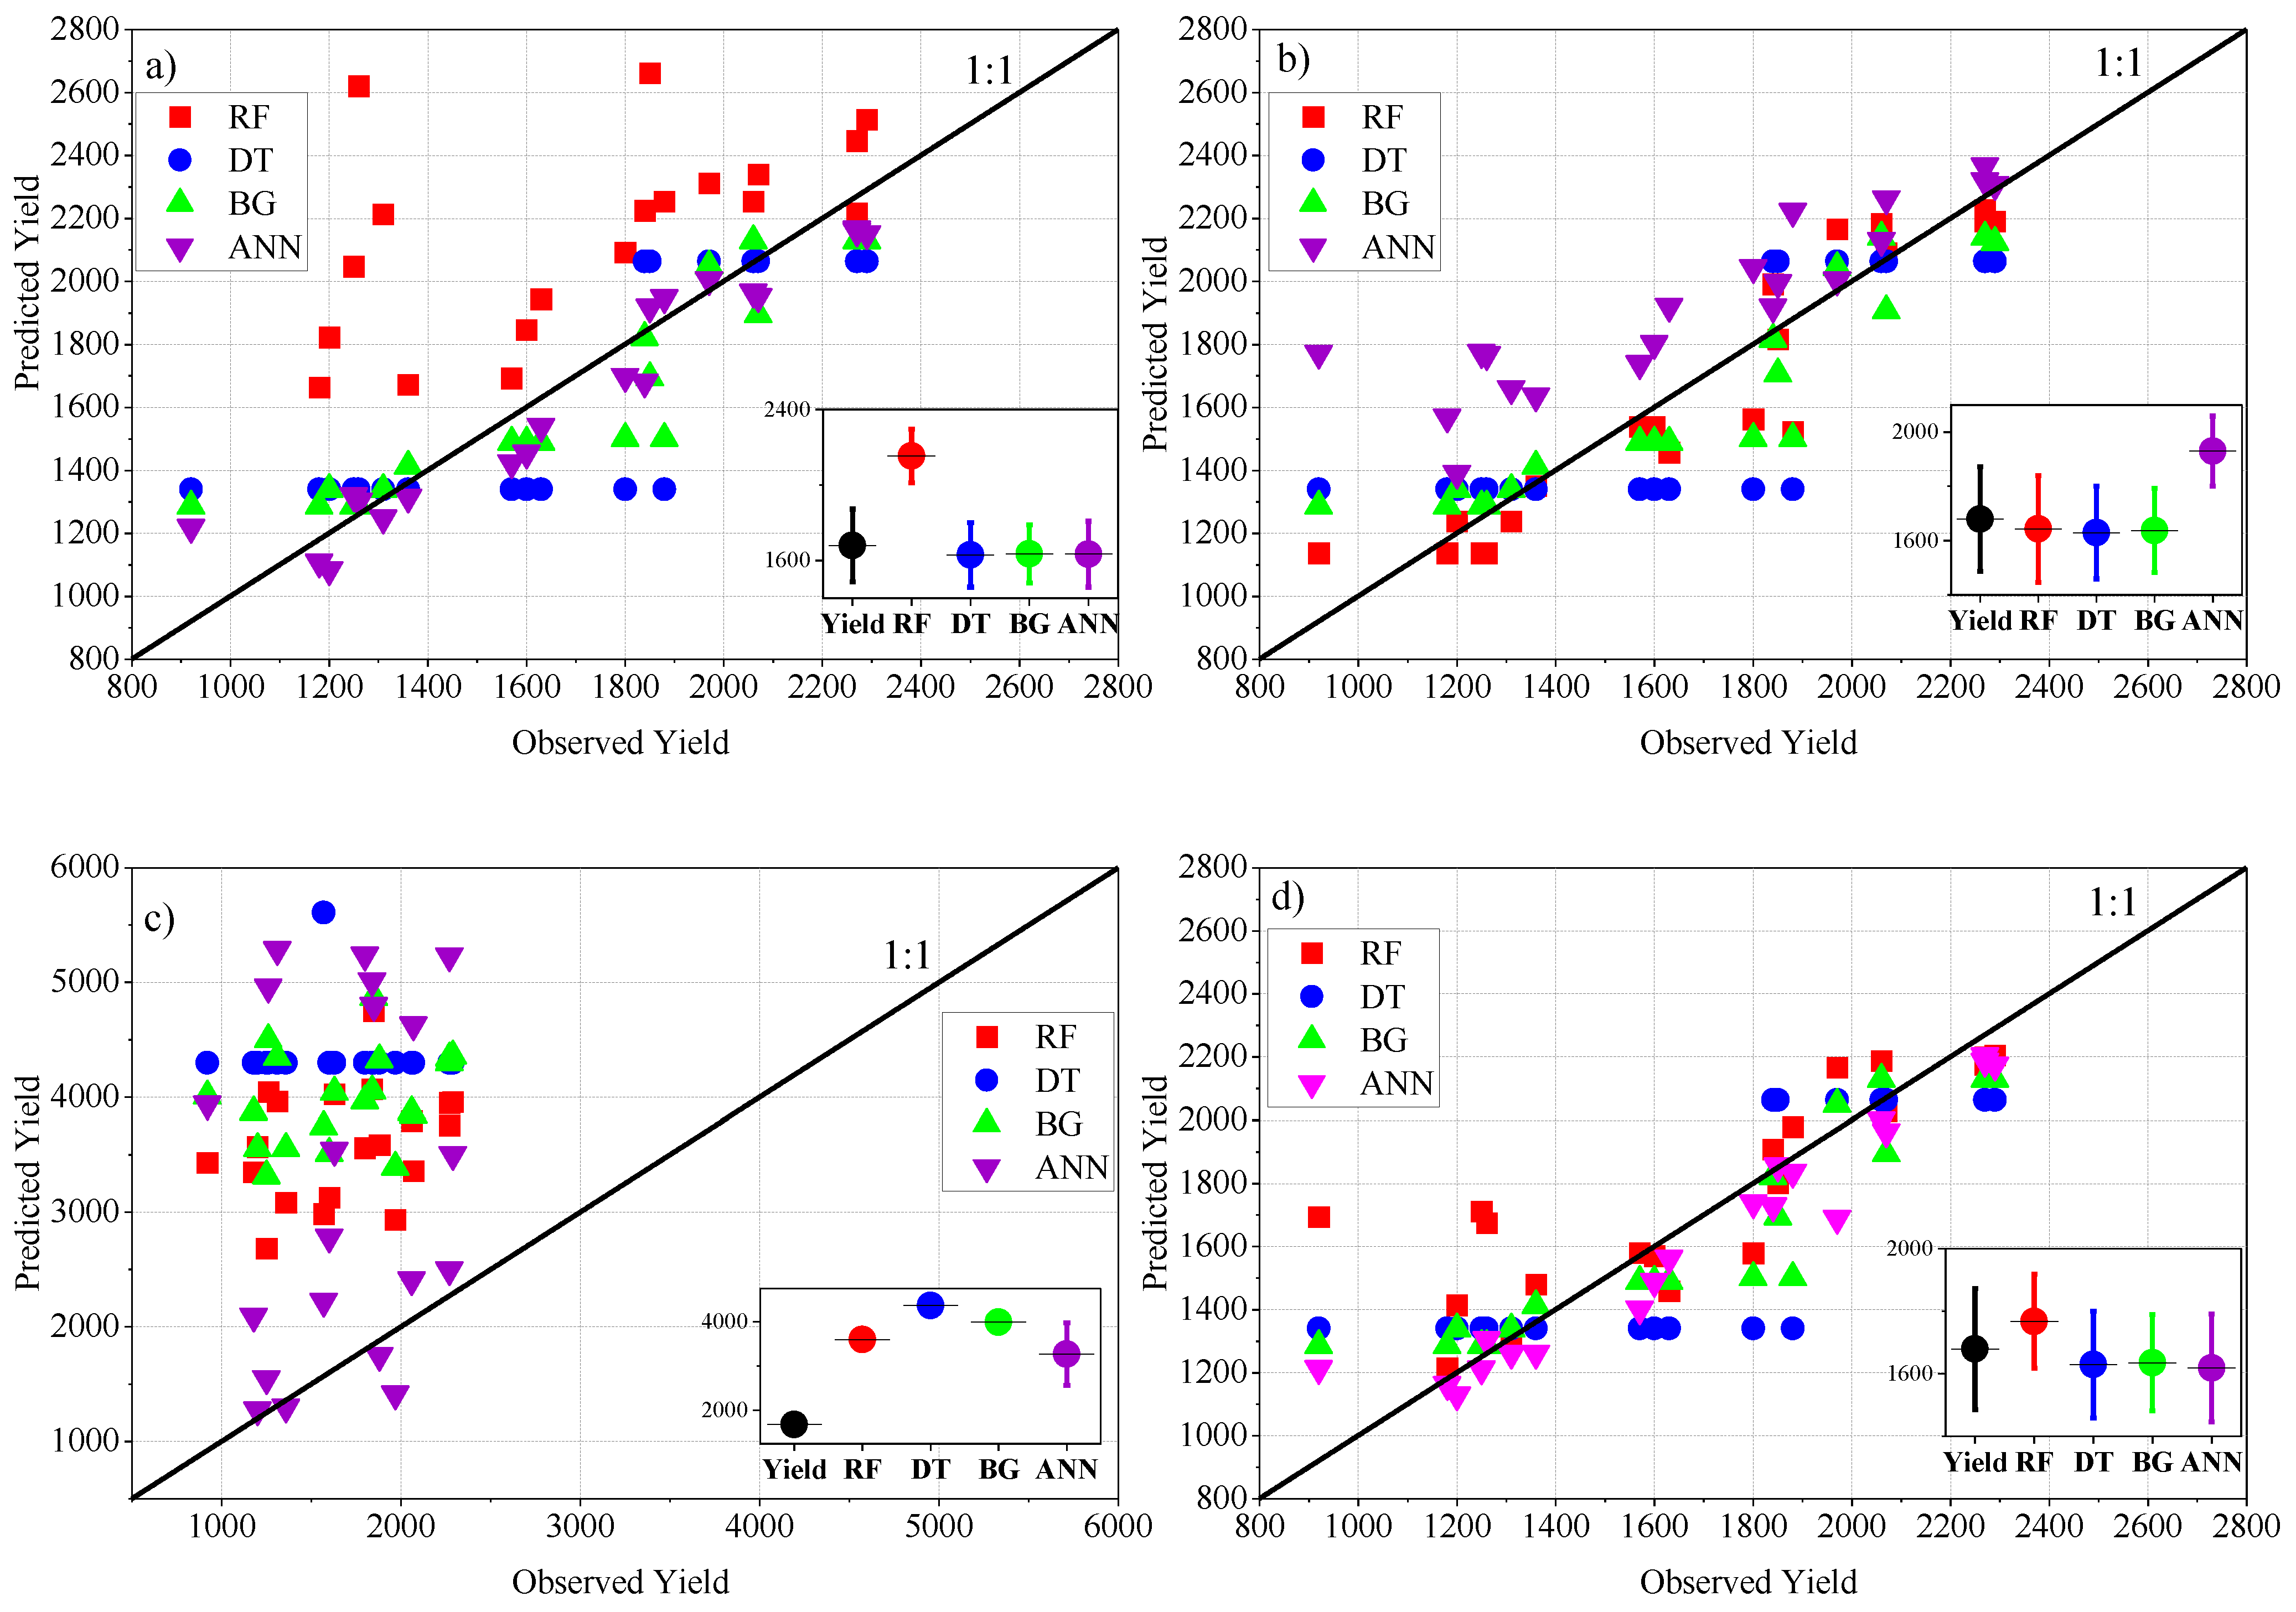
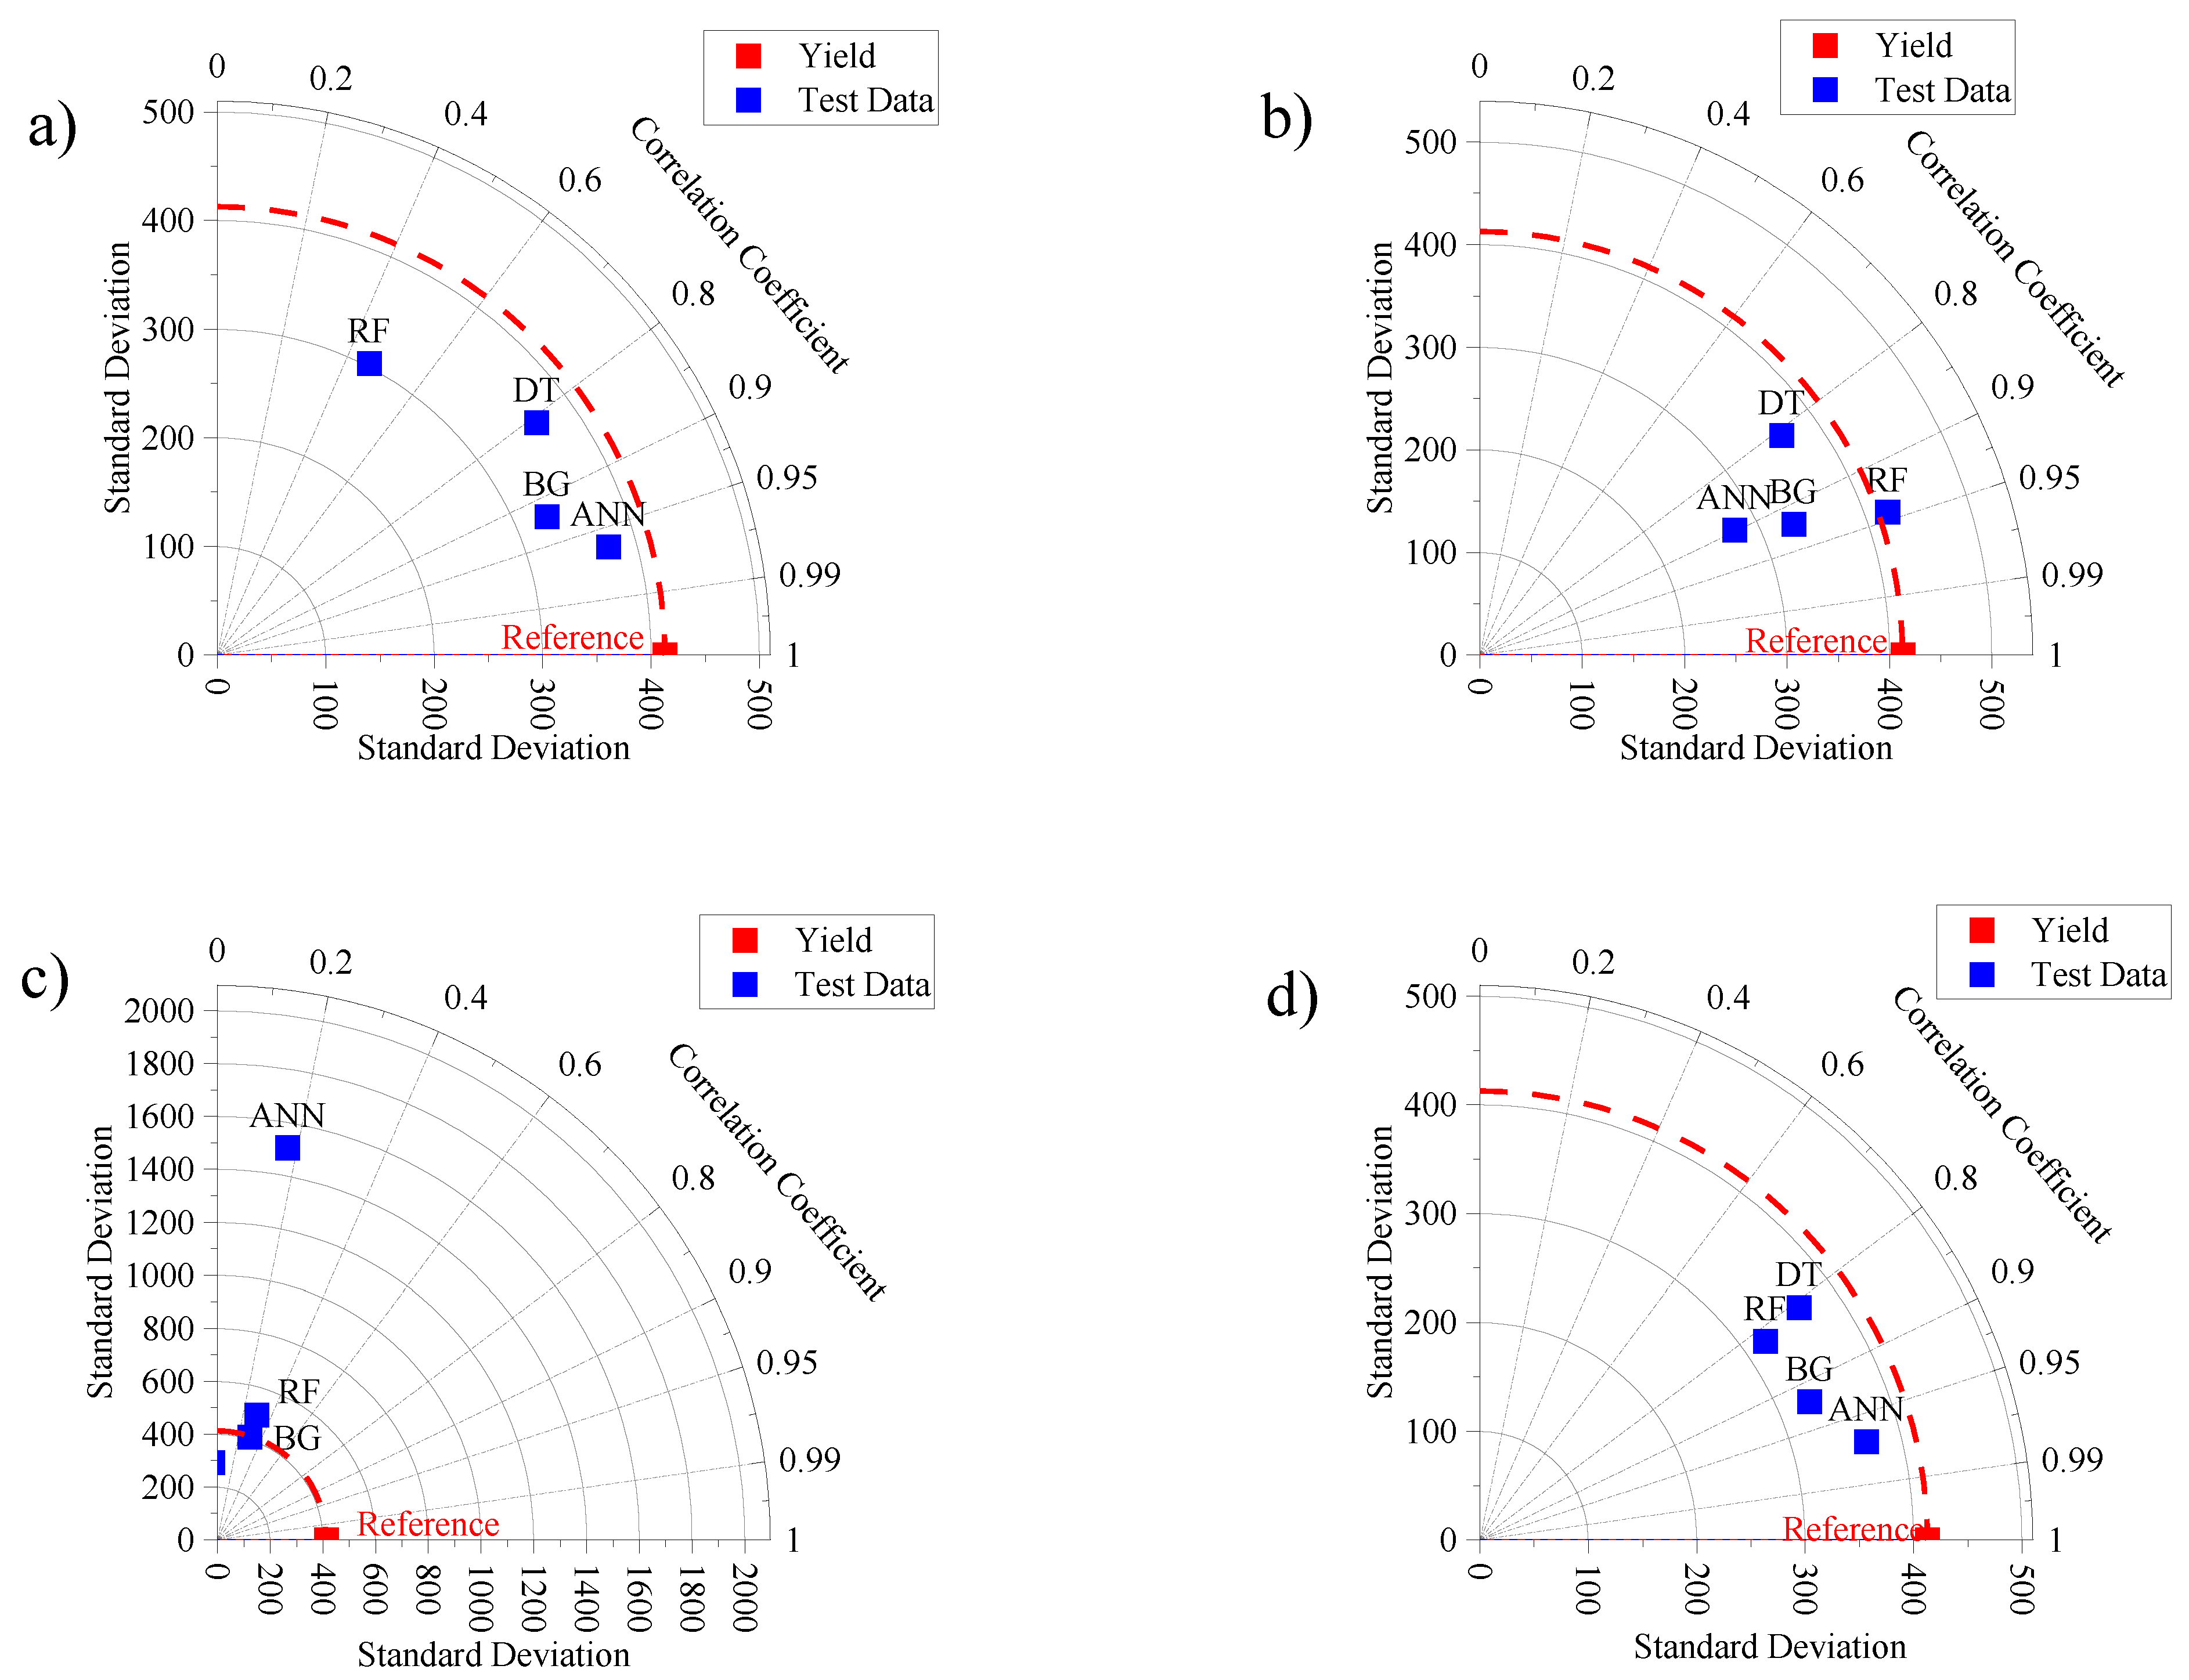
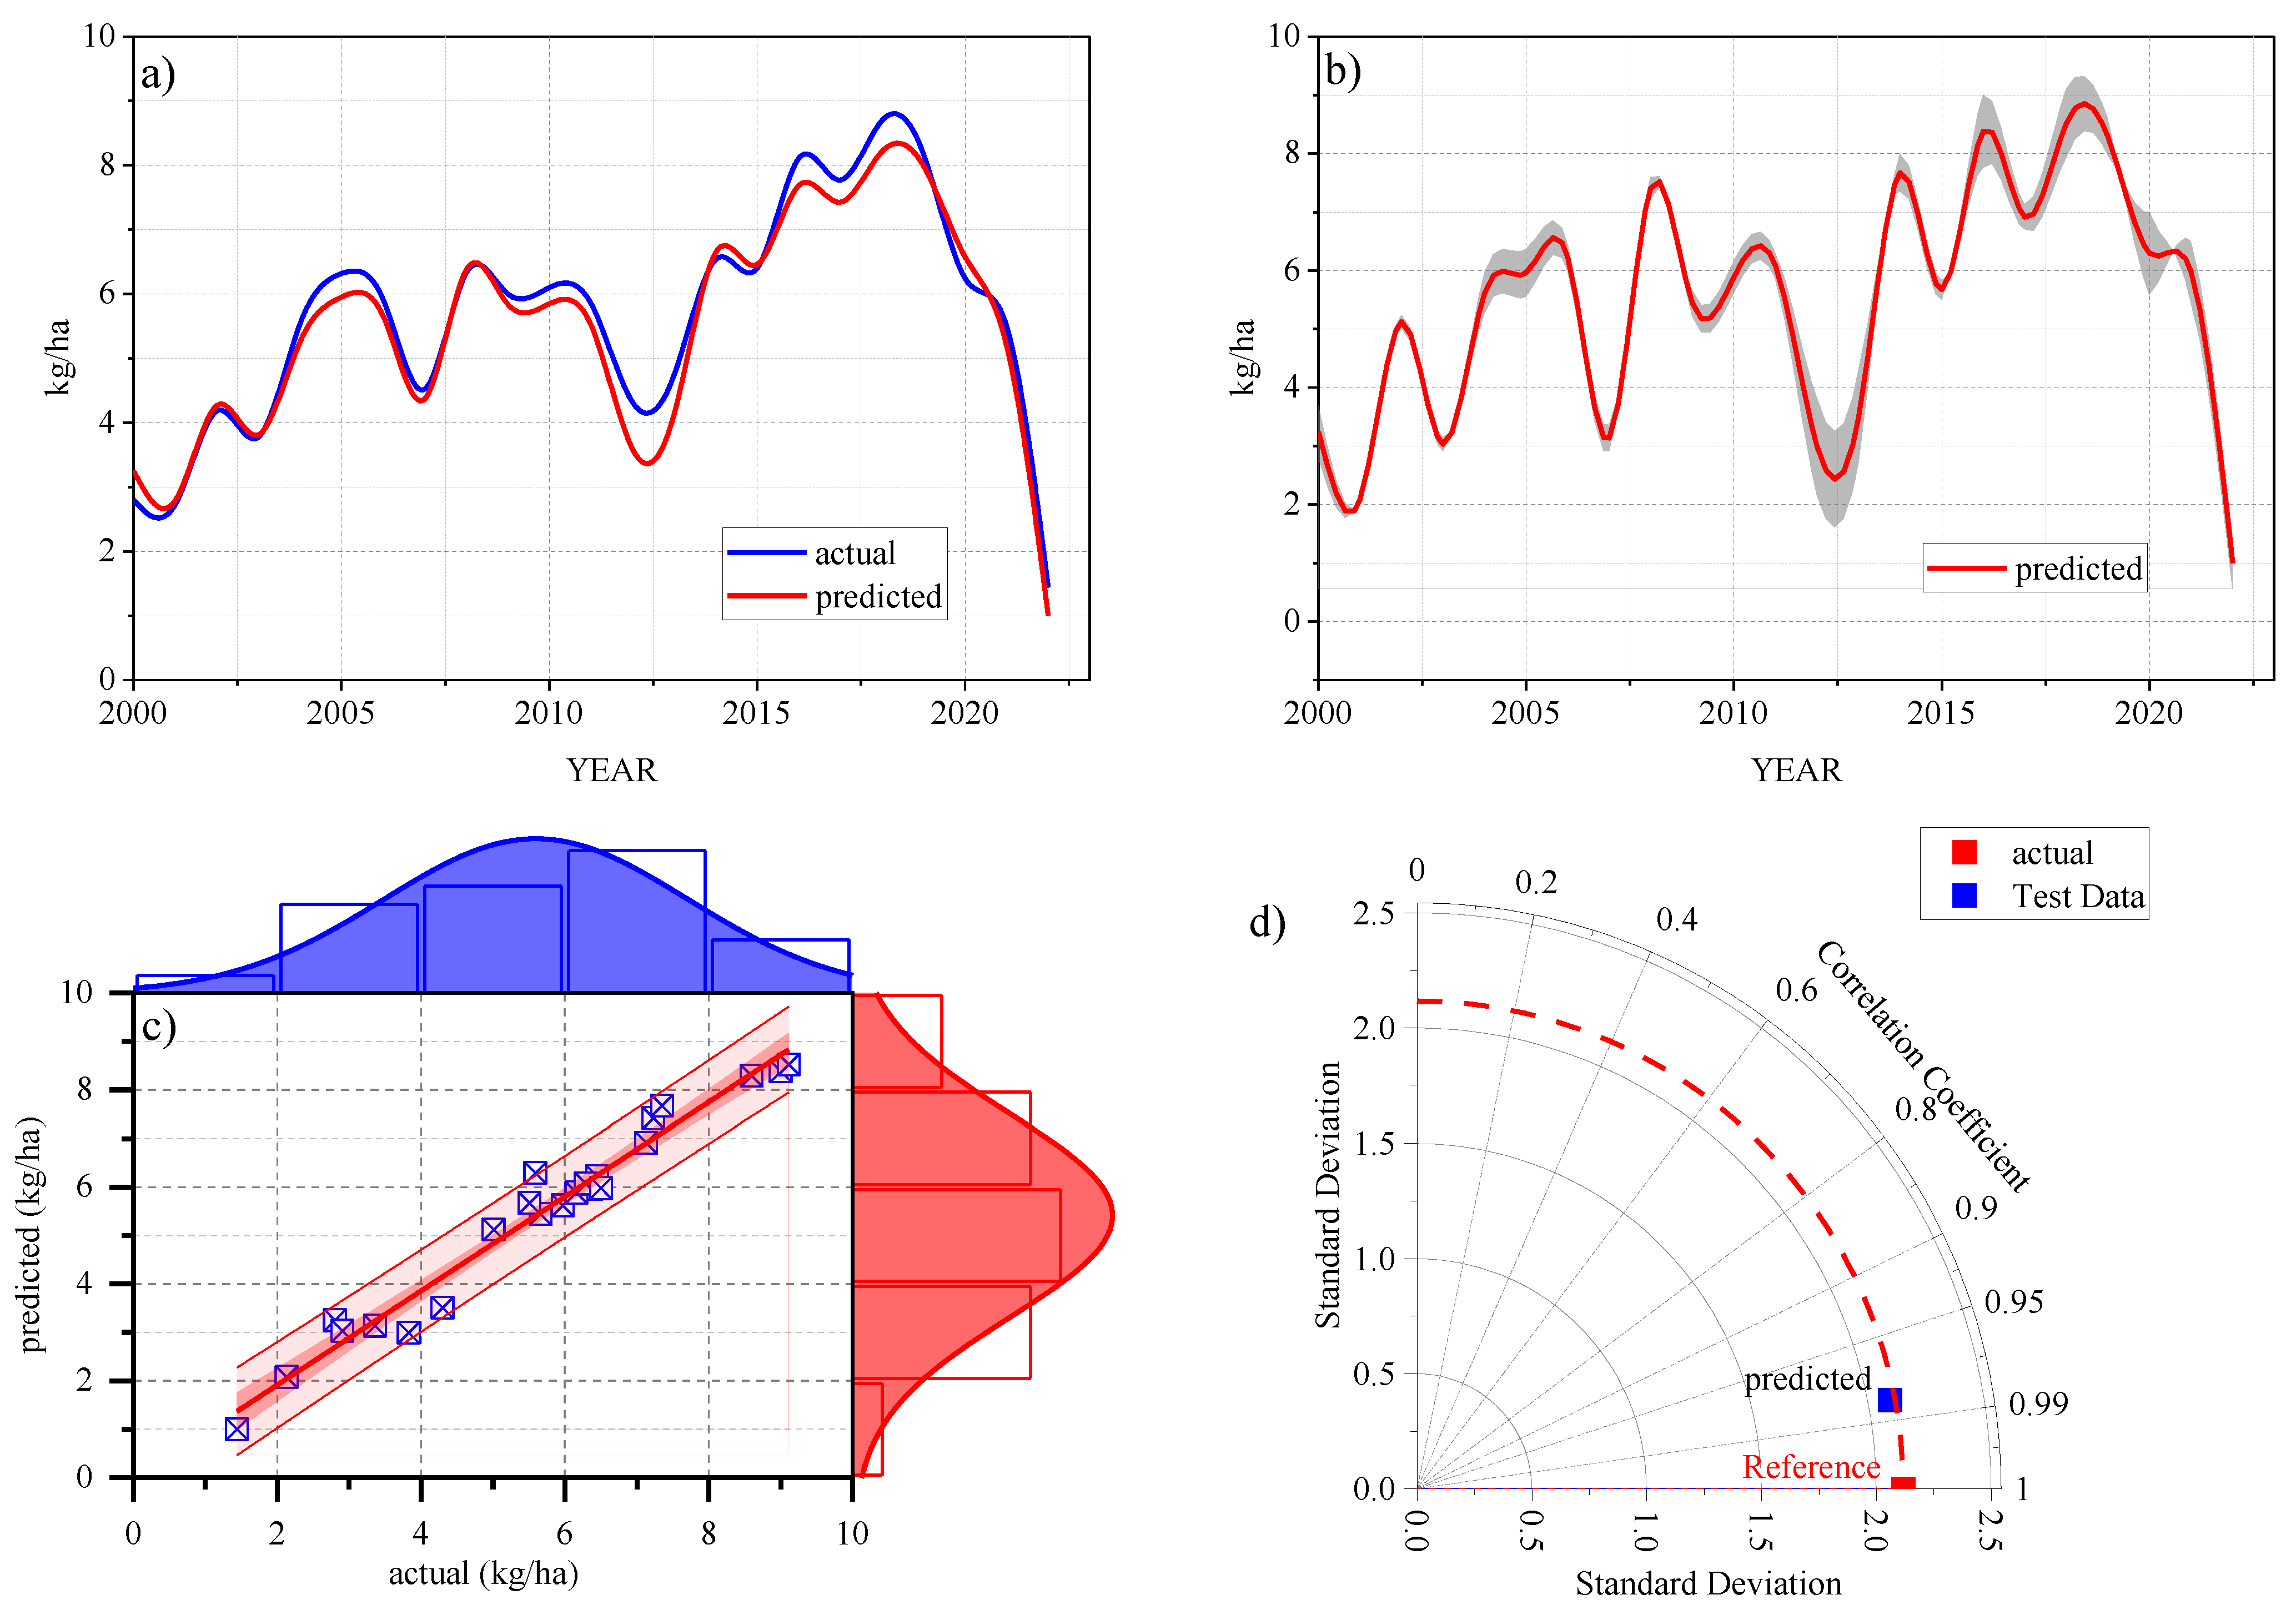
- In the testing stage, the performance of the ML in predicting maize yield varied significantly. The highest performance was recorded in ANN-MLP-SC4 (r = 0.96, RMSE = 120 and RAE = 3.6%), followed by ANN-MLP-SC1 (r = 0.94, RMSE = 118.9 and RAE = 3.98%) and RF- SC2 (r = 0.94, RMSE = 141 and RAE = 4.2%);
- Based on the 10-fold cross validation, the ANN-MLP-SC4 showed a high ability to predict maize yield with the values r = 0.99, RMSE = 158 and RAE = 6.5%.
- The implementation of ANN-MLP-SC4 at a regional scale (Budapest region) was highly successful with the values r =0.98, RMSE = 423 and RAE = 21.5%.
Author Contributions
Funding
Data Availability Statement
Conflicts of Interest
References
- Raheem, D.; Dayoub, M.; Birech, R.; Nakiyemba, A. The Contribution of Cereal Grains to Food Security and Sustainability in Africa: Potential Application of UAV in Ghana, Nigeria, Uganda, and Namibia. Urban Sci. 2021, 5, 8. [Google Scholar] [CrossRef]
- FAO. The Future of Food and Agriculture: Trends and Challenges; FAO: Rome, Italy, 2017; pp. 1–163. [Google Scholar]
- Erenstein, O.; Jaleta, M.; Sonder, K.; Mottaleb, K.; Prasanna, B.M. Global maize production, consumption and trade: Trends and R&D implications. Food Secur. 2022, 14, 1295–1319. [Google Scholar] [CrossRef]
- Shiferaw, B.; Prasanna, B.M.; Hellin, J.; Bänziger, M. Crops that feed the world 6. Past successes and future challenges to the role played by maize in global food security. Food Secur. 2011, 3, 307–327. [Google Scholar] [CrossRef]
- Grote, U.; Fasse, A.; Nguyen, T.T.; Erenstein, O. Food Security and the Dynamics of Wheat and Maize Value Chains in Africa and Asia. Front. Sustain. Food Syst. 2021, 4, 617009. [Google Scholar] [CrossRef]
- Ray, D.K.; Mueller, N.D.; West, P.C.; Foley, J.A. Yield Trends Are Insufficient to Double Global Crop Production by 2050. PLoS ONE 2013, 8, e66428. [Google Scholar] [CrossRef]
- Okolie, C.C.; Danso-Abbeam, G.; Groupson-Paul, O.; Ogundeji, A.A. Climate-Smart Agriculture Amidst Climate Change to Enhance Agricultural Production: A Bibliometric Analysis. Land 2023, 12, 50. [Google Scholar] [CrossRef]
- Nelson, G.C.; Rosegrant, M.W.; Koo, J.; Robertson, R.; Sulser, T.; Zhu, T.; Ringler, C.; Msangi, S.; Palazzo, A.; Batka, M. Climate Change: Impact on Agriculture and Costs of Adaptation; International Food Policy Research Institute: Washington, DC, USA, 2009; Volume 21. [Google Scholar]
- FAO. FAOSTAT Crop Database; FAO: Rome, Italy, 2019. [Google Scholar]
- Prasanna, B.M.; Cairns, J.E.; Zaidi, P.H.; Beyene, Y.; Makumbi, D.; Gowda, M.; Magorokosho, C.; Zaman-Allah, M.; Olsen, M.; Das, A.; et al. Beat the stress: Breeding for climate resilience in maize for the tropical rainfed environments. Theor. Appl. Genet. 2021, 134, 1729–1752. [Google Scholar] [CrossRef]
- Tigchelaar, M.; Battisti, D.S.; Naylor, R.L.; Ray, D.K. Future warming increases probability of globally synchronized maize production shocks. Proc. Natl. Acad. Sci. USA 2018, 115, 6644–6649. [Google Scholar] [CrossRef]
- Senapati, N.; Halford, N.G.; Semenov, M.A. Vulnerability of European wheat to extreme heat and drought around flowering under future climate. Environ. Res. Lett. 2021, 16, 024052. [Google Scholar] [CrossRef]
- Trnka, M.; Rötter, R.P.; Ruiz-Ramos, M.; Kersebaum, K.C.; Olesen, J.E.; Žalud, Z.; Semenov, M.A. Adverse weather conditions for European wheat production will become more frequent with climate change. Nat. Clim. Chang. 2014, 4, 637–643. [Google Scholar] [CrossRef]
- Webber, H.; Ewert, F.; Olesen, J.E.; Müller, C.; Fronzek, S.; Ruane, A.C.; Bourgault, M.; Martre, P.; Ababaei, B.; Bindi, M.; et al. Diverging importance of drought stress for maize and winter wheat in Europe. Nat. Commun. 2018, 9, 4249. [Google Scholar] [CrossRef] [PubMed]
- Pant, J.; Pant, R.P.; Kumar Singh, M.; Pratap Singh, D.; Pant, H. Analysis of agricultural crop yield prediction using statistical techniques of machine learning. Mater. Today: Proc. 2021, 46, 10922–10926. [Google Scholar] [CrossRef]
- van Klompenburg, T.; Kassahun, A.; Catal, C. Crop yield prediction using machine learning: A systematic literature review. Comput. Electron. Agric. 2020, 177, 105709. [Google Scholar] [CrossRef]
- Shahhosseini, M.; Hu, G.; Archontoulis, S.V. Forecasting Corn Yield With Machine Learning Ensembles. Front. Plant Sci. 2020, 11, 1120. [Google Scholar] [CrossRef]
- Shahhosseini, M.; Martinez-Feria, R.A.; Hu, G.; Archontoulis, S.V. Maize yield and nitrate loss prediction with machine learning algorithms. Environ. Res. Lett. 2019, 14, 124026. [Google Scholar] [CrossRef]
- Bazrafshan, O.; Ehteram, M.; Moshizi, Z.G.; Jamshidi, S. Evaluation and uncertainty assessment of wheat yield prediction by multilayer perceptron model with bayesian and copula bayesian approaches. Agric. Water Manag. 2022, 273, 107881. [Google Scholar] [CrossRef]
- Cao, J.; Zhang, Z.; Luo, Y.; Zhang, L.; Zhang, J.; Li, Z.; Tao, F. Wheat yield predictions at a county and field scale with deep learning, machine learning, and google earth engine. Eur. J. Agron. 2021, 123, 126204. [Google Scholar] [CrossRef]
- Cubillas, J.J.; Ramos, M.I.; Jurado, J.M.; Feito, F.R. A Machine Learning Model for Early Prediction of Crop Yield, Nested in a Web Application in the Cloud: A Case Study in an Olive Grove in Southern Spain. Agriculture 2022, 12, 1345. [Google Scholar] [CrossRef]
- Kamath, P.; Patil, P.; Shrilatha, S.; Sushma; Sowmya, S. Crop yield forecasting using data mining. Glob. Transit. Proc. 2021, 2, 402–407. [Google Scholar] [CrossRef]
- Bolker, B.M.; Brooks, M.E.; Clark, C.J.; Geange, S.W.; Poulsen, J.R.; Stevens, M.H.H.; White, J.-S.S. Generalized linear mixed models: A practical guide for ecology and evolution. Trends Ecol. Evol. 2009, 24, 127–135. [Google Scholar] [CrossRef] [PubMed]
- Otukei, J.R.; Blaschke, T. Land cover change assessment using decision trees, support vector machines and maximum likelihood classification algorithms. Int. J. Appl. Earth Obs. Geoinf. 2010, 12, S27–S31. [Google Scholar] [CrossRef]
- Pham, H.; Olafsson, S. Bagged ensembles with tunable parameters. Comput. Intell. 2019, 35, 184–203. [Google Scholar] [CrossRef]
- Mohammed, S.; Alsafadi, K.; Enaruvbe, G.O.; Bashir, B.; Elbeltagi, A.; Széles, A.; Alsalman, A.; Harsanyi, E. Assessing the impacts of agricultural drought (SPI/SPEI) on maize and wheat yields across Hungary. Sci. Rep. 2022, 12, 8838. [Google Scholar] [CrossRef] [PubMed]
- Kern, A.; Barcza, Z.; Marjanović, H.; Árendás, T.; Fodor, N.; Bónis, P.; Bognár, P.; Lichtenberger, J. Statistical modelling of crop yield in Central Europe using climate data and remote sensing vegetation indices. Agric. For. Meteorol. 2018, 260–261, 300–320. [Google Scholar] [CrossRef]
- Bussay, A.; van der Velde, M.; Fumagalli, D.; Seguini, L. Improving operational maize yield forecasting in Hungary. Agric. Syst. 2015, 141, 94–106. [Google Scholar] [CrossRef]
- Pinke, Z.; Lövei, G.L. Increasing temperature cuts back crop yields in Hungary over the last 90 years. Glob. Chang. Biol. 2017, 23, 5426–5435. [Google Scholar] [CrossRef]
- Kendall, M.G. Rank Correlation Methods; Charles Griffin: London, UK, 1948. [Google Scholar]
- Mann, H.B. Nonparametric tests against trend. Econom. J. Econom. Soc. 1945, 3, 245–259. [Google Scholar] [CrossRef]
- Sneyers, R. On the Statistical Analysis of Series of Observations; World Meteorological Organization: Geneva, Switzerland, 1991. [Google Scholar]
- Cao, J.; Zhang, Z.; Tao, F.; Zhang, L.; Luo, Y.; Han, J.; Li, Z. Identifying the contributions of multi-source data for winter wheat yield prediction in China. Remote Sens. 2020, 12, 750. [Google Scholar] [CrossRef]
- Shafiee, S.; Lied, L.M.; Burud, I.; Dieseth, J.A.; Alsheikh, M.; Lillemo, M. Sequential forward selection and support vector regression in comparison to LASSO regression for spring wheat yield prediction based on UAV imagery. Comput. Electron. Agric. 2021, 183, 106036. [Google Scholar] [CrossRef]
- Frank, E.; Hall, M.; Holmes, G.; Kirkby, R.; Pfahringer, B.; Witten, I.H.; Trigg, L. Weka-A Machine Learning Workbench for Data Mining. In Data Mining and Knowledge Discovery Handbook; Maimon, O., Rokach, L., Eds.; Springer: Boston, MA, USA, 2010; pp. 1269–1277. [Google Scholar]
- Breiman, L. Bagging predictors. Mach. Learn. 1996, 24, 123–140. [Google Scholar] [CrossRef]
- Kohavi, R. The power of decision tables. In Proceedings of the Machine Learning: ECML-95, Berlin/Heidelberg, Germany, 25–27 April 1995; pp. 174–189. [Google Scholar]
- Kaur, E.D.P.; Singh, E.P. A comparative research of rule based classification on dataset using WEKA TOOL. Int. Res. J. Eng. Technol. (IRJET) 2019, 6, 2098–2102. [Google Scholar]
- Pham, H.T.; Awange, J.; Kuhn, M. Evaluation of Three Feature Dimension Reduction Techniques for Machine Learning-Based Crop Yield Prediction Models. Sensors 2022, 22, 6609. [Google Scholar] [CrossRef]
- Breiman, L. Random Forests. Mach. Learn. 2001, 45, 5–32. [Google Scholar] [CrossRef]
- Hamza, M.; Larocque, D. An empirical comparison of ensemble methods based on classification trees. J. Stat. Comput. Simul. 2005, 75, 629–643. [Google Scholar] [CrossRef]
- Leo, S.; De Antoni Migliorati, M.; Grace, P.R. Predicting within-field cotton yields using publicly available datasets and machine learning. Agron. J. 2021, 113, 1150–1163. [Google Scholar] [CrossRef]
- Cutler, A.; Cutler, D.R.; Stevens, J.R. Random Forests. In Ensemble Machine Learning: Methods and Applications; Zhang, C., Ma, Y., Eds.; Springer: Boston, MA, USA, 2012; pp. 157–175. [Google Scholar]
- Murtagh, F. Multilayer perceptrons for classification and regression. Neurocomputing 1991, 2, 183–197. [Google Scholar] [CrossRef]
- Taud, H.; Mas, J.F. Multilayer Perceptron (MLP). In Geomatic Approaches for Modeling Land Change Scenarios; Camacho Olmedo, M.T., Paegelow, M., Mas, J.-F., Escobar, F., Eds.; Springer International Publishing: Cham, Switzerland, 2018; pp. 451–455. [Google Scholar]
- Amid, S.; Mesri Gundoshmian, T. Prediction of output energies for broiler production using linear regression, ANN (MLP, RBF), and ANFIS models. Environ. Prog. Sustain. Energy 2017, 36, 577–585. [Google Scholar] [CrossRef]
- Gardner, M.W.; Dorling, S.R. Artificial neural networks (the multilayer perceptron)—A review of applications in the atmospheric sciences. Atmos. Environ. 1998, 32, 2627–2636. [Google Scholar] [CrossRef]
- Sánchez, B.; Rasmussen, A.; Porter, J.R. Temperatures and the growth and development of maize and rice: A review. Glob. Chang. Biol. 2014, 20, 408–417. [Google Scholar] [CrossRef]
- Ray, D.K.; Gerber, J.S.; MacDonald, G.K.; West, P.C. Climate variation explains a third of global crop yield variability. Nat. Commun. 2015, 6, 5989. [Google Scholar] [CrossRef]
- Meng, L.; Liu, H.; L. Ustin, S.; Zhang, X. Predicting Maize Yield at the Plot Scale of Different Fertilizer Systems by Multi-Source Data and Machine Learning Methods. Remote Sens. 2021, 13, 3760. [Google Scholar] [CrossRef]
- Reidsma, P.; Ewert, F.; Boogaard, H.; Diepen, K.v. Regional crop modelling in Europe: The impact of climatic conditions and farm characteristics on maize yields. Agric. Syst. 2009, 100, 51–60. [Google Scholar] [CrossRef]
- Shao, R.-x.; Yu, K.-k.; Li, H.-w.; Jia, S.-j.; Yang, Q.-h.; Zhao, X.; Zhao, Y.-l.; Liu, T.-x. The effect of elevating temperature on the growth and development of reproductive organs and yield of summer maize. J. Integr. Agric. 2021, 20, 1783–1795. [Google Scholar] [CrossRef]
- Zhang, L.; Zhang, Z.; Luo, Y.; Cao, J.; Tao, F. Combining Optical, Fluorescence, Thermal Satellite, and Environmental Data to Predict County-Level Maize Yield in China Using Machine Learning Approaches. Remote Sens. 2020, 12, 21. [Google Scholar] [CrossRef]
- Hatfield, J.L. Increased Temperatures Have Dramatic Effects on Growth and Grain Yield of Three Maize Hybrids. Agric. Environ. Lett. 2016, 1, 150006. [Google Scholar] [CrossRef]
- Edreira, J.I.R.; Mayer, L.I.; Otegui, M.E. Heat stress in temperate and tropical maize hybrids: Kernel growth, water relations and assimilate availability for grain filling. Field Crops Res. 2014, 166, 162–172. [Google Scholar] [CrossRef]
- Lizaso, J.I.; Ruiz-Ramos, M.; Rodríguez, L.; Gabaldon-Leal, C.; Oliveira, J.A.; Lorite, I.J.; Sánchez, D.; García, E.; Rodríguez, A. Impact of high temperatures in maize: Phenology and yield components. Field Crops Res. 2018, 216, 129–140. [Google Scholar] [CrossRef]
- Siatwiinda, S.M.; Supit, I.; van Hove, B.; Yerokun, O.; Ros, G.H.; de Vries, W. Climate change impacts on rainfed maize yields in Zambia under conventional and optimized crop management. Clim. Chang. 2021, 167, 39. [Google Scholar] [CrossRef]
- Omoyo, N.N.; Wakhungu, J.; Oteng’i, S. Effects of climate variability on maize yield in the arid and semi arid lands of lower eastern Kenya. Agric. Food Secur. 2015, 4, 8. [Google Scholar] [CrossRef]
- Adamgbe, E.M.; Ujoh, F. Effect of variability in rainfall characteristics on maize yield in Gboko, Nigeria. J. Environ. Prot. 2013, 4, 36308. [Google Scholar] [CrossRef]
- János, N. Impact of Fertilization and Irrigation on the Correlation between the Soil Plant Analysis Development Value and Yield of Maize. Commun. Soil Sci. Plant Anal. 2010, 41, 1293–1305. [Google Scholar] [CrossRef]
- Balogh, P.; Bujdos, Á.; Czibere, I.; Fodor, L.; Gabnai, Z.; Kovách, I.; Nagy, J.; Bai, A. Main Motivational Factors of Farmers Adopting Precision Farming in Hungary. Agronomy 2020, 10, 610. [Google Scholar] [CrossRef]
- Cheng, M.; Wang, H.; Fan, J.; Zhang, F.; Wang, X. Effects of Soil Water Deficit at Different Growth Stages on Maize Growth, Yield, and Water Use Efficiency under Alternate Partial Root-Zone Irrigation. Water 2021, 13, 148. [Google Scholar] [CrossRef]
- Guyader, J.; Baron, V.S.; Beauchemin, K.A. Effect of Harvesting Corn after Frost in Alberta (Canada) on Whole-Plant Yield, Nutritive Value, and Kernel Properties. Agronomy 2021, 11, 459. [Google Scholar] [CrossRef]
- Lobell, D.B.; Hammer, G.L.; McLean, G.; Messina, C.; Roberts, M.J.; Schlenker, W. The critical role of extreme heat for maize production in the United States. Nat. Clim. Chang. 2013, 3, 497–501. [Google Scholar] [CrossRef]
- Cedric, L.S.; Adoni, W.Y.H.; Aworka, R.; Zoueu, J.T.; Mutombo, F.K.; Krichen, M.; Kimpolo, C.L.M. Crops yield prediction based on machine learning models: Case of West African countries. Smart Agric. Technol. 2022, 2, 100049. [Google Scholar] [CrossRef]
- Abbas, F.; Afzaal, H.; Farooque, A.A.; Tang, S. Crop Yield Prediction through Proximal Sensing and Machine Learning Algorithms. Agronomy 2020, 10, 1046. [Google Scholar] [CrossRef]
- Han, J.; Zhang, Z.; Cao, J.; Luo, Y.; Zhang, L.; Li, Z.; Zhang, J. Prediction of Winter Wheat Yield Based on Multi-Source Data and Machine Learning in China. Remote Sens. 2020, 12, 236. [Google Scholar] [CrossRef]
- Ruan, G.; Li, X.; Yuan, F.; Cammarano, D.; Ata-Ui-Karim, S.T.; Liu, X.; Tian, Y.; Zhu, Y.; Cao, W.; Cao, Q. Improving wheat yield prediction integrating proximal sensing and weather data with machine learning. Comput. Electron. Agric. 2022, 195, 106852. [Google Scholar] [CrossRef]
- Shetty, S.A.; Padmashree, T.; Sagar, B.M.; Cauvery, N.K. Performance Analysis on Machine Learning Algorithms with Deep Learning Model for Crop Yield Prediction. In Proceedings of the Data Intelligence and Cognitive Informatics, Tirunelveli, India, 8–9 July 2021; pp. 739–750. [Google Scholar]
- Torsoni, G.B.; de Oliveira Aparecido, L.E.; dos Santos, G.M.; Chiquitto, A.G.; da Silva Cabral Moraes, J.R.; de Souza Rolim, G. Soybean yield prediction by machine learning and climate. Theor. Appl. Climatol. 2023, 151, 1709–1725. [Google Scholar] [CrossRef]
- Elbeltagi, A.; Srivastava, A.; Kushwaha, N.L.; Juhász, C.; Tamás, J.; Nagy, A. Meteorological Data Fusion Approach for Modeling Crop Water Productivity Based on Ensemble Machine Learning. Water 2023, 15, 30. [Google Scholar] [CrossRef]
- Kuradusenge, M.; Hitimana, E.; Hanyurwimfura, D.; Rukundo, P.; Mtonga, K.; Mukasine, A.; Uwitonze, C.; Ngabonziza, J.; Uwamahoro, A. Crop Yield Prediction Using Machine Learning Models: Case of Irish Potato and Maize. Agriculture 2023, 13, 225. [Google Scholar] [CrossRef]
- Keerthana, M.; Meghana, K.J.M.; Pravallika, S.; Kavitha, M. An Ensemble Algorithm for Crop Yield Prediction. In Proceedings of the 2021 Third International Conference on Intelligent Communication Technologies and Virtual Mobile Networks (ICICV), Tirunelveli, India, 4–6 February 2021; pp. 963–970. [Google Scholar]
- Jeong, J.H.; Resop, J.P.; Mueller, N.D.; Fleisher, D.H.; Yun, K.; Butler, E.E.; Timlin, D.J.; Shim, K.-M.; Gerber, J.S.; Reddy, V.R.; et al. Random Forests for Global and Regional Crop Yield Predictions. PLoS ONE 2016, 11, e0156571. [Google Scholar] [CrossRef]
- Cheng, M.; Penuelas, J.; McCabe, M.F.; Atzberger, C.; Jiao, X.; Wu, W.; Jin, X. Combining multi-indicators with machine-learning algorithms for maize yield early prediction at the county-level in China. Agric. For. Meteorol. 2022, 323, 109057. [Google Scholar] [CrossRef]
- Panda, S.S.; Ames, D.P.; Panigrahi, S. Application of Vegetation Indices for Agricultural Crop Yield Prediction Using Neural Network Techniques. Remote Sens. 2010, 2, 673–696. [Google Scholar] [CrossRef]
- Ahmed, S. A Software Framework for Predicting the Maize Yield Using Modified Multi-Layer Perceptron. Sustainability 2023, 15, 3017. [Google Scholar] [CrossRef]
- Paswan, R.P.; Begum, S.A. ANN for prediction of Area and Production of Maize crop for Upper Brahmaputra Valley Zone of Assam. In Proceedings of the 2014 IEEE International Advance Computing Conference (IACC), New Delhi, India, 21–22 February 2014; pp. 1286–1295. [Google Scholar]
- Kaul, M.; Hill, R.L.; Walthall, C. Artificial neural networks for corn and soybean yield prediction. Agric. Syst. 2005, 85, 1–18. [Google Scholar] [CrossRef]
- Kross, A.; Znoj, E.; Callegari, D.; Kaur, G.; Sunohara, M.; Lapen, D.R.; McNairn, H. Using Artificial Neural Networks and Remotely Sensed Data to Evaluate the Relative Importance of Variables for Prediction of Within-Field Corn and Soybean Yields. Remote Sens. 2020, 12, 2230. [Google Scholar] [CrossRef]
- Bhojani, S.H.; Bhatt, N. Wheat crop yield prediction using new activation functions in neural network. Neural Comput. Appl. 2020, 32, 13941–13951. [Google Scholar] [CrossRef]
- Hara, P.; Piekutowska, M.; Niedbała, G. Selection of Independent Variables for Crop Yield Prediction Using Artificial Neural Network Models with Remote Sensing Data. Land 2021, 10, 609. [Google Scholar] [CrossRef]
- Abraham, E.R.; Mendes dos Reis, J.G.; Vendrametto, O.; Oliveira Costa Neto, P.L.d.; Carlo Toloi, R.; Souza, A.E.d.; Oliveira Morais, M.d. Time Series Prediction with Artificial Neural Networks: An Analysis Using Brazilian Soybean Production. Agriculture 2020, 10, 475. [Google Scholar] [CrossRef]
- Son, N.-T.; Chen, C.-F.; Chen, C.-R.; Guo, H.-Y.; Cheng, Y.-S.; Chen, S.-L.; Lin, H.-S.; Chen, S.-H. Machine learning approaches for rice crop yield predictions using time-series satellite data in Taiwan. Int. J. Remote Sens. 2020, 41, 7868–7888. [Google Scholar] [CrossRef]
- Li, L.; Wang, B.; Feng, P.; Li Liu, D.; He, Q.; Zhang, Y.; Wang, Y.; Li, S.; Lu, X.; Yue, C. Developing machine learning models with multi-source environmental data to predict wheat yield in China. Comput. Electron. Agric. 2022, 194, 106790. [Google Scholar] [CrossRef]
- Chen, X.; Feng, L.; Yao, R.; Wu, X.; Sun, J.; Gong, W. Prediction of Maize Yield at the City Level in China Using Multi-Source Data. Remote Sens. 2021, 13, 146. [Google Scholar] [CrossRef]
- Ngie, A.; Ahmed, F. Estimation of Maize grain yield using multispectral satellite data sets (SPOT 5) and the random forest algorithm. S. Afr. J. Geomat. 2018, 7, 11–30. [Google Scholar] [CrossRef]
- Kayad, A.; Sozzi, M.; Gatto, S.; Marinello, F.; Pirotti, F. Monitoring Within-Field Variability of Corn Yield using Sentinel-2 and Machine Learning Techniques. Remote Sens. 2019, 11, 2873. [Google Scholar] [CrossRef]
- Zhu, X.; Guo, R.; Liu, T.; Xu, K. Crop Yield Prediction Based on Agrometeorological Indexes and Remote Sensing Data. Remote Sens. 2021, 13, 2016. [Google Scholar] [CrossRef]
- Nagy, A.; Fehér, J.; Tamás, J. Wheat and maize yield forecasting for the Tisza river catchment using MODIS NDVI time series and reported crop statistics. Comput. Electron. Agric. 2018, 151, 41–49. [Google Scholar] [CrossRef]


| Country | Reference | Crop | Method | Comment |
|---|---|---|---|---|
| Spain | [21] | Olive crop | GLM algorithm, Support Vector Machines (SVM), Gaussian and Linear Kernel | Yield predicted with low error. Parameters that introduce noise in the model must be discarded. |
| India | [27] | Random Forest Algorithm | Superior prediction compared to Decision Tree. | |
| USA | [17] | Corn | Random forest, XGBoost and LightGBM, Stacked Generalization | Models could not predict better than base learners due to blocked sequential procedure. |
| India | [15] | Maize, wheat, rice, potatoes | Decision Tree Regressor, Gradient Boosting Regressor, Random Forest Regressor, SVM | Decision Tree Regressor had the highest (96%) prediction accuracy. |
| Ethiopia, Kenya, Tanzania, Malawi and Mozambique. | [28] | Maize | Linear Algorithms (Logistic Regression (LR)) and Linear Discriminant Analysis (LDA). Nonlinear algorithms [K-Nearest Neighbor (KNN), Classification and Regression Trees (CART), Gaussian Naive Bayes (NB) and Support Vector Machine (SVM)]. | Support Vector Machine was the worst algorithm. |
| China | [25] | Maize | Random Forest Regression (RFR), Gradient Boosting Decision Tree (GBDT) | RFR had high yield estimation accuracy. |
| USA | [18] | Maize | Random Forest, XGBoost, Optimal Ensemble, Benchmark Ensemble, Linear and Ridge Regression | Had high accuracy. |
| Bulgaria, Germany, Spain, France, Hungary Italy, the Netherlands, Poland, Romania | [29] | Wheat, barley, sunflower, grain, maize, sugar beets, potato | Ridge Regression, K-Nearest Neighbors (KNN) Regression, Support Vector Machines Regression (SVR), Gradient Boosted Decision Trees (GBDT) | Machine learning forecasts had lower uncertainty than a trend model. |
| Input Data | Variables Selected | Time Period | Source |
|---|---|---|---|
| Agriculture | Cropped area (hectares), Crop production (tons), Crop yield (tons/ha) | 1921–2018 | https://www.ksh.hu/agricultural_census_long_time_series |
| Climate | Mean temperature °C (Tmean), precipitation mm (PRCP), Rainy days (RD), frosty days (FD), heat days (HD) | 1921–2018 | https://www.ksh.hu/stadat_files/kor/en/kor0037.html |
| Scenario | Input * | Output | Photoprint of the Scenario |
|---|---|---|---|
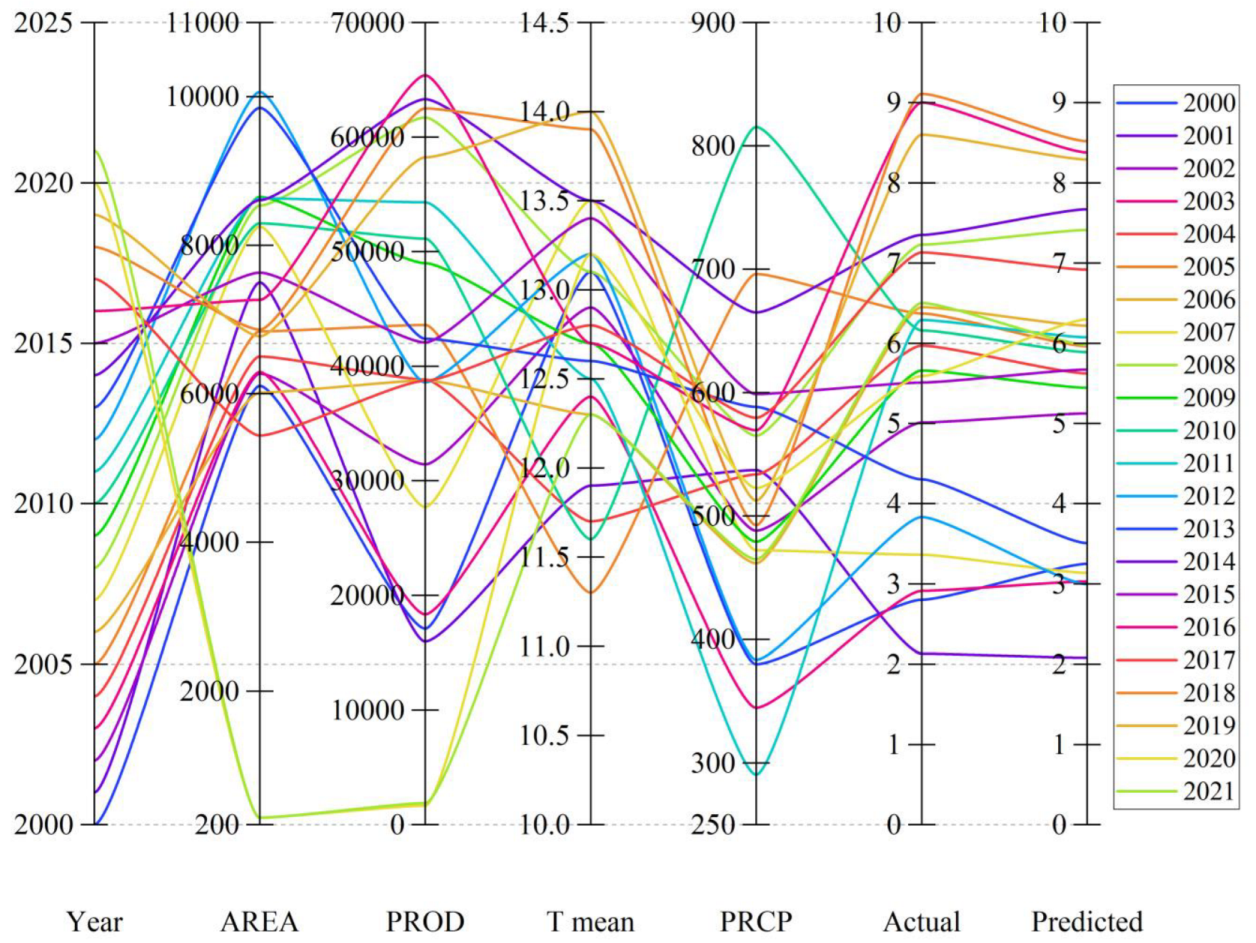
| SC1 | AREA+ PROD+ Tmean+ PRCP+ RD+ FD+ HD | Maize yield | Agricultural data+ climate data |
| SC2 | AREA+ PROD | Maize yield | Agricultural data |
| SC3 | Tmean+ PRCP+ RD+ FD+ HD | Maize yield | Climate data |
| SC4 | AREA+ PROD+ Tmean+ PRCP | Maize yield | Agricultural data+ climate data |
| Algorithm | Parameters |
|---|---|
| Bagging | Algorithm = ‘weka.classifier.meta.bagging”, pool size P = 100, seed S = 1, num-slot = 1, Base learner = weka.classifiers.trees. REPTree -M 2 -V 0.001 -N 3 -S 1 -L -1 -I 0.0, iteration = 10 |
| Decision Table | Algorithm = weka.classifiers.rules. DecisionTable, number of rules R = 10, CV = leave one out, Search method S = Best First, search direction D = forward, start set = no attributes, subsets evaluated = 31 |
| Random Forest | weka.classifiers.trees. RandomForest, ntrees I = 100, num-slot = 1, max tree depth = 0, variance V = 0.001, seed S = 1, batch-size = 100, classifier capabilities = -do-not-check-capabilities |
| ANN-MLP | Learning rate L = 0.3, momentum M = 0.2, Activation function = sigmoid, Num of epochs to train = 500, E = threshold for consecutive errors = 20, Regularization = weight decay |
| Indicator | Equation * | Range |
|---|---|---|
| Correlation coefficient | [−1 to +1] | |
| Mean absolute error | [0 to ∞] | |
| Root mean squared error | [0 to ∞] | |
| Relative absolute error | [0 to ∞] | |
| Root relative squared error | [0 to ∞] |
| Variables | Area (hectares) | Production (tons) | Yield (kg/ha) | Mean Temperature (°C) | Precipitation | Rainy Days | Frosty Days | Heat Days |
|---|---|---|---|---|---|---|---|---|
| Tau | 0.122 (0.07) | 0.710 *** (<0.001) | 0.726 *** (<0.001) | 0.263 *** (<0.001) | −0.041 (0.54) | −0.233 *** (<0.001) | −0.228 *** (<0.001) | 0.155 *** (0.02) |
| z-score | 1.78 | 10.35 | 10.59 | 3.77 | −0.601 | −3.37 | −3.31 | 2.23 |
| Sen’s slope | 817.32 | 74,620 | 65.48 | 0.01 | −0.24 | −0.18 | −0.191 | 0.094 |
| Breaking point | 1923 | 1964 | 1968 | 2007, 2009, 2011 | 1932–1934, 1946, 1948, 1961, 1963, 1967, 2014–2016 | 1951–1953 | 2000 | 2011 |
Disclaimer/Publisher’s Note: The statements, opinions and data contained in all publications are solely those of the individual author(s) and contributor(s) and not of MDPI and/or the editor(s). MDPI and/or the editor(s) disclaim responsibility for any injury to people or property resulting from any ideas, methods, instructions or products referred to in the content. |
© 2023 by the authors. Licensee MDPI, Basel, Switzerland. This article is an open access article distributed under the terms and conditions of the Creative Commons Attribution (CC BY) license (https://creativecommons.org/licenses/by/4.0/).
Share and Cite
Harsányi, E.; Bashir, B.; Arshad, S.; Ocwa, A.; Vad, A.; Alsalman, A.; Bácskai, I.; Rátonyi, T.; Hijazi, O.; Széles, A.; et al. Data Mining and Machine Learning Algorithms for Optimizing Maize Yield Forecasting in Central Europe. Agronomy 2023, 13, 1297. https://doi.org/10.3390/agronomy13051297
Harsányi E, Bashir B, Arshad S, Ocwa A, Vad A, Alsalman A, Bácskai I, Rátonyi T, Hijazi O, Széles A, et al. Data Mining and Machine Learning Algorithms for Optimizing Maize Yield Forecasting in Central Europe. Agronomy. 2023; 13(5):1297. https://doi.org/10.3390/agronomy13051297
Chicago/Turabian StyleHarsányi, Endre, Bashar Bashir, Sana Arshad, Akasairi Ocwa, Attila Vad, Abdullah Alsalman, István Bácskai, Tamás Rátonyi, Omar Hijazi, Adrienn Széles, and et al. 2023. "Data Mining and Machine Learning Algorithms for Optimizing Maize Yield Forecasting in Central Europe" Agronomy 13, no. 5: 1297. https://doi.org/10.3390/agronomy13051297
APA StyleHarsányi, E., Bashir, B., Arshad, S., Ocwa, A., Vad, A., Alsalman, A., Bácskai, I., Rátonyi, T., Hijazi, O., Széles, A., & Mohammed, S. (2023). Data Mining and Machine Learning Algorithms for Optimizing Maize Yield Forecasting in Central Europe. Agronomy, 13(5), 1297. https://doi.org/10.3390/agronomy13051297