Article

Transcriptomic and Metabolomic Profiling Provides Insights into Flavonoid Biosynthesis and Flower Coloring in Loropetalum chinense and Loropetalum chinense var. rubrum

1
College of Horticulture, Hunan Agricultural University, Changsha 410128, China
2
Engineering Research Center for Horticultural Crop Germplasm Creation and New Variety Breeding, Ministry of Education, Changsha 410128, China
3
Ministry of Education, Hunan Mid-subtropical Quality Plant Breeding and Utilization Engineering Technology Research Center, Changsha 410128, China
4
Hunan Horticulture Research Institute, Hunan Academy of Agricultural Sciences, Changsha 410125, China
5
School of Economics, Hunan Agricultural University, Changsha 410128, China
6
Agricultural Genomics Institute at Shenzhen, Chinese Academy of Agricultural Sciences, Shenzhen 518120, China
7
Kunpeng Institute of Modern Agriculture, Foshan 528226, China
8
Department of Horticulture, University of Georgia, Athens, GA 30602, USA
9
School of Landscape and Architecture, Beijing Forest University, Beijing 100083, China
*
Author to whom correspondence should be addressed.
These authors contributed equally to this work.
Agronomy 2023, 13(5), 1296; https://doi.org/10.3390/agronomy13051296
Submission received: 12 April 2023 / Revised: 30 April 2023 / Accepted: 2 May 2023 / Published: 4 May 2023
(This article belongs to the Special Issue Flowering and Flower Development in Plants)

Abstract

:
The Loropetalum chinense and Loropetalum chinense var. rubrum are typical as well as traditional ornamental and Chinese herbal medicines in Asia; however, more information is needed on the mechanisms underlying their flower coloring. Here, we profiled the flavonoid metabolome and carried out full-length sequencing in addition to transcriptome analyses to investigate the flavonoid biosynthesis and global transcriptome changes among different petal coloring cultivars of L. chinense and L. chinense var. rubrum. The total anthocyanins in addition to the RHSCC values and CIE 1976 L*a*b* values of petals were highly consistent with petal color. Moreover, a total of 207 flavonoid components were identified. Of these, 13 flavonoid compounds were considered significantly different expression compounds highly consistent with color information in the 4 samples. Meanwhile, the first reference full-length transcriptome of L. chinense var. rubrum was built, which had 171,783 high-quality nonredundant transcripts with correcting with next-generation sequencing (NGS). Among them, 52,851 transcripts were annotated in the seven databases of NR, KOG, GO, NT, Pfam, Swiss-Port, and KEGG. Combined with NGS analyses, the DETs involved in flavonoids and anthocyanins contributed greatest to the flower coloring. Additionally, the different expressions of eight LcDFRs and four LcANS genes were positively correlated with flavonoid biosynthesis, and the four LcBZ1 as well as one Lc3Mat1 were positively correlated with the content of seven anthocyanins revealed by coupling with metabolomics and transcriptomics analyses. Together, these results were used to mine candidate genes by analyzing flower coloring changes at comprehensive metabolic and transcriptomic levels in L. chinense and L. chinense var. rubrum.

1. Introduction

Loropetalum chinense var. rubrum belongs to the Hamamelidaceae family and is commonly used in landscaping plazas, neighborhoods, gardens, roads, green areas, etc. [1,2]. It was first identified in Changsha, Hunan Province, and its wild resources are distributed in the Luoxiao Mountains among Liuyang, Pingjiang, and Liling [3]. Moreover, L. chinense var. rubrum has gorgeous flower and leaf coloring, in addition to flowering two–three times per year [4]. The petal coloring of L. chinense and L. chinense var. rubrum could be divided into five groups: poly-chromatic, yellowish-white, green-white, purplish-pink, and purplish red [5]. The different distributions of anthocyanins in the petals of parenchymal cells lead to the petal coloring differences in L. chinense var. rubrum [5]. Furthermore, the different components and contents of flavonoids in leaves lead to the different leaf colorings in L. chinense var. rubrum [6], while little is known about the flavonoid biosynthesis in petals of L. chinense var. rubrum [5,6,7].
Flavonoids are the primary pigments that contribute to the millions of flower colors in the petals of plants [8]. The water-soluble flavonoids are responsible for the range of colors from yellow to red to violet to blue, including aurones, chalcones, flavones, flavonols, flavanones, flavanones, isoflavones, and anthocyanins [8,9]. Flavones and flavonols are the co-pigments that contribute to flower colors and bluing [10]. The O-glycosides of anthocyanins are the colored flavonoids, which are the main determinants of flower color, found in the vacuoles of petal cells [11,12]. They have a basic structure of 3,5,7-trihydroxy benzene-2-phenyl benzofuran; further modification by glycosylation, acylation, and methylation depends on the plant species and varieties [9], which acquire diversified anthocyanidin structures and variable flower colors [13]. Hundreds of anthocyanins have been reported, and they are divided into six classes, including Pg (pelargonidin), Cy (cyanidin), Dp (delphinidin), Pn (peonidin), Pt (petunidin), and Mv (malvidin) [13,14]. Cyanidin derives peonidin, and delphinidin derives petunidin and malvidin formed by methylation, hydroxylation, glycosylation, and acylation. Additionally, then, this deriving of anthocyanins further creates orange-yellow, red, purple, and blue petals [15,16,17,18]. Thus, the flavonoid component and relative content are significant factors in determining the flower color, and the synthetic genes, regulatory genes, and modification genes create these.
The flavonoid biosynthetic pathway is well understood in plants [19]. Flavonoids (including anthocyanins) are generated through the phenylpropanoid pathway, which is divided into three stages [20,21]: The first stage is the general phenylpropanoid pathway catalyzed via phenylalanine ammonia-lyase (PAL), cinnamic acid 4-hydroxylase (C4H), and 4-coumarate-CoA ligase (4CL) [22]. The second stage involved is the production of colorless dihydroflavonols successively catalyzed via chalcone synthase (CHS) [23,24], chalcone isomerase (CHI) [25], flavanone 3-hydroxylase (F3H) [26], flavonoid-3’5’-hydroxylase (F3′5′H) [27,28], and flavonoid-3’-hydroxylase (F3′H) [29]. The third stage is the anthocyanins derivates catalyzed via dihydroflavonol 4-reductase (DFR) [28,30] and anthocyanidin (ANS) [31,32]. Additionally, then, the anthocyanidins and anthocyanins are catalyzed via glycosyltransferase (GT) [33] and methyltransferase (MT) [34], as well as acyltransferase (AT) [15] into stable anthocyanins and their further modifications. Of note, some of the flavonoid biosynthetic genes of LcvrCHS1 [35], LcCHS1, LcCHS2 [36], LcCHI [37], LcDFR1, and LcDFR2 [38] were reported in L. chinense var. rubrum.
Transcriptional control also plays a vital role in the modulation of flavonoid biosynthesis, and several transcription factors involved in the pathway have been elucidated [39,40,41]. The MBW (MYB-bHLH-WD40) complex is well conserved and the central transcriptional regulator of activating structural genes to flavonoid pathway enzymes [42,43], which regulate the biosynthesis of flavan-3-ols [44]. WD40 is a ‘master regulator’ in activating the flavonoid pathway independently [45]. The MYB transcription factor is the core component of the MBW complex, and its subgroup of R2R3-MYB is mainly involved in regulating flavonoid metabolism [46]. The overexpression of AN4 (an R2R3-MYB gene) promotes the expression of the anthocyanin biosynthesis gene of CHI, F3H, and DFR [47]. LhMYB12 activated the lily’s CHS as well as DFR gene promoter directly and obstructed anthocyanin biosynthesis under high temperatures [48]. Although MYB can stimulate its companion of bHLH, its expression depends on different pigmented tissues [44]. TT8 (a bHLH gene) accumulates anthocyanin and proanthocyanin biosynthesis by expressing DFR in Arabidopsis thaliana [49]. The MADS-box genes of ScAGL11 and ScAG inhibit anthocyanin accumulation in the cineraria capitulum by downregulating the expression of ScCHS2, ScDFR3, and ScF3H1 [50]. To date, the molecular mechanisms of flavonoid biosynthesis are more demonstrated in plants, while there are no reports on L. chinense var. rubrum.
Here, one L. chinense, ‘Xiangnong Xiangyun’, and three L. chinense var. rubrum, ‘Huaye Jimu 2’, ‘Xiangnong Fenjiao’, and ‘Xiangnong Nichang’, were studied (Figure 1A). We identified the components of the flavonoid biosynthesis pathway in the three L. chinense var. rubrum and one L. chinense cultivar with MRM (multiple reaction monitoring). Then, the full-length transcriptome data and the next-generation sequencing data were obtained by combining NGS and SMRT sequencing. Moreover, this approach, combined with the flavonoid metabolic data, was applied to explain the molecular mechanisms of the flower coloring of Loropetalum cultivars, in which flavonoids are produced and accumulated. Accordingly, this study provides a valuable resource for further investigating flavonoid biosynthesis and ornamental flower coloring modification as well as breeding.

2. Materials and Methods

2.1. Plant Materials

One Loropetalum chinense (‘Xiangnong Xiangyun’, XX) and three L. chinense var. rubrum (‘Huaye Jimu 2’, HJ; ‘Xiangnong Fenjiao’, XF; and ‘Xiangnong Nichang’, XN) were planted in the germplasm garden of Loropetalum spp. at Hunan Agricultural University, Changsha, Hunan Province, China (E 113.08, N 28.17). XX, XN, and XF were the naturally pollinated offspring of HJ. The flowers (flowers in full bloom for one day), stems, leaves, and roots of HJ were harvested for Iso-Seq library construction. The flowers of XX, HJ, XF, and XN were also collected for total anthocyanin detection and sequencing library construction. We considered 50 flowers comprising 1 biological sample for each Loropetalum cultivar, and each sample was segregated as 3 independent biological replicates. All of these samples were frozen in liquid nitrogen immediately and stored at −80 °C.

2.2. Petal Color Comparison

The RHS color chart (sixth edition 2015, Royal Horticultural Society, 80 Vincent Square, London SW1P 2 PE, UK) was used to describe the color differences among the four Loropetalum spps. A spectrophotometer (YS3020, Technology Co. Ltd., Shenzhen, China) was used to measure the color-related values of fresh petals’ L*, a*, and b*. The parameters of L*, a*, and b* were described in CIELAB (CIE 1976). In this system, the value of L* represented lightness (those that had higher L* values represented a white or near-white color, while those with lower ones had a black or near-black color), a* was a positive or negative coordinate representing a purplish-red-bluish-green color, and b* was a positive or negative coordinate representing a yellow-blue color.

2.3. Transverse Section Observation

For transverse section observations, the different Loropetalum spp. petals were cut into thin slices by using a razor blade. Additionally, the thin slice was then fully extended flat on a temporary slide with a clean filter covering. Next, the temporary glazing of petals was observed and photos were taken with a microscope (DMIL LED, Leica, Wetzlar, Germany) and its imaging system (LEICA DFC295 and Leica Microsystems CMS GmbH, Leica, Wetzlar, Germany).

2.4. Total Anthocyanins Analysis

The total anthocyanins content was determined as described by Zhang et al. [51] and Dong et al. [52]. Briefly, 0.5 g of Loropetalum spp. petals was ground to a powder in liquid nitrogen. These powders were then extracted with 5 mL of a mixture solution of 0.05% HCl in methanol at 4 °C for 24 h in darkness. The supernatant was transferred into a clean tube after centrifugation at 1000× g at 4 °C for 15 min. Additionally, 1 mL of supernatant was then transferred into a clean tube with 4 mL of buffer A (0.4 M KCl, pH 1.0) and buffer B (1.2 N citric acid, pH 4.5), respectively. Absorbance measurements of the mixture were taken at 510 and 700 nm for mixtures A and B, separately. The total anthocyanin content was calculated via the use of the following formula: TA = A × MW × 5 × 100 × V/e (Romero et al., 2008). TA represents the total anthocyanin content of the detected sample (mg/100 g, as cyanidin-3-O-glucose equivalent), and V represents the final volume (mL). A = [A510 (pH 1.0)–A700 (pH1.0)]–[A510 (pH 4.5)–A700 (pH 4.5)]. The value of 449.2 represents the molecular mass of cyanidin-3-O-glucose. Furthermore, the value of 26,900 reflects the molar absorptivity (e) at 510 nm [53]. Each biological replicate was repeated in triplicate.

2.5. Flavonoid Extraction and MRM

Freeze-dried flowers were crushed via the use of a mixer mill (MM 400, Retsch, Haan, Germany) with a zirconia bead for 1.5 min at 30 Hz. Of the fine powder, 100 mg was extracted overnight at 4 °C with 1.0 mL of 70% aqueous methanol. The extract’s supernatant was absorbed (CNWBOND Carbon-GCB SPE Cartridge, 250 mg, 3 mL; ANPEL, Shanghai, China, www.anpel.com.cn/, 25 August 2019) after centrifugation at 10,000× g for 10 min before the LC-MS analysis. The supernatant was analyzed using an LC-EMS-MS/MS (HPLC, Shim-pack UFLC SHIMADZU CBM30A system, Kyoto, Japan, www.shimadzu.com.cn/, accessed on 24 April 2023; MS, Applied Biosystems 4500 Q TRAP, Waltham, MA, USA, www.appliedbiosystems.com.cn/, accessed on 24 April 2023). Moreover, the analytical conditions were composed of a column of Waters ACQUITY UPLC HSS T3 C18 (1.8 µm, 2.1 mm × 100 mm). Water and acetonitrile with 0.04% acetic acid were used as solvent systems. The gradient program of HPLC was performed as 100:0 v/v at 0 min, 5:95 v/v at 11.0 min, 5:95 v/v at 12.0 min, 95:5 v/v at 12.1 min, and 95:5 v/v at 15.0 min. The flow rate was 0.40 mL/min with an injection volume of 5 μL, and the column temperature was 40 °C. The effluent was alternatively connected to an ESI-triple quadrupole-linear ion trap (Q TRAP)-MS [6,38].
A triple quadrupole-linear ion trap mass spectrometer (Q TRAP) API 4500 Q TRAP LC/MS/MS System equipped with LIT and triple quadrupole (QQQ) scans were used to obtain the information on the flavonoid metabolites. Moreover, the analysis system was equipped with an ESI Turbo Ion-Spray interface, operating in a positive ion mode and controlled by Analyst 1.6.3 software (AB Sciex). The ESI system index sets were followed by Chen et al. [6] and Zhang et al. [38]. Instrument tuning and mass calibration were performed with 10 and 100 μmol/L polypropylene glycol solutions in QQQ and LIT modes, respectively. QQQ scans were acquired as MRM experiments with the collision gas (nitrogen) set to 5 psi. DP and CE for individual MRM transitions were performed with further DP and CE optimization. MassBank, KNAPSACK, HMDB, MOTDB, and METLIN were used to analyze the structures of metabolites. The KEGG pathway public database was used to identify the specific metabolic pathways. The qualitative and quantitative data of each flavonoid metabolite were identified and quantified based on the MWDB and open public metabolite database. A specific set of MRM transitions was monitored for each period according to the metabolites eluted within this period. The target substance was screened and identified by the parent ion (Q1), fragment ions (Q2), and characteristic fragment ions (Q3) [6,38].

2.6. RNA Sample Preparation

Total RNA was prepared by grinding tissues into powder in liquid nitrogen and mixing 0.5 g of said powder with 1 mL of TRIzol reagent (GenStar P124-01). It is processed following the protocols provided by the manufacturer (#124-01, GenStar, Beijing, China, https://www.gene-star.com/pro_cont_10220.html#coming, accessed on 24 April 2023). All samples were replicated three times. Then, 1% agarose gels and NanoDrop (NanoDrop products, Wilmington, NC, USA) were used to detect RNA degradation as well as contamination. The quantity and quality of total RNA were assessed using a Qubit® RNA Assay Kit in a Qubit® 2.0 Fluorometer (Life Technologies, South San Francisco, CA, USA) and an Agilent 2100 Bioanalyzer (Agilent Technologies, Santa, Clara, CA, USA), respectively. Two experiments were conducted: One was the different organs (leaf, flower, root, and stem) of the total RNA extracted and mixed with equal amounts to be a pool of L. chinense var. rubrum RNA. The other was 4 flower cultivars (HJ, XNNY, XF, and XN) with 12 libraries subjected to 2 × 150 paired-end RNA-seq using ILLUMINA novaseq 6000. All of the qualified RNA samples were stored at −20 °C and used for SMRT sequencing in addition to RNA-seq within one week.

2.7. PacBio Iso-Seq Library Preparation and SMRT Sequencing

A total of 3.9 μg of equal mixed RNA was sequenced on the PacBio Sequel platform (Pacific Bioscience, Menlo Park, CA, USA) according to the manufacturer’s instructions, as previously described (Hoang et al., 2017; Hoang et al., 2019). The Oligo (dT) magnetic beads were used to enrich mRNA for the cDNA libraries. The Iso-Seq library was prepared with a Clontech SMARTer PCR cDNA synthesis kit (#634926; Clontech, Takara Bio Inc., Shiga, Japan) and BluePippin Size Selection System protocol described by Pacific Biosciences (PN 100-092-800-03). Fractions of cDNA with a size over 4 kb were run on the BluePippinTM System to remove the short SMRTbell templates. After size fraction, the optimal library was sequenced on a PacBio RS II instrument at the Novogene technology company (Beijing, China).
The circular consensus sequence was generated from subread BAM files and then classified into non-full-length and full-length FASTA files by using pbclassify.py with ignore polyA false and min Seq Length 200. Next, the isoform-level clustering (ICE) and final arrow polishing were fed into the clustering step via following the parameter configuration of hq_quiver_min_accuracy 0.99, bin_by_primer false, bin_size_kb 1, qv_trim_5p 100, and qv_trim_3q 30. Additionally, the nucleotide errors in consensus reads were corrected via the use of Illumina RNA-seq data with the LoRDEC software [54]. Finally, the final transcripts were obtained in corrected consensus reads by removing the redundant sequences with the CD-HIT software (-c0.95-T6 -G0 -Al 0.00 -aS 0.99) [55]. The raw sequence data reported in this paper have been deposited in the Genome Sequence Archive (Genomics, Proteomics & Bioinformatics 2021) in the National Genomics Data Center (Nucleic Acids Res 2022), China National Center for Bioinformation/Beijing Institute of Genomics, Chinese Academy of Sciences (GSA: CRA009285 and CRA009284), publicly accessible at https://ngdc.cncb.ac.cn/gsa, accessed on 24 April 2023.

2.8. Illumina RNA-Seq Library Construction and Sequencing

Twelve libraries of four cultivars of RNA samples were prepared and sequenced, respectively. A total of 2 μg of RNA was used for shot read sequencing on the HiSeq4000 platform, and 150 bp paired-end reads were generated at the Novogene technology company in Beijing, China. The NEBNext® UltraTM RNA Library Prep Kit for Illumina® (NEB, Ipswich, MA, USA) was used for sequencing libraries, following the manufacturer’s recommendations.

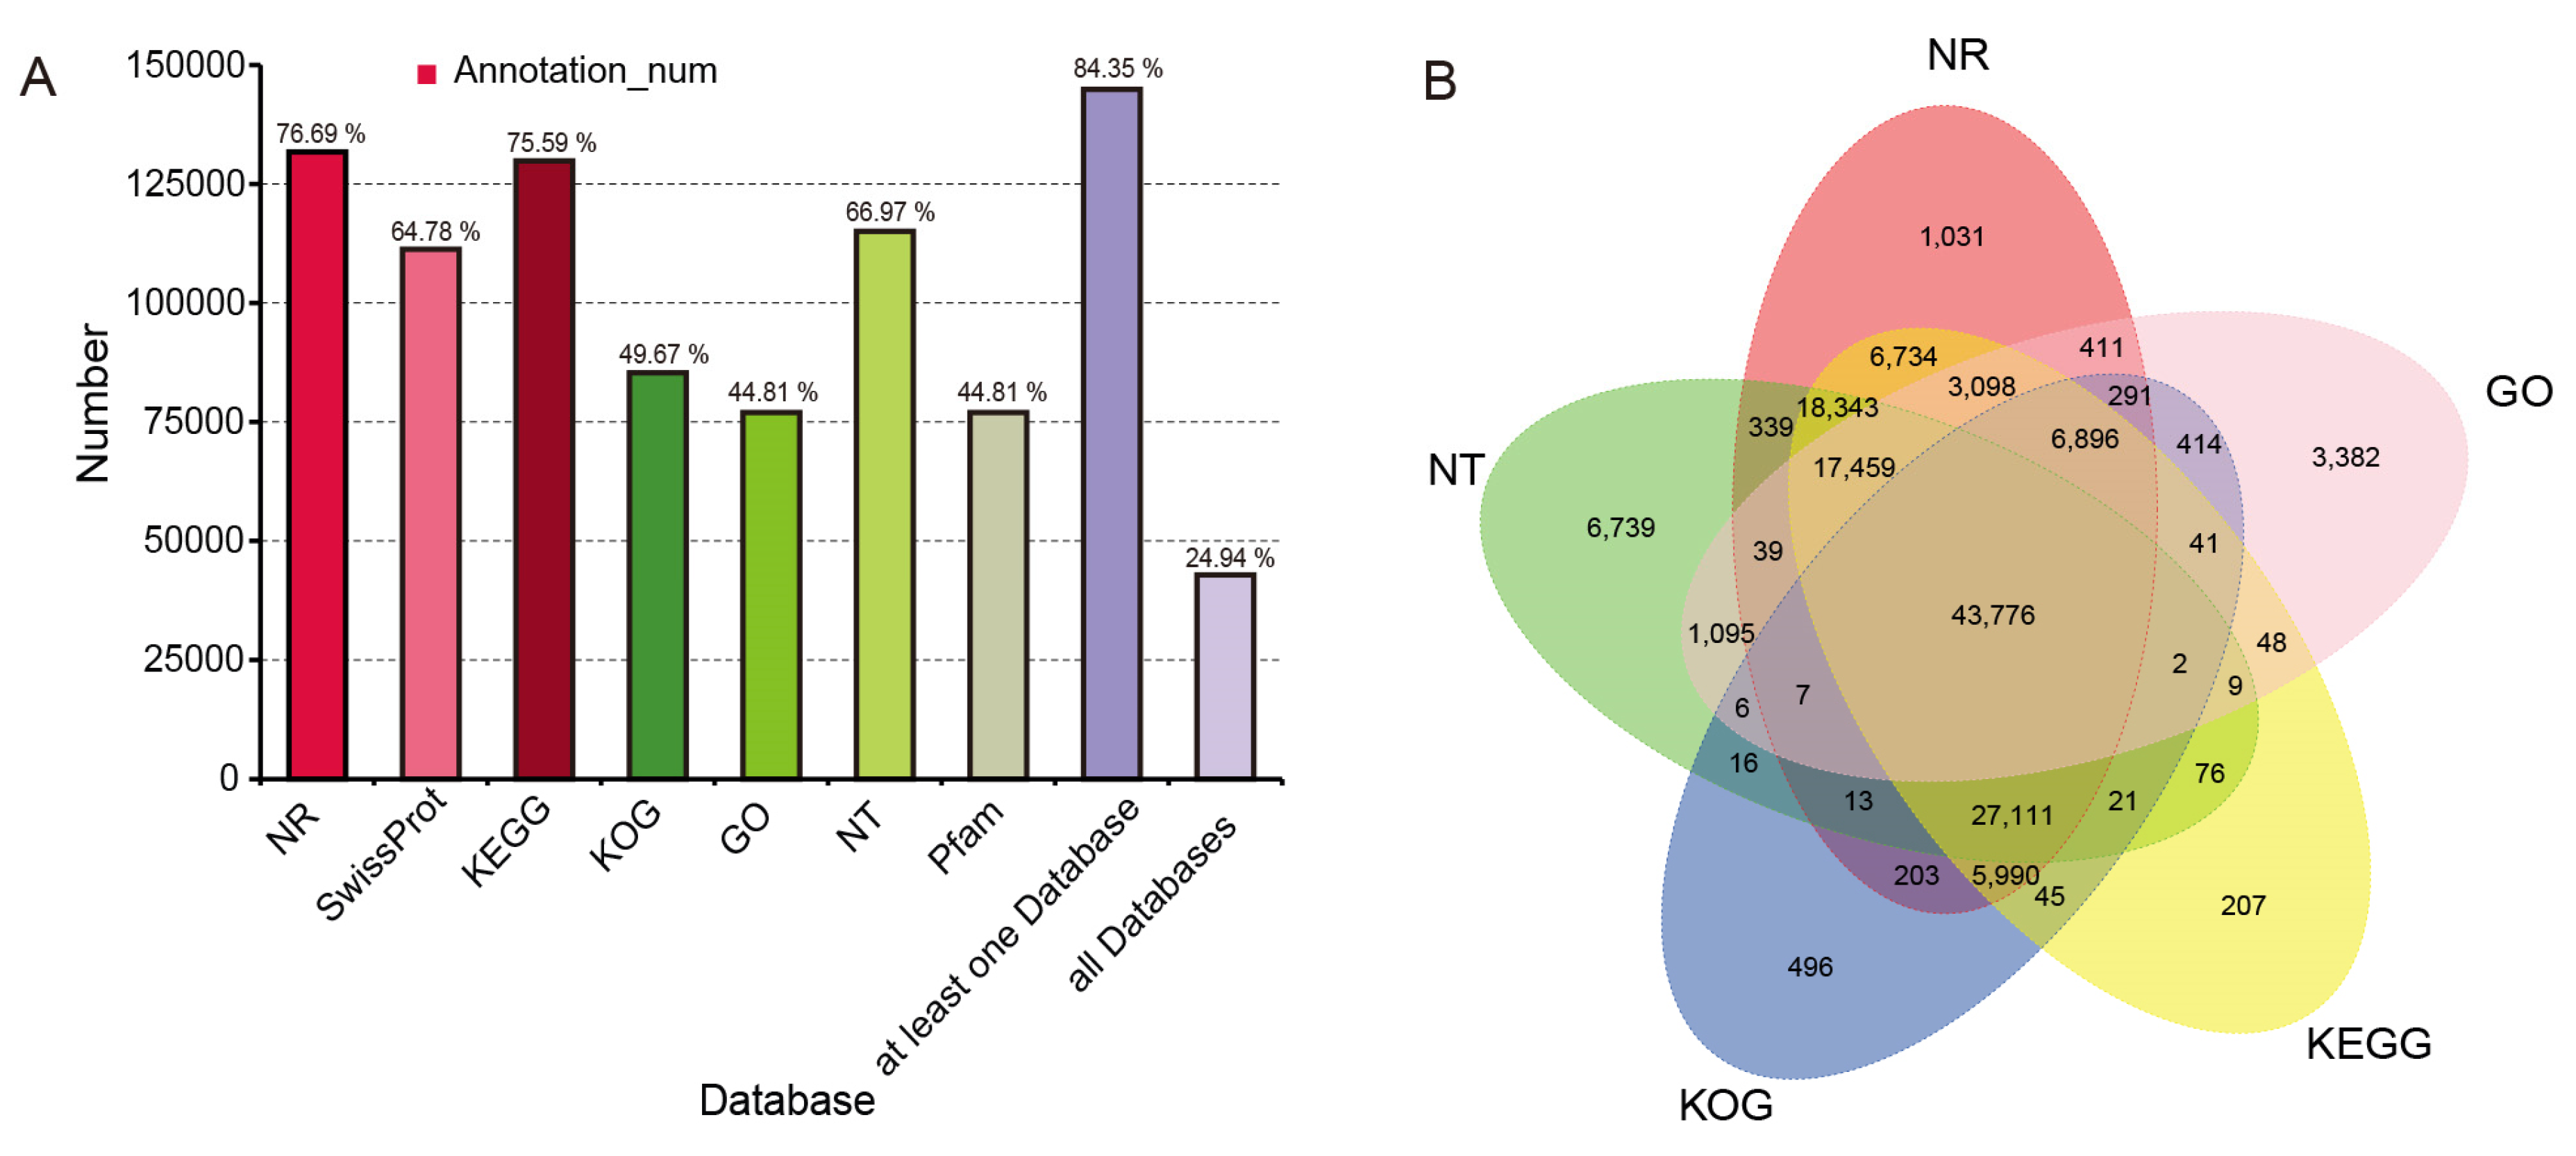
2.9. Gene Functional Annotation, Coding Sequence (CDS) Prediction, Transcription Factor (TF), and Long Non-Coding RNA (lncRNA) Identification

All final transcript annotations were carried out via comparison against the following databases: NCBI nonredundant protein sequences (NR) [56], NCBI nonredundant nucleotide sequences (NT) [57], Protein family (Pfam) [58], Clusters of Orthologous Groups of proteins (KOG/COG) [59], a manually annotated and reviewed protein sequence database (Swiss-Port) [60], KEGG Ortholog database (KO) [61], and Gene Ontology (GO) [62]. The BLAST software with the set of e-values ‘1e−10’ was used for NT database analyses [63]. Diamond Blast with the option of e-value ‘1e−10’ was applied to the NR, KOG, Swiss-Port, and KEGG database analyses [64]. Moreover, the Hmmscan software was used for the Pfam database analyses [65].
The ANGEL pipeline, a long-read ANGLE implementation, was used to determine cDNA protein-coding sequences. We used L. chinense var. rubrum and closely related species confident protein sequences for ANGEL training and then ran the ANGEL prediction for final transcripts [66]. The iTAK software [67] and Plant Transcription Factor database [68] were used to identify TFs, transcriptional regulators (TRs), and protein kinases (PKs) with final transcripts of L. chinense var. rubrum. The following four tools were used to predict the lncRNAs of L. chinense var. rubrum: Coding-Non-Coding-Index (CNCI) [63], Coding Potential Calculator (CPC) [69], Pfam-scan [70], and PLEK [54]. The detected transcripts predicted with coding potential by either/all of the four tools were filtered out, and those without coding potential were our candidate set of LncRNAs.

2.10. Quantitation and Differential Expression of Transcripts and Genes Analysis

The twelve samples of raw data were subjected to quality control, including adapters, lower reads, and ploy-N, by fastQC v0.11.2 [71]. Additionally, the clean data were then obtained and mapped onto the L. chinense var. rubrum full-length transcriptome of final transcripts via the use of Bowtie2 (v2.2.5) [72]. The readcount for each transcript was estimated by the expected number of fragments per kilobase of transcript sequence per millions of base pairs sequenced (FPKM) [73] method through using RESM [74]. A correlation analysis between samples of each cultivar was used to test the repeatability of the samples. The three biological samples with a correlation coefficient value more considerable than 0.92 were performed for differentially expressed gene (DEG) and differentially expressed transcript (DET) analyses. The DEGs and DETs between each paired sample were performed by the DESeq R packages [75]. Genes and transcripts with |log2 fold change| ≥ 2 and an adjusted p-value ≤ 0.05 were considered significant DEGs and DETs. The Gene Ontology (GO) enrichment of all of the DEGs and DETs was performed via the use of the GO-seq R packages [76]. The KEGG database and KOBAS software were subjected to KEGG pathway enrichment analyses; significantly enriched metabolic or signal transduction pathways with an adjusted p value of ≤ 0.05 were selected.

2.11. The Correlation Analysis between DETs and DCMs

The differential content metabolites (DCMs) of flavonoids and anthocyanins in addition to the differentially expressed transcripts (DETs) based on KEGG enrichment analyses of flavonoid biosynthetic pathway and anthocyanin biosynthetic pathway genes were used for integrative analyses. Moreover, Spearman’s method was used to analyze the correlation coefficients for transcriptome and metabolome data integration. The connection between DETs and DCMs was shown through a heat plot.

3. Results

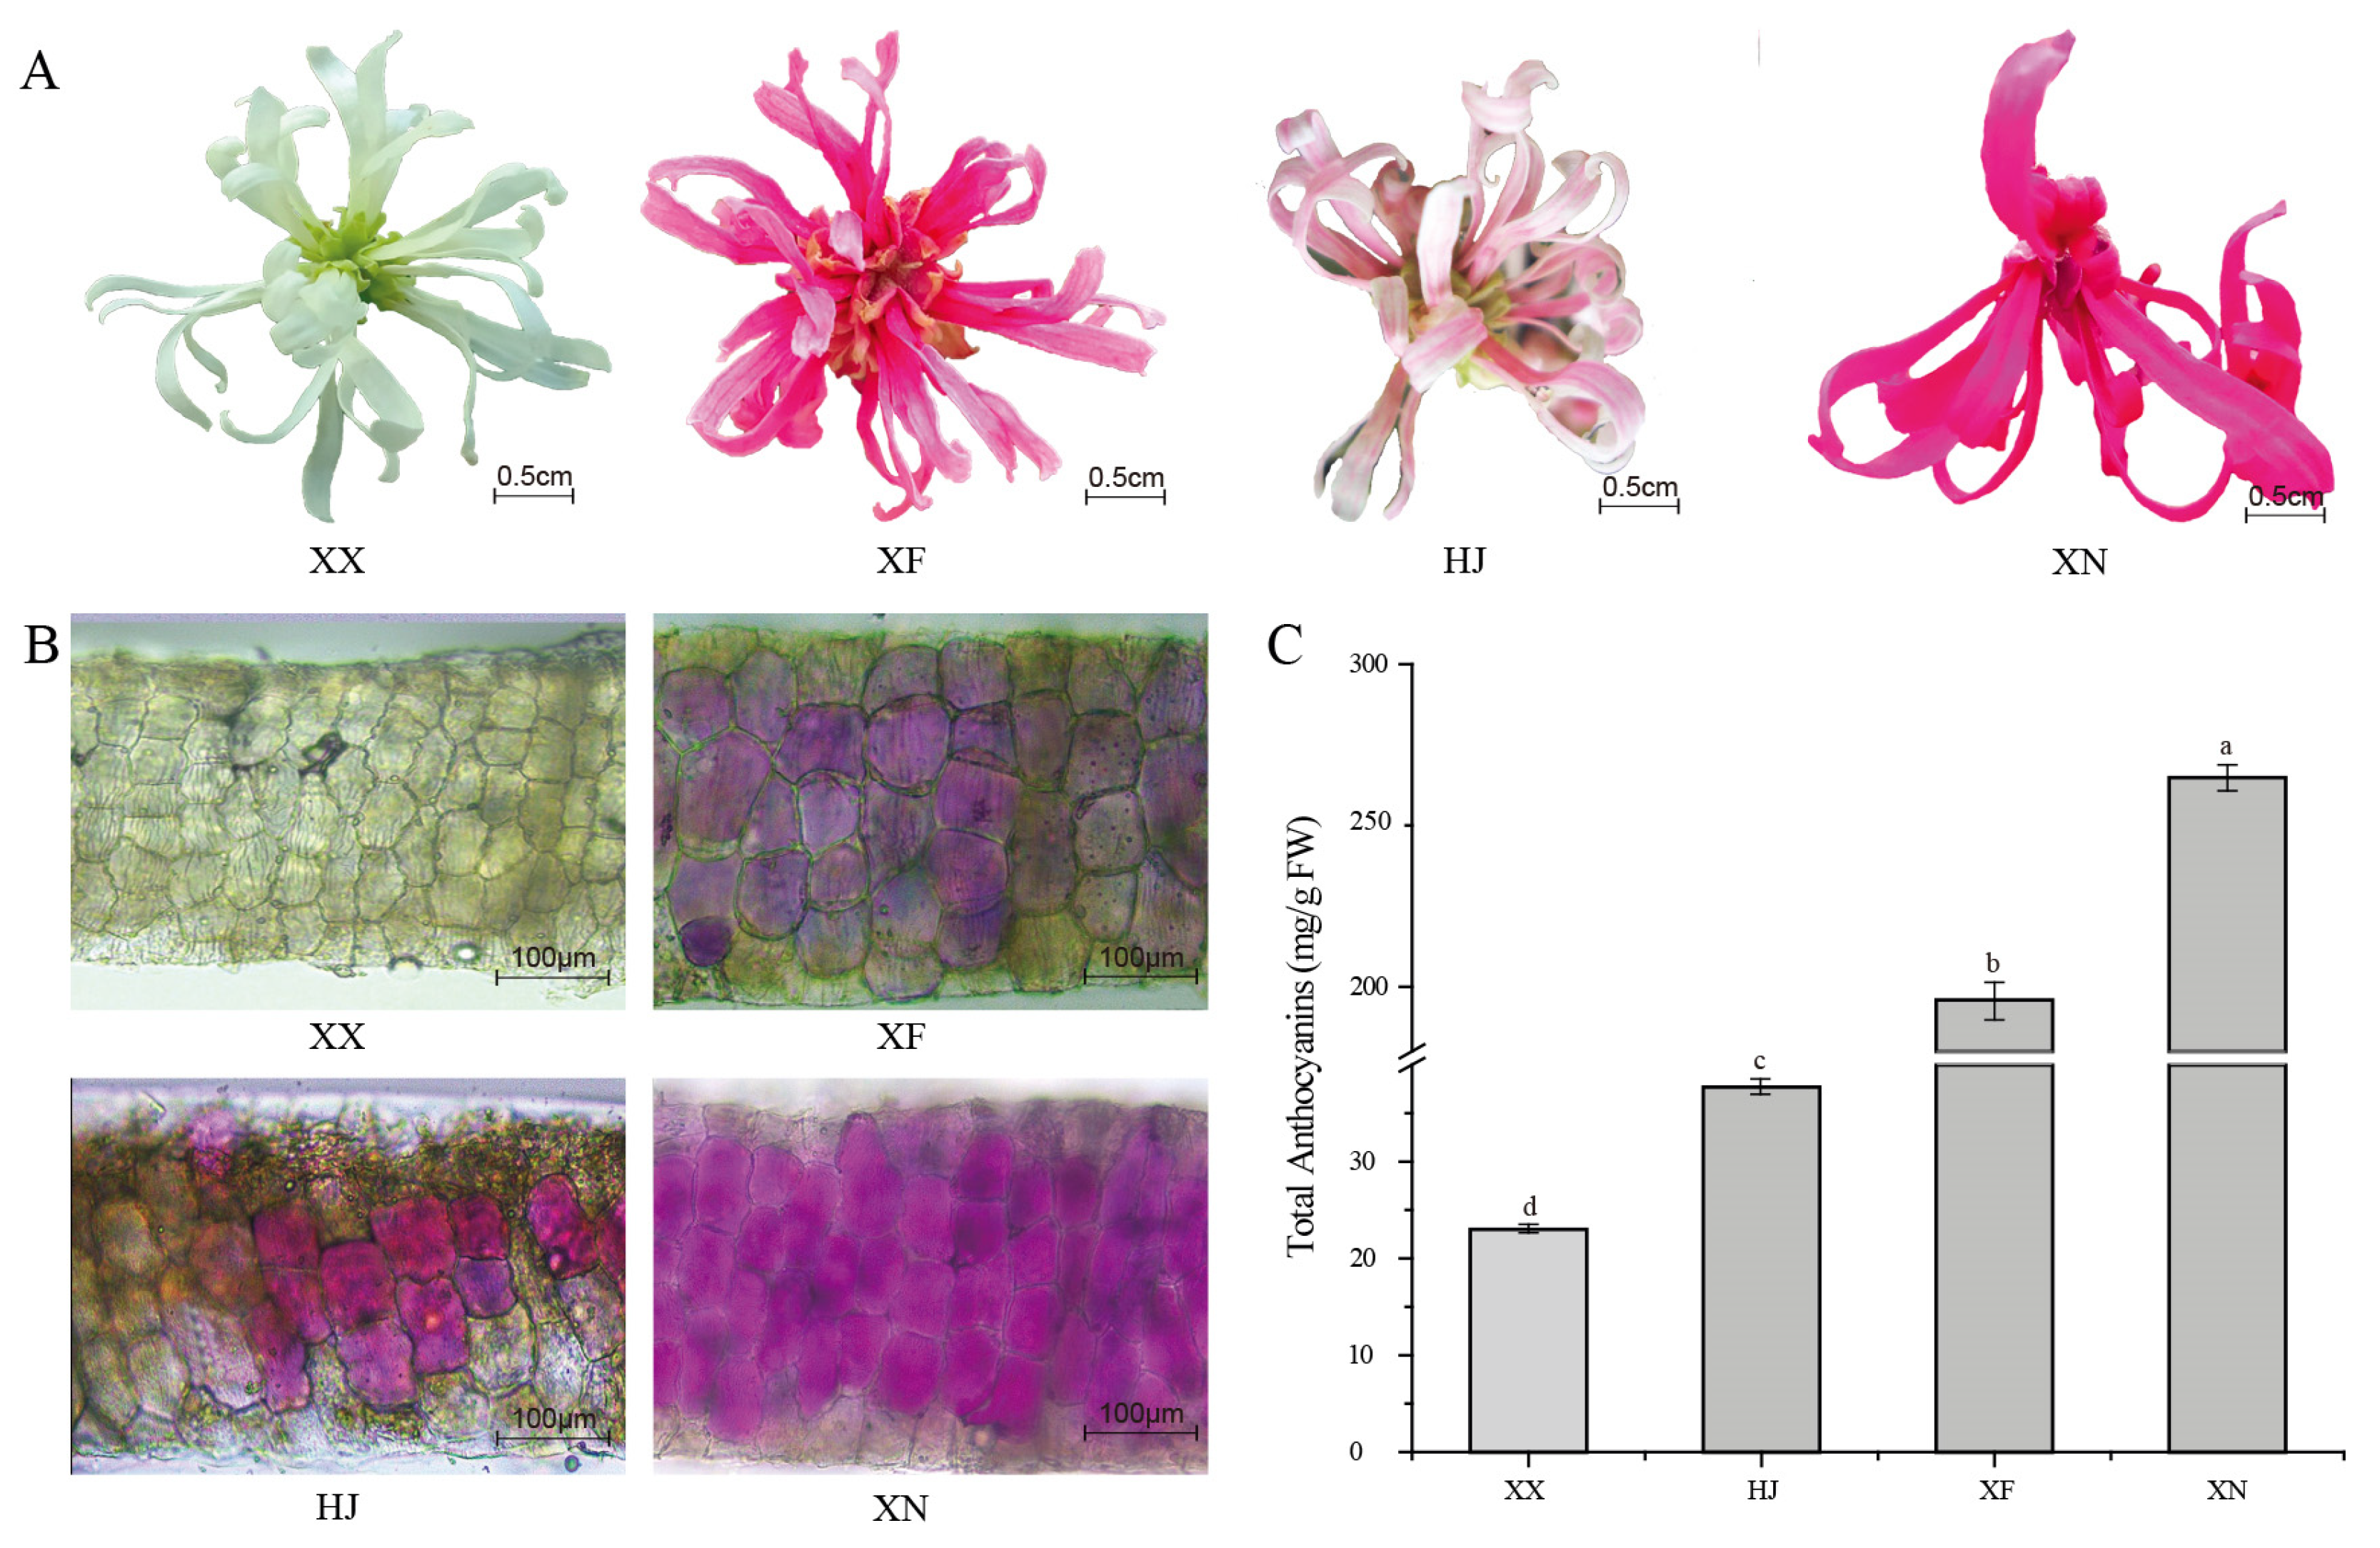
3.1. Petal Color Phenotype and Total Anthocyanins Content among the Four Loropetalum Cultivars

Four Loropetalum cultivars were selected to elucidate the mechanisms of flavonoid biosynthesis in petals, a white flower petal control cultivar, namely ‘Xiangnong Xiangyun’ (XX) (Royal Garden Color Card, NN155B), and three L. chinense var. rubrum, namely ‘Huaye Jimu 2’ (HJ) (white part: Royal Garden Color Card, NN155C; purple part: Royal Garden Color Card, 61A), ‘Xingnong Fenjiao’ (XF) (Royal Garden Color Card, 61C), and ‘Xiangnong Nichang’ (XN) (Royal Garden Color Card, 63A) (Figure 1A). The transverse section of petals showed that the distribution of anthocyanins was significant different in four Loropetalum spp. (Figure 1B). The a* value representing redness was 0.79, 1.5, 4.52, and 2.24 among XX, HJ, XF, and XN, respectively. The b* value of these four Loropetalum cultivars (XX, HJ, XF, and XN) was −5.89, −6.29, −4.36, and −4.74, which represented blueness. The L* value, representing lightness, showed at 80.43, 100.91, 96.49, and 98.91 in four Loropetalum cultivars.
The total anthocyanins in the blooming petals for two days were detected with a spectrophotometric pH differential method. Among these four Loropetalum cultivars, the lowest level of anthocyanin accumulation (23.03 mg/g of FW) was detected in XX. Among the three L. chinense var. rubrum cultivars, the flower color with chimera (Huaye Jimu 2, HJ, 37.71 mg/g of FW) contains more anthocyanins than XX (Figure 1C). The results indicated that the highest level of anthocyanin content was in ‘Xiangnong Nichang’ (XN, 264.96 mg/g of FW) (Figure 1C). It was shown that the sharp differences in anthocyanin accumulation are due to genetic diversity and specificity. Additionally, a surprising degree of anthocyanin accumulation was observed in the four Loropetalum cultivars, especially in XN and XF.

3.2. Identification and Qualification of Flavonoid Metabolite Profiles from the Petals of Loropetalum Cultivars

To identify flavonoid metabolite profiles in Loropetalum cultivars, extracts from the petals of XX, HJ, XF, and XN were analyzed via MRM. A total of 207 flavonoid metabolites were identified from the 4 samples, including 39 flavonol metabolites, 7 isoflavone metabolites, 25 flavonoid metabolites, 79 flavone metabolites, 20 flavanone metabolites, 19 polyphenol metabolites, 15 anthocyanin metabolites, and 3 proanthocyanin metabolites, which were isolated and identified in all 4 of the Loropetalum cultivars’ petal extracts (Table S1 and Figure 2A). The total content of each flavonoid compound was significantly different. For example, in HJ, XN, and XF the anthocyanin metabolites were the most abundant ones, followed by flavonol or polyphenol metabolites, while flavonol metabolites were the most abundant in XX, followed by polyphenol ones (Figure 2A). In addition, we performed a principal component analysis (PCA), and these 207 flavonoid metabolites could be divided into 4 groups, which is consistent with the flower color phenotypical characteristics of the four Loropetalum plants (Figure 2B). To sum up, the accumulation of flavonoid components in flowers is significantly correlated with variety specificity.

3.3. Differential Accumulation of Flavonoid Metabolites in Loropetalum Plant’s Petals

To investigate the different metabolites’ changes and the expression levels of flavonoids involved in L. spps., the types and relative accumulation levels of flavonoid compounds were analyzed among the four selected cultivars (Supplementary Tables S1–S7). The results shown in the upset plot (Figure 2C) and volcano plot (Figure 2D–I) demonstrate that metabolites significantly differed among them. In total, 168 flavonoid metabolites were commonly found in the 4 samples. Notably, eight flavonols (Kaempferide, Ayanin, Chrysoeriol 6-C-hexoside, ‘di-C, C-hexosyl-apigenin’, 8-C-hexosyl chrysoeriol O-hexoside, Tricin 7-O-hexosyl-O-hexoside, Acacetin O-glucuronic acid, and Apigenin 6,8-C-diglucoside), one flavanone (Hesperetin O-Glucuronic acid), and three anthocyanins (Peonidin, Peonidin 3-sophoroside-5-glucoside, and Petunidin 3-O-glucoside) were coexisting in the petals of HJ, XF, and XN (Figure 2C, Supplementary Table S8). Furthermore, five flavones (Apiin, Tricin O-rhamnosyl-O-malonylhexoside, C-hexosyl-chrysin O-feruloylhexoside, Chrysoeriol O-sinapoylhexoside, and Apigenin 7-rutinoside (Isorhoifolin)) and one anthocyanin (Malvidin 3-acetyl-5-diglucoside) commonly existed in XF and XN (Figure 2C, Supplementary Table S8). Additionally, three anthocyanidins (Peonidin, Petunidin 3-O-glucoside, and Peonidin 3-sophoroside-5-glucoside), one flavanone (Hesperetin O-Glucuronic acid), six flavones (Chrysoeriol 6-C-hexoside, di-C,C-hexosyl-apigenin, 8-C-hexosyl chrysoeriol O-hexoside, Tricin 7-O-hexosyl-O-hexoside, Acacetin O-glucuronic acid, and Apigenin 6,8-C-diglucoside), and two flavonols (Kaempferide, Ayanin) were found in HJ, XN, and XF, respectively. Moreover, one flavone (C-hexosyl-luteolin O-hexoside) and one isoflavone (Glycitin) were detected in XX (Figure 2C, Supplementary Table S8). In addition, Cyanidin 3-O-glucoside was found in XF, XN, XX, and HJ, significantly differing in the four samples (Figure 2C, Supplementary Table S8).
The flavonoid metabolites’ distribution could be divided into up- and downregulated types. Based on the fold changes and VIP values of the OPLS-DA of flavonoid metabolites in the four samples, 59, 48, 50, 59, 56, and 48 differential concentrations of flavonoid metabolites (DCMs) (fold change ≥ 2 or fold change ≤ 0.5, and VIP ≥ 1) were detected in HJ VS XN (Figure 2D, Supplementary Table S9), HJ VS XF (Figure 2E, Supplementary Table S10), HJ VS XX (Figure 2F, Supplementary Table S11), XN VS XF (Figure 2G, Supplementary Table S12), XN VS XX (Figure 2H, Supplementary Table S13), and XF VS XX (Figure 2I, Supplementary Table S14), respectively. These DCMs were then introduced into the Kyoto Encyclopedia of Genes and Genomes (KEGG) database and KEGG enrichment analyses to explore the potential metabolic pathways affected by the different colored petals. The ‘Biosynthesis of secondary metabolites’ (ko01110), ‘Flavonoid biosynthesis’ (ko00941), ‘Anthocyanin biosynthesis’ (ko00942), ‘Isoflavonoid biosynthesis’ (ko00943), and ‘Flavone and flavonol biosynthesis’ (ko00944) were screened out to be the most relative metabolic pathways related to the petals’ coloring (Figure S1, Supplementary Tables S15–S20). Notably, the different relative contents of Kaempferide (Flavonol), Glycitin (Isoflavone), Apiin (Flavone), Tricetin (Flavone), Naringenin 7-O-glucoside (Flavanone), Cyanidin 3,5-O-diglucoside (Anthocyanin), Cyanidin 3-O-glucoside (Anthocyanin), Delphinidin (Anthocyanin), Delphinidin 3-O-glucoside (Anthocyanin), Petunidin 3-O-glucoside (Anthocyanin), and Pelargonidin (Anthocyanin) were significantly different in the four cultivars of petals. Additionally, the Kaempferide, Malvidin 3-acetyl-5-diglucoside, Peonidin, Peonidin 3-sophoroside-5-glucoside, Petunidin 3-O-glucoside, Cyanidin 3,5-O-diglucoside, Cyanidin 3-O-glucoside, Delphinidin 3-O-glucoside, and Pelargonidin had much higher contents in XN, XF, and HJ, while the content of Delphinidin was the highest in XX (Figure S2, Supplementary Tables S15–S20). The phenomenon mentioned above, flavonoid compounds from the three purple petals, indicated that these purple cultivars might differ in the expression of anthocyanin biosynthetic or regulatory gene expression from the white one.

3.4. Combined Sequencing Approach to Tissues of L. chinensis var. rubrum

To identify and differentiate the flower transcriptome of L. chinense, two sequencing strategies were adopted by using the NGS and SMRT sequencing platforms. First, the twelve mRNA samples from four flower petals (HJ, XN, XF, and XX, each in triplicate) were performed via 2 × 150 paired-end sequencing by using a HiSeq 4000 platform, with each sample yielding 8.14 Gb of clean data on average, and the Q30 values of all of the 12 samples were higher than 93.82%. The average coverage of each Illumina transcriptome data mapping to the L. chinense var. rubrum full-length transcriptome was 82.92% (80.36~86.77%), which indicated that the data were comparable (Supplementary Table S21). The second strategy was that full-length cDNAs from 12 pooled total RNA samples were normalized and SMRT sequencing was performed by using the PacBio platform (Supplementary Table S22). In total, 46.16 Gb of polymerase read bases (1,562,962 polymerase reads) were generated by the PacBio sequence, with an average read length of 29,532 bp and N50 of 51,440 bp. After filtering using the RS Subreads.1 of the PacBio RS, 35,173,249 subreads representing 43.50 Gb were obtained. After clustering and polishing with ICE and arrow, 723,655 full-length non-chimeric reads were obtained. Finally, the clean Illumina reads were used to correct the SMRT reads of the polished consensus via the use of the LoRDEC software, the redundant sequences were removed by CD-HIT software, and 171,783 high-quality nonredundant transcripts were produced, with a total length of 406,454,922 bp and N50 length of 2935 bp; their lengths were in the range of 132 to 14,258 bp. High-quality full-length transcriptome data were obtained.
The final transcripts were annotated with the NR, KOG, GO, NT, Pfam, Swiss-Port, and KEGG databases, and they were also analyzed in terms of metabolic pathways and functional classifications. In total, 144,893 transcripts (84.35% of the total) were functionally annotated, and 52,851 transcripts (24.94% of the total) were subjected to all databases (Figure 3A). Furthermore, 5 public protein databases shared 43,776 transcripts (Figure 3B), with 131,741 transcripts (76.69% of the total) being assigned to the NR database. The NR databases had the most matched sequences, and the top five species, including Vitis vinifera, Juglans regia, Theobroma cacao, Nelumbo nucifera, and Ziziphus jujuba, had the best Blast hits ratios of over 50% (Figure S3). In the KOG database, 85,328 transcripts were subjected to 26 functional categories (Figure S4), and the largest group was general function prediction only, with 19,255 transcripts (22.57% of the total). Especially in the Q group, 3830 transcripts were assigned to the category of ‘Secondary metabolites biosynthesis, transport and catabolism’. A total of 76,974 transcripts were grouped into three GO categories of biological processes (BPs), cellular components (CCs), and molecular functions (MFs). All of the hit transcripts were divided into 54 subgroups, with many transcripts related to ‘metabolic process’ (35,888 of the total) and ‘biological regulation’ (9532 of the total) (Figure S5). A total of 129,856 transcripts were annotated into 6 categories subjected to the KEGG database (Figure S6). The most enriched was ‘Metabolism’ (40,595 of the total), and these transcripts were associated with the biosynthesis of carbohydrate metabolism (5657 of the total), phenylpropanoid biosynthesis (641 of the total), flavonoid biosynthesis (267 of the total), isoflavonoid biosynthesis (5 of the total), and flavone as well as flavonol biosynthesis (62 of the total) pathways.
The protein-coding and long non-coding RNA were obtained via full-length transcriptome sequencing. A total of 16,1387 CDSs were predicted from the transcripts (Figure S7A). Furthermore, these CDSs were blasted and hit with PlnTFDB and iTAK software for TF annotation. In total, 5487 TFs were identified and divided into more than 28 families (Figure S7B). The most abundant family was C2H2 (397 of the total), followed by C3H (341 of the total), bHLH (324 of the total), FAR1 (291 of the total), and SNF2 (254 of the total). In addition, 26,590 LncRNAs were predicted from the final transcripts, ranging from 200 to 11,293 bp (Figure S7C,D). These data provided an abundant gene and transcript pool for the further study of metabolic processes.

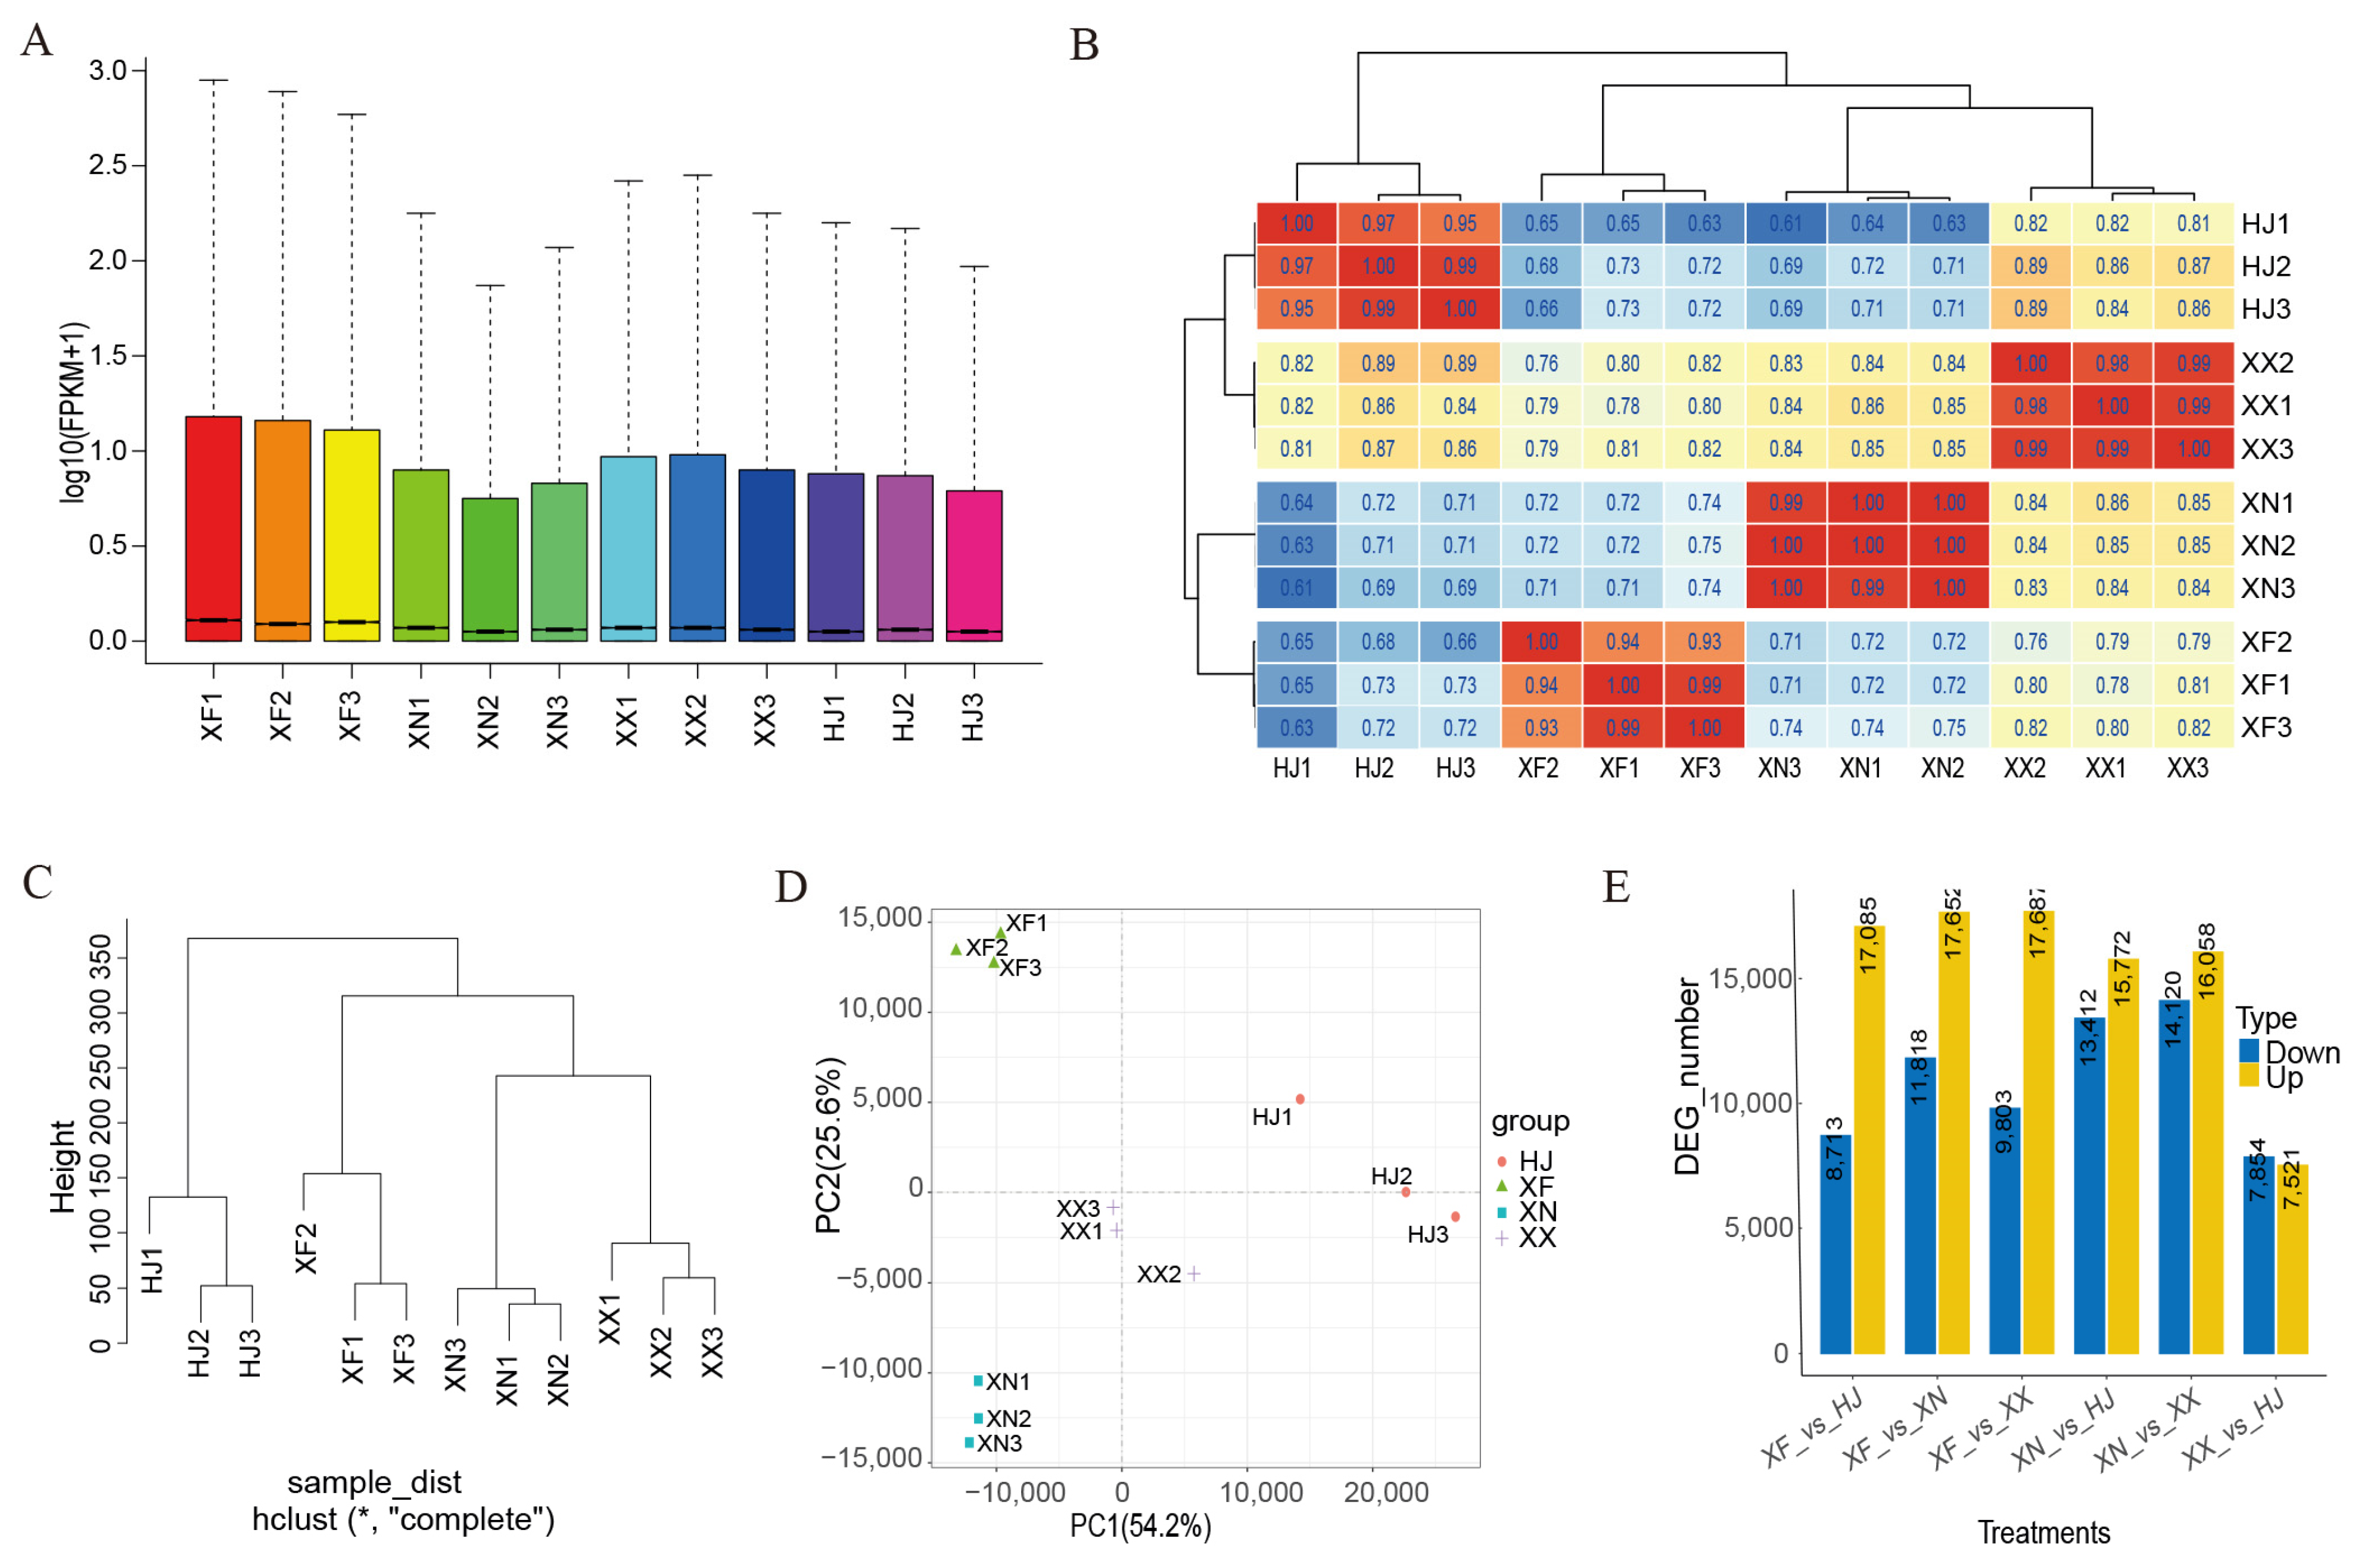
3.5. Global Transcriptomic Characteristics of Flowers during the Full-Bloom Stage

To acquire insight into the molecular mechanisms of L. chinense var. rubrum flowers, RNA samples from the four cultivars with dissimilar flower colorings were used for transcript quantification. The box histogram showed that all of the transcripts’ expression levels were significantly different in the four samples, and that the lowest level was in XN (Figure 4A); however, a correlation analysis indicated that all of the samples in each group had good reproducibility (Figure 4B). Moreover, the cluster dendrogram analysis and PCA analysis revealed that all of the samples within each group had high consistency (Figure 4C,D). A total of 8713, 17,085, 11,818, 17,652, 9803, 17,687, 13,412, 15,772, 1412, 16,058, 7854, and 7521 differential expression transcripts (DETs) were identified in the XF vs. HJ, XF vs. XN, XF vs. XX, XN vs. HJ, XN vs. XX, and XX vs. HJ compared combinations, respectively (Figure 4E). In particular, focusing on the pairwise comparisons group content of XF and XN (petals with a pearl coloring), the number of upregulated DETs was higher than that of downregulated ones, while the downregulated DETs were higher than upregulated ones in the XX vs. HJ group (petals with white and mosaic coloring). Additionally, the number of upregulated differentials expressing LncRNA was higher than downregulated ones in the groups of XF vs. HJ and XF vs. XX (Figure S8).
Differences in transcripts were analyzed in order to determine genes that may be involved in flower coloring formation among colorful petal cultivars. Furthermore, GO enrichment analysis was used to classify the function of the DETs. The results showed that the main enriched GO terms of DETs in the selected group belong to the ‘biological process’ (BP), ‘cellar component’ (CC), and ‘molecular function’ (MF) GO categories. In the groups of XN vs. HJ (Figure S9, Supplementary Table S23), XN vs. XX (Figure S10, Supplementary Table S24), XF vs. HJ (Figure S11, Supplementary Table S25), XF vs. XN (Figure S12, Supplementary Table S26), XF vs. XX (Figure S13, Supplementary Table S27), and XX vs. HJ (Figure S14, Supplementary Table S28) paired comparisons, the BP had 15, 15, 15, 15, 15, and 15 significantly enriched GO terms, respectively; the CC had 11, 12, 3, 6, 8, and 1 significantly enriched GO terms, respectively; and the MF had 15, 15, 16, 15, 15, and 15 significantly enriched GO terms, respectively. Moreover, the ‘biding’, ‘catalytic activity’, ‘metabolic process’, ‘cellular process’, and ‘organic substance metabolic process’ were the top five processes and molecular functions of significantly enriched GO terms.
The KEGG enrichment analysis of the differential expressed transcripts was analyzed for their biological functions (Supplementary Tables S23–S28, Figure S15). The results indicated that the ‘Phenylpropanoid biosynthesis’, ‘Flavonoid biosynthesis’, ‘Carotenoid biosynthesis’, ‘Monoterpenoid biosynthesis’, ‘Phenylalanine, tyrosine, and tryptophan biosynthesis’, ‘Photosynthesis-antenna proteins’, and ‘Plant hormone signal transduction’ enrichment pathways were obtained in the six paired comparisons, which demonstrated that those DETs had significant effects on petal coloring. Furthermore, phenylpropanoids and flavonoids are the most significant contributors to flower and leaf coloring. Therefore, the DETs involved in ‘Phenylpropanoid biosynthesis’ and ‘Flavonoid biosynthesis’ might play critical roles in different petal coloring formations within L. chinenses var. rubrum and L. chinenses.

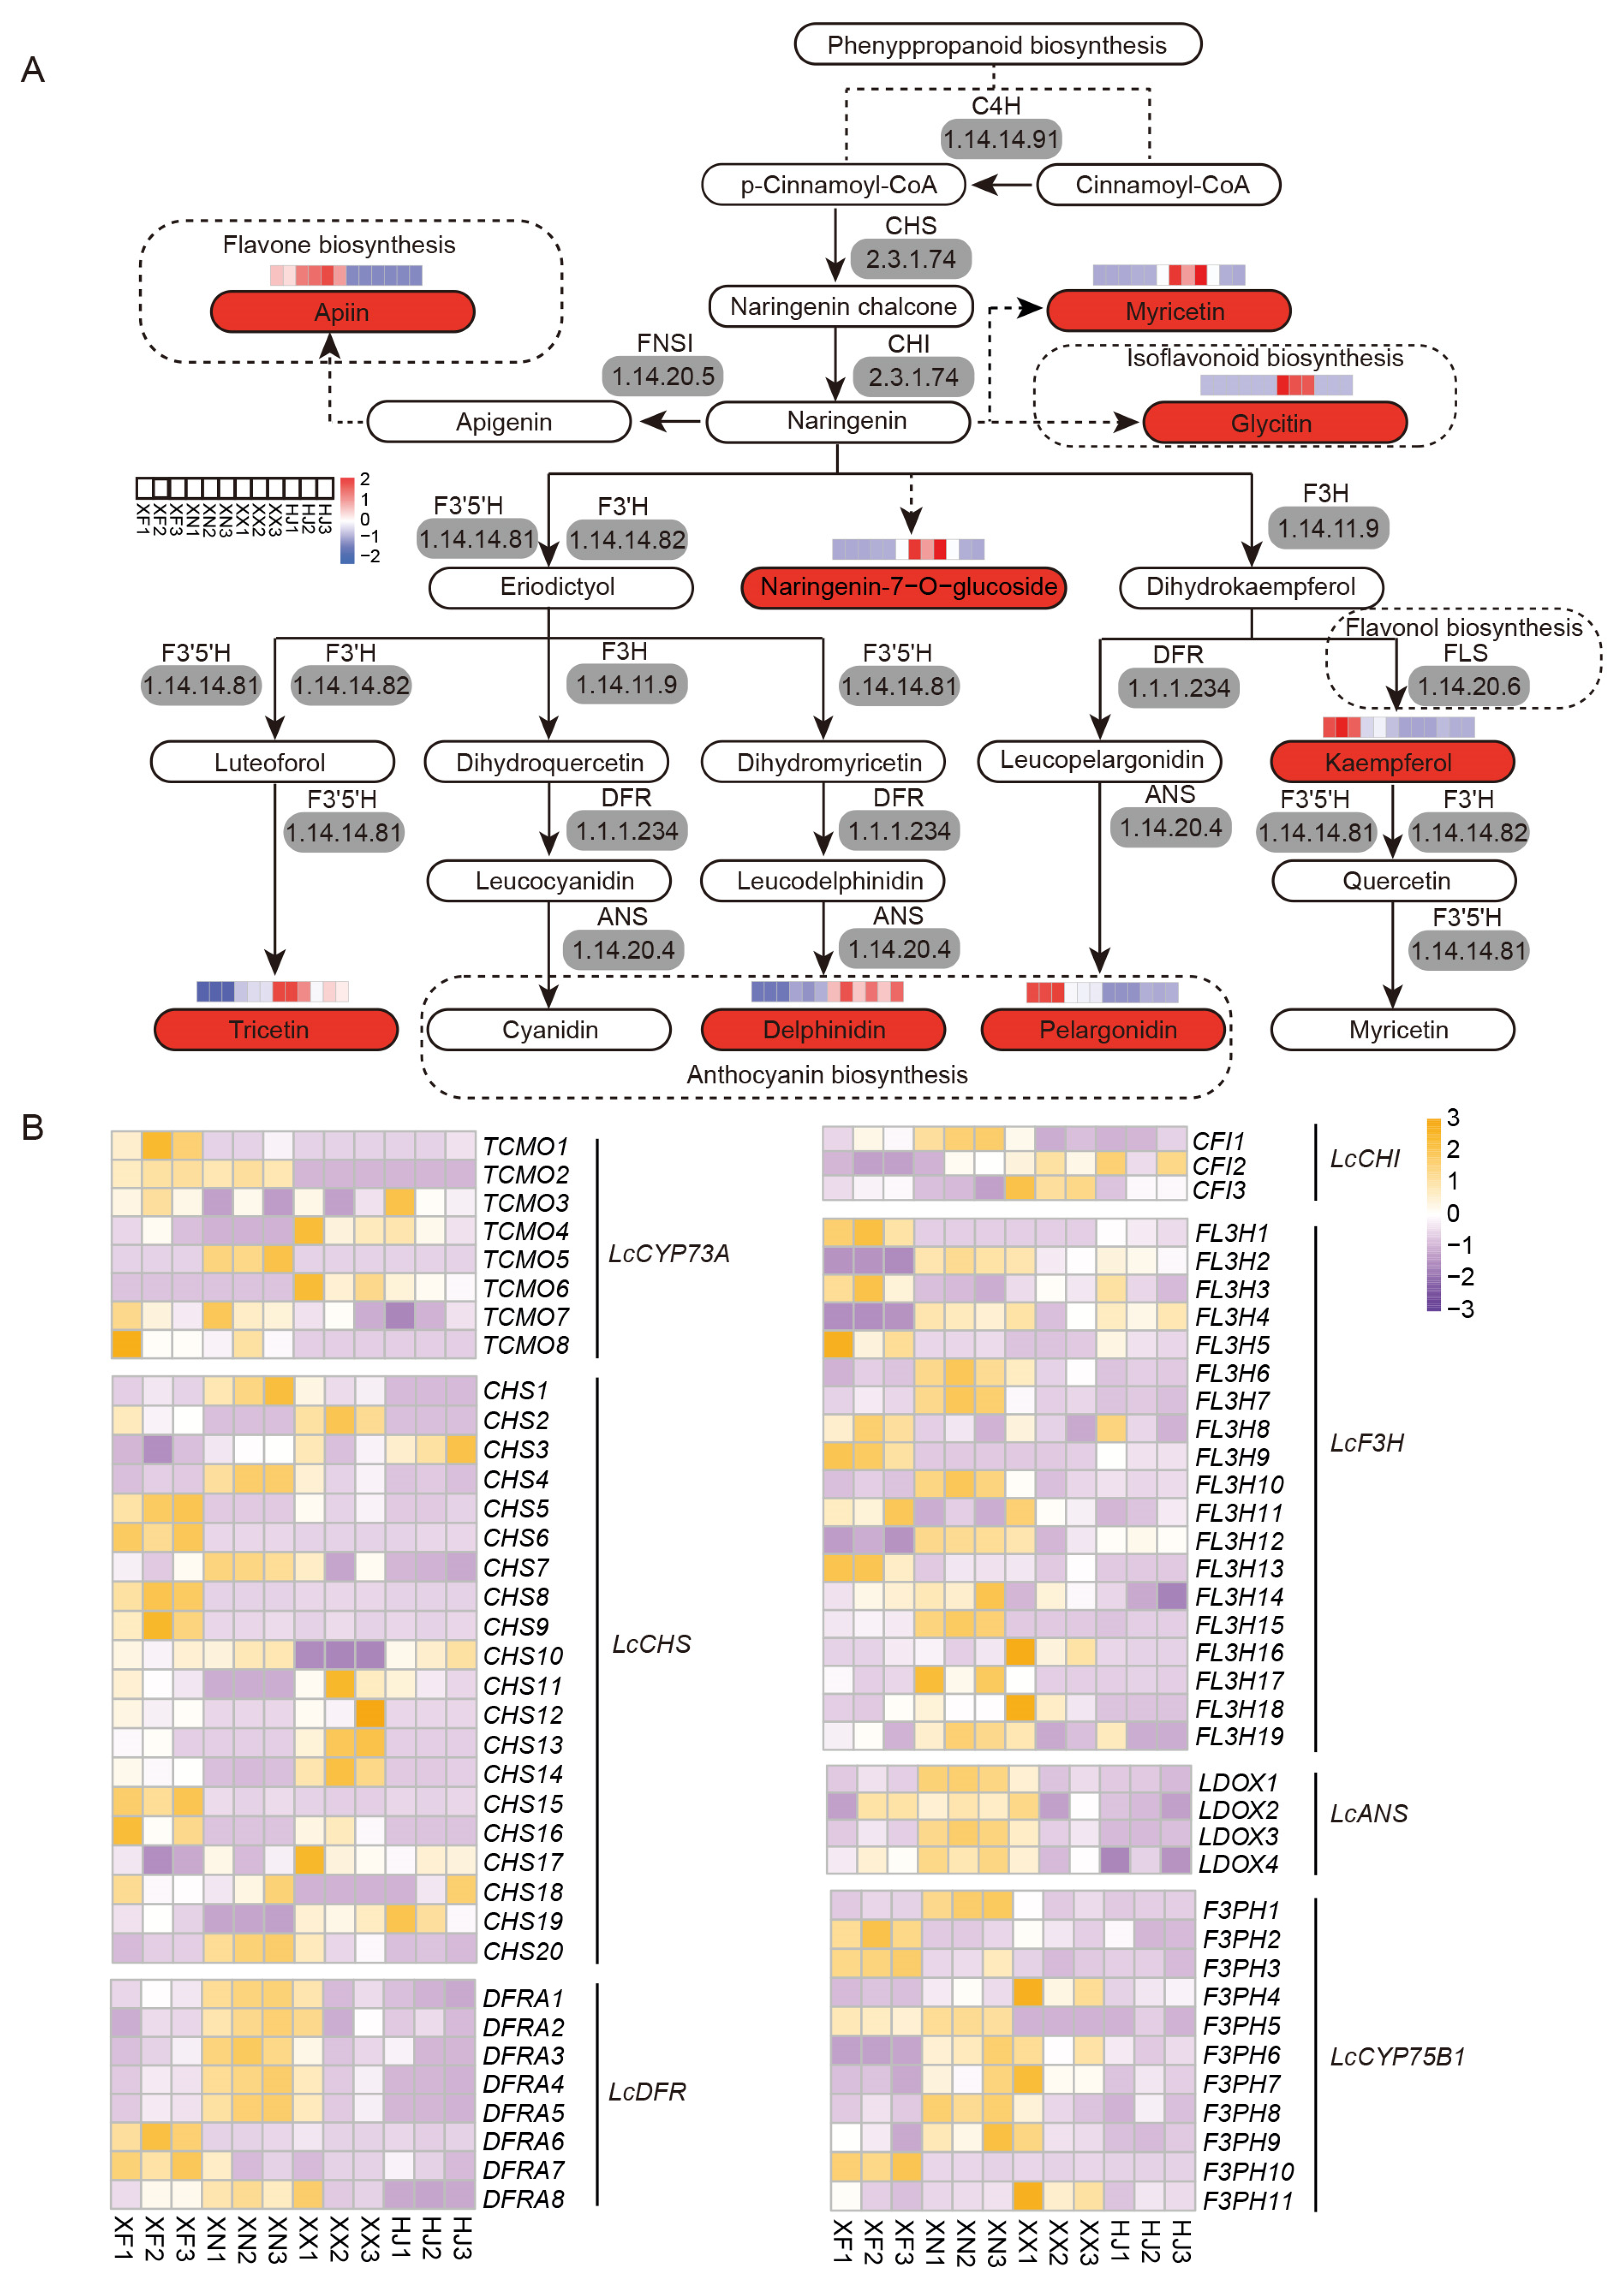
3.6. Expression Analysis Indicates Flavonoid Compounds’ Biosynthesis and Accumulation

Flavonoids are the primary pigments in plants, which can be classified into several subgroups, such as flavones, flavonols, anthocyanins, et al. In total, 433 DETs were detected in 6 compared subgroups (Figure S16). The KEGG enrichment analysis indicated that the “flavonoid biosynthesis” pathway was one of the most representative pathways in XN vs. HJ (Supplementary Table S29), XN vs. XX (Supplementary Table S30), XF vs. HJ (Supplementary Table S31), XF vs. XN (Supplementary Table S32), XF vs. XX (Supplementary Table S33), and XX vs. HJ (Supplementary Table S34). Based on the KEGG enrichment analysis of DCMs and DETs, the flavonoid biosynthetic pathway of L. chinense var. rubrum was constructed according to the KEGG public database (Figure 5A). Eight flavonoid compounds were significantly different among the four samples (Figure 5A). The XX had the highest relative contents of myricetin, Naringenin-7-O-glucoside, Glycitin, Tricetin, and Delphinidin, while the XN and XF had higher relative contents of Apiin, Kaempferol, and Pelargonidin. Furthermore, 73 DETs were related to the biosynthesis of flavonoid compounds, including eight LcCYP73A (encoding trans-cinnamate 4-monooxygenase), twenty LcCHS (encoding chalcone synthase), three LcCHI (encoding chalcone isomerase), nineteen LcF3H (encoding naringenin 3-dioxygenase), eight LcDFR (encoding bifunctional dihydroflavonol 4-reductase or flavanone 4-reductase), and four LcANS (encoding anthocyanidin reductase) (Figure 5B). Additionally, all of the differentially expressed LcDFR as well as LcANS genes were highly expressed in XF or XN. Moreover, there was a strong correlation between the expression of flavonoid-biosynthesis-related gene DETs and the KEGG enrichment DCMs of flavonoids (Figure S17).

3.7. Co-Expression Analysis for the Investigation of Anthocyanin Biosynthesis

Anthocyanins were the primary coloring pigments that provided the orange, red, blue, and purple colors in flowers, leaves, fruits, seeds, and other tissues (Bueno et al., 2012). Anthocyanins were the essential products in the flavonoid pathway biosynthesis. Moreover, the colored unstable anthocyanidins (pelargonidin, cyanidin, and delphinidin) were converted into stable anthocyanins (pelargonidin-3-O-glucoside, cyanidin-3-O-glucoside, and delphinidin-3-glucoside) and their further modifications (such as acylation, glycosylation, and methylation) (Liu et al., 2021b). The KEGG enrichment analysis indicated that eight anthocyanins, including pelargonidin, delphinidin, cyanidin-3-O-glucoside, cyanidin-3,5-O-glucoside, petunidin-3-O-glucoside, peonidin-3-O-sophoroside-5-O-glucoside, malvidin-3-acetyl-5-O-diglucoside, and Delphinidin-3-O-glucoside, were significantly different among the four samples (Supplementary Table S1, Figure 6A). Furthermore, the relative concentrations of pelargonidin, peonidin-O-3-sophoroside-5-O-glucoside, and Malvidin-3-acetyl-5-O-diglucoside were consistent with the petal coloring of all of the samples (Supplementary Table S1, Figure 6A). Twenty DET-related genes of anthocyanin biosynthetic were identified (Figure 6B). The results indicated that the genes UFOG1, UFOG7, UFOG9, UFOG12, and 3AT1_2 were relatively higher expressed in the darker petals of the samples.
To explore the roles of the DETs involved in the accumulation of anthocyanins, a correlation analysis of the relative expression profiles of the DETs and the DCMs of anthocyanins mentioned above was performed (Figure S18). As a result, the expressions of UFOG1, UFOG7, UFOG9, UFOG12, and 3AT1_2 were positively correlated with the contents of cyanindin-3-O-glucoside, delphinidin-3-O-glucoside, petunidin-3-O-glucoside, pelargonidin, malvidin-3-acetyl-5-O-diglucoside, peonidin, and peonidin-3-sophoroside-5-O-glucoside, and negatively correlated with the content of delphinidin. In addition, UFOG2, UFOG10, and GT1_2 positively correlated with the content of delphinidin.

4. Discussion

What flowers do we like? Flower color is one of the most important factors influencing flowers’ beauty [12]. Flavonoids are common pigment components that present a broad spectrum of colors, from pale yellow to blue to purple, especially the case in petals. Flavonoids are a large group of plant biosynthetic compounds that can be classified as anthocyanins, flavones, flavanols, flavanones, isoflavones, or other flavonoid compounds [77]. The anthocyanin in leaves is the primary coloring pigment in L. chinense var. rubrum [6]; the total anthocyanins of PL are much higher than ML and GL, and the lowest is GL [7]. In the present study, we found that the anthocyanin contents of red L. chinense var. rubrum flowers are higher than those of white L. chinense flowers. Moreover, the content of anthocyanins is a vital factor influencing their flower coloring. XN had the highest total anthocyanins (XNNC, 264.96 mg/g of FW) and the redness color of a* value (a*, 4.52), while XX had the lowest total anthocyanins (23.03 mg/g of FW) and lightness (L*, 80.43). It might be the main reason for the transformation from white to pink to purple. These results also showed that L. chinense var. rubrum was a critical resource of anthocyanins compared to Asparagus officinalis (22.04 mg/g of FW) [52], Vaccinium corymbosum (about 1.8 mg/g of FW) [78], Lycoris longituba (1.25 mg/g of FW) [79], and other horticultural plants.
Flavonoids are some of the essential pigments in many ornamental plant petals, and the composition of flavonoids’ composition may vary among different color petals of the same species. The white chrysanthemum flowers only contain flavones and flavonols, and the pink ones mainly contain anthocyanins, flavones, and flavonols [80]. The derivatives of delphinidin and cyanidin were more complicated in the red group of water lily than in others [81]. In total, 15 anthocyanins and 20 flavonols were identified in primula vulgaris cultivars, while peonidin-type anthocyanins, cyanindi-3-O-glucoside, and dephininidin-3,5-di-O-glucoside-3′-caffeic ester were accumulated in pink flowers [36]. We found that 207 flavonoid metabolites were identified in the 4 cultivars (Table S1 and Figure 2A), and they were mainly involved in 39 flavonols, 7 isoflavones, 25 flavonoids, 79 flavones, 20 flavanones, 19 polyphenols, 15 anthocyanins, and 3 proanthocyanins in L. chinense var. rubrum and L. chinense; it is similarly the case with the leaves of L. chinense var. rubrum [7]. About 168 flavonoids were common in the 4 samples, indicating no apparent alternatives of flavonoids among the samples of Loropetalum species. The same result was found in Nicotiana species [82], which might be the same species’ close genetic background. Eight flavonols, one flavone, and three anthocyanins, reported for the first time in Loropetalum species, were identified in the petals of HJ, XF, and XN. These DCMs had a close correlation with the petal colorings of Loropetalum species. Furthermore, the enrichment analysis showed that these DCMs were identified in the metabolic pathways of ‘Biosynthesis of secondary metabolites’ (ko01110), ‘Flavonoid biosynthesis’ (ko00941), ‘Anthocyanin biosynthesis’ (ko00942), ‘Isoflavonoid biosynthesis’ (ko00943), and ‘Flavone and flavonol biosynthesis’ (ko00944).
The structural and functional genomic analyses provide good insights into discovering the metabolic processing pathways in plants. The full-length transcripts, based on the SMRT sequencing stratagem that improves genome and transcriptome assembly, are essential for structural, functional, and comparative genomic studies [83,84,85]. The NGS strategies for transcriptomes were a convenient tool for correcting the SMRT sequencing errors reported in many plants [43,86]. In this study, we obtained 46.16 GB of raw data via PacBio sequencing, with an average length of 29,523 bp and N50 of 51,440 bp. After correcting the SMRT reads with NGS data and CD-HIT software, 171,783 high-quality nonredundant transcripts were produced. This is a much larger number than Carthamus tincorius (79,926 transcripts) [87], Litchi chinense (50,808 transcripts) [88], Camellia oleifera (40,143 transcripts) [89], and Lolium multiflorum (72,722 transcripts) (Chen et al., 2018). These transcripts were then annotated with the NR, KOG, GO, NT, Pfam, Swiss-Port, and KEGG databases for gene function annotation and metabolic pathway analysis. As a result, 144,893 transcripts were functionally annotated, and the most enriched were ‘Metabolism’, including phenylpropanoid biosynthesis, flavonoid biosynthesis, isoflavonoid biosynthesis, and flavone as well as flavonol biosynthesis pathways (Figure 3A,B, Figures S5–S8). Thus, SMRT sequencing, combined with an NGS strategy, established an accurate abundant reference transcriptome of L. chinense var. rubrum for the first time.
Cultivar-specific flavonoids in L. chinense var. rubrum might be associated with the differential expression of essential biosynthetic genes. Flavonoid biosynthesis and anthocyanin biosynthesis genes have been well summarized in some reviews [22,42,44,85]. The transcriptomes are based on an NGS strategy as a convenient tool for quantitative gene expression data in plants. This study used four cultivars with twelve samples for transcript qualification. All of the differentially expressed genes were annotated with high-quality full-length nonredundant reference transcriptomes. The DETs’ enrichment, analyzed with KEGG annotation, demonstrated that they were involved in ‘Phenylpropanoid biosynthesis’ and ‘Flavonoid biosynthesis’. Combined with the DCMs analyzed, eight LcCYP73A (encoding trans-cinnamate 4-monooxygenase), twenty LcCHS (encoding chalcone synthase), three LcCHI (encoding chalcone isomerase), nineteen LcF3H (encoding naringenin 3-dioxygenase), eight LcDFR (encoding bifunctional dihydroflavonol 4-reductase or flavanone 4-reductase), four LcANS (encoding anthocyanidin reductase), and twenty genes of anthocyanin biosynthetic were identified in our study (Figure 5A,B and Figure 6A,B). Moreover, the correlation of DCMs and flavonoid-pathway (including the anthocyanin pathway)-related genes were also discovered. The genes UFOG1, UFOG7, UFOG9, UFOG12, and 3AT1_2 were expressed relatively higher in the darker petals of samples. Furthermore, UFOG2, UFOG10, and GT1_2 were positively correlated with delphinidin content.

5. Conclusions

For the first time, this study reports on the intergrade application of phenotypes, metabolomics, and transcriptomics to elucidate the flower coloring mechanisms of L. chinense var. rubrum. The different pigment combinations and their accumulations were the crucial factors caused by the different petal coloration in L. chinense var. rubrum. Most flavonoids had significantly different contents among the four cultivars for close genetic backgrounds. Additionally, the relative contents of Kaempferide, Apiin, Glycitin, Tricetin, Naringenin 7-O-glucoside, pelargonidin, delphinidin, cyanidin-3-O-glucoside, cyanidin-3,5-O-glucoside, petunidin-3-O-glucoside, peonidin-3-O-sophoroside-5-O-glucoside, malvidin-3-acetyl-5-O-diglucoside, and Delphinidin-3-O-glucoside were the main differential contents of components in L. chinense var. rubrum. An accurate abundant referent transcriptome was established by combining SMRT with an NGS strategy. The flavonoid biosynthesis genes, such as LcCYP73A, twenty LcCHS, three LcCHI, nineteen LcF3H, eight LcDFR, four LcANS, four UFOGs, and one 3AT1_2, correlated with the specific flavonoids’ high determinations of the flower color of L. chinense var. rubrum. Together, these findings offer novel insights into the molecular basis for flavonoid biosynthesis in L. chinense var. rubrum, and could serve as the basis for future research on the selective breeding of colorful ornamental plants.

Supplementary Materials

The following supporting information can be downloaded at: https://www.mdpi.com/article/10.3390/agronomy13051296/s1, Figure S1: The metabolism view map of the significant metabolism pathways of the four different cultivars of L. chinense and L. chinense var. rubrum. (A) Significantly changed pathways on the enrichment of HJ VS XN. (B) Significantly changed pathways on the enrichment of HJ vs. XF. (C) Significantly changed pathways on the enrichment of HJ vs. XX. (D) Significantly changed pathways on the enrichment of XN vs. XF. (E) Significantly changed pathways on the enrichment of XN vs. XX. (F) Significantly changed pathways on the enrichment of XN vs. XX. (G) Significantly changed pathways on the enrichment of XF vs. XX.; Figure S2: The top 20 differential metabolites among the different cultivars of L. chinense var. rubrum. (A) The top 20 changed metabolites of HJ vs. XN. (B) The top 20 changed metabolites of HJ vs. XF. (C) The top 20 changed metabolites of HJ vs. XX. (D) The top 20 changed metabolites of XN vs. XF. (E) The top 20 changed metabolites of XN VS XX. (F) The top 20 changed metabolites of XF vs. XX; Figure S3: The annotation static results of full-length nonredundant final transcripts to NR databases in different species; Figure S4: The classification map of full-length nonredundant final transcripts to the GO database; Figure S5: The classification map of full-length nonredundant final transcripts to the GO database; Figure S6: The classification chart of the annotation of full-length nonredundant final transcripts to the KEGG metabolic pathway; Figure S7: The annotation and prediction of the CDS, transcription factors, and LncRNAs of L. chinense var. rubrum. (A) The number, percentage, and length of CDS predicted by the final transcripts of L. chinense var. rubrum. (B) The top 30 transcription factor families predicted by the final transcripts of L. chinense var. rubrum. (C) Scatter diagram of LncRNAs and mRNA length distributions of L. chinense var. rubrum. (D) Annotation of full-length noncoding final transcripts predicted by cnci, pfam, plek and cpc software; Figure S8: The number of up- and downregulated different expression LncRNAs in the different compared combinations; Figure S9: GO enrichment analysis of DETs between the XN and HJ groups; Figure S10: GO enrichment analysis of DETs between the XN and XX groups; Figure S11: GO enrichment analysis of DETs between the XF and HJ groups; Figure S12: GO enrichment analysis of DETs between the XF and XN groups; Figure S13: GO enrichment analysis of DETs between the XF and XX groups; Figure S14: GO enrichment analysis of DETs between the XX and HJ groups; Figure S15: The top 20 enriched KEGG pathways of the differentially expressed genes (DEGs) among the different cultivars of L. chinense var. rubrum. (A) The enrichment pathway of XN vs. HJ. (B) The enrichment pathway of XN vs. XX. (C) The enrichment pathway of XF vs. HJ. (D) The enrichment pathway of XF vs. XN. (E) The enrichment pathway of XF vs. XX. (F) The enrichment pathway of XX vs. HJ; Figure S16: The Venn diagram of DETs between different comparisons; Figure S17: Correlation analyses of differentially expressed transcripts (DETs) involved in flavonoids; Figure S18: Correlation analyses of differentially expressed transcripts (DETs) involved in anthocyanins; Table S1: Type and content of flavonoids in four Loropetalum cultivars; Table S2: The differentially accumulated metabolites in the group of HJ vs. XN; Table S3: The differentially accumulated metabolites in the group of HJ vs. XF; Table S4: The differentially accumulated metabolites in the group of HJ vs. XF; Table S5: The differentially accumulated metabolites in the group of XN vs. XF; Table S6: The differentially accumulated metabolites in the group of XN vs. XX; Table S7: The differentially accumulated metabolites in the group of XF vs. XX; Table S8: The differentially accumulated flavonoid metabolites in all groups of L. chinense and L. chinense var. rubrum; Table S9: The differential concentration of flavonoid metabolites analysis in the group of HJ vs. XN; Table S10: The differential concentration of flavonoid metabolites analysis in the group of HJ vs. XF; Table S11: The differential concentration of flavonoid metabolites analysis in the group of HJ vs. XX; Table S12: The differential concentration of flavonoid metabolites analysis in the group of XN vs. XF; Table S13: The differential concentration of flavonoid metabolites analysis in the group of XN vs. XX; Table S14: The differential concentration of flavonoid metabolites analysis in the group of XF vs. XX; Table S15: The compared transcriptome of HJ vs. XN on KEGG metabolic pathway annotation; Table S16: The compared transcriptome of HJ vs. XN on KEGG metabolic pathway annotation; Table S17: The compared transcriptome of HJ vs. XX on KEGG metabolic pathway annotation; Table S18: The compared transcriptome of XN vs. XF on KEGG metabolic pathway annotation; Table S19: The compared transcriptome of XN vs. XX on KEGG metabolic pathway annotation; Table S20: The compared transcriptome of XF vs. XX on KEGG metabolic pathway annotation; Table S21: Quality statistics of filtered reads; Table S22: Major indicators of the full-length transcriptome of Loropetalum chinense var. rubrum; Table S23: The GO enrichment analysis of DETs between the XN and HJ groups; Table S24: The GO enrichment analysis of DETs between the XN and XX groups; Table S25: The GO enrichment analysis of DETs between the XF and HJ groups; Table S26: The GO enrichment analysis of DETs between the XF and XN groups; Table S27: The GO enrichment analysis of DETs between the XF and XX groups; Table S28: The GO enrichment analysis of DETs between the XX and HJ groups; Table S29: The KEGG enrichment analysis of DETs between the XN and HJ groups; Table S30: The KEGG enrichment analysis of DETs between the XN and XX groups; Table S31: The KEGG enrichment analysis of DETs between the XF and HJ groups; Table S32: The KEGG enrichment analysis of DETs between the XF and XN groups; Table S33: The KEGG enrichment analysis of DETs between the XF and XX groups; Table S34: The KEGG enrichment analysis of DETs between the XX and HJ groups.

Author Contributions

Conceptualization, M.C. and X.Y.; methodology, X.Z.; software, D.Z. (Damao Zhang); validation, Y.L. (Yang Liu), L.L. and L.Z.; formal analysis, L.Z.; investigation, X.Y.; resources, D.Z. (Donglin Zhang); data curation, M.S.; writing—original draft preparation, Y.L. (Yanlin Li); writing—review and editing, Y.L. (Yanlin Li); visualization, M.C.; supervision, Y.L. (Yanlin Li); project administration, X.X.; funding acquisition, X.Y. All authors have read and agreed to the published version of the manuscript.

Funding

This research was funded by the Forestry Science and Technology Innovation Foundation of Hunan Province for Distinguished Young Scholarship, grant number XLKJ202205; the Open Project of Horticulture Discipline of Hunan Agricultural University, grant number 2021YYXK001; the fund of the Changsha Municipal Science and Technology Bureau, grant number KQ2202227; the Key Project of the Hunan Provincial Education Department, grant number 22A0155; the Forestry Bureau for Industrialization management of Hunan Province, grant number 2130221; Hunan Provincial Education Department Teaching Reform Project, grant number 2021JGYB101; and Hunan Agricultural University Teaching Reform Research Project, grant number XJJG-2020-071.

Data Availability Statement

Data are contained within the article and the Supplementary Materials.

Acknowledgments

Lili Xiang, Yujie Yang, and Lu Xu were acknowledged to provide technical supports. Yong Song was acknowledged for funding support.

Conflicts of Interest

The authors declare no conflict of interest.

References

  1. Zhang, X.; Zhang, D.; Zhang, L.; Wang, X.; Xiong, X.; Gan, D.; Yu, X.; Li, Y. The Whole Genome Analysis of Loropetalum chinense var. Rubrum. Mol. Plant Breed. 2020, 18, 7023–7029. [Google Scholar]
  2. Shi, F. Comparison and Application of Lorpetalum chinense Var. Rubrum and Photinia Fraseryin Landscape. J. Hengyang Norm. Univ. 2016, 37, 106–111. [Google Scholar]
  3. Shao, Z.; Hou, W.; Long, X.; Yang, G.; Chen, C.; Zeng, X.; Hou, B.; Yu, G.; Wu, W. The formation and development of the geography symbol product Loropetalum chinense var. rubrum in Liuyang City. Hunan For. Sci. Technol. 2007, 2, 71–73. [Google Scholar]
  4. Zhang, D.; Cai, W.; Zhang, X.; Li, W.; Zhou, Y.; Chen, Y.; Mi, Q.; Jin, L.; Xu, L.; Yu, X.; et al. Different pruning level effects on flowering period and chlorophyll fluorescence parameters of Loropetalum chinense var. rubrum. PeerJ 2022, 10, 1–17. [Google Scholar] [CrossRef]
  5. Zhang, L.; Yu, X.; Zhang, X.; Zhang, D.; Li, W.; Xiang, L.; Yang, Y.; Li, Y.; Xu, L. Phenotypic Diversity Analysis of the Progeny Variation of a ‘Mosaic Leaf’ Loropetalum chinense var. rubrum Based on Flower Organ Characteristics. Diversity 2022, 14, 913. [Google Scholar] [CrossRef]
  6. Chen, Q.; Cai, W.; Zhang, X.; Zhang, D.; Li, W.; Xu, L.; Yu, X.; Li, Y. The Comparative Studies on Phytochemicals of Leaf Coloration of Loropetalum chinense var. rubrum. Acta Hortic. Sin. 2021, 48, 1969–1982. [Google Scholar] [CrossRef]
  7. Zhang, X.; Zhang, L.; Zhang, D.; Su, D.; Li, W.; Wang, X.; Chen, Q.; Cai, W.; Xu, L.; Cao, F.; et al. Comprehensive analysis of metabolome and transcriptome reveals the mechanism of color formation in different leave of Loropetalum chinense var. rubrum. BMC Plant Biol. 2023, 23, 133. [Google Scholar] [CrossRef]
  8. Iwashina, T. Contribution to Flower Colors of Flavonoids Including Anthocyanins: A Review. Nat. Prod. Commun. 2015, 10, 529–544. [Google Scholar] [CrossRef]
  9. Tanaka, Y.; Brugliera, F. Flower Colour. In Annual Plant Reviews; Wiley: Hoboken, NJ, USA, 2018; Volume 20, pp. 201–239. [Google Scholar]
  10. Goto, T. Structure, stability and color variation of natural anthocyanins. In Fortschritte der Chemie Organischer Naturstoffe/Progress in the Chemistry of Organic Natural Products; Springer: Berlin/Heidelberg, Germany, 1987; Volume 52, pp. 113–158. [Google Scholar]
  11. Koes, R.E.; Van Blokland, R.; Quattrocchio, F.; Van Tunen, A.J.; Mol, J.N. Chalcone synthase promoters in petunia are active in pigmented and unpigmented cell types. Plant Cell 1990, 2, 379–392. [Google Scholar] [CrossRef]
  12. Hůla, M.; Flegr, J. What flowers do we like? The influence of shape and color on the rating of flower beauty. PeerJ 2016, 4, e2106. [Google Scholar] [CrossRef]
  13. Yin, X.; Wang, T.; Zhang, M.; Zhang, Y.; Irfan, M.; Chen, L.; Zhang, L. Role of core structural genes for flavonoid biosynthesis and transcriptional factors in flower color of plants. Biotechnol. Biotechnol. Equip. 2021, 35, 1214–1229. [Google Scholar] [CrossRef]
  14. Tanaka, Y.; Brugliera, F.; Chandler, S. Recent progress of flower colour modification by biotechnology. Int. J. Mol. Sci. 2009, 10, 5350–5369. [Google Scholar] [CrossRef]
  15. Tanaka, Y.; Brugliera, F. Flower colour and cytochromes P450. Philos. Trans. R. Soc. Lond. B Biol. Sci. 2013, 368, 20120432. [Google Scholar] [CrossRef]
  16. Tanaka, Y.; Sasaki, N.; Ohmiya, A. Biosynthesis of plant pigments: Anthocyanins, betalains and carotenoids. Plant J. 2008, 54, 733–749. [Google Scholar] [CrossRef]
  17. Liang, C.-Y.; Rengasamy, K.P.; Huang, L.-M.; Hsu, C.-C.; Jeng, M.-F.; Chen, W.-H.; Chen, H.-H. Assessment of violet-blue color formation in Phalaenopsis orchids. BMC Plant Biol. 2020, 20, 212. [Google Scholar] [CrossRef]
  18. Diretto, G.; Jin, X.; Capell, T.; Zhu, C.; Gomez-Gomez, L. Differential accumulation of pelargonidin glycosides in petals at three different developmental stages of the orange-flowered gentian (Gentiana lutea L. var. aurantiaca). PLoS ONE 2019, 14, e0212062. [Google Scholar] [CrossRef]
  19. Liu, W.; Feng, Y.; Yu, S.; Fan, Z.; Li, X.; Li, J.; Yin, H. The flavonoid biosynthesis network in plants. Int. J. Mol. Sci. 2021, 22, 12824. [Google Scholar] [CrossRef]
  20. Haslam, E. Practical Polyphenolics: From Structure to Molecular Recognition and Physiological Action; Cambridge University Press: Cambridge, UK, 1998. [Google Scholar]
  21. Winkel-Shirley, B. Molecular genetics and control of anthocyanin expression. Adv. Bot. Res. 2002, 37, 75–94. [Google Scholar]
  22. Fraser, C.M.; Chapple, C. The phenylpropanoid pathway in Arabidopsis. Arab. Book 2011, 9, e0152. [Google Scholar] [CrossRef]
  23. Schröder, G. Stilbene and chalcone synthases: Related enzymes with key functions in plant-specific pathways. Z. Für Nat. C 1990, 45, 1–8. [Google Scholar] [CrossRef]
  24. Shirley, B.W.; Kubasek, W.L.; Storz, G.; Bruggemann, E.; Koornneef, M.; Ausubel, F.M.; Goodman, H.M. Analysis of Arabidopsis mutants deficient in flavonoid biosynthesis. Plant J. 1995, 8, 659–671. [Google Scholar] [CrossRef] [PubMed]
  25. van Tunen, A.J.; Mur, L.A.; Recourt, K.; Gerats, A.; Mol, J. Regulation and manipulation of flavonoid gene expression in anthers of petunia: The molecular basis of the Po mutation. Plant Cell 1991, 3, 39–48. [Google Scholar] [PubMed]
  26. Wisman, E.; Hartmann, U.; Sagasser, M.; Baumann, E.; Palme, K.; Hahlbrock, K.; Saedler, H.; Weisshaar, B. Knock-out mutants from an En-1 mutagenized Arabidopsis thaliana population generate phenylpropanoid biosynthesis phenotypes. Proc. Natl. Acad. Sci. 1998, 95, 12432–12437. [Google Scholar] [CrossRef] [PubMed]
  27. Holton, T.A.; Brugliera, F.; Lester, D.R.; Tanaka, Y.; Hyland, C.D.; Menting, J.G.; Lu, C.-Y.; Farcy, E.; Stevenson, T.W.; Cornish, E.C. Cloning and expression of cytochrome P450 genes controlling flower colour. Nature 1993, 366, 276–279. [Google Scholar] [CrossRef] [PubMed]
  28. Winkel-Shirley, B. Flavonoid biosynthesis. A colorful model for genetics, biochemistry, cell biology, and biotechnology. Plant Physiol. 2001, 126, 485–493. [Google Scholar] [CrossRef]
  29. Schoenbohm, C.; Martens, S.; Eder, C.; Forkmann, G.; Weisshaar, B. Identification of the Arabidopsis thaliana flavonoid 3′-hydroxylase gene and functional expression of the encoded P450 enzyme. Bio. Chem. 2000, 381, 749–753. [Google Scholar] [CrossRef]
  30. Shirley, B.W.; Hanley, S.; Goodman, H.M. Effects of ionizing radiation on a plant genome: Analysis of two Arabidopsis transparent testa mutations. Plant Cell 1992, 4, 333–347. [Google Scholar]
  31. Hichri, I.; Barrieu, F.; Bogs, J.; Kappel, C.; Delrot, S.; Lauvergeat, V. Recent advances in the transcriptional regulation of the flavonoid biosynthetic pathway. J. Exp. Bot. 2011, 62, 2465–2483. [Google Scholar] [CrossRef]
  32. Zhang, Y.; Chu, G.; Hu, Z.; Gao, Q.; Cui, B.; Tian, S.; Wang, B.; Chen, G. Genetically engineered anthocyanin pathway for high health-promoting pigment production in eggplant. Mol. Breed. 2016, 36, 1–14. [Google Scholar] [CrossRef]
  33. Tohge, T.; Nishiyama, Y.; Hirai, M.Y.; Yano, M.; Nakajima, J.; Awazuhara, M.; Inoue, E.; Takahashi, H.; Goodenowe, D.B.; Kitayama, M. Functional genomics by integrated analysis of metabolome and transcriptome of Arabidopsis plants over-expressing an MYB transcription factor. Plant J. 2005, 42, 218–235. [Google Scholar] [CrossRef]
  34. Veitch, N.C.; Grayer, R.J. Flavonoids and their glycosides, including anthocyanins. Nat. Prod. Rep. 2008, 25, 555–611. [Google Scholar] [CrossRef]
  35. Wei, X.; Yu, X.; Chen, J.; Fu, H.; Hu, B.; Chen, Y.; Da, L. Cloning and Sequence Analyzing of Chalcone Synthase Gene in Loropetalum chinense var. rubrum. Chin. Agric. Sci. Bull. 2013, 29, 24–28. [Google Scholar]
  36. Li, C.H.; Duo, D.Y.; Liao, X.S.; Zhang, Y.B. Cloning and Bioinformatic Analysis of Two Chalcone Synthases from Loropetalum chinense var. Rubrum. J. Hunan Univ. Technol. 2020, 34, 92–98. [Google Scholar]
  37. Rong, D.; Zhang, X.; Pan, T.; Wang, J.; Yang, G.; Zhang, B. Cloning, Expression and Transformation of LcFLS1 Gene from Loropetalum chinense var. rubrum. Acta Bot. Boreali-Occident. Sin. 2019, 28, 1877–1887. [Google Scholar]
  38. Zhang, B.Y.; Li, C.H.; Liu, X.; Liao, X.S.; Rong, D.Y. Cloning and subcellular localization analysis of LcDFR1 and LcDFR2 in Loropetalum chinense var. rubrum. J. South. Agric. 2020, 51, 2865–2874. [Google Scholar]
  39. Dong, N.Q.; Lin, H.X. Contribution of phenylpropanoid metabolism to plant development and plant–environment interactions. J. Integr. Plant Biol. 2021, 63, 180–209. [Google Scholar] [CrossRef]
  40. Ma, D.; Constabel, C.P. MYB repressors as regulators of phenylpropanoid metabolism in plants. Trends Plant Sci. 2019, 24, 275–289. [Google Scholar] [CrossRef]
  41. Ohtani, M.; Demura, T. The quest for transcriptional hubs of lignin biosynthesis: Beyond the NAC-MYB-gene regulatory network model. Curr. Opin. Biotechnol. 2019, 56, 82–87. [Google Scholar] [CrossRef]
  42. Nabavi, S.M.; Šamec, D.; Tomczyk, M.; Milella, L.; Russo, D.; Habtemariam, S.; Suntar, I.; Rastrelli, L.; Daglia, M.; Xiao, J. Flavonoid biosynthetic pathways in plants: Versatile targets for metabolic engineering. Biotechnol. Adv. 2020, 38, 107316. [Google Scholar] [CrossRef]
  43. Xu, W.; Dubos, C.; Lepiniec, L. Transcriptional control of flavonoid biosynthesis by MYB–bHLH–WDR complexes. Trends Plant Sci. 2015, 20, 176–185. [Google Scholar] [CrossRef]
  44. Sunil, L.; Shetty, N.P. Biosynthesis and regulation of anthocyanin pathway genes. Appl. Microbiol. Biotechnol. 2022, 106, 1783–1798. [Google Scholar] [CrossRef] [PubMed]
  45. Kiferle, C.; Fantini, E.; Bassolino, L.; Povero, G.; Spelt, C.; Buti, S.; Giuliano, G.; Quattrocchio, F.; Koes, R.; Perata, P. Tomato R2R3-MYB proteins SlANT1 and SlAN2: Same protein activity, different roles. PLoS ONE 2015, 10, e0136365. [Google Scholar] [CrossRef] [PubMed]
  46. Cao, Y.; Jia, H.; Xing, M.; Jin, R.; Grierson, D.; Gao, Z.; Sun, C.; Chen, K.; Xu, C.; Li, X. Genome-wide analysis of MYB gene family in Chinese bayberry (Morella rubra) and identification of members regulating flavonoid biosynthesis. Front. Plant Sci. 2021, 12, 1244. [Google Scholar] [CrossRef] [PubMed]
  47. Zhang, B.; Xu, X.; Huang, R.; Yang, S.; Li, M.; Guo, Y. CRISPR/Cas9-mediated targeted mutation reveals a role for AN4 rather than DPL in regulating venation formation in the corolla tube of Petunia hybrida. Hortic. Res. 2021, 8, 116. [Google Scholar] [CrossRef]
  48. Lai, Y.-S.; Shimoyamada, Y.; Nakayama, M.; Yamagishi, M. Pigment accumulation and transcription of LhMYB12 and anthocyanin biosynthesis genes during flower development in the Asiatic hybrid lily (Lilium spp.). Plant Sci. 2012, 193, 136–147. [Google Scholar] [CrossRef]
  49. Nesi, N.; Debeaujon, I.; Jond, C.; Pelletier, G.; Caboche, M.; Lepiniec, L. The TT8 gene encodes a basic helix-loop-helix domain protein required for expression of DFR and BAN genes in Arabidopsis siliques. Plant Cell 2000, 12, 1863–1878. [Google Scholar] [CrossRef]
  50. Qi, F.; Liu, Y.; Luo, Y.; Cui, Y.; Lu, C.; Li, H.; Huang, H.; Dai, S. Functional analysis of the ScAG and ScAGL11 MADS-box transcription factors for anthocyanin biosynthesis and bicolour pattern formation in Senecio cruentus ray florets. Hortic. Res. 2022, 9, uhac071. [Google Scholar] [CrossRef]
  51. Zhang, Y.-L.; Fang, Z.-Z.; Ye, X.-F.; Pan, S.-L. Identification of candidate genes involved in anthocyanin accumulation in the peel of jaboticaba (Myrciaria cauliflora) fruits by transcriptomic analysis. Gene 2018, 676, 202–213. [Google Scholar] [CrossRef]
  52. Dong, T.; Han, R.; Yu, J.; Zhu, M.; Li, Z. Anthocyanins Accumulation and Molecular Analysis of Correlated Genes by Metabolome and Transcriptome in Green and Purple Asparaguses (Asparagus officinalis L.). Food Chem. 2018, 271, 18–28. [Google Scholar] [CrossRef]
  53. Wrolstad, R.E.; Culbertson, J.D.; Cornwell, C.J.; Mattick, L.R. Detection of adulteration in blackberry juice concentrates and wines. J.-Assoc. Off. Anal. Chem. 1982, 65, 1417–1423. [Google Scholar] [CrossRef]
  54. Leena, S.; Eric, R. LoRDEC: Accurate and efficient long read error correction. Bioinformatics 2014, 30, 3506–3514. [Google Scholar] [CrossRef]
  55. Fu, L.; Niu, B.; Zhu, Z.; Wu, S.; Li, W. CD-HIT: Accelerated for clustering the next-generation sequencing data. Bioinform. Oxf. 2012, 28, 3150–3152. [Google Scholar] [CrossRef]
  56. Deng, Y.; Li, J.; Wu, S.; Zhu, Y.; Chen, Y.; He, F. Integrated nr database in protein annotation system and its localization. Comput. Eng. 2006, 32, 71–73. [Google Scholar]
  57. Li, W.; Jaroszewski, L.; Godzik, A. Tolerating some redundancy significantly speeds up clustering of large protein databases. Bioinformatics 2002, 18, 77–82. [Google Scholar] [CrossRef]
  58. Finn, R.D.; Alex, B.; Jody, C.; Penelope, C.; Eberhardt, R.Y.; Eddy, S.R.; Andreas, H.; Kirstie, H.; Liisa, H.; Jaina, M. Pfam: The protein families database. Nucleic Acids Res. 2014, 42, D222–D230. [Google Scholar] [CrossRef]
  59. Tatusov, R.L.; Fedorova, N.D.; Jackson, J.D.; Jacobs, A.R.; Kiryutin, B.; Koonin, E.V.; Krylov, D.M.; Mazumder, R.; Mekhedov, S.L.; Nikolskaya, A.N.; et al. The COG database: An updated version includes eukaryotes. BMC Bioinform. 2003, 4, 41. [Google Scholar] [CrossRef]
  60. Bairoch, A.; Apweiler, R. The SWISS-PROT protein sequence database and its supplement TrEMBL in 2000. Nucleic Acids Res. 2000, 28, 45–48. [Google Scholar] [CrossRef]
  61. Minoru, K.; Susumu, G.; Shuichi, K.; Yasushi, O.; Masahiro, H. The KEGG resource for deciphering the genome. Nucleic Acids Res. 2004, 32, D277. [Google Scholar]
  62. Ashburner, M.; Ball, C.A.; Blake, J.A.; Botstein, D.; Butler, H.; Cherry, J.M.; Davis, A.P.; Dolinski, K.; Dwight, S.S.; Eppig, J.T.; et al. Gene Ontology: Tool for the unification of biology. Nat. Genet. 2000, 25, 25–29. [Google Scholar] [CrossRef]
  63. Altschul, S.F.; Madden, T.L.; Schffer, A.A.; Zhang, J.; Zhang, Z.; Webb, M.; Lipman, D.J. Gapped BLAST and PSI-BLAST: A new generation of protein database search programs. Nucleic Acids Res. 1997, 25, 3389. [Google Scholar] [CrossRef]
  64. Buchfink, B.; Xie, C.; Huson, D. Fast and sensitive protein alignment using DIAMOND. Nat. Methods 2015, 12, 59–60. [Google Scholar] [CrossRef] [PubMed]
  65. Mistry, J.; Finn, R.D.; Eddy, S.R.; Bateman, A.; Punta, M. Challenges in homology search: HMMER3 and convergent evolution of coiled-coil regions. Nucleic Acids Res. 2013, 41, e121. [Google Scholar] [CrossRef] [PubMed]
  66. Shimizu, K.; Adachi, J.; Muraoka, Y. ANGLE: A sequencing errors resistant program for predicting protein coding regions in unfinished cDNA. J. Bioinform. Comput. Biol. 2006, 4, 649–664. [Google Scholar] [CrossRef] [PubMed]
  67. Zheng, J.; Sun, H.H.; Rosli, H.G.; Pombo, M.A.; Zhang, P.F. iTAK: A Program for Genome-wide Prediction and Classification of Plant Transcription Factors, Transcriptional Regulators, and Protein Kinases. Mol. Plant 2016, 9, 1667–1670. [Google Scholar] [CrossRef]
  68. Jin, J.; Tian, F.; Yang, D.-C.; Meng, Y.-Q.; Kong, L.; Luo, J.; Gao, G. PlantTFDB 4.0: Toward a central hub for transcription factors and regulatory interactions in plants. Nucleic Acids Res. 2017, 45, D1040–D1045. [Google Scholar] [CrossRef]
  69. Kong, L.; Zhang, Y.; Ye, Z.Q.; Liu, X.Q.; Gao, G. CPC: Assess the protein-coding potential of transcripts using sequence features and support vector machine. Nucleic Acids Res. 2007, 35, W345–W349. [Google Scholar] [CrossRef]
  70. Finn, R.; Coggill, P.; Eberhardt, R.; Eddy, S.; Mistry, J.; Mitchell, A.; Potter, S.; Punta, M.; Qureshi, M.; Sangrador-Vegas, A. The Pfam protein families database: Towards a more sustainable future. Nucleic Acids Res. 2016, 44, D279–D285. [Google Scholar] [CrossRef]
  71. Freire-Pritchett, P.; Ray-Jones, H.; Della Rosa, M.; Eijsbouts, C.Q.; Orchard, W.R.; Wingett, S.W.; Wallace, C.; Cairns, J.; Spivakov, M.; Malysheva, V. Detecting chromosomal interactions in Capture Hi-C data with CHiCAGO and companion tools. Nat. Protoc. 2021, 16, 4144–4176. [Google Scholar] [CrossRef]
  72. Langmead, B.; Salzberg, S.L. Fast gapped-read alignment with Bowtie 2. Nat. Methods 2012, 9, 357–359. [Google Scholar] [CrossRef]
  73. Trapnell, C.; Williams, B.A.; Pertea, G.; Mortazavi, A.; Kwan, G.; van Baren, M.J.; Salzberg, S.L.; Wold, B.J.; Pachter, L. Transcript assembly and quantification by RNA-Seq reveals unannotated transcripts and isoform switching during cell differentiation. Nat. Biotechnol. 2010, 28, 511–515. [Google Scholar] [CrossRef]
  74. Li, B.; Dewey, C.N. RSEM: Accurate transcript quantification from RNA-Seq data with or without a reference genome. BMC Bioinform. 2011, 12, 323. [Google Scholar] [CrossRef]
  75. Robinson, M.D.; Mccarthy, D.J.; Smyth, G.K. edgeR: A Bioconductor package for differential expression analysis of digital gene expression data. Bioinformatics 2010, 26, 139–140. [Google Scholar] [CrossRef]
  76. Young, M.D.; Wakefield, M.J.; Smyth, G.K.; Oshlack, A. Gene ontology analysis for RNA-seq: Accounting for selection bias. Genome Biol. 2010, 11, R14. [Google Scholar] [CrossRef]
  77. Qiu, X.H.; Zhang, Y.J.; Yin, G.F.; Shi, C.Y.; Yu, X.Y.; Zhao, N.J.; Liu, W.Q. Photosynthetic Parameters Inversion Algorithm Study Based on Chlorophyll Fluorescence Induction Kinetics Curve. Guang Pu Xue Yu Guang Pu Fen Xi = Guang Pu 2015, 35, 2194–2197. [Google Scholar]
  78. Spinardi, A.; Cola, G.; Gardana, C.S.; Mignani, I. Variation of Anthocyanin Content and Profile Throughout Fruit Development and Ripening of Highbush Blueberry Cultivars Grown at Two Different Altitudes. Front. Plant Sci. 2019, 10, 1045. [Google Scholar] [CrossRef]
  79. Yue, Y.; Liu, J.; Shi, T.; Chen, M.; Wang, L. Integrating Transcriptomic and GC-MS Metabolomic Analysis to Characterize Color and Aroma Formation during Tepal Development in Lycoris longituba. Plants 2019, 8, 53. [Google Scholar] [CrossRef]
  80. Chen, S.M.; Li, C.H.; Zhu, X.R.; Deng, Y.M.; Sun, W.; Wang, L.S.; Chen, F.D.; Zhang, Z. The identification of flavonoids and the expression of genes of anthocyanin biosynthesis in the chrysanthemum flowers. Biol. Plant. 2012, 56, 458–464. [Google Scholar] [CrossRef]
  81. Zhu, M.; Zheng, X.; Shu, Q.; Li, H.; Zhong, P.; Zhang, H.; Xu, Y.; Wang, L.; Wang, L. Relationship between the composition of flavonoids and flower colors variation in tropical water lily (Nymphaea) cultivars. PLoS ONE 2012, 7, e34335. [Google Scholar] [CrossRef]
  82. Xiao, Q.; Zhu, Y.; Cui, G.; Zhang, X.; Hu, R.; Deng, Z.; Lei, L.; Wu, L.; Mei, L. A Comparative Study of Flavonoids and Carotenoids Revealed Metabolite Responses for Various Flower Colorations between Nicotiana tabacum L. and Nicotiana rustica L. Front Plant Sci. 2022, 13, 828042. [Google Scholar] [CrossRef]
  83. Wang, B.; Tseng, E.; Regulski, M.; Clark, T.A.; Hon, T.; Jiao, Y.; Lu, Z.; Olson, A.; Stein, J.C.; Ware, D. Unveiling the complexity of the maize transcriptome by single-molecule long-read sequencing. Nat. Commun. 2016, 7, 11708. [Google Scholar] [CrossRef]
  84. Abdel-Ghany, S.E.; Hamilton, M.; Jacobi, J.L.; Ngam, P.; Devitt, N.; Schilkey, F.; Ben-Hur, A.; Reddy, A.S. A survey of the sorghum transcriptome using single-molecule long reads. Nat. Commun. 2016, 7, 11706. [Google Scholar] [CrossRef] [PubMed]
  85. Liu, D.; Chen, L.; Chen, C.; An, X.; Zhang, Y.; Wang, Y.; Li, Q. Full-length transcriptome analysis of Phytolacca americana and its congener P. icosandra and gene expression normalization in three Phytolaccaceae species. BMC Plant Biol. 2020, 20, 396. [Google Scholar] [CrossRef] [PubMed]
  86. Zhou, C.; Zhu, C.; Tian, C.; Xu, K.; Huang, L.; Shi, B.; Lai, Z.; Lin, Y.; Guo, Y. Integrated volatile metabolome, multi-flux full-length sequencing, and transcriptome analyses provide insights into the aroma formation of postharvest jasmine (Jasminum sambac) during flowering. Postharvest Biol. Technol. 2022, 183, 111726. [Google Scholar] [CrossRef]
  87. Chen, J.; Tang, X.; Ren, C.; Wei, B.; Wu, Y.; Wu, Q.; Pei, J. Full-length transcriptome sequences and the identification of putative genes for flavonoid biosynthesis in safflower. BMC Genom. 2018, 19, 548. [Google Scholar] [CrossRef]
  88. Zhou, Y.; Chen, Z.; He, M.; Gao, H.; Zhu, H.; Yun, Z.; Qu, H.; Jiang, Y. Unveiling the complexity of the litchi transcriptome and pericarp browning by single-molecule long-read sequencing. Postharvest Biol. Technol. 2020, 168, 111252. [Google Scholar] [CrossRef]
  89. Gong, W.; Qiling, S.; Ji, K.; Gong, S.; Wang, L.; Chen, L.; Zhang, J.; Yuan, D. Full-Length Transcriptome from Camellia oleifera Seed Provides Insight into the Transcript Variants Involved in Oil Biosynthesis. J. Agric. Food Chem. 2020, 68, 14670–14683. [Google Scholar] [CrossRef]
Figure 1. Phenotypes of Loropetalum cultivars and total anthocyanin content. (A). Phenotypes of 4 Loropetalum cultivars, namely ‘Xiangnong Xiangyun’ (XX), ‘Huye Jimu 2’ (HJ), ‘Xiangnong Fenjiao’, (XF) and ‘Xiangnong Nichang’ (XN), 2 days after the flowering stage, scale bars = 0.5 cm. (B). Transverse section of petals of four Loropetalum cultivars, namely ‘Xiangnong Xiangyun’ (XX), ‘Huye Jimu 2’ (HJ), ‘Xiangnong Fenjiao’ (XF), and ‘Xiangnong Nichang’ (XN), scale bars = 100 μm. (C). Total anthocyanin content in the petals of four Loropetalum cultivars, namely ‘Xiangnong Xiangyun’ (XX), ‘Huye Jimu 2’ (HJ), ‘Xiangnong Fenjiao’ (XF), and ‘Xiangnong Nichang’ (XN). Error bars indicate the standard error (+SE) of the mean. Different letters indicated significant differences at a p ≤ 0.05 level based on Duncan’s test.
Agronomy 13 01296 g001
Figure 2. Global metabolic changes among the different cultivars of L. chinense var. rubrum. (A) Classification and proportion of 207 flavonoid compounds in different cultivars of XX, XF, XN, and HJ. (B) PCA of metabolites in different cultivars of XX, XF, XN, and HJ. (C) Upset plot showing overlap of metabolites in different cultivars of XX, XF, XN, and HJ. (D) Volcano plot of metabolites between HJ and XN. (E) Volcano plot of metabolites between HJ and XF. (F) Volcano plot of metabolites between HJ and XX. (G) Volcano plot of metabolites between XN and XF. (H) Volcano plot of metabolites between XN and XX. (I) Volcano plot of metabolites between XF and XX.
Agronomy 13 01296 g002
Figure 3. The annotation results of full-length nonredundant final transcripts to public databases. (A) The static annotation results of full-length nonredundant final transcripts to seven databases. (B) Annotation of full-length nonredundant final transcripts to NR, NT, KOG, KEGG, and GO.
Agronomy 13 01296 g003
Figure 4. RNA-seq data profiles of L. chinense var. rubrum. Note: XF1–XF3 belong to XF, XN1–XN3 belong to XN, XX1–XX3 belong to XX, and HJ1–HJ3 belong to HJ. (A) Box histogram of all transcripts’ expressions among all of the samples. Note: FPKM value means fragments per kilobase of transcript per million mapped reads. (B) Heatmap of Pearson’s correlation coefficient of all transcripts’ expressions among all of the samples. (C) Clustering tree of transcripts’ expressions of all of the samples, which shows the distance between samples. (D) PCA of transcripts’ expressions of all of the samples, which shows that principal components 1 and 2 represent high cohesion within groups and good separation among different cultivars. (E). The number of up- and downregulated different expression transcripts in the different compared combinations. Note: DEG_number is the number of differentially expressed genes and transcripts.
Agronomy 13 01296 g004
Figure 5. Simplified representation of flavonoid metabolism and heat map produced by significantly different genes related to the flavonoid synthetic of L. chinense var. rubrum. (A) Simplified representation of flavonoid metabolism. Red rectangular boxes represent significantly changed metabolism according to a KEGG enrichment analysis. (B) Heat map produced by significantly different genes related to the flavonoid synthetic. Additionally, the gray rectangular boxes represent the enzyme coded by related genes. The orange square represent upregulated, and the purple square represent downregulated. The white square represent the gene related to the flavonoid synthetic that had not significant changed.
Agronomy 13 01296 g005
Figure 6. Simplified representation of anthocyanins’ metabolism and heat map of genes related to L. chinense var. rubrum. (A) Simplified representation of flavonoid metabolism. (B) Heat map produced by significantly different genes related to flavonoid synthetic. Additionally, the gray rectangular boxes represent the enzymes coded by related genes. The orange square represents upregulated, and the purple square represents downregulated. The white square represents the gene related to flavonoid synthetic that had not significant changed.
Agronomy 13 01296 g006
Disclaimer/Publisher’s Note: The statements, opinions and data contained in all publications are solely those of the individual author(s) and contributor(s) and not of MDPI and/or the editor(s). MDPI and/or the editor(s) disclaim responsibility for any injury to people or property resulting from any ideas, methods, instructions or products referred to in the content.

