Article

Effects of Sodic Water Irrigation and Neutralizing Amendments on Physiological, Biochemical, and Nutritional Quality Traits of Fodder Sorghum

1
ICAR-Research Complex for Eastern Region, Patna 800 014, India
2
ICAR-Central Soil Salinity Research Institute, Karnal 132 001, India
3
ICAR-National Dairy Research Institute, Karnal 132 001, India
4
Rajasthan Agricultural Research Institute, Sri Karan Narendra Agriculture University (SKNAU), Jaipur 303 329, India
5
ICAR-Central Coastal Agricultural Research Institute, Old Goa 403 402, India
6
Academy of Biology and Biotechnology, Southern Federal University, Stachki 194/1, Rostov-on-Don 344090, Russia
7
Faculty of Biology, Yerevan State University, Yerevan 0025, Armenia
*
Authors to whom correspondence should be addressed.
Agronomy 2023, 13(4), 1128; https://doi.org/10.3390/agronomy13041128
Submission received: 3 February 2023 / Revised: 10 April 2023 / Accepted: 13 April 2023 / Published: 15 April 2023
(This article belongs to the Section Water Use and Irrigation)

Abstract

:
This study was conducted at two farmers’ fields to assess the production potential and quality of summer fodder sorghum intervened between the rice-wheat cropping sequences (RWCS) on high residual alkalinity, i.e., residual sodium carbonate (RSC) water irrigation-induced sodic soil. The treatments were comprised of two field sites having different residual alkalinity [RSC ~5 me L−1 (RSC-1) and ~7 me L−1 (RSC-2) water irrigation in main plots, four neutralization strategies, i.e., control/unamended condition (N0), gypsum @ 7.5 t ha−1 (N1), pressmud @ 10 t ha−1 (N2) and gypsum @ 3.75 t ha−1 + pressmud @ 5 t ha−1 (N3) in sub plots and two varietal sequences of RWCS, i.e., salt tolerant varieties (CSR 30 basmati fb KRL 210) and traditionally grown varieties (PB 1121 fb HD 2967) of rice and wheat as sub–sub plots. Sorghum cv. Sugargraze (Advanta Company) was grown after the harvesting of wheat and cut for green fodder before transplanting rice during both years. Sorghum physiological and biochemical traits [relative water content (RWC), total chlorophyll content, photosynthetic rate (Pn), stomatal conductance (gS), transpiration rate (E), chlorophyll fluorescence (Fv/Fm), photon quantum yield [Y (II)] and K/Na ratio]; fodder quality traits [Crude protein (CP), and ether extract (EE)] and productivity [green fodder yield (GFY), dry matter yield, CP yield, EE yield and ash yield) and profitability (gross returns, net returns, benefit–cost ratio) significantly decreased with the increase in irrigation water RSC from 5 to 7 me L−1. Proline, total soluble sugar (TSS), total soluble protein (TSP), dry matter (DM), ash, neutral detergent fibre (NDF), acid detergent fibre (ADF), acid detergent lignin (ADL), neutral detergent insoluble CP (NDICP) and acid detergent insoluble CP (ADICP) decreased with increasing RSC of irrigation water. Sodicity neutralization considerably improved sorghum physiological adaptation mechanisms, fodder quality, productivity and profitability. The introduction of summer fodder sorghum between RWCS resulted in additional net returns (NR) (INR 13.64 to 20.79 × 10³ ha−1). Our results indicate that pressmud proved a feasible alternative to replace and/or reduce the quantity of gypsum required for neutralization of RSC water irrigation. Growing summer fodder sorghum between RWCS along with neutralization of RSC water irrigation can increase the availability of quality green fodder during lean period and also increase the profitability of the rice-wheat cropping system in high residual alkalinity water irrigation conditions.

1. Introduction

Fresh water availability for irrigation is a severe constraint that limits agricultural production across the globe [1]. The rice-wheat cropping system (RWCS) contributed immensely to feeding the ever-increasing global population in general and South Asian countries in particular [2]. Indian national food security depends largely on the RWCS, which occupies roughly 12.3 million ha in the Indo-Gangetic plains (IGP) region [3,4]. Groundwater serves as an essential major source of irrigation water supply in the Trans IGP region of India [5,6] and meets around 60–65% of water requirements of the RWCS in the region [7]. However, 32–84% of the aquifers developed for irrigation in this region are of poor quality [8]. In Haryana state, where this study was conducted, about 34% of the total 3.4 million ha of cultivated land is irrigated with groundwater. Moreover, approximately 44% of the groundwater used for irrigation in the state is sodic or saline-sodic [9,10]. As a consequence, the severe scarcity of fresh water in arid and semi-arid areas, the farmers are constrained to use this low-quality groundwater to meet crop irrigation requirements. Nonetheless, irrigation with groundwater having residual alkalinity, i.e., residual sodium carbonate (RSC) of more than 2.5 me L−1 was observed to cause sodicity in alluvial inceptisols even under monsoonal type climate of the Trans IGP region and, thus, deemed inappropriate for irrigation [8]. Such poor-quality groundwater aquifers [Electrical conductivity (EC)–variable, Sodium adsorption ratio (SAR) > 10 and RSC > 4 me L−1) are extensively prevalent in the Indian states of Haryana, Punjab, Uttar Pradesh, Andhra Pradesh and Karnataka. Long-term irrigation with high RSC water causes precipitation of native soil Ca2+ as CaCO3 and an increase in Na+ saturation on the exchange complex. It leads to the dispersion of clay particles and their migration, crusting, restriction in aeration and water permeability, close packing of soil clods and hardness, and ultimately hinders plant germination and crop growth [8,11,12,13,14,15]. Gypsum (CaSO4. 2H2O) is largely tested and often used for the restoration of sodic soils [8,15,16,17,18]. However, it was proven to be more expensive [19] due to its high requirement (12–16 t ha−1) and costly pricing (INR 3970 t−1). About 60% of sodic soil reclamation cost is incurred on gypsum [20]. The addition of organic matter with the application of organic manures was also reported to supplement the gypsum requirement of sodic soils by improving their physico–chemical characteristics and also supplying nutrients to the plants [16,21]. However, the supply of the required/ample amount of FYM (20 t ha−1) is also a major limitation [19].
Pressmud, an unexplored organic byproduct of the sugar industry, is rich in macro and micronutrients as well as calcium and sulphur. It is a potential source of direct supply of calcium for substitution of excess sodium from the soil exchange complex. While sulphur, after oxidation, forms sulphuric acid and helps to reduce soil pH, dissolving native CaCO3 and thus improving the physical, chemical and biological properties of sodic soils [22]. Estimates suggest that India generates >12 million tonnes of pressmud per year [23]. Therefore, it may be used to supplement the available gypsum for the reclamation of sodic soils.
Livestock is the main complementary component of Indian agriculture and farmers’ livelihood security, especially under stressed environments. Despite being home to around 536 million animals [24] and being the world’s highest milk producer, India’s per animal production is still lower than the worldwide average [25]. As such, genetic variables contribute only 30% of productivity gains in cattle, while feed and fodder management contributes around 70% [26]. However, the problem of fodder shortages is a significant barrier to achieving potential livestock productivity in India. Presently, India confronts a net shortfall of 35.60 and 10.95% of green fodder and dry fodder, respectively [25], which will further aggravate as the demand for green and dry feed is likely to increase to 1012 and 631 million tonnes, respectively by 2050. Green fodder supply must increase at a rate of 1.69% per year to make up for this shortfall [25]. The lag/fallow summer period between the harvest of wheat (April) and the transplanting of rice (end June) in IGP regions can be utilized to grow short-duration crops such as summer fodder sorghum for improving the supply of green fodder [27,28,29,30] and productivity of natural resources [31]. Keeping the above-mentioned factors in mind, we designed this farmers’ participatory field study with the hypothesis that (1) adoption of pressmud as an amendment with/without gypsum may help to mitigate the negative effects of RSC irrigation water and improve the overall system productivity, and (2) inclusion of sorghum during the summer season in existing RWCS may increase the availability of fodder and also augment the system productivity of RWCS.

2. Materials and Methods

2.1. Experimental Site

This farmer-participatory research was conducted during (2018−2019 to 2019−2020) as a part of an ongoing long-term experiment that began in Kharif 2014 at two farmers’ field locations (29°46′57.2″ N, 76°29′23.6″ E; location 1; and 29°46′52.9″ N, 76°29′41.6″ E; location 2) in Mundri village (237 m above the mean sea level) of Kaithal district of Haryana state (India).

2.2. Climate and Weather

The experimental location represents a semi-arid monsoonal climate that receives 3/4th of total precipitation during monsoon months (July to mid-September). Average meteorological data for the standard weeks during the cropping season (2018 and 2019) were recorded from a nearby meteorological observatory situated at CCSHAU Regional Research Station, Kaul, Kaithal (29°51′29.5″ N, 76°39′24.3″ E) and presented in Tables S1 and S2. In rice crops, during the first year of experimentation, the mean maximum temperature was the highest (34.1 °C) in 40th week, while in the second year, it was the highest in 28th week (34.7 °C). The lowest mean minimum temperature (11.5 °C) prevailed during 46th week in the first year of rice cultivation and 44th week was observed as the lowest during the second year. The 30th and 28th weeks were observed with maximum pan evaporation in the 1st and 2nd year of rice cultivation, respectively. The maximum total rainfall, which was 145 and 124.7 mm, was recorded in first and second year of rice crop, respectively. In wheat crops, mean maximum temperature was the highest (34.7 °C in 14th and 36.0 °C in 15th week; during the 1st and 2nd years of study, respectively). The lowest average minimum temperature was 3.7 in 6th and 1.9 in 52nd week of the 1st and 2nd years of study. Maximum evaporation was observed in 14th and 15th weeks for the 1st and 2nd years of wheat cultivation, respectively. Total rainfall was the highest (29.7 and 30 mm) in 14th and 6th weeks during the first and second years of wheat cultivation. In sorghum crops, 21st and 22nd weeks recorded the highest mean maximum temperature, while 15th and 16th weeks showed the lowest average minimum temperature in first and second years of the study. Relative humidity followed a similar trend to the mean minimum temperature. In the 1st year of sorghum cultivation, the 21st week noted maximum bright sunshine hours (BSS) and evaporation. The maximum rainfall was received in 23rd and 25th weeks during 1st and 2nd years, respectively.

2.3. Treatments Details and Crop Management

This experiment was carried out in a split–split plot design with 16 treatment combinations and three replications (detailed descriptions are provided in Table S3). The net plot size of each treatment was 25 × 20 m (500 m2). Treatments comprised of two farmers’ field locations [having different residual sodium carbonate of groundwater; RSC ~5 (5.13) and 7 (6.93) me L−1) denoted as RSC-1 and RSC-2, respectively] in the main plot, four levels of irrigation water RSC neutralization strategies, i.e., control/unamended condition (N0), gypsum @ 7.5 t ha−1 (N1), pressmud @ 10 t ha−1 (N2) and gypsum @ 3.75 t ha−1 + pressmud @ 5 t ha−1 (N3) in subplot and two varieties of rice (CSR 30 basmati and PB 1121) and wheat (KRL 210 and HD 2967) in sub–sub plot. Sugargraze variety (Advanta and UPL ltd., Medak, Telangana India) of fodder sorghum crop was intervened, in the RWCS during summer fallow period (2nd and 3rd week of April to June end) between harvest of wheat and transplanting of rice, to assess the residual effect of above-mentioned different treatments imposed in RWCS. The treatment–wise pressmud (on dry weight basis) and agriculture-grade gypsum were incorporated into the surface 10 cm of soil 15 days before rice transplanting. Composite samples of pressmud were collected in both the years prior to application and analysed for chemical characteristics (Table S4), revealing that it was strongly acidic and non–saline. It also contained appreciable amounts of various macro and micronutrients. The rice nursery was raised using a 40–50 g m−2 seed rate. Thirty-five days old seedlings were uprooted in the afternoon a day before the day of transplanting. The uprooted seedlings were transplanted in the main field at the rate of two seedlings per hill for both cultivars at a hill spacing of 20.0 × 15.0 cm. As per Haryana state recommendation, a dose of 60:26:50:5 and 90:26:50:5 [(N:P:K:Zn) kg ha−1] was applied to CSR 30 basmati and PB 1121, respectively, through urea, di-ammonium phosphate, muriate of potash and zinc sulphate heptahydrate (ZnSO4·7H2O). Full P, K, Zn and half N were applied at the time of transplanting. The remaining N applied in two equal splits at 3 and 6 weeks after transplanting. For the control of weeds, butachlor @ 1.5 kg ha−1 was applied after mixing it with sand at 2–3 DAT. Thereafter, manual weeding was performed at suitable soil moisture conditions just before first and second top dressings. After the harvest of the preceding rice crop, pre-sowing irrigation was applied. Individual plots were sown with the help of zero till drill as per treatments with a 120 kg ha−1 seed rate. Row-to-row and plant-to-plant distance was maintained at 22.5 × 10 cm.
A common recommended dose @ 150:26:50 (kg ha−1) of N: P: K was applied through urea, DAP and MOP. Full P, K and 1/3rd dose of N applied at the time of sowing and the remaining N was applied in two equal splits at first and second irrigation. To reduce weed competition in wheat field, one spray of Clodinafop (60 g a.i. ha−1) was applied at around 35–40 DAS as a post-emergence spray through a knapsack sprayer fitted with flat fan nozzle using 500 litres of water ha−1 after first irrigation. Pre-sowing irrigation, using residual alkalinity groundwater available at respective experimental field sites, was applied just after harvesting of wheat crop, and then, the fields were ploughed by the cultivator. Sorghum was sown in last week of April (in both years) with the help of cultivator using seed rate of 25 kg ha−1. The spacing was maintained at 30 × 15 cm for rows and plants, respectively. A common recommended dose of N, P and K amounting to 100–40–0 kg ha−1, respectively, was adopted for nutrient management. Half of the recommended dose of nitrogen and full dose of phosphorus were applied as basal through urea and DAP. Remaining half N was applied at 30 DAS. Details of the package of practices followed in rice, wheat and sorghum are presented in Table S3.

2.4. Physico-Chemical Properties of Soil and Irrigation Water

The soil of the experimental fields (prior to the Kharif season, 2014) was highly sodic, with pH1:2 > 9.0 (0–15 cm), bulk density (>1.6 Mg m−3), low in KMnO4 oxidizable N, medium to high in Olsen’s P and high in NH4OAc extractable K (Table S5).
Samples of groundwater, used for irrigation in the experimental fields at two sites, were collected before sowing every crop (rice, wheat and summer fodder sorghum). Chemical analysis of groundwater samples was completed as per the standard procedures prescribed for each parameter, i.e., CO32− and HCO3 [32]; Ca2+ + Mg2+ [33] (Table S6). The RSC of each site’s groundwater was calculated using Equation (1).
RSC = (Ca2+ + Mg2+) − (CO32− + HCO3)
where all components of the equation are in (me L−1) and revealed residual alkalinity values of 5.13 (termed hereafter as RSC-1) and 6.93 me L−1 (termed hereafter as RSC-2).

2.5. Sampling, Determination and Calculations

2.5.1. Production Economics

Grain and straw/fodder yields of different crops in various treatments were recorded by randomly harvesting an area of 3 × 3 m. Grain and straw yield of rice (RG and RS), wheat (WS) and sorghum green fodder (SGF) were converted into wheat equivalent yields (WEYs) by following Equation (2).
WEY   ( q   ha 1 ) = ( RG / RS / WS / SGF )   yields   ( q   ha 1 ) ×   Price   of   RG / RS / WS / SGF Price   of   wheat
Gross returns were calculated based on the minimum support price (MSP) of wheat grain, the prevailing market price of basmati rice and straw/fodder during respective years (Table S7). Net returns were calculated as the difference between gross returns and the total cost of cultivation. Benefit: cost ratio was worked out by dividing gross returns by the total cost of cultivation. System production efficiency (SPE) (rice, wheat and sorghum) was calculated by following Equation (3).
SPE   ( kg   ha 1   day 1 ) = System   wheat   equivalent   yield   ( kg   ha 1 ) Total   duration   of   cropping   system   ( days )
System economic efficiency (SEE) was calculated by using Equation (4).
SEE   ( INR   ha 1   day 1 ) = System   net   returns   ( INR   ha 1 ) Total   duration   of   cropping   system   ( days )

2.5.2. Physiological and Biochemical Traits

Fresh leaf samples of randomly selected plants from each treatment plot were collected for studying physiological and biochemical attributes. Relative water content (RWC), membrane injury index (MII) and total chlorophyll content (TCC) were determined by following the methods developed by Weatherley [34], Dionisio-Sese and Tobita [35] and Hiscox and Israelstam [36], respectively. Total soluble carbohydrate (TSC), total soluble protein (TSP) and proline were determined as per the method of Yemm and Willis [37], Bradford [38] and Bates et al. [39], respectively. A portable gas exchange device (LI-6400, LICOR Inc., Lincoln, NE, USA) was used to measure photosynthetic rate (Pn), stomatal conductance (gS) and transpiration rate (E). The chlorophyll fluorescence (Fv/Fm) and photon quantum yield [Y (II)] were determined using a portable pulse-modulated fluorescence metre (Junior PAM Chlorophyll Fluorometer, Heinz Walz GmbH, Effeltrich, Germany).

2.5.3. Proximate/Nutritional Quality Traits

One square meter of a quadrate area of sorghum crop was harvested and a sample (500 g) was sun-dried then oven-dried for 72 h at 60 ± 5 °C to obtain a stable weight to work out the dry matter content. Crude protein (CP) content was calculated by multiplying Kjeldahl N with factor 6.25. Ether extract (EE) and total ash content were estimated as per the method suggested by AOAC [40]. Yield of CP, EE and ash was calculated by multiplying its content with dry matter yield. Fibre fractions such as neutral detergent fibre (NDF), acid detergent fibre (ADF) and acid detergent lignin (ADL) were estimated as per the methods of Van Soest et al. [41].
Neutral detergent insoluble CP (NDICP) and acid detergent insoluble CP (ADICP) were determined by analysing NDF and ADF residues for Kjeldahl N.
The secondary fodder quality indices were estimated using the following methodologies: Dry matter intake (DMI; Equation (5)) and dry matter digestibility (DMD; Equation (6)) were determined using methodology suggested by Horrocks and Vallentine [42].
DMI   ( % ) = 120 ÷ ( NDF )
DMD ( % ) = 88.9 ( 0.779 × ADF )
Relative feed value (RFV; Equation (7)) and total digestible nutrients (TDN; Equation (8)) were determined according to the methodology suggested by Horrocks and Vallentine [42].
RFV   ( % ) = DMD × DMI   × 0.775
TDN   ( % ) = 1.291   ×   ADF + 101.35
Net energy of lactation (NE1; Equation (9)) was determined according to the methodology suggested by Lithourgidis et al. [43].
NEl   ( mcal   kg 1 ) = [ 1.044     0.0119   ×   ADF ) ]   ×   2.205
N content in the fodder samples was determined using modified Kjeldahl method [44]. P was estimated using ammonium vanadomolybdo phosphoric acid yellow colour method [45]. Potassium and sodium were determined using flame photometer method [46]. After di-acid digestion (HNO3–HClO4), calcium and magnesium were determined using an atomic absorption spectrophotometer (AAS) as per Hanlon [47] and micronutrients (Fe, Mn, Cu, and Zn) as per Jackson [44].

2.6. Statistical Analysis

Certain parameters exhibited year-wise variations, and hence, were included as variables in the analysis of variance. Then, all the recorded parameters were analysed with analysis of variance (ANOVA) technique for split-factorial using SAS [“http://stat.iasri.res.in/sscnarsportal”] and pairwise comparisons of treatments effects were made using the LSD (least significance difference) test at p ≤ 0.05. Relationships among different attributes of sorghum crop were established using PAST 4.0 Software.

3. Results

3.1. Productivity and Profitability

Irrespective of RSC levels and neutralization strategies, intervening sorghum as summer forage crop in RWCS produced an additional 21.8 to 32.1 t ha−1 of green fodder (Figure 1). With RSC-1 (~5.00 me L−1), both tested neutralizers (sole or in combination) were found at par whereas at higher irrigation water RSC level (~7.00 me L−1) (RSC-2), N2 (pressmud @ 10 t ha−1; 27.73 t ha−1) proved significantly superior over N1 (sole application of gypsum; 26.58 t ha−1) and remained at par with combined application of gypsum and pressmud (N3)(gypsum 3.75 t ha−1 + pressmud @ 10 t ha−1; 27.56 t ha−1). At lower irrigation water RSC level, i.e., RSC-1 (~5.00 me L−1), the maximum positive impact in terms of green fodder yield, over unamended condition/N0, was brought by N3 (8.76%). However, at higher irrigation water RSC, i.e., RSC-2 (~7.00 me L−1), N2 produced the maximum (27.36%) yield advantage over unamended control (N0). The study year 2018–19 recorded significantly higher wheat equivalent yields of rice grain (WEY–RG; 67.28 q ha−1), rice straw (WEY–RS; 3.53 q ha−1), wheat straw (WEY–WS; 17.40 q ha−1) and sorghum green fodder (WEY–SGF; 25.03 q ha−1) (Table 1). The inclusion of fodder sorghum as summer crop resulted in 21.20 to 25.83 q ha−1 additional WEY in RWCS. Even at higher alkalinity stress (RSC-2), the introduction of sorghum brought 21.41 q ha−1 extra WEY in RWCS. Increased residual alkalinity stress from RSC-1 to RSC-2 considerably reduced WEY of all crops (minimum reduction that was of 6.69% observed in WEY–RG to a maximum of 17.11% in WEY–SGF).
The application of amendment either sole or in combined form significantly enhanced WEY of rice, wheat and sorghum. Amid RSC neutralization strategies, N3 observed markedly higher WEY–RG (69.42 q ha−1), WEY–RS (3.62 q ha−1), wheat grain yield (WY; 43.06 q ha−1), WEY–WS (18.66 q ha−1) and WEY–RW (134.91 q ha−1) (Table 1).
The adoption of N2 and N3 showed equal yield advantage in terms of WEY–SGF. The adoption of CSR 30 basmati–KRL 210–Sugargraze varietal sequence of rice, wheat and sorghum crops, respectively, expressed markedly higher WEY–RG (64.77 q ha−1), WY (41.85 q ha−1) and WEY–RW (126.27 q ha−1). However, the PB 1121–HD 2967–Sugargraze varietal sequence evidenced higher WEY–RS and WEY–WS.
The gross returns (GR; INR 231.81 × 10³ ha−1) and net returns (NR; INR 161.78 × 10³ ha−1) of RWCS recorded substantially higher in study year 2018–19 compared to 2017–18 (Table 1). The introduction of sorghum as a summer crop in RWCS resulted in additional GR (INR 38.49 to 46.89 × 10³ ha−1) and NR (INR 13.64 to 22.04 × 10³ ha−1). Increased RSC from RSC-1 to RSC-2 remarkably decreased the GR (11.28%) and NR (15.89%) of RWCS. Furthermore, in summer, sorghum, GR and NR were reduced by 17.13 and 36.43%, respectively, from this increased irrigation water RSC.
The application of amendments, i.e., N1, N2 and N3 practices, significantly increased GR (21.19 to 30.53%) and NR (11.89 to 31.79%) over N0 in RWCS. N2 and N3 equally improved the GR and NR in the sorghum crop. In sorghum, RSC ameliorants improved NR (36.30 to 46.39%) compared to unamended control/N0. CSR 30 basmati–KRL 210–Sugargraze varietal sequence of rice-wheat and sorghum, respectively, recorded higher GR and NR of RWCS. Increased residual alkalinity stress from RSC-1 to RSC-2 markedly reduced benefit: cost ratio (BCR; 12.40%) (Table 1). N2 (2.69) and N3 (2.51) had significantly higher BCR than N1 and N0. However, employing N1 also improved BCR significantly over N0. Varietal sequence CSR 30 basmati–KRL 210–Sugargraze of rice, wheat and sorghum, respectively, (2.49) recorded significantly higher (5.51%) BCR compared to PB 1121–HD 2967–Sugargraze (2.36). Increased RSC from RSC-1 to RSC-2 significantly reduced the system production efficiency (SPE; 12.24%) and system economic efficiency (SEE; 20.05%) (Table 1). Neutralization of RSC irrigation water significantly enhanced SPE as well as SEE. The magnitude of increment in SPE was 19.75, 23.43 and 28.10% through N1, N2 and N3 compared to N0/unamended control (34.13 kg ha−1 day−1). Similarly, the extent of enhancement in SEE was 9.88, 34.62 and 33.52% due to practicing N1, N2 and N3 over N0 (INR 357.19 ha−1 day−1).

3.2. Physiological and Biochemical Attributes

The study year 2019 evidenced significantly higher relative water content (RWC; 70.70%) and total chlorophyll content (TCC; 1.42 μg ml−1 FW) at 60 DAS compared to 2018. Contrarily considerably higher total soluble carbohydrate (TSC; 11.26 μg mg−1 DW) and total soluble protein content (TSP; 15.88 mg g−1 FW) was observed in 2019 (Table 2). The study year 2019 (2.11 and 2.56) also expressed substantially higher K/Na ratio at 20 DAS and harvest, respectively (Table 2). An increase in residual alkalinity of irrigation water from RSC-1 to RSC-2 significantly decreased RWC by 9.17 and 14.41%; TCC by 12.29 and 12.24% at 20 DAS and harvest, respectively (Table 2). However, contrary to this, membrane injury index/(MII) considerably increased with an increase in RSC level and RSC-1 (11.08 and 16.12%) had lower MII than RSC-2 (14.71 and 21.06%) at 20 DAS and harvest, respectively (Table 2). Similarly, at harvest, biochemical attributes such as TSC, TSP and proline accumulation was found to increase by 27.37, 27.80 and 32.47% with elevated residual alkalinity from RSC-1 to RSC-2 (Table 2).
RSC-1 recorded remarkably higher values of gas exchange attributes such as chlorophyll fluorescence (Fv/Fm; 0.69), stomatal conductance (gS; 1.64 m mol H2O m−2 s−1); transpiration rate (E; 3.71 m mol H2O m−2 s−1), photon quantum yield [Y (II); 0.58] and photosynthetic rate (Pn; 24.94 µmol CO2 m−2 s−1) compared to RSC-2 (Table 2). RSC-1 showed significantly lower Na (0.79 and 0.58%) and higher K (1.77 and 1.53%) at 20 DAS and harvest, respectively, in comparison to RSC-2. (Table S8). Markedly higher K/Na ratio was witnessed in RSC-1 (2.34 and 2.70) at 20 DAS and harvest, respectively (Table 2).
The intensity of the adverse effect caused by residual alkalinity stress reduced through the adoption of various neutralization strategies (N1, N2 and N3) in terms of improved physiological adaptions, i.e., higher RWC, TCC, gas exchange attributes and K/Na ratio; lower MII, TSC, TSP and proline (Table 2). The adoption of N3, N2 and N1 increased RWC by 23.50, 21.54 and 12.56% at 20 DAS; 30.03, 22.60 and 19.02% at harvest, respectively, over N0. RSC neutralizing strategies, i.e., N3 (1.79 and 1.47 μg ml−1 FW) and N2 (1.77 and 1.43 μg ml−1 FW) showed significantly higher TCC at 20 DAS and harvest, respectively, compared to N1.
All neutralization strategies varied significantly with one another and minimum TSC (7.76 μg mg−1 DW), as well as TSP (13.74 mg g−1 FW), was recorded in N3. N2 led to considerably decreased proline (5.60 µg g−1 FW). N3 (0.67) and N1 (0.66) noted significantly higher Fv/Fm compared to other treatments. Imposition of N1 (1.59 m mol H2O m−2 s−1) and N3 (1.56 m mol H2O m−2 s−1) had substantially higher gS. Furthermore, N3 (3.71 m mol H2O m−2 s−1) remained at par with N1 and had considerably higher E. Similarly, N3 (0.57) and N1 (0.56) remained at par with N2 and showed higher Y (II) over N0.
Similarly, the imposition of N3 (23.93 µmol CO2 m−2 s−1) and N1 (23.45 µmol CO2 m−2 s−1) recorded remarkably higher Pn over other strategies (Table 2). The significantly higher K/Na ratio was found in N3 (2.63 and 2.98) at 20 DAS and harvest, respectively, over rest of the treatments.

3.3. Fodder Quality Attributes

Between studied years, sorghum planted during 2019 recorded significantly lower dry matter (DM; 20.05%), NDF (64.45%), ADF (36.36%) and HCN (101.28 mg kg−1) as compared to 2018 (Table 3). Conversely, dry matter yield (DMY; 6.13 t ha−1), crude protein yield (CPY; 5.68 q ha−1), ether extract yield (EEY; 1.14 q ha−1); DMD (60.58%), DMI (1.86%), NEl (1.35 mcal kg−1), RFV (87.62%) and TDN (54.41%) observed markedly higher during 2019 as compared to 2018 (Table 3 and Table 4). The crop planted during 2019 was also noticed to have sustainably higher nutrient contents such as manganese (Mn; 117.84 mg kg−1), copper (Cu; 18.06 mg kg−1) and zinc (Zn; 49.55 mg kg−1) over 2018 (Table 4). However, the content of macro nutrients (N, P and K) was not influenced significantly due to the studied years. Increased residual alkalinity stress, i.e., RSC-1 to RSC-2, resulted in a reduction of 12.80, 10.69, 21.75, 5.73, 17.36 and 10.89%, in DMY, crude protein (CP), CPY, ether extract (EE), EEY and ash yield, respectively (Table 3). However, contrarily, DM, ash, NDF, ADF, ADL, NDICP, ADICP and HCN significantly reduced by 5.51, 2.51, 4.71, 5.74, 8.24, 5.92, 5.44 and 21.06%, respectively, with elevated residual alkalinity stress (shifting from RSC-1 to RSC-2). Increased RSC stress also lowered the organic matter as well as cell soluble contents (Table S8).
Nutritive/energy indices considerably declined through this enhanced irrigation water RSC. The magnitude of reduction was 2.60, 4.26, 5.44, 1.19 and 21.06% in DMD, DMI, NEl, RFV and TDN with this increased irrigation water RSC (Table 4). Similarly, nutrient contents, viz., nitrogen (N), phosphorous (P), calcium (Ca), iron (Fe), Mn and Cu were reduced by 10.90, 8.70, 5.00, 4.58, 5.50 and 6.60%, respectively, from the shifting of RSC-1 to RSC-2 (Table 4).
RSC neutralization strategies, i.e., N1 (20.86%), N2 (20.39%) and N3 (20.43%) showed at par DM and noted considerably lower than N0 (21.88%). However, the reverse was true in the case of DMY where N1 (6.02 t ha−1), N2 (6.06 t ha−1) and N3 (6.07 t ha−1) resulted at par yield and significantly enhanced DMY over N0 (5.56 t ha−1) (Table 3). Likewise, significantly higher CP was achieved by application of N3 (9.56%) as compared to other neutralization strategies.
The neutralization of residual alkalinity stress through N1, N2 and N3 increased CP by 9.63, 17.64 and 14.71% over N0 (8.33%) (Table 3). Significantly higher EE was attained in N2 (1.95%) over rest of the treatments, except N3 (1.94%). The performance of applied neutralizers, i.e., N1, N2 and N3 observed statistically equal and recorded noticeably lower ash over N0 (8.43%) (Table 3). The application of all the neutralizers significantly enhanced CP and EE yield over N0 (Table 3). Among neutralization practices, N2 (5.95 q ha−1) being at par with N3 (5.82 q ha−1) resulted in higher CP yield compared to N1. A similar trend to CPY was observed in the case of EEY. The application of N1, N2, and N3 enhanced 17.50, 24.58 and 24.58% EEY, respectively, over N0 (0.95 q ha−1). Applied neutralizers increased ash yield in a non-significant manner. However, numerically, a higher ash yield was obtained with N3 (4.83 q ha−1).
Fibre fractions (NDF, ADF and ADL) and their associated proteins fractions (NDICP and ADICP) declined by imposition of various amendments compared to unamended control/N0 (Table 3). Significantly lower NDF was recorded under N3 (63.95%) as compared to rest of the neutralization strategies, except the application of N2 (64.12%). However, significantly lower ADF content was recorded in N2 (35.33%) over the rest of the treatments. However, N3 (35.94%) and N1 (36.22%) were also found to decrease ADF as compared to N0. The application of amendments significantly reduced ADL over unamended control/N0. Among the applied neutralizing practices, significantly lower ADL was obtained in N3 (5.19%) over N1 (5.51%) and N0 (5.74%). All applied neutralizers differed significantly with one another and significantly lowermost NDICP noticed in N2 (2.79%). However, significantly minimum ADICP was noticed in N3 (1.33%) over rest of the treatments.
Neutralization of residual alkalinity significantly reduced the HCN (Table 3). The same treatment recorded the lowest hemi-cellulose (HC), whereas total carbohydrate (T-CHO) was recorded the lowest in N2 (Table S8). Combined use of gypsum and pressmud (N3) resulted in lower HCN (88.58 mg kg−1) over the rest of the treatments. The application of sole gypsum (N1), sole pressmud (N2) and gypsum + pressmud (N3) caused a reduction in HCN by 13.34, 24.00 and 30.34%, respectively, over unamended control (N0).
The application of RSC ameliorants caused significant improvement in nutritive/energy indices and nutrients contents (Table 4). The magnitude of improvement was 4.22, 5.40, 4.60% in DMD; 4.91, 6.53 and 6.77% in DMI; 6.52, 8.35 and 7.11% in NEl, 9.32, 12.22 and 11.61% in RFV and 8.06, 10.32 and 8.79% in TDN through employing N1, N2 and N3 strategies, respectively, compared to no amendment application/N0. However, the extent of increments was 1.10, 1.18 and 1.15 folds in N; 1.09, 1.15 and 1.16 folds in P; 1.15, 1.10 and 1.11 folds in Ca; 1.05, 1.09 and 1.11 folds in magnesium (Mg); 1.08, 1.18 and 1.13 folds in Fe; 1.03, 1.13 and 1.08 folds in Cu; 1.09, 1.16 and 1.14 folds in Mn; 1.04, 1.13 and 1.08 folds in Zn due to imposition of N1, N2 and N3 practices, respectively, over N0 (Table 4).

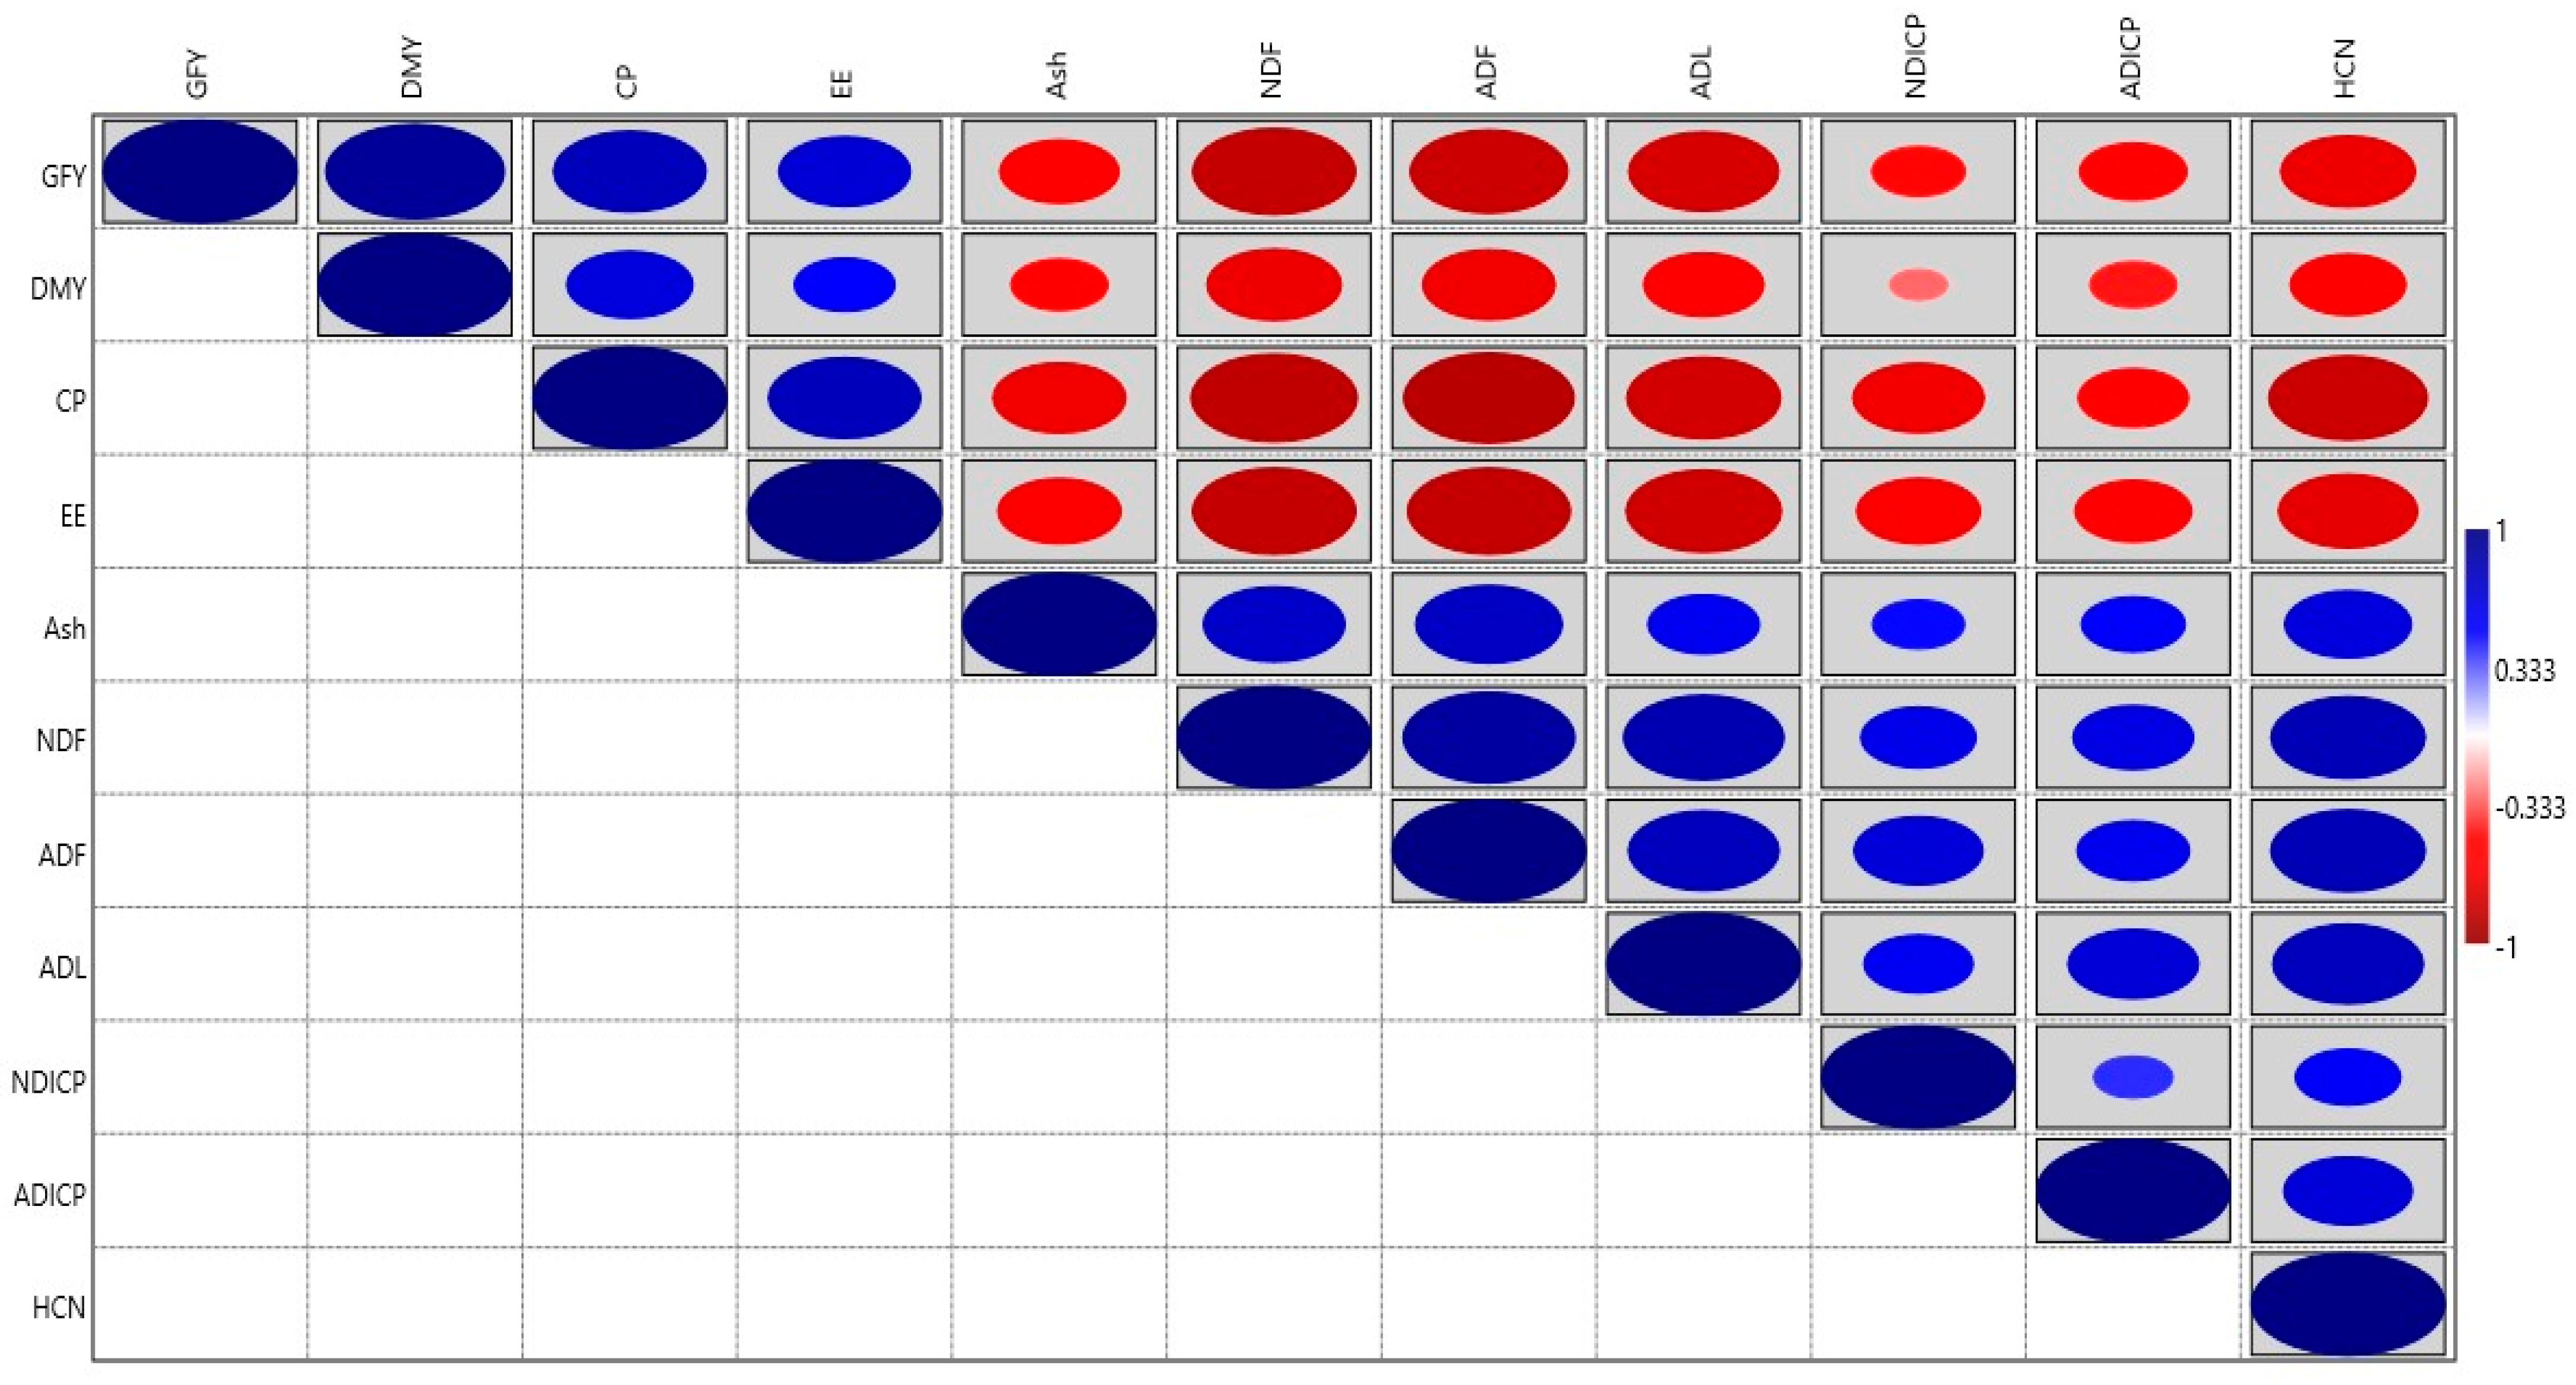
3.4. Correlation Studies

Person’s correlation statistic (p ≤ 0.05) (Figure 2) among GFY, physiological and biochemical traits of sorghum crop recorded at 60 DAS, showed that GFY had a strong and positive relationship with RWC (r = 0.80), TCC (r = 0.84), Fv/Fm (r = 0.83), gS (r = 0.80) and Pn (r = 0.80); and moderate positive correlation with E (r = 0.74), Y (II) (r = 0.66) and K/Na ratio (r = 0.77) at 60 DAS. However, proline (r = −0.87), TSC (r = −0.68) and TSP (r = −0.72) exhibited negative association with sorghum GFY. Additionally, a relationship study among different parameters of sorghum crop revealed that GFY had strong and positive correlation with DMY (r = 0.92) (Figure 3). GFY showed a moderate and positive relationship with crude protein (r = 0.79) and ether extract (r = 0.68), while it had strong negative association with NDF (r = −0.84), ADF (r = −0.81), ADL (r = −0.78) and HCN (r = −0.70). Dry matter yield showed moderate negative relationship with fibre fractions, i.e., NDF (r = −0.69), ADF (r = −0.68), ADL (r = −0.62) and weak negative correlation with fibre-associated crude proteins [NDICP (r = −0.30) and ADICP (r = −0.45)]. Ash content exhibited moderated negative associations with CP (r = −0.69), EE (r = −0.64) and GFY (r = −0.62).

4. Discussion

4.1. Productivity and Profitability

More rainfall (32.05 mm more) (Tables S1 and S2) and the residual effect of previous year’s RSC neutralizers made soil environment conducive during second year of experimentation. The combined effect of these also led to improved growth and the physiological adaptation mechanisms (higher RWC, TCC, TSC, TSP and K/Na). Hence, higher productivity (in terms of yields), profitability (GR and NR) and improved fodder quality traits (lowered NDF, ADF and HCN) in the second year. The application of different amendments might have reduced soil pH, ESP, bulk density and increased infiltration rate, hydraulic conductivity, calcium, magnesium, organic carbon and available N, which resulted in better root development, enhanced leaf area, higher photoassimilates and, thereby, more dry matter accumulation, better growth and, ultimately, productivity [20,48,49,50,51,52]. The efficacy of gypsum and pressmud in ameliorating the adverse effects of brackish water and increasing crop yields was also reported by Choudhary et al. [53] and Sheoran et al. [15,17,18,19].
Better growth and physiological behaviour due to genetic traits of the variety could be the reason for higher yield in CSR 30 basmati–KRL 210–Sugargraze varietal sequence [17]. The adoption of CSR 30 basmati–KRL 210–Sugargraze (rice, wheat and sorghum, respectively) showed higher profitability due to higher market price of CSR 30 basmati and higher yield of KRL 210. Singh et al. [52] also showed significantly higher benefit: cost ratio with salt tolerant variety over traditional under sodic soil condition.

4.2. Physiological and Biochemical Attributes

Higher additions and consequent build-up of salts (CO32− and HCO3 of Na) in soil with RSC-2 compared to RSC-1 might have created more intensified residual alkalinity stress and reduced growth characters. Higher concentrations of these ions might have resulted in the dispersion of clay minerals, caused aeration and permeability problems [8,54,55,56] and, subsequently, adversely affected plant morpho-physiological processes [decreased RWC, TCC, E, Fv/Fm, gS, E, Y(II) and K/Na].
More salts might have accumulated under high irrigation water RSC that can produce water deficit conditions, and disruption of ion homeostasis [57]. In addition to this, the uptake and accumulation of salts (CO32− and HCO3 of Na) within the plant system might have also caused interference in necessary physiological functions. Cumulative effects of all these phenomena resulted in lower productivity and profitability under higher irrigation water RSC. Our results are supported by the earlier findings of Ashraf et al. [58] and Sheoran et al. [17]. The application of gypsum supplied Ca2+ ions in required amount in the soil solution, which had a role in replacing the exchangeable Na+ from the clay lattice and made congenial environment of soil which improved water and nutrient availability to plant. Further supplementation of calcium, sulphur, potassium and many more essential mineral nutrients in response to added gypsum and/or pressmud maintained adequate ionic balance in soil as well as in plant system. However, the decomposition process of added pressmud increased the ionic concentration, organics acids and increased partial pressure of CO2, which further mobilized native calcite, consequently released Ca2+ [54,55,59] and led to lowered soil pH, ESP and improved soil properties. As improved soil properties facilitates better aeration, higher nutrient availability, healthier root activity, better water and nutrient absorption, improvement in plant physiological traits (RWC, TCC, E, Fv/Fm, gS, E, Y(II) and K/Na), which further might have helped in better control on the accumulation of Na+ ions and maintained lower ionic concentration [60,61].

4.3. Fodder Quality Attributes

Improved fodder quality traits during the second year of experimentation could be due to a higher amount of rainfall received (32.05 mm more) (Tables S1 and S2). The water-deficit situation caused cell walls to be more rigid and fibrous; thus producing a higher value of DM, ash and ADL with RSC-2. The lower nutritional value, i.e., CP, EE, CP yield, EE yield and ash yield, at high residual alkalinity may be due to lower availability of essential nutrients (at high pH); the altered transformation process and uptake of these into plants led to more deterioration of fodder quality. These results are in line with earlier findings of Shah et al. [62], Dai et al. [63] and Soni et al. [64]. Improved fodder quality could be due to better soil properties such as increased infiltration rate, hydraulic conductivity, bulk density and lowered pH and ESP which facilitated better nutrient, water availability and their uptake [48,49].

5. Conclusions

Increased residual alkalinity (from RSC~5.00 me L−1 to RSC~7.00 me L−1) significantly reduced physiological and biochemical attributes of sorghum crop along with reduced fodder quality. The use of different neutralizing amendments significantly improved the physiological adaptation, nutritional quality of fodder sorghum vis-à-vis enhanced productivity and profitability of RWCS. Even at higher irrigation RSC water induced alkalinity stress (RSC-2), the introduction of sorghum brought 21.41 q ha−1 extra WEY in RWCS. Intervening sorghum as a summer crop in RWCS resulted in additional GR and NR. Therefore, our results indicates that growing fodder sorghum during the summer season in RWCS, along with neutralization of RSC water irrigation induced soil sodicity, is a viable option for utilizing the summer fallow and can increase the availability of quality green fodder along with higher productivity during lean period and also increase profitability of RWCS in high residual alkalinity water irrigated conditions of trans Indo-Gangetic plains of India and elsewhere with similar ecologies.

Supplementary Materials

The following supporting information can be downloaded at: https://www.mdpi.com/article/10.3390/agronomy13041128/s1, Table S1: Mean weekly meteorological parameters during 2017–18 (First year of experimentation); Table S2: Mean weekly meteorological parameters during 2018–19 (Second year of experimentation); Table S3: Treatment details; Table S4: Composition of pressmud; Table S5: Initial (prior to kharif season, 2014) physico-chemical properties of the experimental sites (0−15 cm soil depth); Table S6: Composition of irrigation water of experimented sites; Table S7: Minimum support price (MSP) as per Government of India and prevailed market price of different crops during the experimentation; Table S8. Ions content (sodium and potassium) and fodder quality traits of summer sorghum as influenced by study years, RSC levels and neutralization strategies.

Author Contributions

G.M., conceptualization, data collection/curation, formal analysis, writing—review and editing; R.K.Y., conceptualization, project administration, supervision, validation, writing—review and editing; P.S., conceptualization, project administration, supervision; R.K., data curation, supervision, formal analysis; A.K., data curation, supervision, formal analysis; H.R., supervision, formal analysis; M.R.Y., data curation, formal analysis, writing—review and editing; D.K., formal analysis, writing—review and editing; S.K., writing—review and editing; T.M., writing—review and editing; H.S.M., writing—review and editing; S.S.M., writing—review and editing; V.D.R., writing—review and editing. All authors have read and agreed to the published version of the manuscript.

Funding

The research finding is a part of the CSSRI Research Project “Improving farm productivity through sustainable use of alkali waters at farmer’s field in rice-wheat production system (NRMACSSRISIL201400300861)”. This research was supported in form of National Fellowship for Ph.D. programme by University Grants Commission (F1-17.1/2017-18/RGNF-2017-18-SC-RAJ-40177/(SA-III/Website). This research is supported by the Science Committee of RA, in the frames of the research project № 21AG-4C075 and № 20RF-036; by RFBR (no. 20-55-05014).

Institutional Review Board Statement

Not applicable.

Informed Consent Statement

Not applicable.

Data Availability Statement

Not applicable.

Acknowledgments

The authors are sincerely thankful to the Director, ICAR–NDRI, Karnal, India, and the Director, ICAR–CSSRI, Karnal, India, for providing the necessary support to carry out this research work. Rajkumar and Subash Chand (farmers of Mundri village, Kaithal district, Haryana) who volunteered to participate in this research study are highly appreciated. Incharge, meteorological observatory of CCSHAU Regional Research Station, Kaul, Kaithal, is duly acknowledged for providing weather data.

Conflicts of Interest

The author declares that they have no known competing financial interest or personal relationship that could have appeared to influence the work reported in this paper.

Abbreviations

RSC: residual sodium carbonate; EC: electrical conductivity; SAR: sodium adsorption ratio; RWCS: rice-wheat cropping system; RSC-1: residual sodium carbonate of irrigation water ~5 me L−1; RSC-2: residual sodium carbonate of irrigation water ~7 me L−1; N0: control/unamended condition; N1: gypsum @ 7.5 t ha−1; N2: pressmud @ 10 t ha−1; N3: gypsum @ 3.75 t ha−1 + pressmud @ 5 t ha−1; me L−1: Mill equivalent per litre; ml: Milliliter; dS m−1: Deci Siemens per meter; INR: Indian Rupees; %: percentage; µg: microgram; g: gram; WEY-RG: wheat equivalent yield of rice grain; WEY-RS: wheat equivalent yield of rice straw; WY: wheat grain yield; WEY-WS: wheat equivalent yield of wheat straw; WEY-RW: total wheat equivalent yield of rice-wheat rotation; WEY-SGF: wheat equivalent yield of sorghum green fodder; GR: gross returns; NR: net returns; BCR: benefit- cost ratio; SPE: system production efficiency; SEE: system economic efficiency; RWC: relative water content; MII: membrane injury index; TCC total chlorophyll content; TSC: total soluble carbohydrate; TSP: total soluble protein content; Fv/Fm: Chlorophyll fluorescence; gS: stomatal conductance; E: transpiration rate; Y (II): photon quantum yield; Pn: photosynthetic rate; K/Na: potassium to sodium ratio; DAS: days after sowing; DM: dry matter content; DMY: dry matter yield; CP: crude protein; CPY: crude protein yield, EE: ether extract; EEY: ether extract yield; NDF: neutral detergent fibre; ADF: acid detergent fibre; NDICP: neutral detergent insoluble crude protein; ADICP: acid detergent insoluble crude protein; ADL: acid detergent lignin; DMD: dry matter digestibility; DMI: dry matter intake; NEl: net energy for lactation; RFV: relative feed value; TDN: total digestible nutrient; t ha−1: tonnes per hectare; mg kg−1: milligram per kilogram.

References

  1. Hazra, M.; Avishek, K. Water resources evaluation through water accounting: A means to achieve sustainable development. Bioscan 2010, 1, 43–50. [Google Scholar]
  2. Chauhan, B.S.; Mahajan, G.; Sardana, V.; Timsina, J.; Jat, M.L. Productivity and sustainability of the rice-wheat cropping system in the Indo-Gangetic Plains of the Indian subcontinent: Problems, opportunities, and strategies. Adv. Agron. 2012, 117, 315–369. [Google Scholar] [CrossRef]
  3. Panigrahy, S.; Upadhyay, G.; Ray, S.S.; Parihar, J.S. Mapping of cropping system for the Indo-Gangetic plain using multi–date SPOT NDVI–VGT data. J. Indian Soc. Remote Sens. 2010, 38, 627–632. [Google Scholar] [CrossRef]
  4. Singh, Y.; Sidhu, H.S. Management of cereal crop residues for sustainable rice-wheat production system. Proc. Indian Natl. Sci. Acad. 2014, 80, 95–144. [Google Scholar] [CrossRef]
  5. Dutta, S.; Chowhan, P. Assessment of groundwater quality of masuda tehsil, Ajmer district, Rajasthan. Ecoscan 2009, 3, 281–284. [Google Scholar]
  6. Yadav, R.K.; Dagar, J.C. Innovations in utilization of poor quality water for sustainable agricultural production. In Innovative Saline Agriculture; Dagar, J.C., Sharma, P.C., Sharma, D.K., Singh, A.K., Eds.; Springer: Delhi, India, 2016; pp. 219–264. [Google Scholar] [CrossRef]
  7. Minhas, P.S.; Bajwa, M.S. Use and management of poor quality waters for the rice-wheat based production system. J. Crop Prod. 2001, 4, 273–306. [Google Scholar] [CrossRef]
  8. Minhas, P.S.; Qadir, M.; Yadav, R.K. Groundwater irrigation induced soil sodification and response options. Agric. Water Manag. 2019, 215, 74–85. [Google Scholar] [CrossRef]
  9. Manchanda, H.R. Quality of Underground Water of Haryana. Ph.D. Thesis, Haryana Agricultural University, Hisar, India, 1976. [Google Scholar]
  10. Kumar, K.; Saha, B.N.; Saha, S.; Prabhakar, M.K.; Das, A.; Sashikhant; Singh, R.P.S.; Basak, N.; Verma, O.P. Assessment of ground water quality under intensively rice-wheat cultivated semi–arid regions of Haryana, India. Ecoscan 2015, 9, 127–132. [Google Scholar]
  11. Grattan, S.R.; Oster, J.D. Use and reuse of saline–sodic waters for irrigation of crops. J. Crop Prod. 2003, 7, 131–162. [Google Scholar] [CrossRef]
  12. Levy, G.H.; Mamedov, A.I.; Goldstein, D. Sodicity and water quality effects on slaking of aggregates from semi–arid soils. Soil Sci. 2003, 168, 552–562. [Google Scholar] [CrossRef]
  13. Oster, J.D. Amendments use to mitigate the adverse effects of alkali irrigation water. In Extended Summaries, International Conference on Sustained Management of Sodic Lands; Uttar Pradesh Council of Agricultural Research: Lucknow, India, 2004; pp. 89–91. [Google Scholar]
  14. Bali, A.; Singh, A.; Minhas, P.S.; Yadav, R.K. Effect of plant bioregulators and their combinations on growth and yield of wheat under sodicity stress induced by alkali water irrigation. J. Soil Salin. Water Qual. 2020, 12, 45–49. [Google Scholar]
  15. Sheoran, P.; Kumar, A.; Kumar, A.; Raju, R.; Sharma, R.; Parjapat, K.; Barman, A.; Singh, R.K.; Kumar, S.; Sharma, P.C.; et al. Impact of pressmud application in reclamation of high RSC irrigation water induced soil sodification and sustaining rice (Oryza sativa)–wheat (Triticum aestivum) production in Indo-Gangetic plains. Indian J. Agric. Sci. 2020, 90, 206–211. [Google Scholar] [CrossRef]
  16. Rana, K.S.; Choudhary, A.K.; Sepat, S.; Bana, R.S.; Dass, A. Methodological and Analytical Agronomy; Post Graduate School, Indian Agricultural Research Institute: New Delhi, India, 2014; p. 276. [Google Scholar]
  17. Sheoran, P.; Basak, N.; Kumar, A.; Yadav, R.K.; Singh, R.; Sharma, R.; Kumar, S.; Singh, R.K.; Sharma, P.C. Ameliorants and salt tolerant varieties improve rice-wheat production in soils undergoing sodification with alkali water irrigation in Indo-Gangetic Plains of India. Agric. Water Manag. 2021, 243, 106492. [Google Scholar] [CrossRef]
  18. Sheoran, P.; Kumar, A.; Singh, A.; Kumar, A.; Parjapat, K.; Sharma, R.; Singh, R.K.; Yadav, R.K.; Dang, Y.P.; Sharma, P.C. Pressmud alleviates soil sodicity stress in a rice-wheat rotation: Effects on soil properties, physiological adaptation and yield-related traits. Land Degrad. Dev. 2021, 32, 2735–2748. [Google Scholar] [CrossRef]
  19. Singh, Y.P.; Mishra, V.K.; Bharadwaj, A.K.; Arora, S.; Singh, A.K.; Singh, S.; Haefele, S.M. Synergy of reduced gypsum and pressmud–a cost effective approach for sustainable reclamation of degraded sodic lands. Indian J. Agric. Sci. 2019, 89, 1027–1032. [Google Scholar] [CrossRef]
  20. Singh, S.; Singh, S.; Kumar, P.; Tikkoo, A. Response of crop rotations to sodic waters and amendments in loamy sands of southern Haryana. Ann. Arid Zone 2008, 47, 111–116. [Google Scholar]
  21. Singh, Y.P.; Arora, S.; Mishra, V.K.; Dixit, H.; Gupta, R.K. Composting of municipal solid waste and farm wastes for its use as amendment in sodic soil. J. Soil Water Conserv. 2017, 16, 172–177. [Google Scholar] [CrossRef]
  22. Negim, O. Effect of addition pressmud and gypsum by product to reclamation of highly calcareous saline sodic soil. AASCIT J. Environ. 2015, 1, 76–84. [Google Scholar]
  23. Gupta, N.; Tripathi, S.; Balomajumdar, C. Characterization of pressmud: A sugar industry waste. Fuel 2011, 90, 389–394. [Google Scholar] [CrossRef]
  24. Anonymous. 20th Livestock Census–2019, All India Report. Department of Animal Husbandry and Dairying, Ministry of Fisheries, Animal Husbandry and Dairying, Government of India. p. 16. Available online: https://dahd.nic.in/sites/default/filess/Key%20Results%2BAnnexure%2018.10.2019.pdf (accessed on 10 June 2021).
  25. Anonymous. IGFRI, Vision. 2050. Indian Grassland and Fodder Research Institute Jhansi (UP). Available online: https://www.igfri.res.in/cms/Publication/Miscellaneous/IGFRI,%20Jhansi%20(Vision%202050).pdf (accessed on 10 June 2021).
  26. Singh, R. Availability and Utilization Pattern of Green Fodder in Punjab. Master’s Thesis, Department of Agricultural Economics, Punjab Agricultural University, Ludhiana, India, 2016. [Google Scholar]
  27. Hazra, K.K.; Venkatesh, M.S.; Ghosh, P.K.; Ganeshamurthy, A.N.; Kumar, N.; Nadarajan, N.; Singh, A.B. Long–term effect of pulse crops inclusion on soil–plant nutrient dynamics in puddled rice (Oryza sativa L.)–wheat (Triticum aestivum L.) cropping system on an Inceptisol of Indo-Gangetic plain zone of India. Nutr. Cycl. Agroecosyst. 2014, 100, 95–110. [Google Scholar] [CrossRef]
  28. Bhatt, R.; Kukal, S.S. Soil moisture dynamics during intervening period in rice-wheat sequence as affected by different tillage methods at Ludhiana, Punjab, India. Soil Environ. 2015, 34, 82–88. [Google Scholar]
  29. Bhatt, R.; Kukal, S.S. Delineating soil moisture dynamics as affected by tillage in wheat, Rice and establishment methods of rice during intervening period. J. Appl. Nat. Sci. 2015, 7, 364–368. [Google Scholar] [CrossRef]
  30. Bhatt, R.; Kukal, S.S. Soil temperature, evaporation and water tension dynamics at upper vadose zone during intervening period. Trends Biosci. 2015, 8, 795–800. [Google Scholar]
  31. Bhatt, R.; Kukal, S.S.; Busari, M.A.; Arora, S.; Yadav, M. Sustainability issues on rice-wheat cropping system. Int. Soil Water Conserv. Res. 2016, 4, 64–74. [Google Scholar] [CrossRef]
  32. CSSRI. Reclaimation and Management of salt Affected Soils; Central Soil Salinity Research Institute: Karnal, India, 2004; p. 160.
  33. Cheng, K.L.; Bray, R.H. Determination of calcium and magnesium in soil and plant material. Soil Sci. 1951, 72, 449. [Google Scholar] [CrossRef]
  34. Weatherley, P. Studies in the water relations of the cotton plant. New Phytol. 1950, 491, 81–97. [Google Scholar] [CrossRef]
  35. Dionisio-Sese, M.L.; Tobita, S. Antioxidant responses of rice seedlings to salinity stress. Plant Sci. 1998, 1351, 1–9. [Google Scholar] [CrossRef]
  36. Hiscox, J.D.; Israelstam, G.F. A method for the extraction of chlorophyll from leaf tissue without maceration. Can. J. Bot. 1979, 57, 1332–1334. [Google Scholar] [CrossRef]
  37. Yemm, E.W.; Willis, A.J. The estimation of carbohydrates in plant extracts by anthrone. Biochem. J. 1954, 57, 508–514. [Google Scholar] [CrossRef]
  38. Bradford, M.M. A rapid and sensitive method for the quantitation of microgram quantities of protein utilizing the principle of protein–dye binding. Anal. Biochem. 1976, 721, 248–254. [Google Scholar] [CrossRef]
  39. Bates, L.S.; Waldren, R.P.; Teare, I.D. Rapid determination of free proline for water–stress studies. Plant Soil 1973, 391, 205–207. [Google Scholar] [CrossRef]
  40. AOAC. Official Methods of Analysis, 18th ed.; Association of Official Analytical Chemists: Arlington, VA, USA, 2005. [Google Scholar]
  41. Van Soest, P.J.; Robertson, J.B.; Lewis, B.A. Methods for dietary fiber, neutral detergent fiber, and non–starch polysaccharides in relation to animal nutrition. J. Dairy Sci. 1991, 74, 3583–3597. [Google Scholar] [CrossRef] [PubMed]
  42. Horrocks, R.D.; Vallentine, J.F. Harvested Forages, 1st ed.; Academic Press: London, UK, 1999; p. 426. [Google Scholar]
  43. Lithourgidis, A.S.; Vasilakoglou, I.B.; Dhima, K.V.; Dordas, C.A.; Yiakoulaki, M.D. Forage yield and quality of common vetch mixtures with oat and triticale in two seeding ratios. Field Crops Res. 2006, 99, 106–113. [Google Scholar] [CrossRef]
  44. Jackson, M.L. Soil Chemical Analysis; Prentice Hall of India Pvt. Ltd.: New Delhi, India, 1967; p. 498. [Google Scholar]
  45. Richards, L.A. Diagnosis and Improvement of Saline and Alkaline Soils; Handbook No. 60; US Department of Agriculture: Washington, DC, USA, 1968.
  46. Jackson, M.L. Soil Chemical Analysis; Prentice Hall India: New Delhi, India, 1973; p. 498. [Google Scholar]
  47. Hanlon, E.A. Elemental determination by atomic absorption spectrophotometry. In Handbook of Reference Methods for Plant Analysis; Kalra, Y.P., Ed.; CRC Press: Boca Raton, FL, USA, 1998; pp. 157–164. [Google Scholar]
  48. Soni, P.G.; Yadav, R.K.; Kumar, A.; Kumar, R.; Datt, C.; Paul, K.; Kumar, G. Sorghum fodder production and its nutrient composition under different residual sodium carbonate levels in irrigation water. Indian J. Anim. Nutr. 2016, 33, 345–349. [Google Scholar] [CrossRef]
  49. Soni, P.G.; Yadav, R.K.; Kumar, A.; Kumar, R.; Yadav, T.; Paul, K.; Joshi, D. Effect of different levels of RSC water and their neutralization with gypsum/H2SO4 on quality parameters of fodder sorghum. In Abstracts, XVI Biennial Animal Nutrition Conference: Innovative Approaches for Animal Feeding and Nutritional Research, Animal Nutrition Society of India, ICAR–National Dairy Research Institute, Karnal, India, 6–8 February 2016; Animal Nutrition Society of India: Karnal, India, 2016; p. 184. [Google Scholar]
  50. Saqib, A.I.; Ahmed, K.; Qadir, G.; Nawaz, M.Q.; Rizwan, M.; Zaka, M.A.; Warraich, I.A. Comparison the efficient reclamation of different inorganic materials with organic amendments to rice-wheat crop sustainable production in salt–affected soils. Cercet. Agron. Mold. 2017, 50, 19–29. [Google Scholar] [CrossRef]
  51. Rao, V.; Lakshmi, G.V.; Latha, M. High RSC irrigation water effects on growth, yield attributes and yield of rice in coastal Andhra Pradesh. Int. J. Res. Chem. Environ. 2014, 4, 10–14. [Google Scholar]
  52. Singh, Y.P.; Singh, R.; Sharma, D.K.; Mishra, V.K.; Arora, S. Optimizing gypsum levels for amelioration of sodic soils to enhance grain yield and quality of rice (Oryza sativa L.). J. Indian Soc. Soil Sci. 2016, 64, 33–40. [Google Scholar] [CrossRef]
  53. Choudhary, O.P.; Josan, A.S.; Bajwa, M.S.; Kapur, M.L. Effect of sustained sodic and saline–sodic irrigations and application of gypsum and farmyard manure on yield and quality of sugarcane under semi–arid conditions. Field Crops Res. 2004, 87, 103–116. [Google Scholar] [CrossRef]
  54. Choudhary, O.P.; Ghuman, B.S.; Singh, B.; Thuy, N.; Buresh, R.J. Effects of long–term use of sodic water irrigation, amendments and crop residues on soil properties and crop yields in rice-wheat cropping system in a calcareous soil. Field Crops Res. 2011, 121, 363–372. [Google Scholar] [CrossRef]
  55. Choudhary, O.P.; Grattan, S.R.; Minhas, P.S. Sustainable crop production using saline and sodic irrigation waters. In Alternative Farming Systems, Biotechnology, Drought Stress and Ecological Fertilisation; Lichtfouse, E., Ed.; Sustainable Agriculture Reviews 6; Springer Science + Business Media: Berlin/Heidelberg, Germany, 2011; pp. 293–318. [Google Scholar] [CrossRef]
  56. Minhas, P.S.; Bali, A.; Bhardwaj, A.K.; Singh, A.; Yadav, R.K. Structural stability and hydraulic characteristics of soils irrigated for two decades with waters having residual alkalinity and its neutralization with gypsum and sulfuric acid. Agric. Water Manag. 2021, 244, 106609. [Google Scholar] [CrossRef]
  57. Munns, R.; James, R.A.; Läuchli, A. Approaches to increasing the salt tolerance of wheat and other cereals. J. Exp. Bot. 2006, 57, 1025–1043. [Google Scholar] [CrossRef] [PubMed]
  58. Ashraf, M.; Shahzad, S.M.; Akhtar, N.; Imtiaz, M.; Ali, A. Salinization/sodification of soil and physiological dynamics of sunflower irrigated with saline–sodic water amending by potassium and farm yard manure. J. Water Reuse Desal. 2017, 7, 476–487. [Google Scholar] [CrossRef]
  59. Prapagar, K.; Indraratne, S.P.; Premanandharajah, P. Effect of soil amendments on reclamation of saline–sodic soil. Trop. Agric. Res. 2012, 23, 168–176. [Google Scholar] [CrossRef]
  60. Kumar, A.; Mann, A.; Lata, C.; Kumar, N.; Sharma, P.C. Salinity induced physiological and molecular responses of halophytes. In Research Developments in Saline Agriculture; Dagar, J.C., Ed.; Springer Nature: Singapore, 2019; pp. 331–356. [Google Scholar] [CrossRef]
  61. Soni, P.G.; Yadav, R.K.; Kumar, A.; Kumar, R.; Gajender; Yadav, T.; Sharma, A.; Kushwaha, M. Effect of water quality regimes, irrigation schedules, RSC levels and neutralizer on physiological and biochemical behaviour of fodder sorghum (Sorghum bicolor). Indian J. Agric. Sci. 2020, 90, 1702–1707. [Google Scholar] [CrossRef]
  62. Shah, S.A.; Iqbal, F.; Haq, Z.U. Effect of different amendments on crop production under poor quality tube well water. Sarhad J. Agric. 2007, 23, 87–94. [Google Scholar]
  63. Dai, L.Y.; Zhang, L.J.; Ruan, Y.Y.; Fan, J.J.; Hu, K. Effects of saline–sodic stress on the blade structure and resistant indexes in sweet sorghum (Sorghum bicolor L. Moench). J. Agro Environ. Sci. 2012, 31, 468–475. [Google Scholar]
  64. Soni, P.G.; Yadav, R.K.; Yadav, G.; Yadav, T. Utilization of high residual sodium carbonate water neutralized with chemical amendments for fodder sorghum (Sorghum bicolor) production. Indian J. Agron. 2017, 62, 382–385. [Google Scholar]
Figure 1. Interactive effect of neutralization strategies and RSC levels on green fodder yield (t ha−1) of sorghum. Vertical bars labelled with various small letters vary substantially (p ≤ 0.05) using the least significant difference test for mean separation; capped lines represent the standard error of the mean.
Agronomy 13 01128 g001
Figure 2. Relationship among green fodder yield (GFY), physiological and biochemical attributes of sorghum crop at 60 DAS; [boxed diagonal shows significant (p ≤ 0.05) association; red and blue colour indicate negative and positive correlations, respectively]. RWC: relative water content; MII: membrane injury index; TCC: total chlorophyll content; TSC: total soluble carbohydrate; TSP: total soluble protein content; Fv/Fm: chlorophyll fluorescence; gS: stomatal conductance; E: transpiration rate; Y (II): photon quantum yield; Pn: photosynthetic rate; K/Na: potassium to sodium ratio.
Agronomy 13 01128 g002
Figure 3. Relationship among green fodder yield (GFY); dry matter yield (DMY) and fodder quality traits [boxed diagonal shows significant (p ≤ 0.05) association; red and blue colour indicate negative and positive correlations, respectively]. CP: crude protein; EE: ether extract; NDF: neutral detergent fibre; ADF: acid detergent fibre; ADL: acid detergent lignin; NDICP: neutral detergent insoluble crude protein; ADICP: acid detergent insoluble crude protein; HCN: hydrocyanic acid/prussic acid.
Agronomy 13 01128 g003
Table 1. Productivity and profitability of rice-wheat system as influenced by study years, RSC levels, neutralization strategies and varietal sequences with/without sorghum inclusion.
TreatmentsProductivity (q ha−1)Profitability of RW System With/Without SorghumSPE
(kg ha−1
day−1)
SEE
(INR ha−1 day−1)
WEY-RGWEY-RSWYWEY-WSWEY-RWAdditional WEY-SGFGR-RWNR-RWA-GR-SA-NR-SBCR-System
(INR × 103 ha−1)
Study years
2017–201858.39 B3.41 B39.5316.79 B120.3322.21 B215.09 B147.65 B39.69 B15.26 B2.3839.05402.33
2018–201967.28 A3.53 A39.6917.40 A125.9825.03 A231.81 A161.78 A46.06 A20.79 A2.4741.37451.41
SEd±0.760.030.820.222.010.493.623.621.011.010.040.6311.44
CD (p = 0.05)1.870.08NS0.54NS1.2015.5915.594.364.36NS2.7349.22
RSC levels
RSC-166.53 A3.59 A42.30 A17.94 A130.51 A25.83 A236.80 A168.06 A46.89 A22.04 A2.58 A42.83 A474.44 A
RSC-259.13 B3.35 B36.92 B16.25 B115.80 B21.41 B210.10 B141.36 B38.86 B14.01 B2.26 B37.59 B379.29 B
SEd±0.760.030.820.222.010.493.623.621.011.010.040.6311.44
CD (p = 0.05)1.870.082.020.548.641.2015.5915.594.364.360.162.7349.22
Neutralization strategies
N052.61 D3.25 C33.14 C14.24 C103.37 D21.20 C187.53 D130.60 C38.49 C13.64 C2.36 C34.13 D357.19 C
N163.38 C3.48 B40.61 B17.64 B125.25 C23.93 B227.27 C146.13 B43.44 B18.59 B2.12 D40.87 C392.48 B
N265.92 B3.54 AB41.64 B17.84 B129.08 B24.68 A234.20 B170.01 A44.81 A19.96 A2.69 A42.13 B480.86 A
N369.42 A3.62 A43.06 A18.66 A134.91 A24.67 A244.78 A172.12 A44.77 A19.92 A2.51 B43.72 A476.93 A
SEd±1.030.040.710.251.160.302.102.100.480.480.020.325.86
CD (p = 0.05)2.060.091.420.512.530.614.584.581.041.040.040.7112.78
Varietal effect
CSR 30 basmati-KRL 210-Sugargraze64.77 A3.32 B41.85 A16.21 B126.27 A23.67229.11 A160.95 A42.9718.122.49 A41.08 A444.20 A
PB 1121-HD 2967- Sugargraze60.90 B3.62 A37.37 B17.99 A120.04 B23.57217.78 B148.48 B42.7817.932.36 B39.35 B409.53 B
SEd±0.730.030.500.180.560.211.001.000.390.390.010.173.02
CD (p = 0.05)1.460.061.000.361.18NS2.122.12NSNS0.020.366.41
WEY-RG: Wheat equivalent yield of rice grain; WEY-RS: Wheat equivalent yield of rice straw; WY: Wheat grain yield; WEY-WS: Wheat equivalent yield of wheat straw; WEY-RW: total wheat equivalent yield of rice-wheat rotation; WEY-SGF-Wheat equivalent yield of sorghum green fodder; GR-Gross returns; NR-Net returns; BCR-Benefit: cost ratio; SPE-System production efficiency; SEE-System economic efficiency. CD: Critical difference; SEd: Standard error of difference. Data preceded by various capital letters vary significantly (p ≤ 0.05) using the least significant difference test.
Table 2. Physiological, biochemical and gas exchange attributes of summer fodder sorghum as influenced by study years, RSC levels and neutralization strategies.
TreatmentsPhysiological AttributesBiochemical
Attributes
Gas Exchange Attributes *K/Na
RWC
(%)
MII
(%)
TCC
(μg ml−1 FW)
TSC *
(μg mg−1 DW)
TSP *
(mg g−1 FW)
Proline *
(μg mg−1 FW)
Fv/FmgSEY (II)Pn20
DAS
60
DAS
20
DAS
60
DAS
20
DAS
60
DAS
20
DAS
60
DAS
Study years
201875.2965.78 B12.4118.861.651.34 B11.26 B15.88 B3.200.651.473.200.5521.601.92 B2.13 B
201976.2570.70 A13.3818.331.711.42 A12.25 A17.47 A3.100.661.473.370.5622.592.11 A2.56 A
SEd±1.140.890.420.620.050.010.260.250.030.010.050.090.011.010.040.04
CD (p = 0.05)NS2.18NSNSNS0.030.640.60NSNSNSNSNSNS0.100.11
RSC levels
RSC-179.41 A73.54 A11.08 B16.12 B1.79 A1.47 A10.34 B14.64 B2.71 B0.69 A1.64 A3.71 A0.58 A24.94 A2.34 A2.70 A
RSC-272.13 B62.94 B14.71 A21.06 A1.57 B1.29 B13.17 A18.71 A3.59 A0.62 B1.30 B2.86 B0.53 B19.25 B1.69 B1.98 B
SEd±1.140.890.420.620.050.010.260.250.030.010.050.090.011.010.040.04
CD (p = 0.05)2.802.181.031.520.190.030.640.600.120.020.120.220.022.470.100.11
Neutralization strategies
N066.23 C57.87 D16.30 A23.43 A1.45 C1.24 C15.79 A19.19 A3.73 A0.63 B1.33 B2.83 C0.53 B19.67 B1.05 D1.59 D
N174.55 B68.90 C13.43 B19.54 B1.71 B1.37 B13.36 B17.95 B3.13 B0.66 A1.59 A3.
48 AB
0.56 A23.45 A1.94 C2.20 C
N280.50 A70.96 B10.98 C16.71 C1.77 A1.43 A10.11 C15.83 C2.80 D0.64 B1.41 B3.
12 BC
0.
55 AB
21.33 B2.44 B2.60 B
N381.79 A75.22 A10.88 C14.68 D1.79 A1.47 A7.76 D13.74 D2.94 C0.67 A1.56 A3.71 A0.57 A23.93 A2.63 A2.98 A
SEd±1.071.010.330.480.020.030.530.490.060.010.050.200.010.920.060.07
CD (p = 0.05)2.152.020.670.970.050.071.050.980.130.010.100.410.031.840.120.15
RWC: relative water content; MII: membrane injury index; TCC total chlorophyll content; TSC: total soluble carbohydrate; TSP: total soluble protein content; Fv/Fm: Chlorophyll fluorescence; gS: stomatal conductance; E: transpiration rate; Y (II): photon quantum yield; Pn: photosynthetic rate; K/Na: potassium to sodium ratio. CD: Critical difference; SEd: Standard error of difference. Data preceded by various capital letters vary significantly (p ≤ 0.05) using the least significant difference test for separation of means: * At 60 DAS.
Table 3. Fodder quality traits of summer sorghum as influenced by study years, RSC levels and neutralization strategies.
TreatmentsDM
(%)
DMY
(t ha−1)
CP
(%)
CPY
(q ha−1)
EE (%)EEY
(q ha−1)
Ash (%)Ash yield
(q ha−1)
NDF (%)ADF (%)ADL (%)NDICP (%)ADICP (%)HCN
(mg kg−1)
Study years
201821.73 A5.73 B9.195.30 B1.871.08 B8.084.6266.33 A37.07 A5.453.341.5291.92110.01 A
201920.05 B6.13 A9.235.68 A1.851.14 A8.064.9364.45 B36.36 B5.413.271.5091.94101.28 B
SEd±0.110.140.080.160.010.020.040.130.380.270.130.030.020.042.77
CD (p = 0.05)0.260.35NS0.39NS0.06NSNS0.920.66NSNSNSNS6.78
RSC levels
RSC-120.33 B6.33 A9.73 A6.16 A1.92 A1.21 A7.97 B5.05 A63.88 B35.69 B5.22 B3.21 B1.47 B92.03 A95.58 B
RSC-221.45 A5.52 B8.69 B4.82 B1.81 B1.00 B8.17 A4.50 B66.89 A37.74 A5.65 A3.40 A1.55 A91.83 B115.71 A
SEd±0.110.140.080.160.010.020.040.130.380.270.130.030.010.042.77
CD (p = 0.05)0.260.350.200.390.030.060.090.320.920.660.310.150.070.096.78
Neutralization strategies
N021.88 A5.56 B8.33 D4.67 C1.70 C0.95 C8.43 A4.6868.34 A39.37 A5.74 A3.69 A1.68 A91.57 B127.16 A
N120.86 B6.02 A9.14 C5.52 B1.85 B1.12 B7.91 B4.7665.14 B36.22 B5.51 B3.39 B1.55 B92.09 A110.20 B
N220.39 B6.06 A9.80 A5.95 A1.95 A1.18 A7.98 B4.8264.12 C35.33 C5.29 C2.79 C1.48 B92.02 A96.65 C
N320.43 B6.07 A9.56 B5.82 A1.94 A1.18 A7.96 B4.8363.95 C35.94 B5.19 C3.34 B1.33 C92.04 A88.58 D
SEd±0.330.120.090.130.020.020.060.100.320.200.060.070.030.063.25
CD (p = 0.05)0.650.230.180.260.050.050.12NS0.630.400.130.140.060.126.51
DM: dry matter content; DMY: dry matter yield; CP: crude protein; CPY: crude protein yield, EE: ether extract; EEY: ether extract yield; NDF: neutral detergent fibre; ADF: acid detergent fibre; NDICP: neutral detergent insoluble crude protein; ADICP: acid detergent insoluble crude protein; ADL: acid detergent lignin. CD: critical difference; SEd: standard error of differences. Data preceded by various capital letters vary significantly (p ≤ 0.05) using the least significant difference test for separation of means.
Table 4. Fodder quality parameters and nutrient content of summer sorghum as influenced by study years, RSC levels and neutralization strategies.
TreatmentsNutritive/Energy IndicesNutrient Contents
DMD (%)DMI
(%)
NEl
(mcal kg−1)
RFV (%)TDN (%)N
(%)
P
(%)
Ca
(%)
Mg
(%)
Fe
(mg kg−1)
Mn
(mg kg−1)
Cu
(mg kg−1)
Zn
(mg kg−1)
Study years
201860.02 B1.81 B1.33 B84.36 B53.49 B1.470.220.390.28209.98114.83 B16.50 B47.08 B
201960.58 A1.86 A1.35 A87.62 A54.41 A1.480.220.390.29210.37117.84 A18.06 A49.55 A
SEd±0.210.010.010.470.350.010.000.000.001.730.780.130.38
CD (p = 0.05)0.510.030.021.160.85NSNSNSNSNS1.910.330.92
RSC levels
RSC-161.09 A1.88 A1.36 A89.06 A55.27 A1.56 A0.23 A0.40 A0.29215.10 A119.62 A17.87 A48.76
RSC-259.50 B1.80 B1.31 B82.92 B52.63 B1.39 B0.21 B0.38 B0.28205.25 B113.04 B16.69 B47.87
SEd±0.210.010.010.470.350.010.000.000.001.730.780.130.38
CD (p = 0.05)0.510.030.021.160.850.030.010.01NS4.231.910.33NS
Neutralization strategies
N058.23 C1.76 C1.27 C79.41 C50.52 C1.33 D0.20 C0.36 D0.27 D191.61 D105.96 D16.30 D45.40 D
N160.68 B1.84 B1.35 B86.81 B54.59 B1.46 C0.22 B0.41 A0.28 C206.69 C115.62 C16.77 C47.22 C
N261.37 A1.87 A1.37 A89.11 A55.73 A1.57 A0.23 A0.39 C0.29 B225.22 A122.95 A18.39 A51.42 A
N360.91 B1.88 A1.36 B88.63 A54.96 B1.53 B0.23 A0.40 B0.30 A217.18 B120.79 B17.67 B49.22 B
SEd±0.150.010.010.500.260.010.000.000.001.690.690.150.87
CD (p = 0.05)0.310.020.011.000.510.030.010.000.003.391.390.311.73
DMD: dry matter digestibility; DMI: dry matter intake; NEl: net energy for lactation; RFV: relative feed value; TDN: total digestible nutrient. CD: Critical difference; SEd: standard error of difference. Data preceded by various capital letters vary significantly (p ≤ 0.05) using least significant difference test for separation of means.
Disclaimer/Publisher’s Note: The statements, opinions and data contained in all publications are solely those of the individual author(s) and contributor(s) and not of MDPI and/or the editor(s). MDPI and/or the editor(s) disclaim responsibility for any injury to people or property resulting from any ideas, methods, instructions or products referred to in the content.

