Abstract
A precise knowledge of the grapevine responses to increasing level of water stress is of the utmost relevance for an effective application of deficit irrigation strategies in viticulture. Against this background, a study was conducted on potted grapevines subjected to two ten-day drought cycles to assess their water status by integrating the information derived from different physiological indexes including whole-plant transpiration (measured gravimetrically and with sap flow sensors), leaf gas exchanges and chlorophyll fluorescence. When soil water availability was not limited, vine transpiration rate was determined mainly by environmental factors and ranged between 0.5 and 2 L day−1 m−2 of leaf surface. Transpiration was affected by the soil water availability only when water stress became evident (midday stem water potential < −1 MPa), with vines showing a strong limitation of the stomata functioning (stomatal conductance < 0.05 mol m−2 s−1) and, consequently, low transpiration rates (<0.5 L m−2 d−1). Transpiration rates measured with the sap flow sensors were correlated with those measured gravimetrically, showing daily patterns that were highly affected by the intensity of the water stress. Nevertheless, these sensors highly underestimated actual transpiration rates, limiting their reliability for vineyard irrigation management. At the end of the second drought cycle, vines showed very limited responses to daily changes in environmental conditions (same photosynthetic rate and stomatal conductance at morning, midday and afternoon), likely reflecting a carryover stress effect from the first drought cycle and an incomplete physiological recovery before the beginning of the second. Evidence of the severe water stress reached by vines was also given by the high value of the quantum yield of nonregulated energy dissipation (Y(NO) higher than 0.4) found at the end of the first drought cycle. Taken together, the obtained results integrate the current knowledge on water stress development in grapevine, also highlighting the relevance of specific physiological indexes that could be used effectively for the correct management of deficit strategies in viticulture.
1. Introduction
Global average temperature is expected to increase significantly in the near future because of climate change, leading to an overall rise in the evapotranspiration by the soil–plant systems and, consequently, to a higher water need in crops [1,2]. Against this background, agricultural systems must enhance their capacity to use water resources more efficiently while maintaining high yields and an adequate quality of the products [3]. Water saving strategies based on the common principle of providing irrigation volumes smaller than the amount of water lost by evapotranspiration (i.e., deficit irrigation) have been tested in numerous cropping systems. The effects of deficit irrigation on plant physiology and yield performances can be different according to factors such as the genotype, the intensity and the timing of the water stress, the soil water content and the environmental conditions during water stress [4]. Several studies have investigated the possible implementation of deficit irrigation strategies in viticulture, highlighting the grapevine’s capability to withstand periods of water limitation depending on the phenological stage and the intensity and the duration of the applied stress [5,6,7,8]. The successful application of any deficit irrigation strategy in grapevine cultivation is subordinate to the availability of precise and reliable indicators of vine water status which are largely dependent on plant transpiration [9]. The plant transpiration is a highly regulated process that involves many factors including, among others, the evaporative demand of the atmosphere, the water available in the soil and the regulation exerted by the plant through the control of the stomata opening [10]. Vapor pressure deficit (VPD) can be used to estimate the evaporative demand of the atmosphere and can be easily calculated with simultaneous measurements of air temperature and relative humidity [11]. Indications about soil water status can be obtained with sensors able to measure the volumetric water content and the matric potential of the soil; however, the use of these sensors may have severe limitations given by (a) their limited volume of influence that is often insufficient to cope with soil heterogeneity, (b) the sensor-to-sensor variability in the readings (which requires single sensor calibration) and (c) possible installation errors.
For the appropriate management of the deficit irrigation strategies, the information gathered from the environment (soil and atmosphere) is generally combined with direct measurements of plant water status. Under water scarcity, grapevines restrict transpiration by reducing stomatal conductance [12]. Stomatal functioning is a finely regulated mechanism that depends on the plant–water relations and on the synthesis and transportation of abscisic acid (ABA) from roots to leaves [13]. Stomatal conductance (gs) can be used as an indicator of the intensity of water stress in plants; for grapevine, Cifre et al. [9] identified ranges of gs correspond to mild (0.40 ÷ 0.15 mol H2O m−2 s−1), moderate (0.15 ÷ 0.05 mol H2O m−2 s−1) and severe (<0.05 mol H2O m−2 s−1) levels of water stress. Under mild to moderate water stress, photosynthesis is mainly limited by stomatal closure, whereas under severe water stress the non-stomatal (metabolic) photosynthetic limitation becomes predominant [14,15]. As a consequence, upon rewatering, the photosynthetic recovery is relatively fast after a mild–moderate water stress, whereas in the case of severe stress the metabolic impairment becomes permanent and grapevine plants cannot recover their photosynthetic potential [16]. The gs responds to changes in the water potential (Ψ) of leaves, even though the determination of water stress thresholds based on Ψ is challenging, as it is strongly affected by different factors including the genotype (i.e., differences between isohydric and anisohydric grapevine cultivars [12]), the environmental conditions at the time of measurement (i.e., VPD and soil water status) and the type of measurement (i.e., pre-dawn Ψ, midday leaf Ψ, midday stem Ψ) [17]. Studies conducted in open-field and in-pot conditions showed that pre-dawn Ψ values lower than −0.2 MPa induced a significant gs decrease in grapevines [9,18] and that a reduction in the photosynthesis started to be evident when midday stem Ψ (Ψstem) was lower than −0.6 ÷ −0.8 MPa [19,20]. Grapevine drought stress can also be detected with chlorophyll fluorescence. At the leaf scale, measurements are generally taken with handheld fluorometers which are able to provide a large number of parameters often used in the research on plant stress physiology [21,22,23,24,25]. The correlation between some of these parameters (i.e., Fs/Fo, Fv/Fm, ETR, qP, qN) with standard indicators of plant water status (i.e., gs, Ψ) have been described in different studies where increasing levels of water stress in grapevine have been tested [9,26]. Studies considering different methodological approaches (i.e., using imaging systems, selected PAR intensities and different fluorescence indexes) are nevertheless still limited, leaving room for further advancement in the knowledge of the potential use of fluorescence parameters as indicators of water stress in grapevine.
All the described water stress indicators are based on discontinuous measurements and can therefore provide indications about the plant water status only in selected time points during the season. Other technologies, such as the sap flow sensors, are also able to provide continuous and direct information about the plant water uptake and transpiration losses [27,28]. Sap flow rates are affected by crop characteristics (i.e., the genotype, the canopy development, the availability of irrigation water), by the soil moisture and by changes in the environmental conditions over time [29,30,31]. The practical interpretation of these sensors’ output is relatively straightforward, even though some studies reported significant differences in the estimation of the actual transpiration rates, probably because of technical flaws related to the morphological heterogeneity of the sapwood [28,32,33].
This study aimed to (1) assess grapevine response to water deficit by integrating a precise gravimetric measurement of vine transpiration with leaf physiological indexes measured in different moments of the day; (2) evaluate the reliability of sap flow measurements to estimate vine transpiration under different levels of water stress; (3) evaluate the efficacy of different chlorophyll fluorescence indexes for the detection of water stress in grapevines.
2. Materials and Methods
2.1. Plant Material and Experimental Setup
The experiment was carried out during July–August 2020 in a paved area adjacent to the Free University of Bozen-Bolzano greenhouse in Laimburg (Alto Adige, Italy 46.3827° N, 11.2877° E). The area was covered by a 7 m high glass roof shelter with no lateral walls. Three thirteen-year-old grapevines (cv. Cabernet Cortis grafted on SO4) were uprooted in March 2020 from a nearby vineyard and transferred into 50 L plastic pots (44 cm height, 40 cm top diameter and 36 cm base diameter). The trunk diameter was around 3.2 cm on average (measures taken at around 25 cm above the graft union) and each vine was pruned, leaving a single cane with 5–6 nodes. The pots were filled with a sandy loam soil (73% sand, 22% silt and 5.1% clay) and the upper surface of the pots was covered with a plastic foil to prevent water loss by direct soil evaporation. The lower part of the plastic pots hosted several holes to drain excessive water from the pot, preventing any lack of oxygen at the root level.
The trial consisted of two consecutive drought cycles (cycle 1: C1; cycle 2: C2) of 10 days each. On 21 July (day of year, DOY, 203), vines were manually irrigated until soil saturation. The following day (DOY 204), after gravimetric water had drained from the soil, was considered as the first day after irrigation (DAI 1) of the first drought cycle which lasted until the midday Ψstem reached values of around −1.5 MPa (severe water deficit conditions) on 31 July (DOY 213; DAI 10). Vines were then re-watered, bringing back soil water content to saturation level. During the following five days, vines were irrigated daily and kept constantly around soil water holding capacity. On 5 August (DOY 218), the second drought cycle started, which ended 10 days later (DOY 227) when vines were re-watered.
Air temperature (°C), relative air humidity (%), precipitation (mm), wind speed (m s−1) and incoming solar radiation (R, W m−2) were measured hourly at a nearby weather station (located at less than 500 m from the area of the experiment). Daily mean VPD was calculated based on air temperature and relative humidity following [34]. The solar radiation intensity under the transparent shelter, repeatedly measured between 1 and 3 pm of a sunny summer day, was reduced by 27% as compared to the external radiation.
2.2. Vine Transpiration Measurements
Plant transpiration (T) was assessed by two methods. The first consisted of measuring total vine transpiration by a continuous (data taken every 15 min) gravimetric method (Tgrav). The weight loss of each pot was measured by hanging them on a suspended weighting lysimeter structure equipped with compression load cells (CTL, Laumas Elettronica, Parma, Italy) (Figure S1). Load cells (LC) were previously calibrated using standard weights in the range from 0 to 90 kg, and were able to detect weight changes of ± 0.02 kg [20]. Individual daily vine transpiration was normalized by leaf area and reported as L H2O m−2 d−1. Total vine leaf area (m2 vine−1) was determined at the end of the experiment collecting separately all the leaves of each vine and measuring their leaf blade area with a leaf area meter (LI-3000C and LI-3050C Transparent Belt Conveyer Accessory, LI-COR Biosciences, Lincoln, NE, United states). Mean vine leaf area was 1.3 m2 vine−1 (±0.2 st. error).
The second method used to estimate vine transpiration (Tsap) consisted in the use of sap flow sensors (SFM1 Sap Flow Meter, ICT International, Armidale, NSW, Australia) working after the principle of the heat ratio method (HRM) that measures the ratio of increase in temperature following the release of a heat pulse of short duration (2.68 s, 20 Joule) [35]. The design of SFM1 HRM consists of three 35 mm long needle set: one heater (central) and two measuring probes (upstream and downstream) each with 2 pairs of thermistors placed at 12.5 and 27.5 mm from the base of the sensors. These sets were carefully installed at a height of approximately 32 ± 4 cm above the grafting point, positioned in a way to keep the needles as aligned as possible with the trunk, and then wrapped in aluminum foil to minimize the potential environmental effects. The needles were entirely inserted into the trunks so that, considering an average thickness of the bark of 1 mm, the measuring points were at 11.5 and 26.5 mm from the cambium. The conversion of sap velocity into Tsap was performed following the indications of Burgess et al. [35], where the total sap flow value (Tsap, cm3 h−1) was obtained as the sum of the two corrected sap velocities (cm h−1) measured every 15 min, multiplied by the fraction of trunk cross-sectional area (cm2) of pertinence of each thermistor. Considering the depth of placement of each thermistor and the average diameter of the vines, the second couple of thermistors was closer to the cambium and was considered as the outer measuring point. The area of relevance of the inner sensors (Ain) was calculated considering as the radius the distance of the inner sensor from the center of the trunk plus half the difference of the distance between the inner and outer sensors from the center of the trunk. The area of the annulus of relevance of the outer sensors (Aout) was obtained as the difference between Ain and the total conductive area (Atot). With respect to the average Atot (6.76 ± 2.75 cm2, mean ± st.dev.), Ain ranged from 18 to 28%, Aout from 72 to 82%.
Relative values of Tsap were then calculated as the percentage of the maximum hourly value of sap flow rate reached in the first day of each of the two drought cycles in order to compare the daily pattern of transpiration at different days during both drought cycles.
2.3. Vine Water Potential
The midday Ψstem (MPa) was measured five times (every second day) during each drought cycle. In order to minimize the impact of the repeated leaf destructive samplings on total vine leaf area, on each date measurements were taken only on one fully expanded leaf per vine. Leaves were enclosed in transparent plastic bags, covered with aluminum foil at noon, detached after approximately one hour, and immediately inserted in a Scholander pressure bomb (Plant Water Status Console Series 3000, ICT International, Armidale, NSW, Australia) for the reading. In addition, pre-dawn Ψ was also determined on DAI 3–6 and DAI 10 for drought cycle 1 and 2, respectively. Measurements were taken at predawn (4:00 am) on one fully expanded leaf per vine. Leaves were detached and immediately inserted in the pressure bomb, without any leaf covering.
2.4. Leaf Gas Exchanges
Photosynthetic rate (A, μmol CO2 m−2 s−1), transpiration rate (E, mmol H2O m−2 s−1) and stomatal conductance (gs, mol H2O m−2 s−1) were measured with a portable infrared gas analyzer (LC-pro ADC, Hoddesdon Bioscientific, Ltd., Herts, United Kingdom). Measurements were carried out at the beginning and at the end of each of the two drought cycles (C1 and C2). This occurred on DOY 204 and 210 for C1 and on DOY 218 and 225 for C2. Readings were taken at three different moments of the day (morning: 8:00–9:00 am; midday: 12:00–1:00 pm; afternoon: 5:00–6:00 pm) always choosing three fully expanded leaves per vine that were sun-oriented and located in the intermediate section of the shoots. Measurements were taken under saturating light conditions (PPFD of 1800 μmol photons m−2 s−1 provided by a LED array unit) and ambient CO2 levels (382–438 ppm).
2.5. Chlorophyll Fluorescence
Chlorophyll fluorescence parameters were measured in two days for each cycle, specifically at DAI 2 and 10 of C1 and at DAI 1 and 10 of C2. Readings were taken in the afternoon (3:00–4:00 pm) using a portable chlorophyll fluorometer (imaging PAM-2500, Heinz Walz GmbH, Effeltrich, BY, Germany). For each measurement, one mature and healthy leaf per vine was selected and prepared for the assessment. Readings were taken at a PAR intensity of 298 µmol m−2 s−1 PPFD. The parameters studied were as follows: maximum PS II quantum yield, Fv/Fm; effective PS II quantum yield, Y(II); quantum yield of regulated energy dissipation, Y(NPQ); quantum yield of nonregulated energy dissipation, Y(NO). These parameters were calculated using the following equations:
where Fm is the maximum fluorescence yield determined after dark adaptation and Fo is the dark fluorescence yield.
where Fm′ is the maximum fluorescence yield of illuminated samples and F is the current fluorescence yield.
where NPQ is the non-photochemical quenching (NPQ = (Fm − Fm′)/Fm′)) and qL is the coefficient of photochemical quenching, a measure of the fraction of open PS II reaction centers (qL = (Fm′ − F)/(Fm′ − Fo′) × Fo′/F where Fo′ = Fo/(Fv/Fm + Fo/Fm′)).
Fv/Fm = (Fm − Fo)/Fm
Y(II) = (Fm′ − F)/Fm′
Y(NPQ) = 1 − Y(II) − 1/(NPQ + 1 + qL(Fm/Fo − 1))
Y(NO) = 1/(NPQ + 1 + qL(Fm/Fo − 1))
2.6. Data Treatment and Statistical Analysis
Statistical analyses were performed using R software (v.3.6.2). Differences among days of Tgrav and midday Ψstem were tested by one-way repeated measures analysis of variance (ANOVA). For each drought cycle, differences among the days and within moments of the same day of leaf gas exchanges (A, E, gs) were tested by one-way ANOVA. Similarly, the analysis of the fluorescence chlorophyll parameters was performed by the one-way ANOVA comparing the two days of measurements within each drought cycle. Preliminary ANOVA assumptions were run beforehand to check any violation of the homoscedasticity (Levene’s test (p ≤ 0.05) with car package v.3.0-10) and normality (Shapiro–Wilk’s (p ≤ 0.05) with stats package v.3.6.2). Mean separation was performed with the Tukey HSD test (p < 0.05). ANOVA and Tukey HSD tests were performed with the stats package v.3.6.2 (R software). Results were reported as means ± standard errors.
3. Results
3.1. Weather Conditions
The experimental period was characterized mostly by cloudless days. There were only three days of overcast conditions (DOY 206, 216 and 227), when the VPD, the R and the temperature sharply decreased (Figure 1A–C and Figure S2). During the considered period, the mean daily VPD, R and temperature were 1.1 KPa and 250 W m−2, and 24 °C, respectively. Air VPD and the temperature were higher at midday and in the afternoon as compared with the morning (Figure 1A,B). R intensity at midday reached around 900 W m−2 in sunny days, two and four times higher than the corresponding values in the morning and in the afternoon, respectively (Figure 1C).
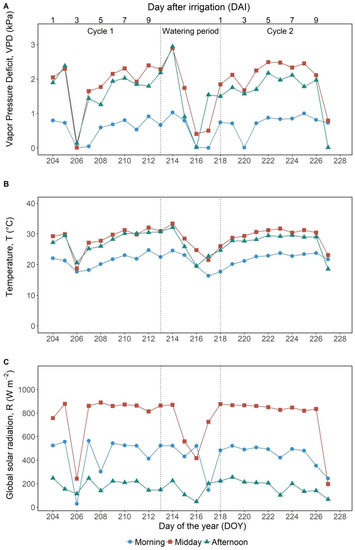
Figure 1.
Daily values of (A) vapor pressure deficit (VPD, kPa); (B) temperature (T, °C); and (C) global solar radiation (R, W m−2) measured during the trial period by averaging hourly values between 8:00 and 10:00 am (morning ●, blue line), between 12:00 and 2:00 pm (midday ■, red line) and between 5:00 and 7:00 pm (afternoon ▲, green line).
3.2. Vine Water Status and Transpiration
The variation in midday Ψstem was quite similar in both drought cycles with an initial value, at DAI 1, of around −0.50 MPa (Figure 2). Similar midday Ψstem values were measured in the first 5–6 days of both drought cycles, then this parameter started to decrease reaching −0.7 ÷ −1.0 MPa at DAI 7 and DAI 6 for C1 and C2, respectively. At the end of the drought cycles (DAI 10), midday Ψstem was −1.35 MPa and −1.55 MPa (for C1 and C2, respectively), being significantly lower than midday Ψstem at DAI 1. These findings were consistent with the increasing water limitation as shown by measures of pre-dawn Ψ (Figure 2), a proxy of soil water availability for the plant. Before the onset of vine water stress (DAI 1 to 5), the value of pre-dawn Ψ was around −0.25 ± 0.03 MPa, whereas at the end of the drought periods (at DAI 10) it dropped to around −1.1 ± 0.1 MPa.
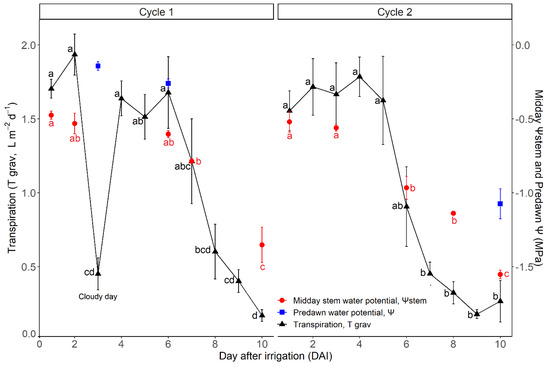
Figure 2.
Midday Ψstem (MPa), predawn Ψ (MPa) and daily transpiration measured with the gravimetric method (Tgrav, L m−2 d−1) during the trial. Each point represents the mean value of three vines. Bars are the standard error of the means. Separately for the three parameters and for the two drought cycles, different letters indicate significant differences between measuring dates (Tukey HSD test).
Transpiration was negatively affected by water deficiency in both cycles (Figure 2). The mean daily transpiration rates (Tgrav) were comparable at the beginning of both drought cycles, with values ranging between 1.70 and 1.55 L m−2 d−1 in C1 and C2, respectively. Tgrav was rather stable until DAI 6 of both drought cycles, with the exception of a cloudy day (DAI 3, C1) characterized by a sharp decline caused by lower VPD and R values (Figure 1A,C). A clear reduction in Tgrav started when midday Ψstem reached values around −0.7 ÷ −0.8 MPa in both drought cycles (Figure 2). At the end of the stress periods (DAI 10), Tgrav was around 0.18 L m−2 d−1, significantly lower than values measured between DAI 1 and 6 of both drought cycles.
Tsap and Tgrav values were highly correlated (R2 = 0.94; Figure 3). Nevertheless, measurements with sap flow underestimated actual transpiration rates by approximately 10-fold, as shown by the slope of the regression line (10.2).
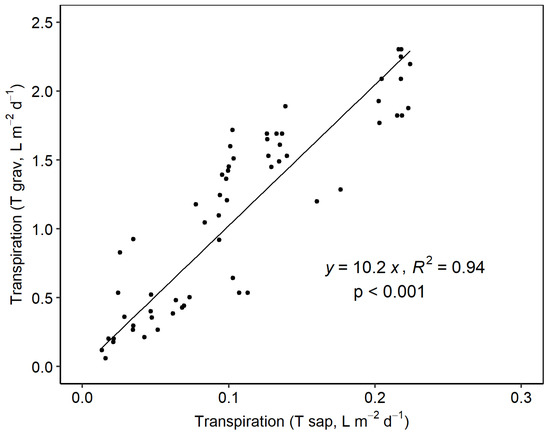
Figure 3.
Linear regression between the daily transpiration values (L m−2 d−1) obtained from the sap flow sensors (Tsap) and the load cells (Tgrav).
The relative sap flow rates showed a clear daily pattern, characterized by a quick increase after dawn (6:00–7:00 am), high and relatively stable values from 8:00 am to approximately 4:00 pm and afterward a sharp decrease until around 8:00 pm, when rates went back to approximately 5% of the daily maximum (Figure 4). The increasing intensity of water stress affected the daily pattern by reducing the maximum relative sap flow rate (DAI 8 and 10 in C1; DAI 7, 8 and 10 in C2) and by clearly hastening the sap flow decrease before noon. Interestingly, the sap flow rate quickly increased immediately after the water supplies were introduced in the afternoon of the last day of both drought cycles (DAI 10), signaling the prompt physiological response of the vines to the sudden increase in soil water availability.
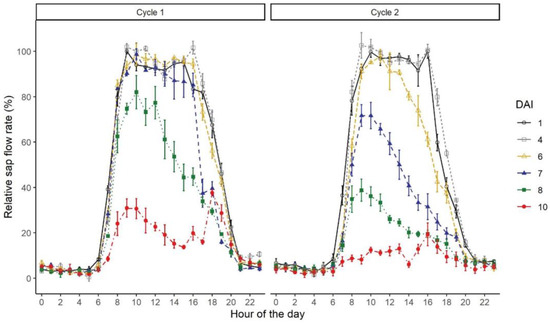
Figure 4.
Daily pattern of relative sap flow rates throughout the experiment. Each colored line represents the time course of one day. Each measurement point represents the mean value of three vines.
3.3. Leaf Gas Exchanges
The intensity of the gas exchange rates measured at leaf level was generally higher in the first drought cycle compared to the second one (Figure 5). As an example, in the morning of DAI 1, leaf A was 17.4 and 10 μmol m−2 s−1 in cycle 1 and 2, respectively (Figure 5A,B). In cycle 1, A, E and gs were significantly lower in the afternoon (between 5:00 and 6:00 pm) compared to morning or midday values. This evidence was confirmed both at the beginning (DAI 1) and at the end (DAI 7) of the first drought cycle (Figure 5A,C,E). In cycle 2, these parameters (A, E, gs) measured at DAI 8 were significantly lower than at DAI 1, both in the morning and at midday, whereas no significant differences were found between DAIs in the afternoon (Figure 5B,D,F). At DAI 8 of cycle 2, A, E and gs were already very low in the morning (2.5 μmol m−2 s−1, 0.8 mmol m−2 s−1 and 0.01 mol m−2 s−1, respectively) and did not change significantly later during the day (at midday and afternoon, Figure 5B,D,F).
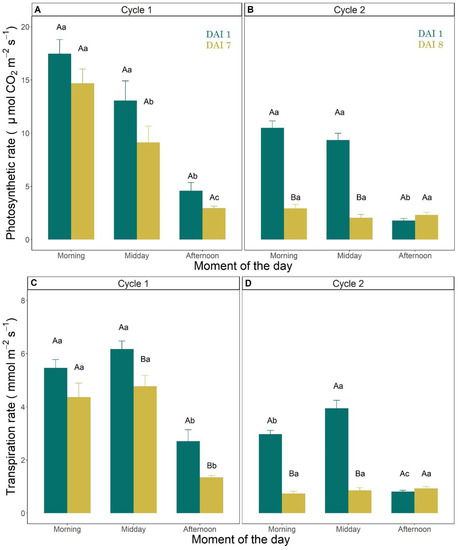
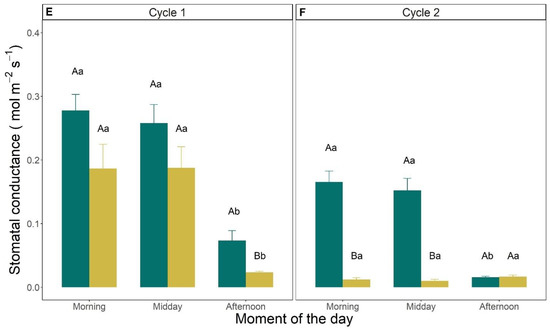
Figure 5.
(A,B) Photosynthetic rate (μmol CO2 m−2 s−1); (C,D) transpiration rate (mmol m−2 s−1); and (E,F) stomatal conductance (mol m−2 s−1) measured in the morning (between 8:00 and 10:00 am), at midday (between 12:00 and 2:00 pm) and in the afternoon (between 5:00 and 7:00 pm) on the first (DAI 1) and last measurement days (DAI 7 in C1 and DAI 8 in C2) of drought cycle 1 (A,C,E) and 2 (B,D,F). Vertical error bars indicate the standard errors of the mean (n = 3). Uppercase letters refer to statistical differences between DAIs in the same moment of the day, whereas lowercase letters refer to significant differences within moments of the same DAI (Tukey HSD test).
3.4. Chlorophyll Fluorescence
Fv/Fm values ranged between 0.5 and 0.6, showing significantly lower values at the end of both drought cycles (at DAI 10) when the level of water stress was higher (Figure 6A). The Y(II) was around 0.2 at the beginning of both drought cycles and did not change significantly with the increasing intensity of water stress, showing values around 0.10 and 0.13 at DAI 10 of cycle 1 and 2, respectively (Figure 6B). The Y(NPQ) was significantly reduced at the end of cycle 1, showing values that at DAI 10 were approximately 40% lower than at the beginning of the drought cycle (Figure 6C), whereas no differences were found in cycle 2, when Y(NPQ) values remained stable in the range between 0.5 ÷ 0.6 of the relative unit. The Y(NO) significantly increased during the first cycle, reaching a value of approximately 0.4 at DAI 10 (Figure 6D). Y(NO) did not change during the second drought cycle when values remained stable around 0.3.
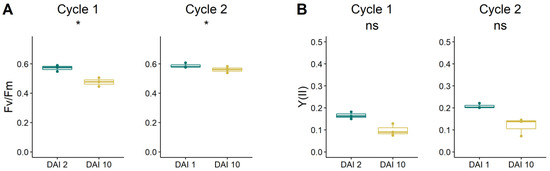
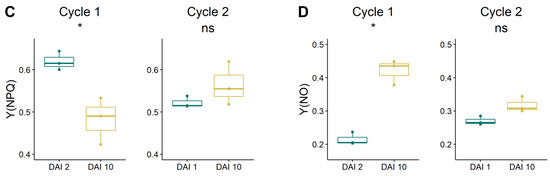
Figure 6.
(A) Maximum quantum efficiency (Fv/Fm); (B) effective PS II quantum efficiency (Y(II); (C) quantum yield of regulated energy dissipation (Y(NPQ); (D) and quantum yield of nonregulated energy dissipation (Y(NO) of grapevine plants at the beginning and at the end of the two drought cycles. Differences in the response of leaf chlorophyll fluorescence parameters were tested by the one-way ANOVA test. Cases when p-value < 0.05 are visually marked by ‘*’.
4. Discussion
One of the aims of this study consisted in the detection of the onset of water stress in grapevine by integrating the information coming from different gravimetric and physiological indicators at a sub-daily time scale.
Under this framework, the gravimetric determination of transpiration allowed a precise and almost continuous quantification of the water lost by vines subjected to an increasing level of drought (Figure 2). During the first days of both drought cycles, transpiration per unit leaf area was mainly driven by the environmental conditions. In warm cloudless days, characterized by a daily average VPD above 1.5 kPa (Figure 1A and Figure S2), transpiration was constantly within the range 1.7 ÷ 1.9 L m−2 d−1. This range is consistent with those measured by [36] on days with clear sky (maximum daily VPD between 3 and 4 kPa) on field-grown vines subjected to a standard regulated deficit irrigation (RDI) strategy (weekly replacement of 60% of ET). The uncoupling between the VPD and the relative transpiration started in the second half of both drought cycles (DAI 6–7) when, despite the high evaporative demand of the period (maximum VPD at midday around 3 kPa, Figure 1A), the relative transpiration dropped to values below 0.5 L m−2 d−1 and reached minimum rates at the end of the drought cycles (0.18 L m−2 d−1) (Figure 2). Transpiration values below 0.1 L m−2 d−1 after periods of irrigation withdrawal were also described by [20] on grapevine (cv. Schiava), even though the authors noted a large variability among the tested vines. The drop in transpiration rates caused by water withholding was paired with a stronger stomatal limitation (Figure 5E,F). The control of the stomata opening is a well-documented mechanism for vines to restrict water losses by transpiration [12,13]. In our experiment, the reduction in stomatal conductance caused by water deficit followed different paths in the two cycles. During the first drought cycle, at DAI 7, when midday Ψstem corresponded to approximately −0.7 MPa, differences in stomatal conductance between DAI 1 and DAI 7 were significant in the afternoon only, whereas there were no differences between gs values in the morning and at midday (Figure 2 and Figure 5E). Differently, at the end of the second drought cycle, the midday Ψstem was lower when compared with the corresponding value measured at the end of the first cycle (around −1.1 Mpa and −0.7 Mpa for DAI 8 and DAI 7 of C2 and C1, respectively). This resulted in stomatal conductance, transpiration and the photosynthetic rates that were already low in the morning, with almost no adaptation to the increase in air temperature and VPD during the rest of the day (Figure 5B,D,F). The differences in the vines’ water status described at the end of the two drought cycles might be explained by the more severe conditions experienced by the vines during the first half of the second drought period (VPD of the first 5 days of C2 was on average 30% higher than in C1, Figure 1A and Figure S2), probably combined with an incomplete physiological recovery before the beginning of the second drought cycle.
Pou et al. [37] showed that the recovery of stomatal conductance took several days (up to two weeks) in vines subjected to similar intensities of water stress (−1.4 ÷ −1.5 midday Ψstem). Consequently, a possible interpretation of the different modification of the gas exchanges during the two drought cycles could be related to the limited duration of the recovery period between cycle 1 and 2 (five days in total with water availability for plants maintained at pot capacity), a time that was probably not sufficient to allow a complete osmotic readjustment in the vines from the stress suffered during the first drought cycle. In relation with this last aspect, Charrier et al. [38] showed that the length of the recovery period for vines increases with the degree of the experienced water stress. Moreover, Tombesi et al. [39] highlighted that vines that were exposed to drought are characterized by an altered stomatal regulation even after they were released from the stressful conditions (after rewatering). This evidence, including that reported in this work (Figure 5), indicates that the relationship between the stomatal conductance and the soil water status might be modified by previous water stress experienced by the vines, questioning the reliability of this index for the monitoring of the plant water status.
Another aim of the study was the evaluation of the reliability of the HRM sensors for the continuous measurement of vine transpiration, as well as their ability to detect early signals of stress under an increasing level of water deficiency. Transpiration values measured with sap flow sensors (Tsap) were well correlated with those measured with load cells (Tgrav) (Figure 3), even though they largely underestimated the absolute values (10-fold lower). Several authors pointed out that sap flow sensors may under- or overestimate the actual transpiration rate because of the misalignment of the temperature sensors inside the trunk wood [40], and because of the heterogeneity of the sap flux density profile within the sapwood [28,33,41]. In this regard, the twisted morphology of the grapevine wood may have contributed to causing the underestimation of the actual sap velocity. The low values of transpiration measured with the sap flow during the experiment might be related to the position of the sensors in a region of the xylem characterized by a relatively low flux velocity, therefore not fully representative of the actual velocity of the whole sap-wood area. Nevertheless, sap flow sensors were able to nicely describe the response of the daily course of transpiration rate to environmental conditions and to developing vine water stress (Figure 4 and Figure S3). At the beginning of both drought cycles, during sunny days characterized by high incoming solar radiation, the daily pattern of the sap flow rate followed a bell-shaped curve which largely matched that of daily R, except for the central hours of the day when sap flow rate was relatively stable (Figure 4). Similar daily patterns of sap flow response to actual radiation was described in different grapevine cultivars [31,42], as well as in other crops, such as apple [43,44] and peach [45]. During the second half of both drought cycles, when in response to the limited water availability the vines reduced their transpiration rates (Figure 2), the daily pattern of sap flow and R became uncoupled (Figure S4). Between DAI 6 and DAI 8, the relative sap flow rate started to decrease well before noon (around 10:00–11:00 am), when R was still increasing, whereas in the last days of both cycles (DAI 9 and 10) sap flow rates were extremely low, showing very little changes during the whole day. Despite the underestimation of the absolute values of transpiration rates, taken together these results demonstrated the capability of the sap flow sensors to describe changes in the daily transpiration rates of grapevine subjected to increasing water limitations. Since these measures were taken almost continuously and in a non-destructive way, sap flow sensors can be considered as an interesting advanced technology for the early detection of water stress in grapevines that can be also used for the management of irrigation in vineyards [46].
This study also aimed to evaluate the performance of selected fluorescence indexes for the detection of water stress intensity in grapevine. The chosen parameters—Fv/Fm, Y(II), Y(NPQ), and Y(NO)—are among the most important fluorescence indexes and are broadly used in plant stress physiology studies [21,22,23,24,25].
The Fv/Fm ratio is a way to estimate the maximum quantum yield of the PSII and the most commonly used index for measuring stress intensity in plant leaves [22]. Fv/Fm ratio in grapevine often decreases with increasing stress conditions (i.e., drought, heat), generally showing values in the range of 0.8 ÷ 0.6 [47,48,49]. Under the experimental conditions of our study, the Fv/Fm index decreased significantly during both drought cycles (Figure 6A), even though values were lower compared with those of other studies [24,47]. The overall low values of the Fv/Fm ratio might be explained by differences in the measurement methodology used in the considered studies, including i) the protocol followed for the dark adaptation of leaves (i.e., use of leaf clips or pre-dawn measures); ii) the use of a punctual or, as in the current case, of an imaging systems; iii) the intensity of stress reached by the vines. The effective PSII quantum yield (Y(II)) indicates the share of the absorbed quanta that is converted into chemically fixed energy by the PSII reaction centers [50]. The Y(II) values were reduced at the end of both drought cycles, even though differences resulted to be not significant (Figure 6B). Overall, values of Y(II) were around 0.2, similar to those reported by [49] on grapevine ‘Touriga-Franca’ and ‘Touriga-Nacional’ exposed to summer heat and drought stresses. The quantum yield of the regulated energy dissipation in PS II (Y(NPQ)) reflects the capacity of the PS II to protect itself by dissipating the excessive excitation energy into heat [51]. High values of Y(NPQ), such as those found in this research (up to 0.6), are indicative of a good physiological capacity of leaves to be protected from excessive light intensity (Figure 6C). High NPQ values were also found by [49]. The non-photochemical quenching generally increases with higher levels of stress [24,47,49]; under the present experimental conditions, Y(NPQ) did not show a consistent trend, being significantly lower at the end of the first drought cycle and rather unaffected (values around 0.5) during the second cycle (Figure 6C). A lack of NPQ modification, despite the increasing intensity of water stress, might be indicative of a loss of efficiency of the protective regulatory mechanisms during cycle 2 and consequently of a higher probability for an increase in damage to the leaf photosystems [52]. The quantum yield of nonregulated energy dissipation (Y(NO)) represents an indirect evaluation of the efficacy of the protective regulatory mechanisms on the PSII. High values of Y(NO) show that the protective mechanism of energy conversion (i.e., heat dissipation) is rather inefficient and consequently plants cannot cope efficiently with excessive incident radiation [52]. Under the described experimental conditions, Y(NO) increased significantly during cycle 1, probably indicating a severe water stress status shown by the vines. Similar to Y(NPQ), Y(NO) increased, even though not significantly, also in cycle 2, probably signaling a general loss of effectiveness of the photochemical energy conversion/dissipation system of PSII caused by the prolonged water shortage (cycle 1 and 2 cumulative effect).
5. Conclusions
In this study, we integrated the information coming from several indexes to obtain a robust and reliable evaluation of grapevine water stress status during two consecutive cycles of drought. The determination of transpiration both gravimetrically and with sap flow sensors pointed out that, in the absence of water stress (midday Ψstem above −0.5 MPa approximately), environmental factors, such as temperature, VPD and R, drive the intensity of grapevine transpiration rate. When soil water availability decreased, stress conditions became evident as shown by the limitation of stomata functioning (gs around 0.05 mol H2O m−2 s−1), the lower midday Ψstem (values below −1 MPa approximately), and the severe impairment of the leaf transpiration rate (values lower than 0.5 L m−2 d−1). Grapevine water stress conditions were detected by the Fv/Fm ratio that significantly decreased during both drought cycles, whereas the other fluorescence indexes (Y(II), Y(NPQ) and Y(NO)) were not consistently affected. Under the current experimental conditions, the sap flow sensors were able to provide a good qualitative indication of the daily and sub-daily grapevine transpiration rate, responding rapidly to changes in both the environmental and drought level, even if largely underestimating the actual quantitative value of the transpiration rates. In conclusion, the findings of this work integrate the available knowledge on grapevine response to water stress, providing useful indications about physiological indexes of water stress that could be successfully considered for the management of deficit irrigation strategies in viticulture.
Supplementary Materials
The following supporting information can be downloaded at: https://www.mdpi.com/article/10.3390/agronomy13020464/s1, Figure S1: The experimental set up with the load cells system; Figure S2: Daily mean VPD (kPa), temperature (°C) and R (W m−2) during the study period; Figure S3: Relative transpiration loss (the daily variation of transpiration referring to the initial situation at DAI 1); Figure S4: Diurnal patterns of relative transpiration rate (Tsap) and the environmental conditions: R (W m−2), VPD (kPa) and T (°C) during both drought cycles.
Author Contributions
Conceptualization, C.A., D.Z., M.T., F.B., F.B.C. and A.B.A.; methodology C.A., D.Z., M.T., F.B., F.B.C. and A.B.A.; formal analysis, F.B. and F.B.C.; investigation, F.B., F.B.C. and A.B.A.; data curation, F.B. and F.B.C.; writing—original draft preparation, F.B., F.B.C. and C.A.; writing—review and editing, F.B., F.B.C., C.A., D.Z., M.T. and B.B.; supervision, C.A., D.Z. and M.T.; project administration, C.A., D.Z. and M.T.; funding acquisition, M.T. All authors have read and agreed to the published version of the manuscript.
Funding
The work was financed by the Free University of Bozen-Bolzano, project “Water losses and carbon assimilation in the vineyard as affected by changes of environmental drivers (WAVE) (TN 201E)”.
Data Availability Statement
The data that support the findings of this study are available from the corresponding authors, upon request and agreement of the authors.
Conflicts of Interest
The authors declare no conflict of interest.
References
- IPCC Synthesis Report. Contribution of Working Groups I, II and III to the Fifth Assessment Report of the Intergovernmental Panel on Climate Change; Pachauri, R.K., Meyer, L.A., Eds.; Core Writing Team: Geneva, Switzerland, 2014. [Google Scholar]
- Pereira, L.S. Challenges on Water Resources Management When Searching for Sustainable Adaptation to Climate Change Focusing Agriculture. Eur. Water 2011, 34, 41–54. [Google Scholar]
- Steduto, P.; Hsiao, T.C.; Fereres, E.; Raes, D. Crop Yield Response to Water; United Nations FAO: Rome, Italy, 2012; p. 505. [Google Scholar]
- Geerts, S.; Raes, D. Deficit Irrigation as an On-Farm Strategy to Maximize Crop Water Productivity in Dry Areas. Agric. Water Manag. 2009, 96, 1275–1284. [Google Scholar] [CrossRef]
- Ojeda, H.; Andary, C.; Kraeva, E.; Carbonneau, A.; Deloire, A. Influence of Pre- and Postveraison Water Deficit on Synthesis and Concentration of Skin Phenolic Compounds during Berry Growth of Vitis vinifera Cv. Shiraz. Am. Soc. Enol. Vitic. 2002, 53, 261–267. [Google Scholar]
- Chaves, M.M.; Santos, T.P.; Souza, C.R.; Ortuño, M.F.; Rodrigues, M.L.; Lopes, C.M.; Maroco, J.P.; Pereira, J.S. Deficit Irrigation in Grapevine Improves Water-Use Efficiency While Controlling Vigour and Production Quality. Ann. Appl. Biol. 2007, 150, 237–252. [Google Scholar] [CrossRef]
- Chaves, M.M.; Zarrouk, O.; Francisco, R.; Costa, J.M.; Santos, T.; Regalado, A.P.; Rodrigues, M.L.; Lopes, C.M. Grapevine under Deficit Irrigation: Hints from Physiological and Molecular Data. Ann. Bot. 2010, 105, 661–676. [Google Scholar] [CrossRef]
- Basile, B.; Marsal, J.; Mata, M.; Vallverdú, X.; Bellvert, J.; Girona, J. Phenological Sensitivity of Cabernet Sauvignon to Water Stress: Vine Physiology and Berry Composition. Am. J. Enol. Vitic. 2011, 62, 453–461. [Google Scholar] [CrossRef]
- Cifre, J.; Bota, J.; Escalona, J.M.; Medrano, H.; Flexas, J. Physiological Tools for Irrigation Scheduling in Grapevine (Vitis vinifera L.): An Open Gate to Improve Water-Use Efficiency? Agric. Ecosyst. Environ. 2005, 106, 159–170. [Google Scholar] [CrossRef]
- Buckley, T.N. Modeling Stomatal Conductance. Plant Physiol. 2017, 174, 572–582. [Google Scholar] [CrossRef] [PubMed]
- Kirkham, M.B. Potential Evapotranspiration. In Principles of Soil and Plant Water Relations; Academic Press: Cambridge, MA, USA, 2014; pp. 501–514. ISBN 9780124200227. [Google Scholar]
- Schultz, H.R. Differences in Hydraulic Architecture Account for Near- Isohydric and Anisohydric Behaviour of Two Field-Grown Vitis vinifera L. Cultivars during Drought. Plant Cell Environ. 2003, 23, 1393–1405. [Google Scholar] [CrossRef]
- Lovisolo, C.; Hartung, W.; Schubert, A. Whole-Plant Hydraulic Conductance and Root-to-Shoot Flow of Abscisic Acid Are Independently Affected by Water Stress in Grapevines. Funct. Plant Biol. 2002, 29, 1349–1356. [Google Scholar] [CrossRef]
- Escalona, J.M.; Flexas, J.; Medrano, H. Stomatal and Non-Stomatal Limitations of Photosynthesis under Water Stress in Field-Grown Grapevines. Aust. J. Plant Physiol. 1999, 26, 421–433. [Google Scholar] [CrossRef]
- Greer, D.H.; Weedon, M.M. Modelling Photosynthetic Responses to Temperature of Grapevine (Vitis vinifera Cv. Semillon) Leaves on Vines Grown in a Hot Climate. Plant Cell Environ. 2012, 35, 1050–1064. [Google Scholar] [CrossRef] [PubMed]
- Flexas, J.; Bota, J.; Cifre, J.; Escalona, J.M.; Galmés, J.; Gulías, J.; Lefi, E.K.; Martínez-Cañellas, S.F.; Moreno, M.T.; Ribas-Carbó, M.; et al. Understanding Down-Regulation of Photosynthesis under Water Stress: Future Prospects and Searching for Physiological Tools for Irrigation Management. Ann. Appl. Biol. 2004, 144, 273–283. [Google Scholar] [CrossRef]
- Choné, X.; Van Leeuwen, C.; Dubourdieu, D.; Gaudillère, J.P. Stem Water Potential Is a Sensitive Indicator of Grapevine Water Status. Ann. Bot. 2001, 87, 477–483. [Google Scholar] [CrossRef]
- Wenter, A.; Zanotelli, D.; Montagnani, L.; Tagliavini, M.; Andreotti, C. Effect of Different Timings and Intensities of Water Stress on Yield and Berry Composition of Grapevine (Cv. Sauvignon Blanc) in a Mountain Environment. Sci. Hortic. 2018, 236, 137–145. [Google Scholar] [CrossRef]
- Palliotti, A.; Tombesi, S.; Frioni, T.; Famiani, F.; Silvestroni, O.; Zamboni, M.; Poni, S. Morpho-Structural and Physiological Response of Container-Grown Sangiovese and Montepulciano Cvv. (Vitis vinifera) to Re-Watering after a Pre-Veraison Limiting Water Deficit. Funct. Plant Biol. 2014, 41, 634–647. [Google Scholar] [CrossRef]
- Wenter, A.; Zanotelli, D.; Tagliavini, M.; Andreotti, C. Thresholds of Soil and Plant Water Availability That Affect Leaf Transpiration, Stomatal Conductance and Photosynthesis in Grapevines. Acta Hortic. 2022, 1335, 605–611. [Google Scholar] [CrossRef]
- Schreiber, U.; Bilger, W.; Neubauer, C. Chlorophyll Fluorescence as a Nonintrusive Indicator for Rapid Assessment of In Vivo Photosynthesis. In Ecophysiology of Photosynthesis; Springer: Berlin/Heidelberg, Germany, 1995; pp. 49–70. [Google Scholar]
- Murchie, E.H.; Lawson, T. Chlorophyll Fluorescence Analysis: A Guide to Good Practice and Understanding Some New Applications. J. Exp. Bot. 2013, 64, 3983–3998. [Google Scholar] [CrossRef]
- Mashilo, J.; Odindo, A.O.; Shimelis, H.A.; Musenge, P.; Tesfay, S.Z.; Magwaza, L.S. Photosynthetic Response of Bottle Gourd [Lagenaria Siceraria (Molina) Standl.] to Drought Stress: Relationship between Cucurbitacins Accumulation and Drought Tolerance. Sci. Hortic. 2018, 231, 133–143. [Google Scholar] [CrossRef]
- Galat Giorgi, E.; Sadras, V.O.; Keller, M.; Perez Peña, J. Interactive Effects of High Temperature and Water Deficit on Malbec Grapevines. Aust. J. Grape Wine Res. 2019, 25, 345–356. [Google Scholar] [CrossRef]
- Díaz-Barradas, M.C.; Gallego-Fernández, J.B.; Zunzunegui, M. Plant Response to Water Stress of Native and Non-Native Oenothera Drummondii Populations. Plant Physiol. Biochem. 2020, 154, 219–228. [Google Scholar] [CrossRef]
- Medrano, H.; Escalona, J.M.; Bota, J.; Gulías, J.; Flexas, J. Regulation of Photosynthesis of C3 Plants in Response to Progressive Drought: Stomatal Conductance as a Reference Parameter. Ann. Bot. 2002, 89, 895–905. [Google Scholar] [CrossRef] [PubMed]
- Dragoni, D.; Lakso, A.N.; Piccioni, R.M. Transpiration of Apple Trees in a Humid Climate Using Heat Pulse Sap Flow Gauges Calibrated with Whole-Canopy Gas Exchange Chambers. Agric. For. Meteorol. 2005, 130, 85–94. [Google Scholar] [CrossRef]
- Fernández, J.E.; Green, S.R.; Caspari, H.W.; Diaz-Espejo, A.; Cuevas, M.V. The Use of Sap Flow Measurements for Scheduling Irrigation in Olive, Apple and Asian Pear Trees and in Grapevines. Plant Soil 2008, 305, 91–104. [Google Scholar] [CrossRef]
- Dragoni, D.; Lakso, A.N.; Piccioni, R.M.; Tarara, J.M. Transpiration of Grapevines in the Humid Northeastern United States. Am. J. Enol. Vitic. 2006, 57, 460–467. [Google Scholar] [CrossRef]
- Zhang, Y.; Kang, S.; Ward, E.J.; Ding, R.; Zhang, X.; Zheng, R. Evapotranspiration Components Determined by Sap Flow and Microlysimetry Techniques of a Vineyard in Northwest China: Dynamics and Influential Factors. Agric. Water Manag. 2011, 98, 1207–1214. [Google Scholar] [CrossRef]
- Wei, X.; Fu, S.; Chen, D.; Zheng, S.; Wang, T.; Bai, Y. Grapevine Sap Flow in Response to Physio-Environmental Factors under Solar Greenhouse Conditions. Water 2020, 12, 3081. [Google Scholar] [CrossRef]
- Spicer, R.; Holbrook, N.M. Within-Stem Oxygen Concentration and Sap Flow in Four Temperate Tree Species: Does Long-Lived Xylem Parenchyma Experience Hypoxia? Plant Cell Environ. 2005, 28, 192–201. [Google Scholar] [CrossRef]
- Gebauer, T.; Horna, V.; Leuschner, C. Variability in Radial Sap Flux Density Patterns and Sapwood Area among Seven Co-Occurring Temperate Broad-Leaved Tree Species. Tree Physiol. 2008, 28, 1821–1830. [Google Scholar] [CrossRef] [PubMed]
- Allen, R.G.; Pereira, L.S.; Raes, D.; Smith, M. Crop Evapotranspiration-Guidelines for Computing Crop Water Requirements-FAO Irrigation and Drainage Paper 56; FAO: Rome, Italy, 1998; Volume 300, p. D05109. [Google Scholar]
- Burgess, S.S.O.; Adams, M.A.; Turner, N.C.; Beverly, C.R.; Ong, C.K.; Khan, A.A.H.; Bleby, T.M. An Improved Heat Pulse Method to Measure Low and Reverse Rates of Sap Flow in Woody Plants. Tree Physiol. 2001, 21, 589–598. [Google Scholar] [CrossRef] [PubMed]
- Tarara, J.M.; Peña, J.E.P. Moderate Water Stress from Regulated Deficit Irrigation Decreases Transpiration Similarly to Net Carbon Exchange in Grapevine Canopies. J. Am. Soc. Hortic. Sci. 2015, 140, 413–426. [Google Scholar] [CrossRef]
- Pou, A.; Flexas, J.; Alsina, M.D.M.; Bota, J.; Carambula, C.; De Herralde, F.; Galmés, J.; Lovisolo, C.; Jiménez, M.; Ribas-Carbó, M.; et al. Adjustments of Water Use Efficiency by Stomatal Regulation during Drought and Recovery in the Drought-Adapted Vitis Hybrid Richter-110 (V. berlandieri x V. rupestris). Physiol. Plant. 2008, 134, 313–323. [Google Scholar] [CrossRef] [PubMed]
- Charrier, G.; Delzon, S.; Domec, J.C.; Zhang, L.; Delmas, C.E.L.; Merlin, I.; Corso, D.; King, A.; Ojeda, H.; Ollat, N.; et al. Drought Will Not Leave Your Glass Empty: Low Risk of Hydraulic Failure Revealed by Long-Term Drought Observations in World’s Top Wine Regions. Sci. Adv. 2018, 4, eaao6969. [Google Scholar] [CrossRef] [PubMed]
- Tombesi, S.; Frioni, T.; Poni, S.; Palliotti, A. Effect of Water Stress “Memory” on Plant Behavior during Subsequent Drought Stress. Environ. Exp. Bot. 2018, 150, 106–114. [Google Scholar] [CrossRef]
- Bleby, T.M.; Burgess, S.S.O.; Adams, M.A. A Validation, Comparison and Error Analysis of Two Heat-Pulse Methods for Measuring Sap Flow in Eucalyptus Marginata Saplings. Funct. Plant Biol. 2004, 31, 645–658. [Google Scholar] [CrossRef] [PubMed]
- Spicer, R. Senescence in Secondary Xylem: Heartwood Formation as an Active Developmental Program; Elsevier Inc.: Amsterdam, The Netherlands, 2005. [Google Scholar]
- Escalona, J.; Flexas, J.; Medrano, H. Drought Effects on Water Flow, Photosynthesis and Growth of Potted Grapevines. Vitis 2002, 41, 57–62. [Google Scholar]
- Nadezhdina, N. Sap Flow Index as an Indicator of Plant Water Status. Tree Physiol. 1999, 19, 885–891. [Google Scholar] [CrossRef] [PubMed]
- Ben Abdelkader, A.; Benyahia, F.; Bastos Campos, F.; Asensio, D.; Andreotti, C.; Tagliavini, M.; Zanotelli, D. Apple Tree Transpiration during Cycles of Progressive Drought as Assessed via Continuous Gravimetric and Xylem Sap Flux Measurements. Italus Hortus 2022, 29, 35–46. [Google Scholar] [CrossRef]
- Yamane, T.; Hamana, Y.; Nakano, M. Detection of Water-Deficit Stress from Daily Sap Flow Profiles in Peach. J. Jpn. Soc. Hortic. Sci. 2011, 80, 383–389. [Google Scholar] [CrossRef]
- Hernandez-Santana, V.; Fernández, J.E.; Rodriguez-Dominguez, C.M.; Romero, R.; Diaz-Espejo, A. The Dynamics of Radial Sap Flux Density Reflects Changes in Stomatal Conductance in Response to Soil and Air Water Deficit. Agric. For. Meteorol. 2016, 218–219, 92–101. [Google Scholar] [CrossRef]
- Palliotti, A.; Tombesi, S.; Frioni, T.; Silvestroni, O.; Lanari, V.; D’Onofrio, C.; Matarese, F.; Bellincontro, A.; Poni, S. Physiological Parameters and Protective Energy Dissipation Mechanisms Expressed in the Leaves of Two Vitis vinifera L. Genotypes under Multiple Summer Stresses. J. Plant Physiol. 2015, 185, 84–92. [Google Scholar] [CrossRef] [PubMed]
- Ju, Y.L.; Yue, X.F.; Zhao, X.F.; Zhao, H.; Fang, Y. lin Physiological, Micro-Morphological and Metabolomic Analysis of Grapevine (Vitis vinifera L.) Leaf of Plants under Water Stress. Plant Physiol. Biochem. 2018, 130, 501–510. [Google Scholar] [CrossRef] [PubMed]
- Bernardo, S.; Rodrigo, M.J.; Vives-Peris, V.; Gómez-Cadenas, A.; Zacarías, L.; Machado, N.; Moutinho-Pereira, J.; Dinis, L.T. Fine-Tuning of Grapevine Xanthophyll-Cycle and Energy Dissipation under Mediterranean Conditions by Kaolin Particle-Film. Sci. Hortic. 2022, 291, 110584. [Google Scholar] [CrossRef]
- Kramer, D.M.; Johnson, G.; Kiirats, O.; Edwards, G.E. New Fluorescence Parameters for the Determination of QA Redox State and Excitation Energy Fluxes. Photosynth. Res. 2004, 79, 209–218. [Google Scholar] [CrossRef] [PubMed]
- Schreiber, U. Pulse-Amplitude-Modulation (PAM) Fluorometry and Saturation Pulse Method: An Overview. In Advances in Photosynthesis and Respiration; Papageorgiou, G.C., Govindjee, Eds.; Springer: Dordrecht, The Netherlands, 2004; Volume 19, pp. 279–319. ISBN 9781493970001. [Google Scholar]
- Klughammer, C.; Schreiber, U. Complementary PS II Quantum Yields Calculated from Simple Fluorescence Parameters Measured by PAM Fluorometry and the Saturation Pulse Method. PAM Appl. Notes 2008, 1, 27–35. [Google Scholar]


Disclaimer/Publisher’s Note: The statements, opinions and data contained in all publications are solely those of the individual author(s) and contributor(s) and not of MDPI and/or the editor(s). MDPI and/or the editor(s) disclaim responsibility for any injury to people or property resulting from any ideas, methods, instructions or products referred to in the content. |
© 2023 by the authors. Licensee MDPI, Basel, Switzerland. This article is an open access article distributed under the terms and conditions of the Creative Commons Attribution (CC BY) license (https://creativecommons.org/licenses/by/4.0/).