Abstract
Dense planting effectively increases maize yield while increasing stalk lodging risk. Appropriate row spacing can improve the maize population structure and stalk lodging resistance, but its physiological ecological mechanisms and interaction with planting density are unclear. Here, a two-year field experiment to determine the joint effects of row spacing and planting density on maize stem characteristics and the quantitative relationship of the light condition within a maize population with stalk lodging resistance indicated that the stalk mechanical strength showed a quadratic function relationship with photosynthetically active radiation (PAR), whereas the lodging rate showed an exponential function relationship with basal light transmittance (LT). Further, the basal LT was significantly positively correlated with basal internode thickness, dry weight per unit stem length (DWUL), mechanical and cortical tissue thickness, and lignin and cellulose contents. Increasing the planting density decreased the basal LT and PAR; correspondingly decreased the basal internode thickness, DWUL, mechanical and cortical tissue thickness, lignin and cellulose contents, and stalk mechanical strength; and increased the lodging rate, while increasing row spacing did the opposite. Thus, optimizing the row spacing enhanced the lodging resistance through LT and PAR improvement of the lower part of the population and further increased the grain yield by optimizing the yield components. The appropriate row spacing varied with the planting density. The proper strategy for high stalk lodging resistance and grain yielding under this experimental condition was 67,500 plants ha−1 density with 60 + 60 cm equal row spacing.
1. Introduction
Maize is China’s largest food crop [1], and thus, higher maize yields are required to ensure national food security [2]. A high planting density can increase the maize yield; however, it increases the risk of stalk lodging [3], which not only reduces the maize yield by 5–70% [4] but also directly hinders the mechanized harvesting of maize [5]. Stalk lodging is related to many factors, such as plant and basal internode morphology, stem anatomical structure, dry matter accumulation, and cell wall structure and composition [6,7,8]. The lodging rate is significantly negatively correlated with the stalk bending strength (SBS), rind penetration strength (RPS), dry weight per unit stem length (DWUL), and cellulose and lignin contents [9,10]. SBS and RPS are significantly positively correlated with basal internode diameter and DWUL [11]. As the plant density increases, leaves overlap with each other, consequently reducing the photosynthetic capacity and carbohydrate transportation to the stalk [12]. Therefore, the basal internodes of stalks become thinner; the dry matter weight, lignin and cellulose contents, per unit stem length, thickness of mechanical and cortical tissue, area and number of vascular bundles, and RPS and SBS decrease; and the lodging rate increases [13,14,15,16].
Planting density determines the plant population size, and row spacing influences the distribution pattern of plant populations [17]. As row spacing improves the light conditions for maize populations [18], promotes stalk development, and increases stalk lodging resistance [19], it is an optimal approach to ensure uniform high-density cultivation. Thus, both planting density and row spacing determine the field structure of maize populations. Presently, many studies have reported the effects of density on maize stalk characteristics and lodging resistance [13,20,21,22]. However, research on the relevance of row spacing in stalk lodging resistance and its interaction with planting density is limited, and their physiological ecological mechanisms are not yet clear.
Light is a main environmental factor affecting plant growth and development and stalk formation. Previous studies on the effects of light on the stalk characteristics and lodging resistance of maize basal internode through shading reported that low light reduces the SBS and RPS, DWUL, and cellulose and lignin contents of basal internodes, which promote lodging [15,16]. Xue et al. [12,23] also obtained similar results while studying the light distribution in maize populations and its impact on maize stalk characteristics and lodging resistance by cutting leaves and adjusting the leaf angle. However, most of these studies were conducted under artificially adjusted or simulated light conditions. The exact quantitative relationship between basal light transmittance (LT) in maize populations and the lodging resistance of maize under natural light conditions remains unclear.
In summary, the lodging resistance of maize is related to the stem characteristics, which are affected by the light conditions. Furthermore, increasing the planting density would increase the shade conditions and decrease the stalk lodging resistance, and row spacing could change the light distribution for maize populations. Therefore, we hypothesized that optimizing row spacing could increase stalk lodging resistance by improving the light distribution to dense maize populations. A two-year field experiment was conducted by considering different planting densities and row spacings to study the light intensity and transmittance in the lower parts of a maize population structure and the stalk characteristics and lodging rate of maize. Primarily, this study aimed to determine (i) how planting density and row spacing jointly regulate the basal internode traits and lodging resistance of maize; (ii) the quantitative relationship between basal light transmittance (LT) and the mechanical strength and lodging rate of stalks under natural conditions; and (iii) the appropriate row spacing for both stalk lodging resistance and high yield of maize in dense populations in the low-light hilly region of Sichuan Basin, China.
2. Materials and Methods
2.1. Experimental Site
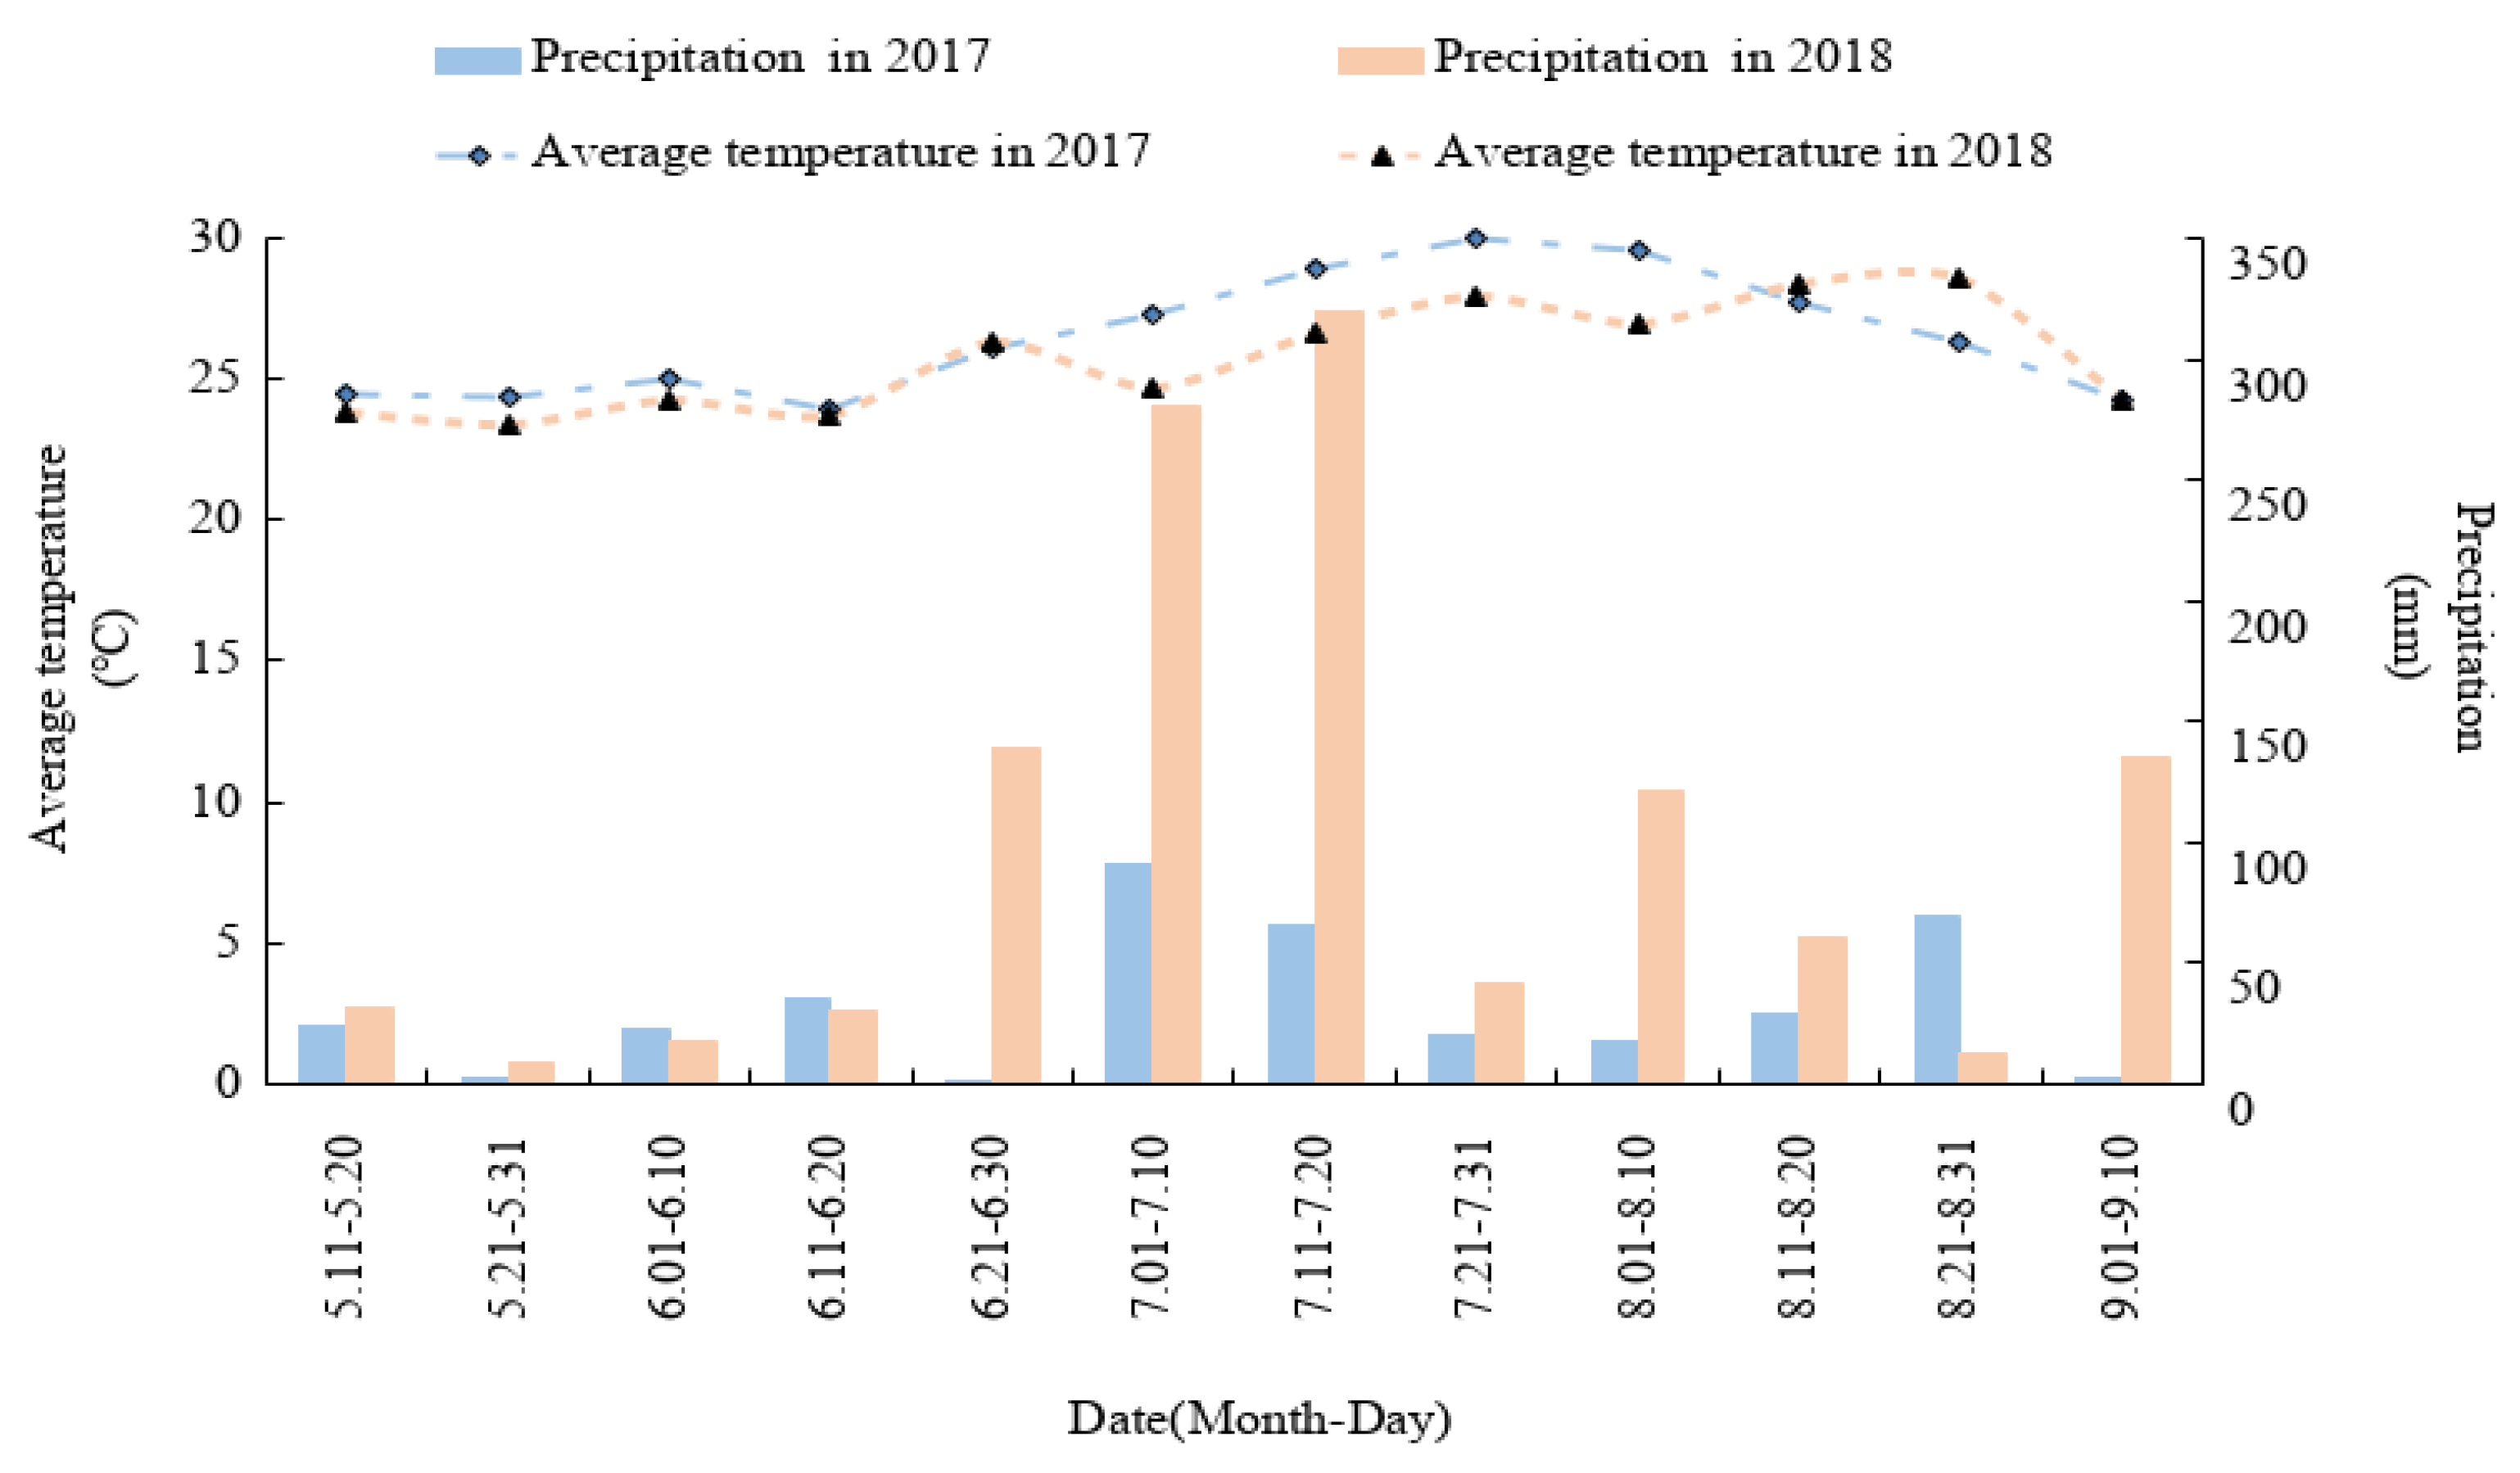
Field experiments were conducted in Zhongjiang County (30°95′ N, 104°63′ E), Sichuan Province, Southwest China, from May 2017 to September 2018. The area experiences a subtropical humid monsoon climate, and the frost-free period lasts for 286 d. The temperature and precipitation from maize sowing to harvest are shown in Figure 1. According to the Genetic Soil Classification of China (GSCC), the experimental soil was classified as purple soil, which was sampled from the top 20 cm of the top layer and had the following properties: 21.03 g kg−1 organic matter, 1.39 g kg−1 total N, 21.96 mg kg−1 alkali-hydrolyzed N, 5.83 mg kg−1 Olsen P, 112.68 mg kg−1 exchangeable K, and pH 7.60.
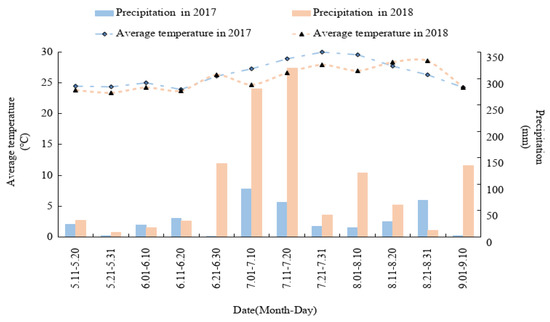
Figure 1.
Average temperature and precipitation at the experiment site during the maize growing period.
2.2. Experimental Design
A semi-compact maize hybrid variety, Zhenghong No. 6 (Sichuan Zhenghong Bio Co., Ltd., Chengdu, Sichuan, China), used locally on a large scale. was used as the experimental material. The experiments were arranged in a two-factor split-plot design with planting density as the main factor and row spacing as the sub-factor, with three replicates. The plant spacing was determined according to the planting density and row spacing. In 2017, two planting densities were considered, namely 45,000 (D1) and 67,500 (D2) plants ha−1, with five row spacing configurations (cm + cm), i.e., 60 + 60, 80 + 40, 80 + 80, 110 + 50, and 100 + 100. To further explore the potential for increased density in this area, a density of 90,000 (D3) plants ha−1 was added in 2018, resulting in three planting densities of 45,000 (D1), 67,500 (D2), and 90,000 (D3) plants ha−1 being considered with four row spacing configurations (cm + cm) of 60 + 60, 80 + 40, 80 + 80, and 110 + 50. Among them, the 45,000 plants ha−1 density and 110 cm + 50 cm row spacing, i.e., a lower planting density and wide–narrow row spacing, are commonly used due to the low light conditions in the region. Maize was sown on 16 May and harvested on 3 September in 2017 and was sown on 15 May and harvested on 5 September in 2018. Each plot contained 6 rows of maize, and the plot size was 21.6 m2 (6.0 m × 3.6 m), 28.8 m2 (6.0 m × 4.8 m), and 36.0 m2 (6.0 m × 6.0 m) according to the different row spacings. Further, 750 kg ha−1 of compound fertilizer (Stanley Agricultural Group Co., Ltd., Linyi, Shandong, China) (N:P2O5:K2O = 15:6:8) was applied as a base fertilizer, and 112.5 kg ha−1 of urea (Taiwo Technology Group Co., Ltd., Mianyang, Sichuan, China) (N content ≥ 46%) was applied at the 12th leaf stage (V12) as an ear fertilizer. Other management measures were the same as those used in local maize production.
2.3. Sampling and Measurements
2.3.1. Light Distribution
At the silking stage, under clear and cloudless weather conditions, a quantum sensor and data logger (LI-190SA and LI-1400, respectively; LI-COR Inc., Lincoln, NE, USA) were used to measure photosynthetically active radiation (PAR) at 0, 50, 100, 150, 200, and 250 cm above the ground in a diagonal manner. The light transmittance (, where I is the PAR within the population, which was the average value for the wide–narrow row spacing, and I0 is the PAR at the top of the canopy) and extinction coefficient (, where h is the measured height, K is the extinction coefficient of the maize population, and a is a constant) were calculated.
2.3.2. Internode Morphology and Dry Matter Accumulation
At the silking stage and filling stage (30 d after silking), six representative plants were randomly selected from each plot, and their internode length, diameter, dry weight, and dry weight per unit stem length (DWUL) [24] of the 3rd, 5th, and 7th internodes from the base were measured.
2.3.3. Internode Anatomic Structure
At the silking stage, approximately 1.5 cm of the middle of the 3rd and 5th internodes in each treatment was cut, fixed using a formaldehyde–alcohol–acetic acid mixture (Sichuan Durit Technology Co., Ltd., Chengdu, Sichuan, China), preserved in 70% ethanol (Sichuan Durit Technology Co., Ltd., Chengdu, Sichuan, China), embedded for paraffin sectioning using a JB-P5 machine (Wuhan Junjie Electronics Co., Ltd., Wuhan, Hubei, China), and sliced using a rotary microtome (RM2016, Leica Inc., Wetzlar, Hessian, Germany). The paraffin sections were dewaxed, saffron-stained, decolorized, fast green-stained, mounted, and examined under a microscope. After the images were scanned, a Case Viewer (Digital pathology slice scanner, 3DHISTECH Inc., Budapest, Hungary) was used to analyze and measure the cross-sectional areas of the stem, the number and areas of large and small vascular bundles, and the thickness of the stem cortical and mechanical tissue.
2.3.4. Internode Mechanical Strength
Six representative plants were randomly selected at the silking and filling stages, and an AWOS-SL04 plant stalk strength tester (Shijiazhuang Aiwoshi Technology Co., Ltd., Shijiazhuang, Hebei, China) was used to measure the crushing and breaking strengths of the 3rd, 5th, and 7th internodes from the plant base. A circular probe with a cross-sectional area of 1 cm2 was used to measure the stalk crushing strength (SCS), and a Y-type probe with a cross-sectional area of 0.5 cm2 was used to measure the stalk breaking strength (SBS) while the fulcrum was 10 cm.
2.3.5. Internode Structure Material Content
After measuring the SCS and SBS, the 3rd, 5th, and 7th internodes were dried, crushed, and passed through a 100-mesh sieve to determine the cellulose and lignin contents. The cellulose and lignin contents were measured using the anthrone–H2SO4 method [25] and the phloroglucinol color method [26], respectively.
2.3.6. Field Lodging and Folding Rates
At the mature stage, the number of lodging plants (plants with stalks and vertical lines at an angle ≥45° without breaking) and folding plants (plants with stalks broken below the ear internode) in each plot was determined, and the corresponding lodging and folding rates were calculated.
2.3.7. Grain Yield
At the physiological maturity stage, the effective ears of each plot were surveyed, and all ears were harvested to calculate the grain yield, while 20 representative ears were selected by the average ear weight method to investigate ear traits such as the number of grains and the 100-grain weight.
2.4. Statistics Analysis
Statistical data analysis was performed using an analysis of variance (ANOVA) between planting density and row spacing by SPSS 27.0 (IBM Inc., Version 27.0, Amonk, NY, USA), and the means of treatments were compared based on the Tukey test at the 0.05 probability level. The means were compared between row spacing at each planting density. The “mean values” (Mean) in tables were compared between planting densities within each year. The exponential and quadratic function equations were fitted using Origin Pro 9.0 (OriginLab, Version 9.0, Northampton, MA, USA), and graphs were prepared using Graph Pad Prism V. 5.0 (GraphPad Software Inc., Version 5.0, San Diego, CA, USA). As the internode morphology and mechanical strength performance at the filling and silking stages were similar, only the data at the silking stage were listed. As the characteristics of the 3rd, 5th, and 7th basal internodes among different treatments performed similarly, only the average is listed in the tables and figures(Data meet the normal distribution (Figure S1)).
3. Results
3.1. Light Transmittance and Extinction Coefficient
The planting density and row spacing significantly affected the basal light transmittance (LT), photosynthetically active radiation (PAR), and extinction coefficient (K) (Table 1). As the planting density increased, K increased, but PAR and LT decreased. Further, as the row spacing increased, LT and PAR gradually increased, and K gradually decreased. However, the increase or decrease range gradually decreased under the 90,000 (D3) plants ha−1 density—that is, the relationship of LT (YLT) at 0 cm and K (YK) with row spacing (X) under the densities of 45,000 (D1) and 67,500 (D2) plants ha−1 was linear. The corresponding regression equations for these two densities were YD1-LT 0 cm = 2.8 + 0.2342X, R2 = 0.958 **; YD2-LT 0 cm = 3.7 + 0.1285X, R2 = 0.985 **; YD1-K = 0.01 + 0.000048X, R2 = 0.924 **; and YD2-K = 0.01 + 0.000022X, R2 = 0.869 **. The relationship of LT at 0 cm and K with row spacing under the 90,000 (D3) plants ha−1 density was quadratic, and the corresponding regression equations were YD3-LT 0 cm = −0.95 + 0.181X−0.00084X2, R2 = 0.935 *, and YD3-K = 0.01 − 0.00007X + 0.00000003X2, R2 = 0.962 **.

Table 1.
Effects of planting density and row spacing on light transmittance and extinction coefficient in 2018.
3.2. Morphology and Material Enrichment of Basal Internodes
As the planting density increased, the basal internode length increased, whereas the diameter, dry weight, and dry weight per unit stem length (DWUL) decreased (Table 2). At the densities of 45,000 and 67,500 plants ha−1, the internode diameter, dry weight, and DWUL of the equal row spacing treatments (60 + 60 and 80 + 80) were slightly higher than those of the wide–narrow row spacing treatments (80 + 40 and 110 + 50). However, at the 90,000 plants ha−1 density, the parameters mentioned above showed higher values in the 110 + 50 row spacing than in the 80 + 80 row spacing. These morphology and material traits at the filling stage were similar to those at the silking stage (Tables S1–S4). The effects of density and row spacing on dry weight per stem volume (data omitted) were similar to their impacts on dry weight per unit stem length. The dry weight per stem volume and the dry weight per unit stem length were significantly and positively correlated. The correlation coefficients for the 3rd, 5th, and 7th internodes in the silking stage and the filling stage were 0.7868 **, 0.6820 **, and 0.6648 ** (p < 0.01, N = 22) and 0.7614 **, 0.6639 **, and 0.8602 ** (p < 0.01, N = 22), respectively. In addition, the dry weight and dry weight per unit stem length of the internodes were significant (p < 0.01) and positively correlated with internode diameter and negatively correlated with internode length at the silking and filling stages.
Table 2.
Effects of density and row spacing on the internode morphology and dry matter accumulation.
3.3. Vascular Bundles and Mechanical Organization of Basal Internodes
As the planting density increased, the total area of large and small vascular bundles, the number of large and small vascular bundles, the mechanical tissue thickness (Tm), and the cortical thickness (Tc) of the basal internodes decreased (Table 3). This in turn weakened the strength and durability of the vascular tissue. Under the densities of 45,000 and 67,500 plants ha−1, the Sb, Nb, Tm, and Tc values of the equal row spacing (60 + 60 and 80 + 80) treatments were generally greater than those of the wide–narrow row spacing treatments (80 + 40 and 110 + 50). However, under the 90,000 plants ha−1 density, the Sb, Nb, Tm, and Tc values were greater with the 110 + 50 row spacing than with the 80 + 80 row spacing.
Table 3.
Effects of planting density and row spacing on basal internode cortical tissue and vascular bundles.
3.4. Cellulose and Lignin Contents of Basal Internodes
The cellulose and lignin contents of the basal internodes decreased as the density increased (Table 4). Moreover, the cellulose and lignin contents of the basal internodes in the equal row spacing (60 + 60 and 80 + 80) treatments were higher than those in the corresponding wide–narrow row treatments under the 45,000 and 67,500 plants ha−1 densities, while those of the 110 + 50 row spacing were higher than those of the 80 + 80 row spacing under the 90,000 plants ha−1 density. On averaging the data at the silking and filling stages (Tables S5 and S6), the coefficients of variation (CVs) of cellulose content in the 3rd, 5th, and 7th internodes were 4.04%, 2.32%, and 3.01% for 2017 and 3.52%, 3.27%, and 4.18% for 2018, respectively, while the values of lignin content were 5.72%, 5.54%, and 5.11% for 2017 and 5.52%, 4.94%, and 6.18% for 2018, respectively. Thus, the overall CV values for lignin content were higher than those for cellulose content, indicating that the planting density and row spacing had a greater effect on the lignin content than on the cellulose content.
Table 4.
Effects of density and row spacing on basal internode cellulose and lignin contents of maize.
3.5. Crushing and Breaking Strength of Basal Internodes
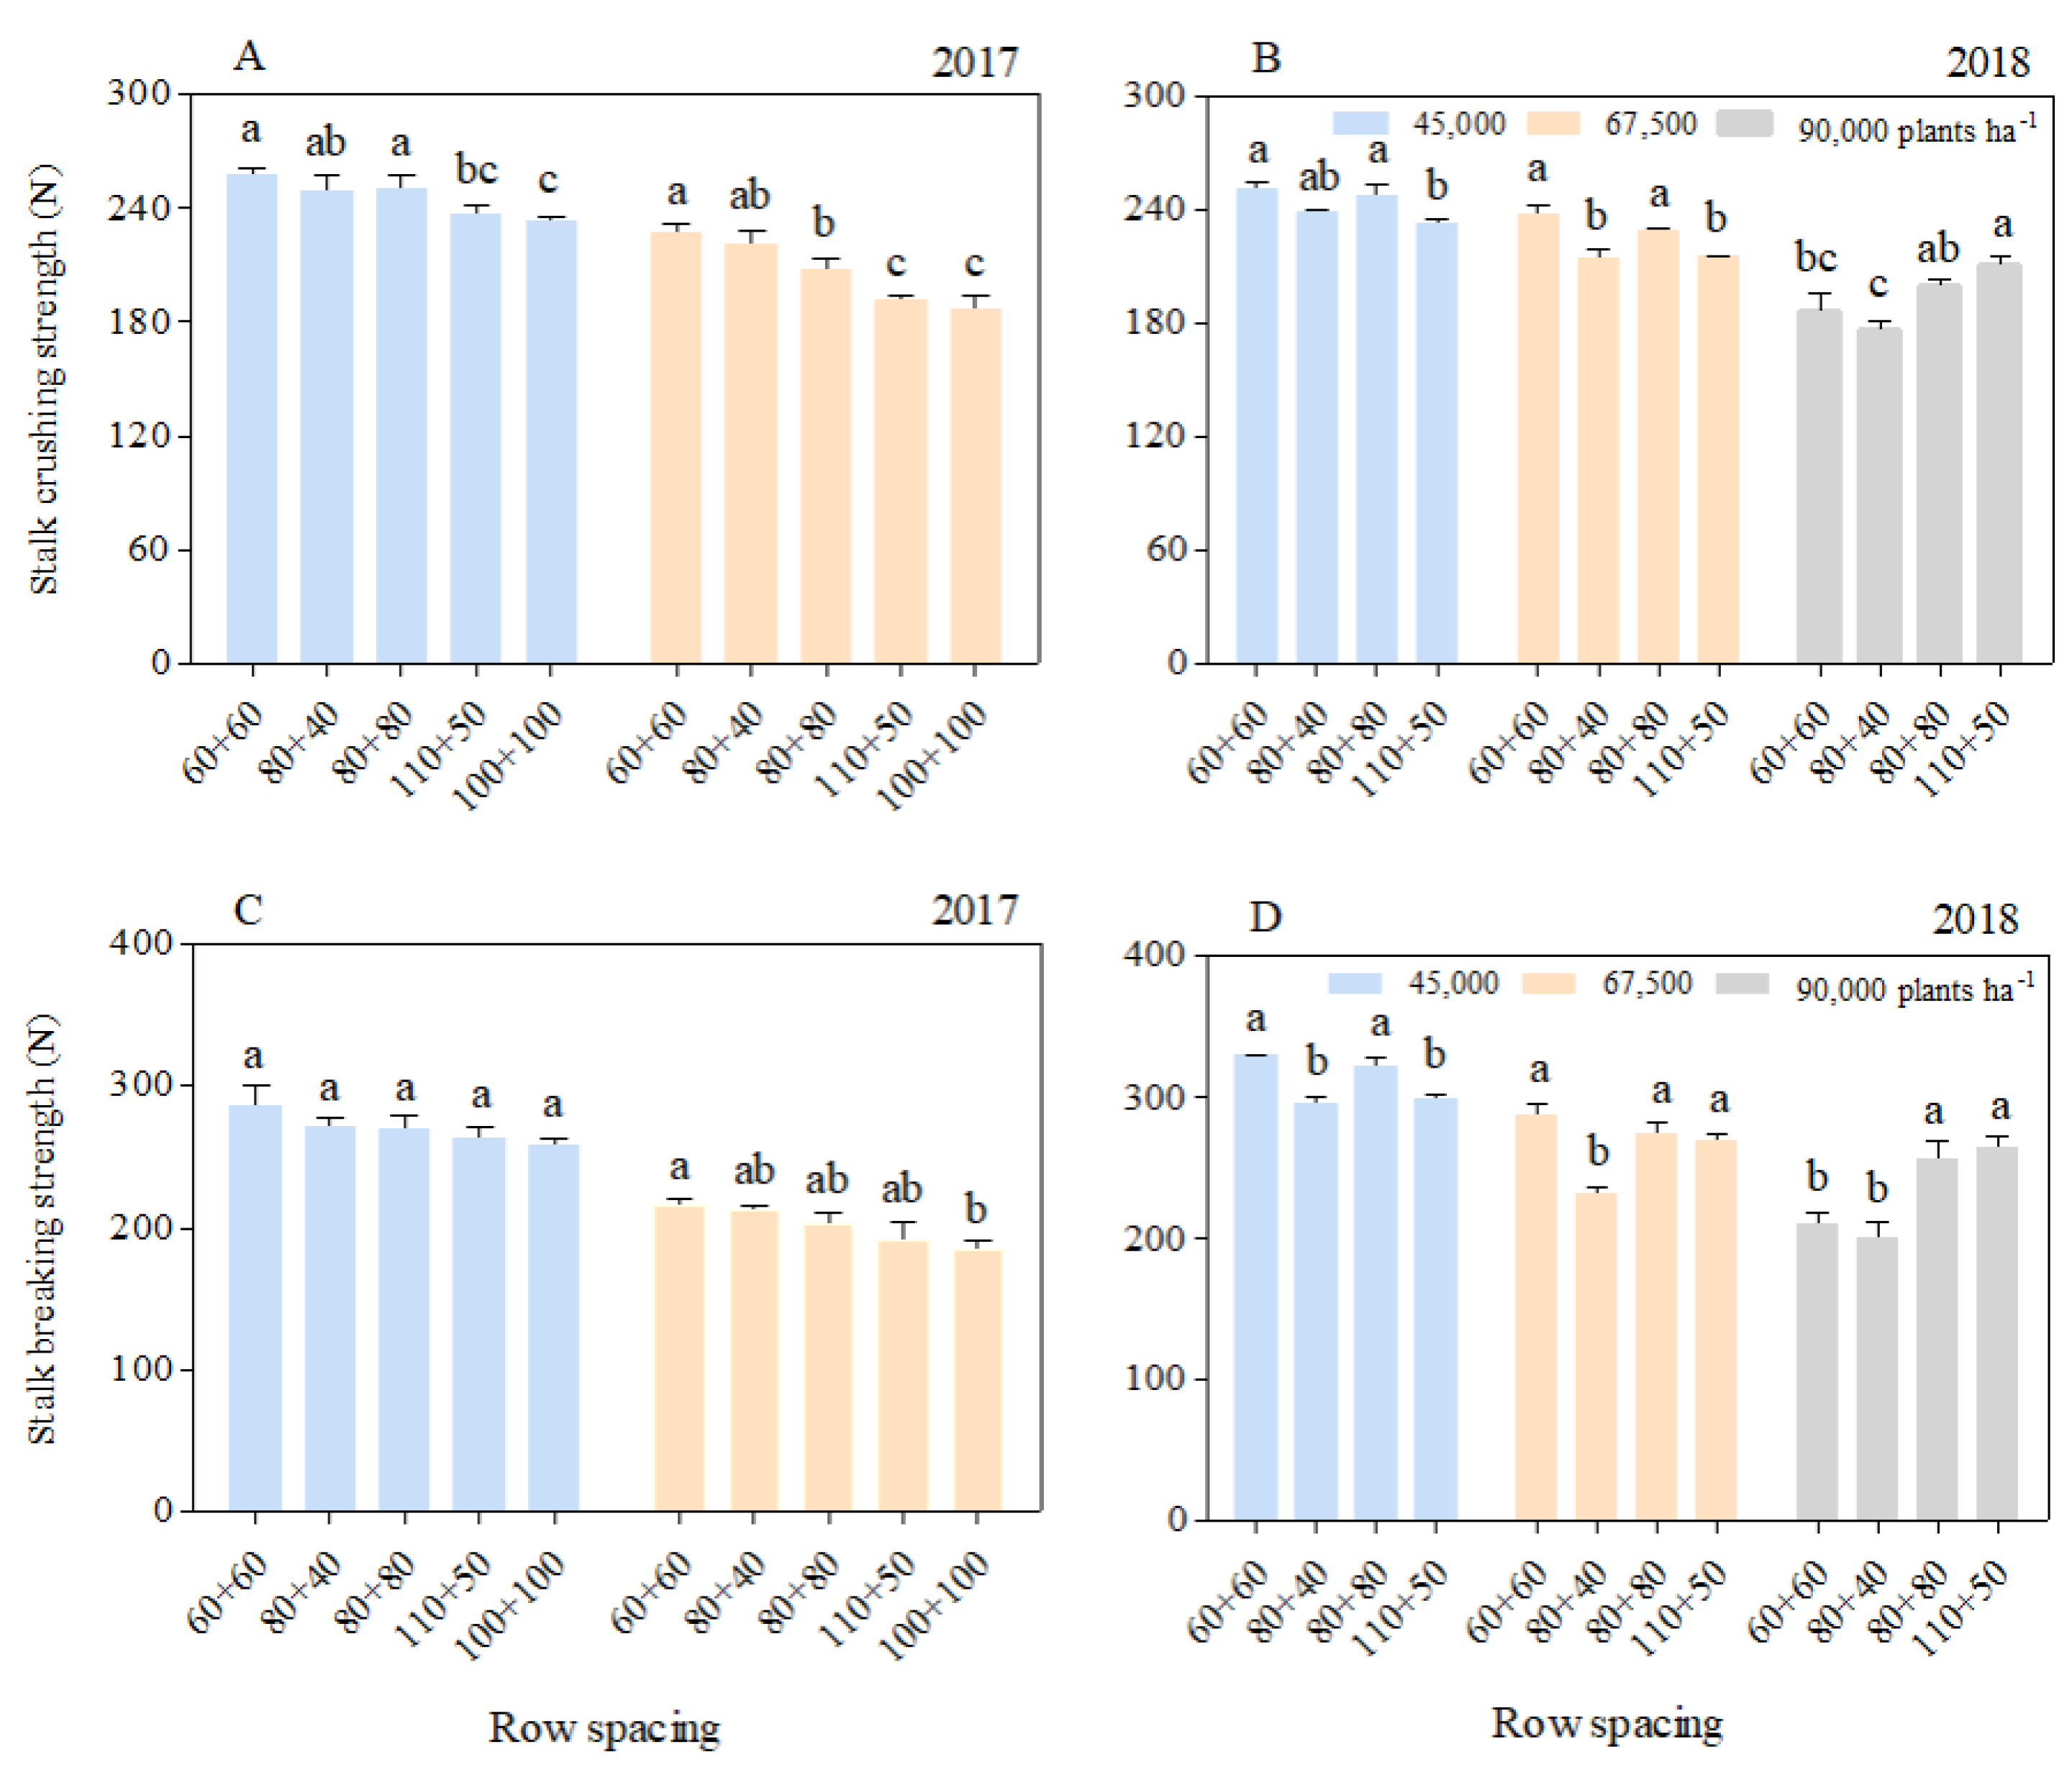
The stalk crushing strength (SCS) and stalk breaking strength (SBS) of each basal internode decreased significantly with the increasing planting density. At the 45,000 and 67,500 plants ha−1 densities, the SCS and SBS of the equal row spacing treatments were greater than those of the wide–narrow row spacing treatments, with those in the 60 + 60 row spacing being the largest. However, at the 90,000 plants ha−1 density, the SCS and SBS with the 60 + 60 row spacing were greater than those with the 80 + 40 row spacing. In addition, the SCS and SBS with the 110 + 50 row spacing were higher than those with the other row spacing treatments (Figure 2).
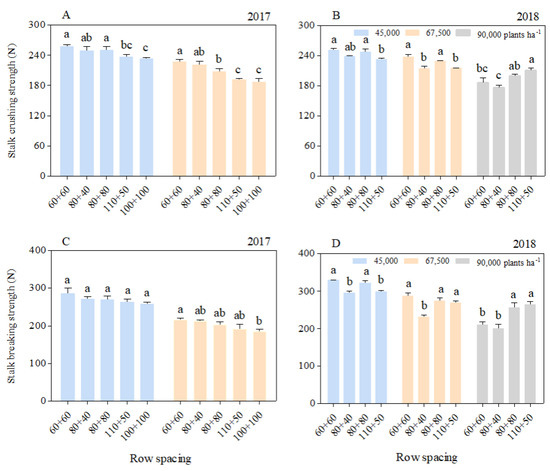
Figure 2.
Effects of planting density and row spacing on the SCS and SBS of basal internodes. Note: The data in the figure are the average values of the 3rd, 5th, and 7th basal internodes. (A)—stalk crushing strength at the silking stage in 2017; (B)—stalk crushing strength at the silking stage in 2018; (C)—stalk breaking strength at the silking stage in 2017; (D)—stalk breaking strength at the silking stage in 2018. Different small letters above the bars indicate a significant difference at the 0.05 level among treatments.
As the internode position increased, the SCS (Figure S2A,C) and SBS (Figure S2B,D) of the 3rd (S3), 5th (S5), and 7th (S7) internodes decreased. Averaging S3, S5, and S7, the SCS and SBS at the 67,500 plants ha−1 density in 2017 were 15.76%, 25.39% (silking stage), and 12.64%, respectively, being 29.16% (filling stage) lower than those at the 45,000 plants ha−1 density. In 2018, compared with the densities of 45,000 and 67,500 plants ha−1, the SCS at the 90,000 plants ha−1 density decreased by 20.12% and 13.60% (silking stage) and 28.90% and 13.17% (filling stage), respectively, and the SBS decreased by 25.12% and 12.25% (silking stage) and 25.12% and 13.91% (filling stage), respectively.
3.6. Stalk Lodging and Folding Rates and Grain Yield
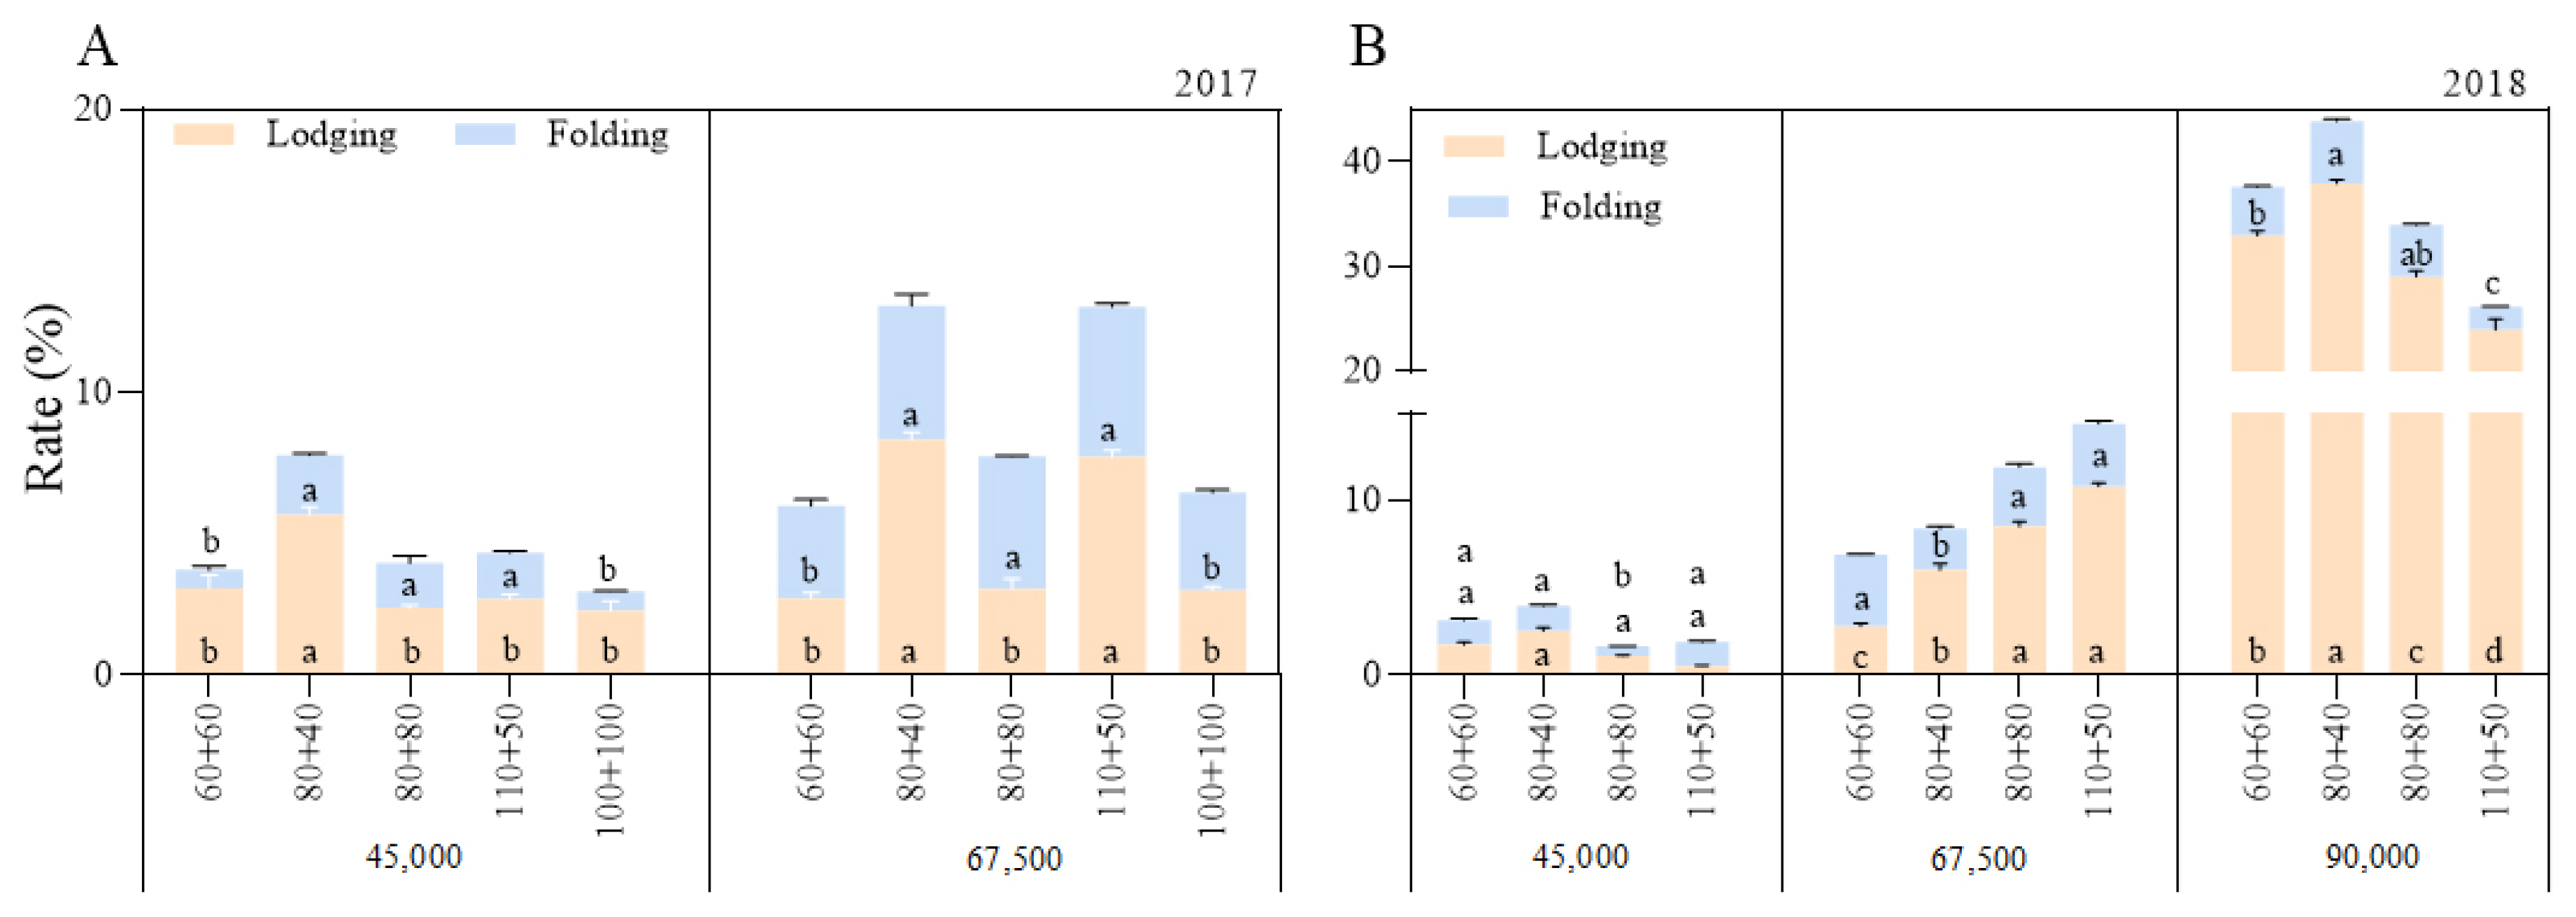
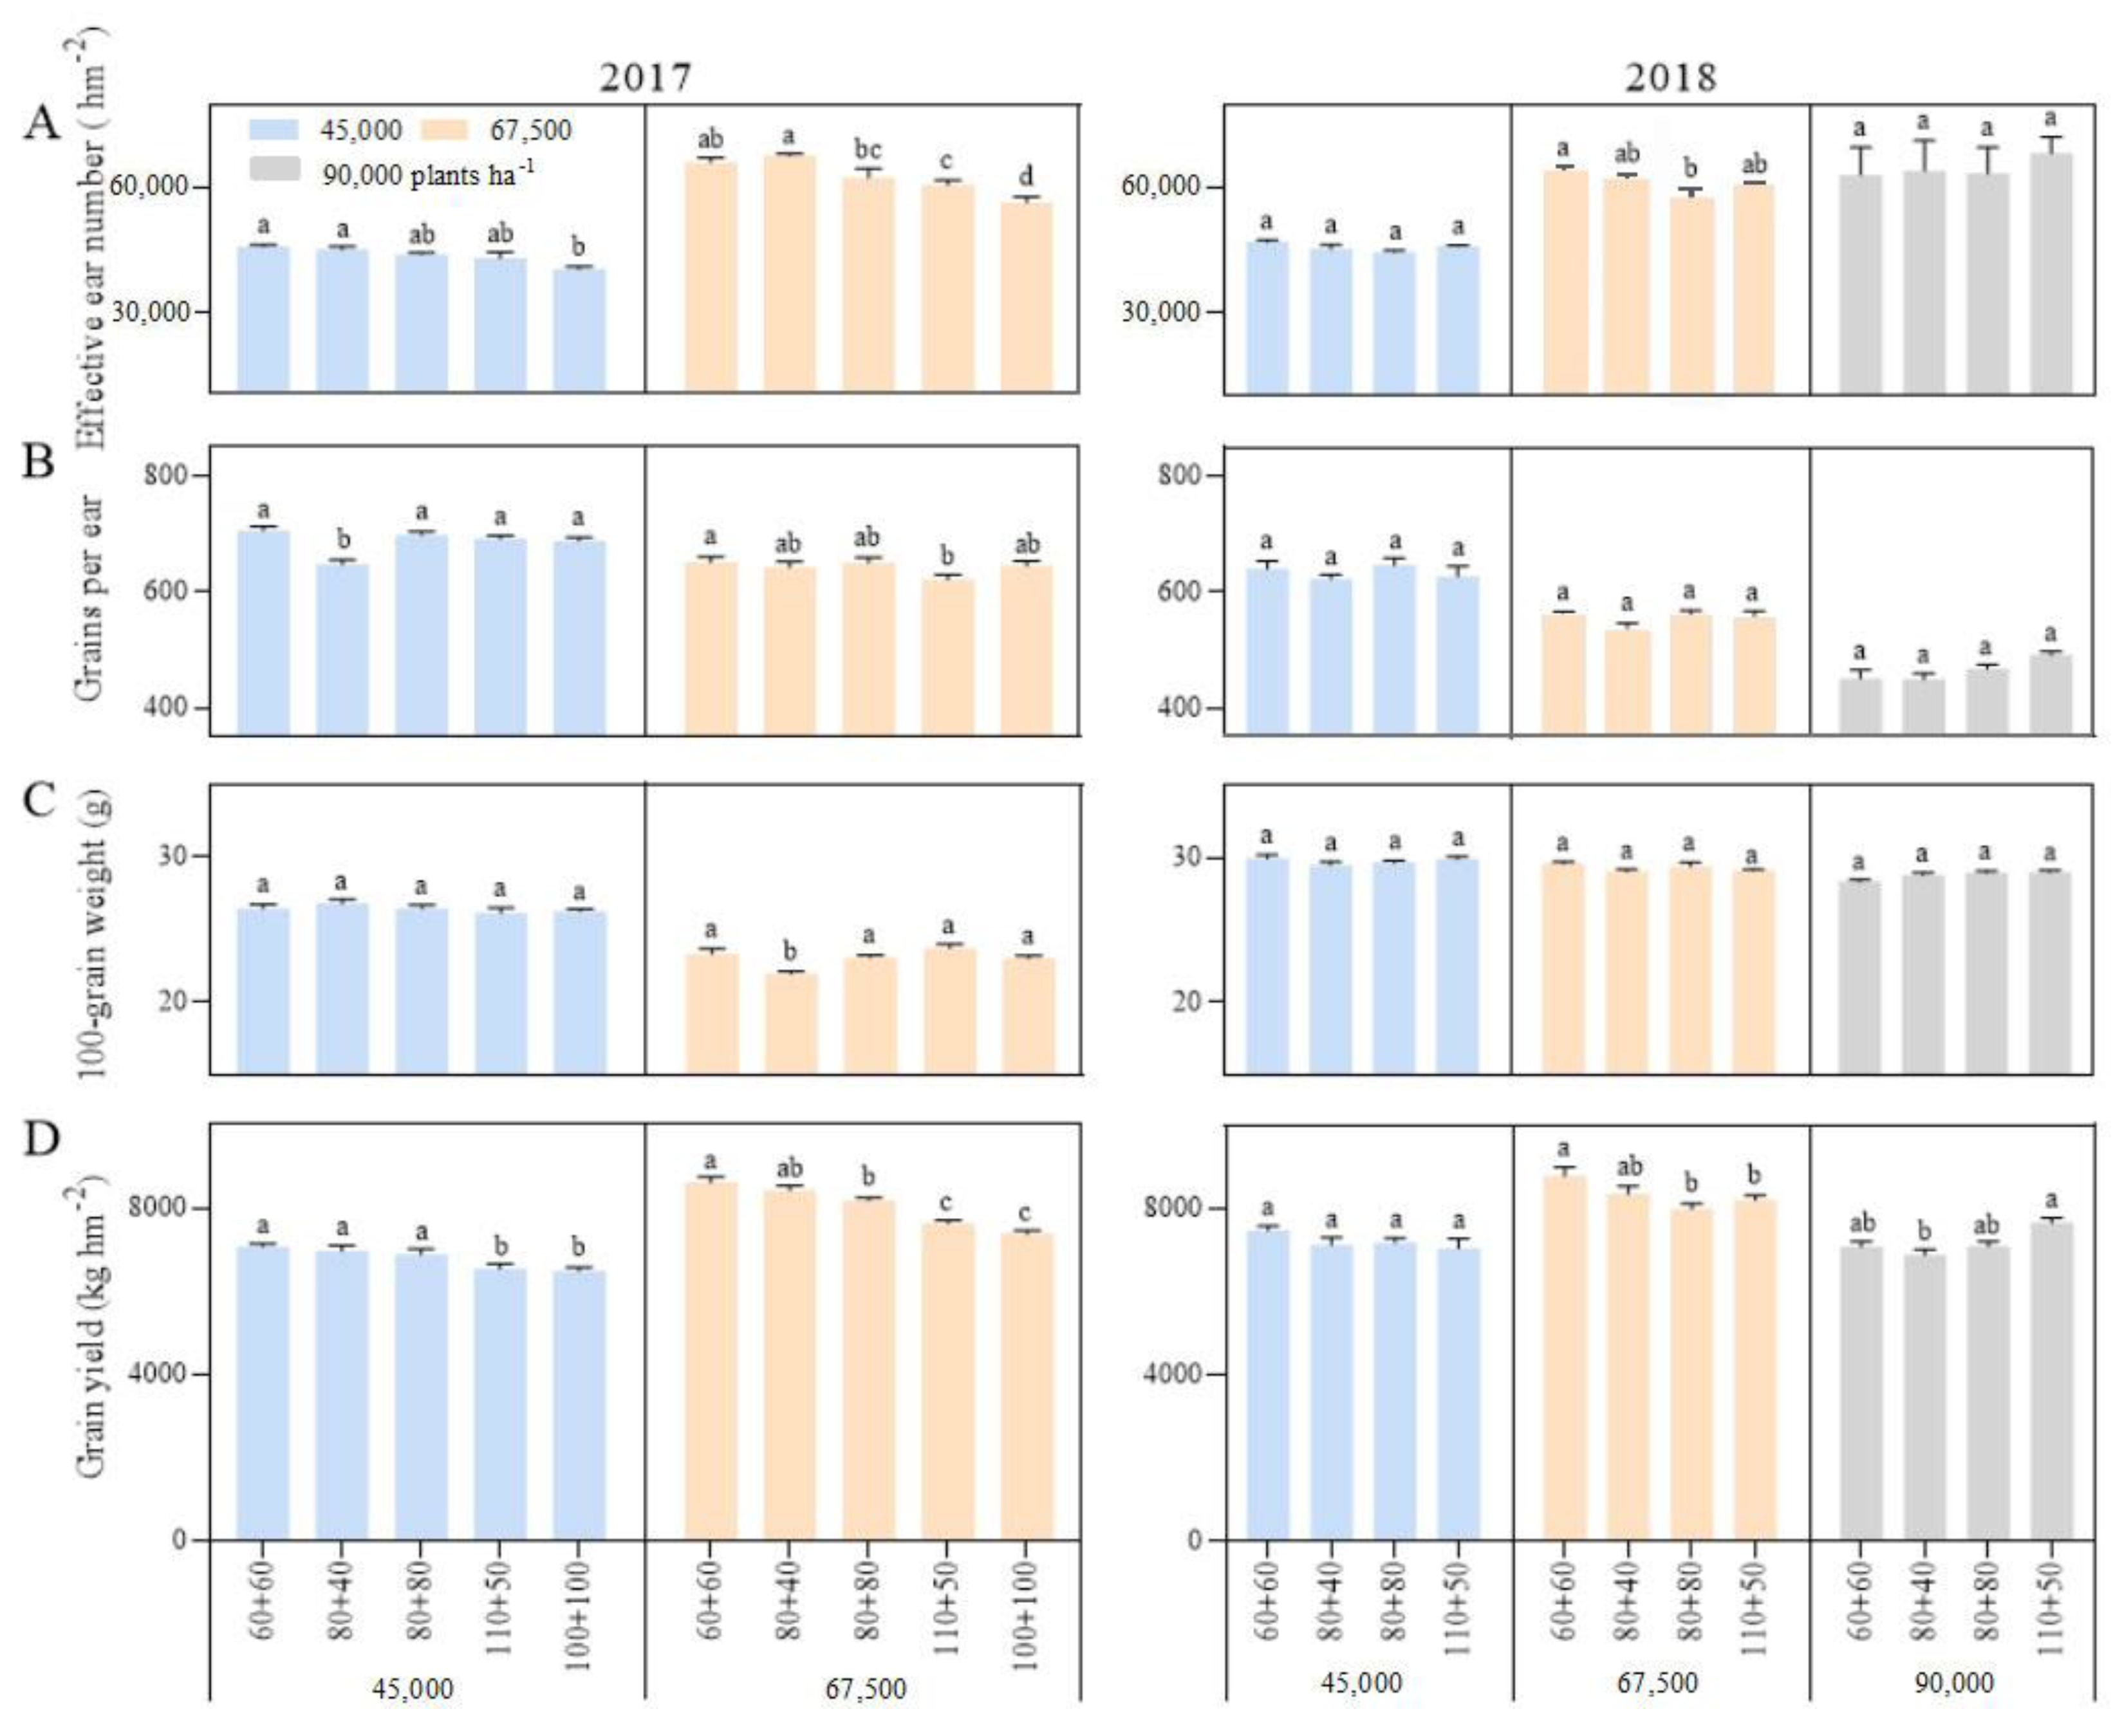
As the planting density increased, the stalk lodging and folding rates increased (Figure 3), and although the grain yield increased initially, it later decreased (Figure 4). In general, under the A1 and A2 planting densities, the stalk lodging and folding rates were slightly lower under the equal row spacing than under the wide–narrow row spacing (except the folding rate under the 67,500 plants ha−1 density in 2018). However, the lodging and folding rates with the 80 + 80 cm row spacing were higher than those with the 110 + 50 cm row spacing under the 90,000 plants ha−1 density. This showed that the 60 + 60 cm row spacing enhanced the stalk lodging resistance and led to a higher grain yield under medium (67,500 plants ha−1) and low (45,000 plants ha−1) densities, while the 110 + 50 cm row spacing improved the stalk lodging resistance and led to a higher grain yield under high density (90,000 plants ha−1).
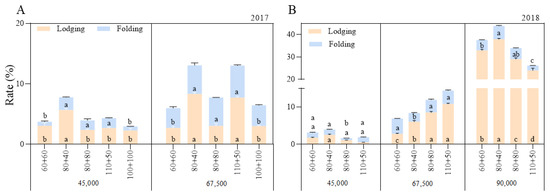
Figure 3.
Effects of planting density and row spacing on lodging and folding rates. Note: (A)—the stalk lodging and folding rates in 2017; (B)—the stalk lodging and folding rates in 2018. The means of treatments were compared based on the Tukey test at a probability level of 0.05. In the same year, different lowercase letters indicate a significant difference.
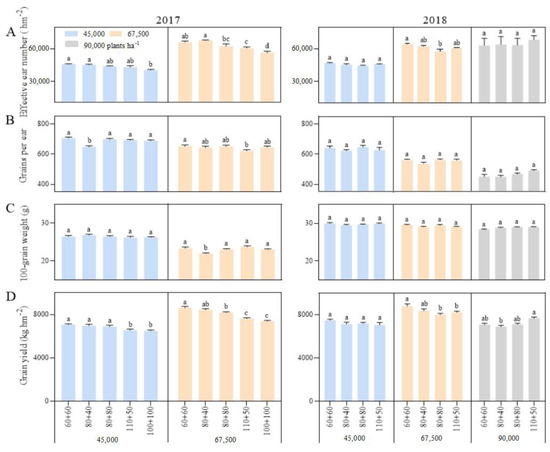
Figure 4.
Effects of planting density and row spacing on grain yield and its components. Note: (A)—the effcetive ear number in 2017 (left) and 2018 (right); (B)—the grains per ear in 2017 (left) and 2018 (right); (C)—the 100-grain weight in 2017 (left) and 2018 (right); (D)—the grain yield in 2017 (left) and 2018 (right). The means of treatments were compared based on the Tukey test at a probability level of 0.05. In the same year, different lowercase letters indicate a significant difference.
The correlation between the grain yield and the stalk lodging and folding rates was not significant. However, further regression analysis showed that the relationship between grain yield (Y) and folding rate (X) was a quadratic convex function, and the corresponding regression equation was Y = 6008.7 + 1100.30X − 153.286X2 (p = 0.0052, N = 22). Further, when the folding rate exceeded 3.50%, the maize yield decreased rapidly. Stalk lodging first affected the earing and reduce the number of effective ears. The earing rate (the ratio of effective ear number to the number of plants planted) was negatively correlated with the lodging and folding rates, with correlation coefficients of −0.6100 ** and −0.2595 ** (n = 66), respectively. The earing rate decreased by 0.86 and 3.68 percent with a one percentage increase in the lodging and folding rates, respectively. Secondly, the grain filling and setting of lodging plants would be affected, which could lead to a decrease in the grain number per ear and 100-grain weight. The correlation coefficients of grains per ear and 100-grain weight with lodging rate in 2017 were −0.3542 ** (n = 30) and −0.5996 ** (n = 36), respectively, while those in 2018 were −0.6593 ** and −0.7890 **, respectively. Therefore, stalk lodging and folding decreased the grain yield by reducing the yield components of maize, especially the number of effective ears.
3.7. Relationship between Lodging Rate and Basal Internode Characteristics of Maize
The stalk lodging and folding rates of maize were positively correlated with the length of basal internodes at the silking stage and negatively correlated with their dry weight and DWUL, lignin and cellulose contents, SCS, and SBS (almost similar to the results of the filling stage) (Table 5). Most of the correlations, especially of the folding rate, were significant (p < 0.05). In addition, the stalk folding rate was significantly negatively correlated with cortical and mechanical tissue thickness and the number and area of small vascular bundles. These results indicated that the planting density and row spacing affected the stalk folding rate and lodging resistance by influencing the morphology, dry matter constituents (especially structural material) accumulation, anatomical structure, and mechanical strength of maize basal internodes.
Table 5.
Correlation between maize lodging and basal internode characteristics.
3.8. Relationships between Basal Internode Characteristics, Lodging Resistance, and Light Transmittance in Maize Populations
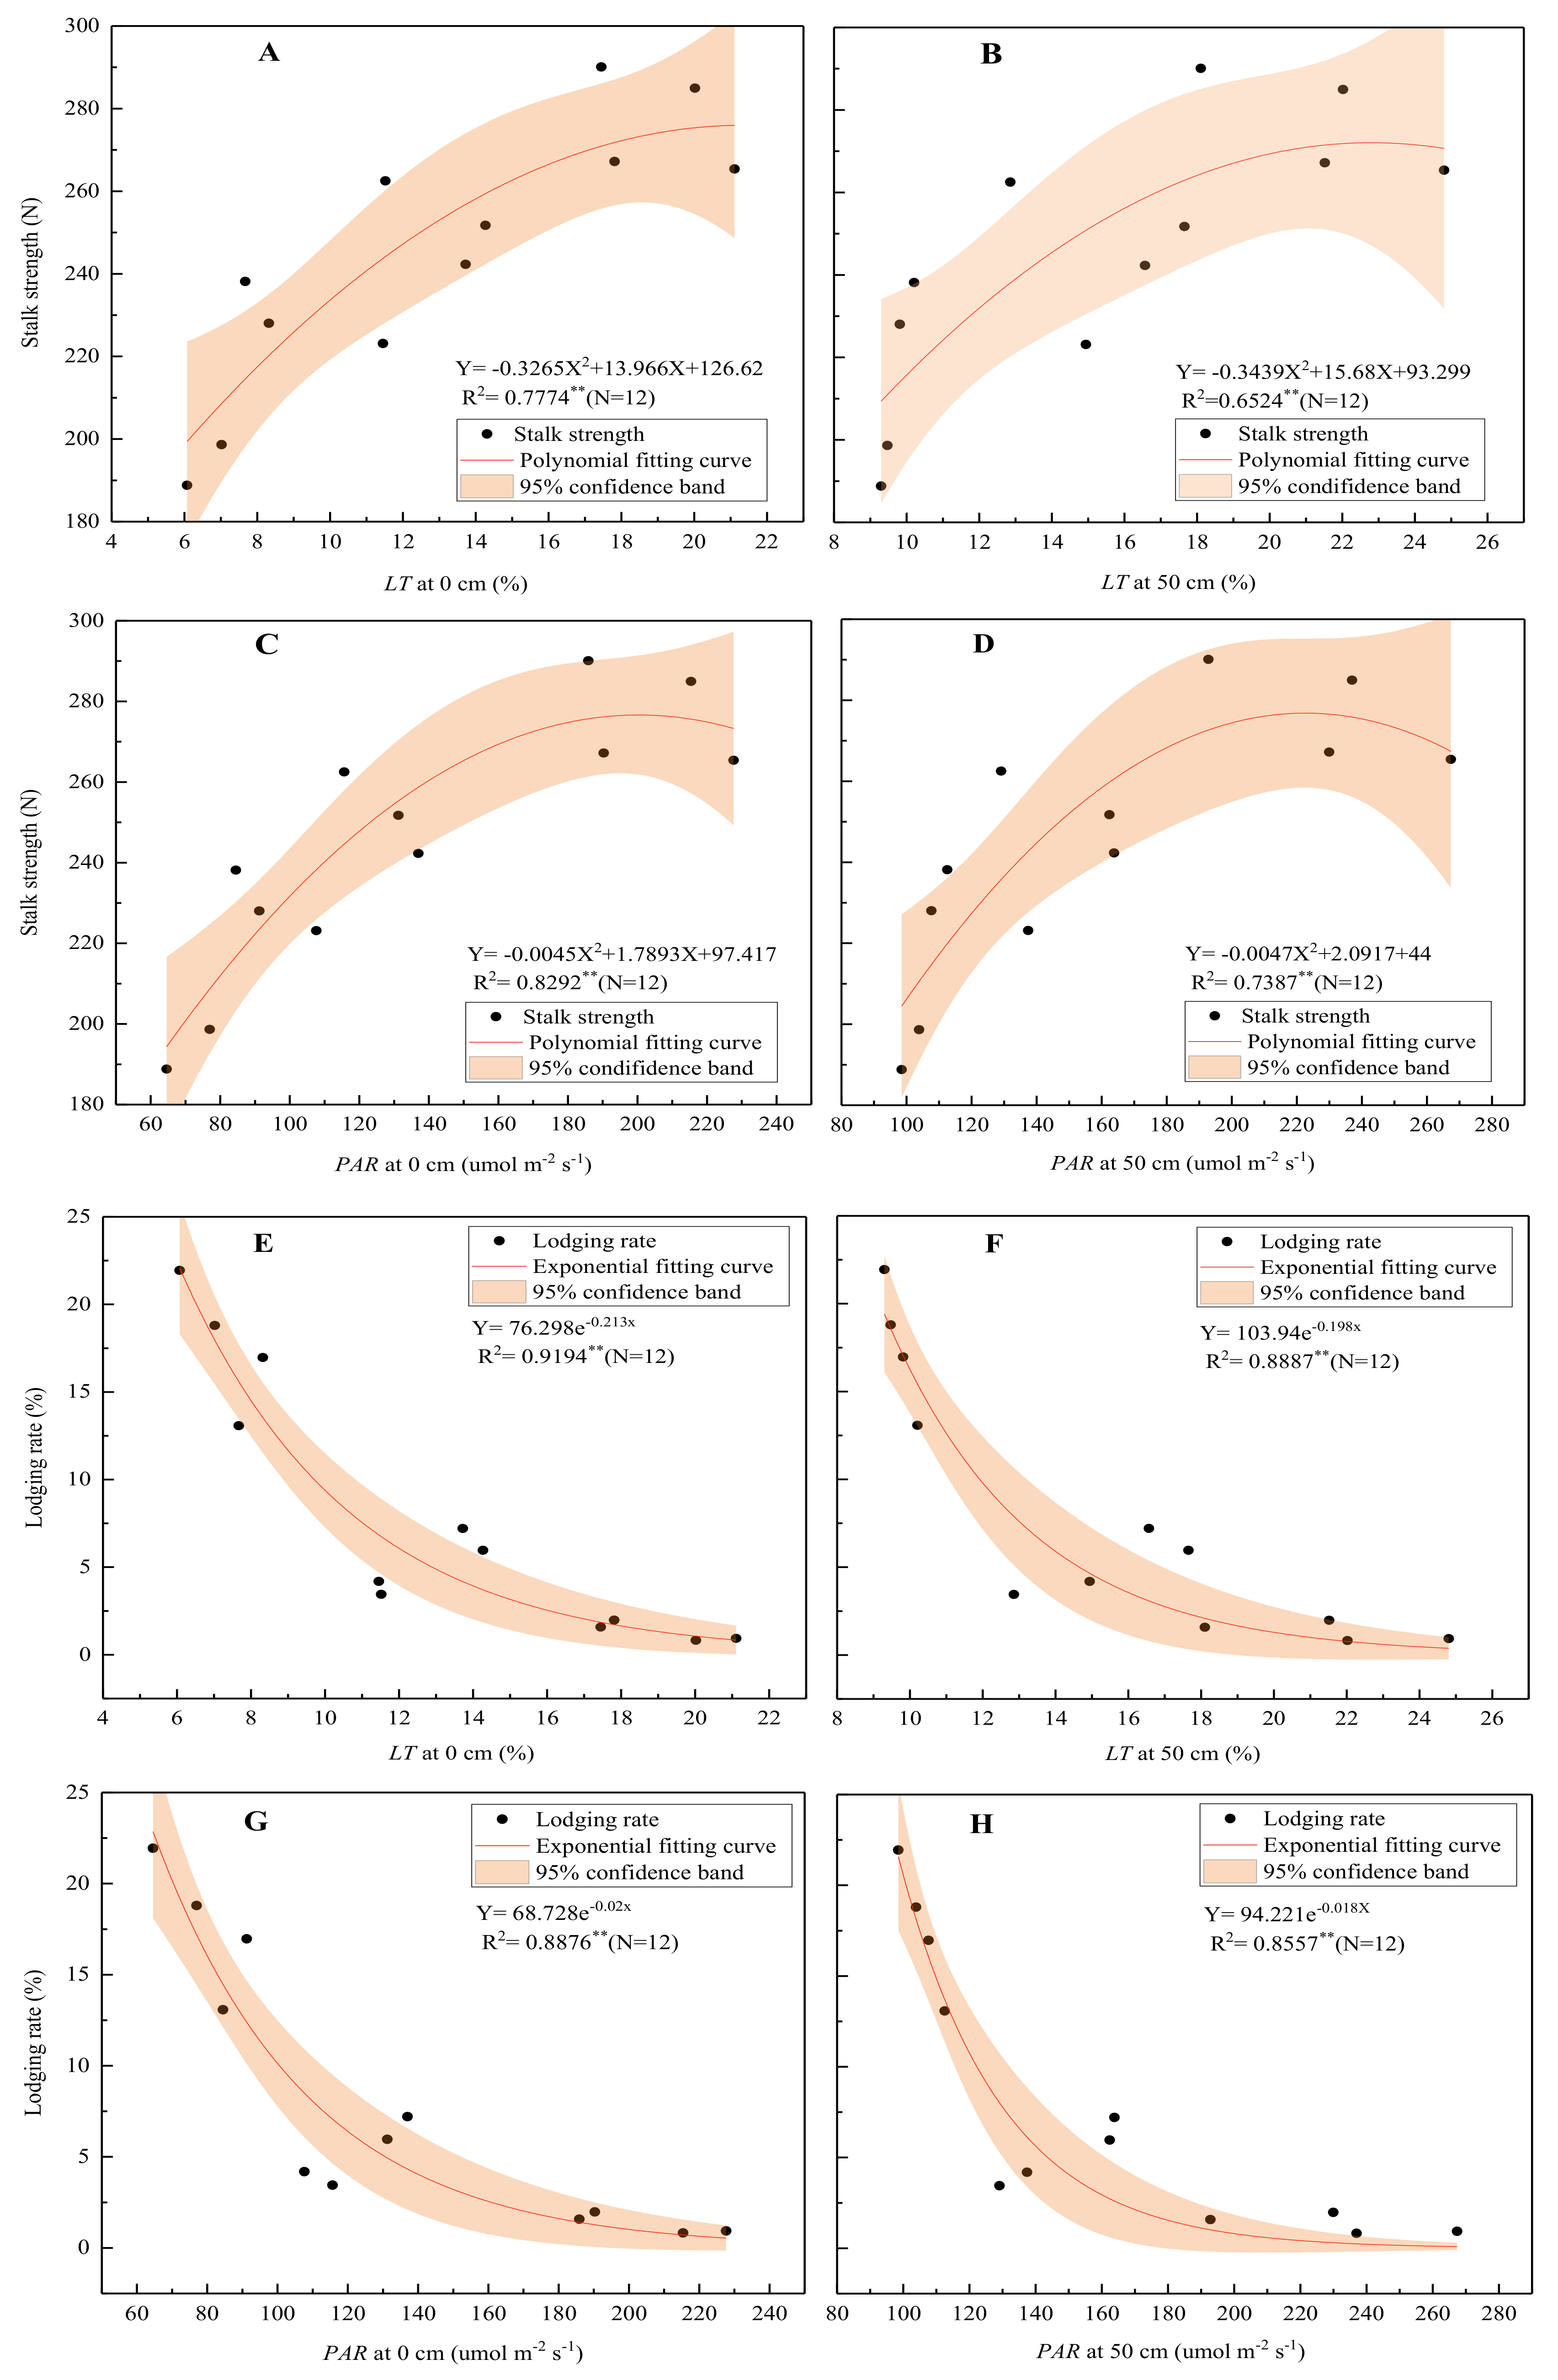
The correlation analysis (Table 6) indicated that the LT and PAR in the lower part of the maize population were significantly negatively correlated with the basal internode length and significantly positively correlated with its diameter, dry weight, DWUL, and lignin and cellulose contents and the Tm and Tc of the maize. Contrastingly, K exhibited trends opposite to those of LT. Increasing transmittance and PAR in the lower part of the maize population could shorten the basal internode length and increase its diameter, dry matter weight, lignin and cellulose contents, and cortical and mechanical tissue thickness. Further analysis found that the relationships between the SCS of the basal internodes, the stalk lodging rate, and the LT and PAR were not linear. The LT and PAR exhibited a quadratic function relationship with the stalk strength (Figure 5A–D) and an exponential function relationship with the stalk lodging rate (Figure 5E–H). As the LT increased, the SCS increased and the lodging rate decreased, but this decreased gradually. When the LT at 50 cm above the ground at the silking stage was greater than 14.20%, the PAR was more than 148.50 µmol m−2 s−1, and the lodging rate was less than 5.00%.
Table 6.
Correlation between stem characteristics, lodging rate, extinction coefficient, and light transmittance.
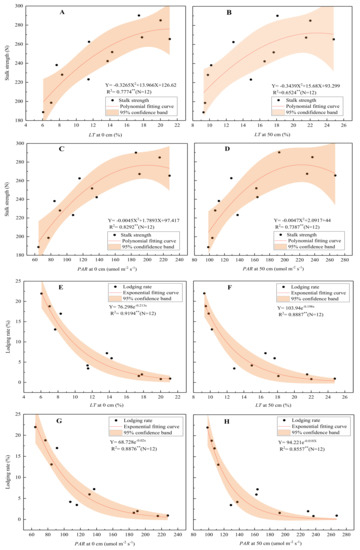
Figure 5.
Relationship between stalk strength (A–D), lodging rate (E–H), and light transmittance. Note: The stalk strength is the average value of the stalk crushing and breaking strengths between the 3rd, 5th, and 7th internodes; the lodging rate is the average value of the lodging and folding rates.
4. Discussion
4.1. Light Transmittance Is an Important Ecological Factor Influencing Basal Internode Characteristics and Lodging Resistance of Maize
Previous studies have shown that shading reduces the light amount in maize populations, decreases the DWUL and RPS of the 3rd internode, and increases the field lodging rates significantly [15,16]. Yang et al. [16] found through studies of shading and adjusting planting density that the amount of light intercepted was positively correlated with the stalk strength and negatively correlated with the lodging rate; for every 1 MJ m−2 reduction in the total intercepted PAR, the SBS and RPS decreased by 0.0667 N and 0.075 N, respectively, while the lodging rate increased by 0.17%. The present study found that the K and LT in the lower part (0 cm and 50 cm above the ground) of the maize population significantly correlated with the basal internode length and diameter, DWUL, lignin and cellulose contents, and cortical and mechanical tissue thickness under natural conditions. By reducing the K and increasing LT in the lower part of maize population, the basal internodes shortened and thickened, the lignin and cellulose contents improved, the cortical and mechanical tissue thickness increased, and the mechanical strength was enhanced; consequently, the lodging rate decreased. The light could inhibit cell elongation [27], shorten the internode length [28,29], promote lignin synthesis [30], and enhance the mechanical strength of the stem [15,16]. This may be one of the important physiological mechanisms for light to enhance the lodging resistance of crop stems.
However, the predecessors only reported a simple correlation between the light intensity and the mechanical strength of stems and the lodging resistance. Nevertheless, this study established the relationships between not only PAR and the mechanical strength of basal internodes but also LT and basal internode mechanical strength and lodging rate and found that the relationship between the lodging rate (mechanical strength of basal internodes) and LT and PAR was not linear but exponential (a quadratic) (Figure 5A–H). As the LT and PAR in the lower part of the population increased, the mechanical strength of the basal internodes increased and the lodging rate decreased; however, the extent of the increase or decrease reduced gradually. Excessively high LT would not further reduce the lodging rate but would reduce the absorption and utilization of light energy by maize [31,32], which would thus reduce the maize yield. Therefore, proper LT could be a crucial factor to balance high grain yield and stalk lodging resistance, which, at 50 cm above the ground at the silking stage, was about 14.2% under these test conditions. In addition, it is more practical and versatile to use LT in the lower part of a maize population to develop field management than PAR because PAR is not only affected by cultivation measures but also varies with the geographical location.
4.2. Planting Density and Row Spacing Influence Stalk Lodging Resistance by Regulating the Light Distribution in Maize Populations
Although the planting density improves the maize yield, it also affects maize stem development and lodging resistance [11,33]. Adjusting the row spacing could improve the population structure of maize [34,35] and reduce the lodging rate to a certain extent [31]. The present study showed that as the planting density increased, the basal internodes became longer and thinner, the DWUL decreased, the thickness of cortical and mechanical tissues reduced, the number and area of large and small vascular bundles declined, the lignin and cellulose contents lowered, the crushing and breaking strengths decreased, and the lodging and folding rates increased. However, appropriate row spacing, despite the high plant density, improved these stem characteristics to a certain extent and reduced the lodging and folding rates.
Maddonni et al. [18] and Qi et al. [19] found that by adjusting the row spacing, the light conditions in the maize population improved. In the present study, the planting density and row spacing both affected the LT and PAR in the lower part of the population and K. The PAR and LT decreased with the increasing plant density but increased as the row spacing increased, showing a linear and quadratic function relationship with row spacing, respectively. Compared with Qi et al. [19], the interaction effect of row spacing and density and the quantitative relationship between row spacing and basal PAR and LT were further analyzed in this study. It was found that appropriate row spacing could improve the light distribution in dense maize plantations and increase PAR in the lower part of the population. This in turn would improve the morphological and anatomical characteristics of the basal internodes [36], enhance the dry matter constituent accumulation (especially structural carbohydrates such as lignin and cellulose), and improve the mechanical strength [12,37], thereby reducing the lodging rate, which is one of the key physiological mechanisms in improving lodging resistance.
4.3. Optimizing Row Spacing Is an Important Strategy for Lodging Resistance and High Yield in Dense Maize Plantations
Light plays a key role in plant growth and development. Low light levels not only affect the photosynthesis rate and yield in maize but also reduce its lodging resistance [16] and promote diseases [38]. A high planting density increases the maize yield by increasing the leaf area and effective panicles, but it might increase shading conditions in the lower parts of the maize population, affect the development of basal internodes, and reduce the lodging resistance [11,33]. As mentioned in Section 4.2, optimizing row spacing could increase the PAR and LT in the lower part of maize populations, consequently reducing the stalk lodging and folding rates, promoting grain filling and setting, improving yield components, and increasing the maize yield (Figure 4), which is particularly important in low-light regions. In recent years, China has frequently experienced dimming due to the increasing aerosol pollution associated with rapid urbanization and economic development [39]. Therefore, we should focus not only on increasing plant density but also on optimizing row spacing to improve the stalk lodging resistance.
The appropriate row spacing varied with the ecological conditions and planting density. Our results showed that at densities of 45,000 and 67,500 plants ha−1, the 60 + 60 cm equal row spacing led to higher lodging resistance and grain yield, which may be related to the uniform light distribution on both sides of the spacing. However, at the 90,000 plants ha−1 density, which exhibited high shading, expanding the wide row spacing further was necessary to increase PAR in the lower part of the maize population, so the 110 + 50 cm row spacing treatment led to a higher SCS and SBS, lower stalk lodging and folding rates, and a higher grain yield than other row spacing treatments did. In addition, the grain yield at the 90,000 plants ha−1 density was lower than that at the 67,500 plants ha−1 density due to its heavy lodging, which was related to the low-light conditions in the Sichuan Basin. The 67,500 plants ha−1 density with 60 + 60 cm row spacing that moderately increased the planting density and optimized the row spacing based on traditional local planting practices was the best combination strategy, which not only showed stronger stalk lodging resistance and the highest grain yield but was also suitable for mechanical harvest [6]. However, its molecular mechanism of lodging resistance (i.e., key enzyme activity and gene expression on the synthesis of structural carbohydrates such as lignin and cellulose in basal internodes) and the physiological mechanism of yield increase need to be further explored.
5. Conclusions
Increasing the planting density of maize would reduce LT, affect the stalk morphology and anatomical structure, reduce dry matter constituents and mechanical strength, and increase the stalk lodging rate. Appropriate row spacing could improve the light distribution in a population to a certain extent, particularly in low-light areas; optimize the stalk characteristics; and enhance the lodging resistance. The stalk lodging rate (stalk strength) showed an exponential function (quadratic function) relationship with LT and PAR in the lower part of the maize population. The planting density and row spacing affected the stalk characteristics and lodging resistance ability by affecting the basal LT and PAR of the maize populations. Further, the appropriate row spacing varied across different planting densities. The optimal strategy for high stalk lodging resistance and grain yield under this experimental condition was the 67,500 plants ha−1 density with 60 + 60 cm equal row spacing.
Supplementary Materials
The following supporting information can be downloaded at: https://www.mdpi.com/article/10.3390/agronomy13020462/s1, Figure S1: Figure of normal distribution Q-Q of major traits and its normality test; Figure S2: Effects of planting density and row spacing on SCS and SBS of basal internodes; Table S1: Effects of density and row spacing on the internode length (cm); Table S2: Effects of density and row spacing on the internode diameter (cm); Table S3: Effects of density and row spacing on the internode dry weight (g cm−1); Table S4: Effects of density and row spacing on the internode length stem density (g cm−1); Table S5: Effects of density and row spacing on basal internode lignin content of maize (%); Table S6: Effects of density and row spacing on basal internode cellulose content of maize (%).
Author Contributions
Conceptualization, J.Y. and Z.L.; methodology, J.Y., R.J. and F.K.; investigation, R.J., F.L. and T.L.; formal analysis, J.Y., R.J., X.W. and F.L.; data curation, J.Y., R.J., Z.L. and X.W.; writing—original draft preparation, R.J. and J.Y.; writing—review and editing, J.Y., X.W., Q.L. and D.F. All authors have read and agreed to the published version of the manuscript.
Funding
This work was financially supported by the State Key Research and Development Program of China (2018YFD0301206, 2016YFD0300307, and 2017YFD0301704).
Data Availability Statement
Not applicable.
Conflicts of Interest
The authors declare no conflict of interest.
References
- Cheng, Y.; Zhao, J.; Liu, Z.; Huo, Z.; Liu, P.; Dong, S.; Zhang, J.; Zhao, B. Modified fertilization management of summer maize (Zea mays L.) in northern China improves grain yield and efficiency of nitrogen use. J. Integr. Agric. 2015, 14, 1644–1657. [Google Scholar] [CrossRef]
- Li, Q.; Wu, Y.W.; Chen, W.; Jin, R.; Kong, F.L.; Ke, Y.P.; Shi, H.C.; Yuan, J.C. Cultivar differences in root nitrogen uptake ability of maize hybrids. Front. Plant Sci. 2017, 8, 1060. [Google Scholar] [CrossRef] [PubMed]
- Jia, Q.; Xu, Y.; Ali, S.; Sun, L.; Ding, R.; Ren, X.; Zhang, P.; Jia, Z. Strategies of supplemental irrigation and modified planting densities to improve the root growth and lodging resistance of maize (Zea mays L.) under the ridge-furrow rainfall harvesting system. Field Crops Res. 2018, 224, 48–59. [Google Scholar] [CrossRef]
- Tokatlidis, I.S.; Koutroubas, S.D. A review of maize hybrids’ dependence on high plant populations and its implications for crop yield stability. Field Crops Res. 2004, 88, 103–114. [Google Scholar] [CrossRef]
- Wang, K.R.; Xie, R.Z.; Ming, B.; Hou, P.; Xue, J.; Li, S.K. Review of combine harvester losses for maize and influencing factors. Int. J. Agric. Biol. Eng. 2021, 14, 1–10. [Google Scholar] [CrossRef]
- Baker, C.J.; Berry, P.M.; Spink, J.H.; Bradley, R.S.; Griffin, J.M.; Scott, R.K.; Clare, R.W. A method for the assessment of the risk of wheat lodging. J. Theor. Biol. 1998, 194, 587–603. [Google Scholar] [CrossRef]
- Baker, C.J.; Sterling, M.; Berry, P. A generalised model of crop lodging. J. Theor. Biol. 2014, 363, 1–12. [Google Scholar] [CrossRef]
- Zhan, X.X.; Kong, F.L.; Liu, Q.L.; Lan, T.Q.; Liu, Y.Q.; Xu, J.Z.; Ou, Q.; Chen, L.; Kesse, G.; Kemoenaar, C.; et al. Maize basal internode development significantly affects stalk lodging resistance. Field Crops Res. 2022, 286, 108611. [Google Scholar] [CrossRef]
- Wang, C.; Ruan, R.W.; Yuan, X.H.; Hu, D.; Yang, H.; Li, Y.; Yi, Z.L. Effects of nitrogen fertilizer and planting density onthe lignin synthesis in the culm in relation to lodging resistance of buckwheat. Plant Prod. Sci. 2015, 18, 218–227. [Google Scholar] [CrossRef]
- Wang, Q.; Xue, J.; Chen, J.L.; Fan, Y.H.; Zhang, G.Q.; Xie, R.Z.; Ming, B.; Hou, P.; Wang, K.R.; LI, S.K. Key indicators affecting maize stalk lodging resistance of different growth periods under different sowing dates. J. Integr. Agric. 2020, 19, 2419–2428. [Google Scholar] [CrossRef]
- Zheng, Y.X.; Chen, D.; Wei, P.C.; Lu, P.; Yang, J.Y.; Luo, S.K.; Ye, K.M.; Song, B. Effects of planting density on lodging resistance and grain yield of spring maizestalks in Guizhou province. Acta Agron. Sin. 2021, 47, 738–751. [Google Scholar] [CrossRef]
- Xue, J.; Gou, L.; Shi, Z.G.; Zhao, Y.S.; Zhang, W.F. Effect of leaf removal on photosynthetically active radiation distribution in maize canopy and stalk strength. J. Integr. Agric. 2017, 16, 85–96. [Google Scholar] [CrossRef]
- Liu, X.L.; Ma, X.J.; Dou, P.; Huang, K.C.; Wang, X.L.; Zhang, D.; Kong, F.L.; Yuan, J.C. Effect of planting density on stem characteristics and yield of summer maize in the Hilly Central Sichuan Basin, China. Chin. J. Eco-Agric. 2017, 25, 356–364. [Google Scholar]
- Ren, H.; Jiang, Y.; Zhao, M.; Qi, H.; Li, C.F. Nitrogen supply regulates vascular bundle structure and matter transport characteristics of spring maize under high plant density. Front. Plant Sci. 2021, 11, 602739. [Google Scholar] [CrossRef]
- Xue, J.; Gou, L.; Zhao, Y.S.; Yao, M.N.; Yao, H.S.; Tian, J.S.; Zhang, W.F. Effects of light intensity within the canopy on maize lodging. Field Crops Res. 2016, 188, 133–141. [Google Scholar] [CrossRef]
- Yang, Y.S.; Guo, X.X.; Hou, P.; Xue, J.; Liu, G.Z.; Liu, W.M.; Wang, Y.H.; Zhao, R.L.; Ming, B.; Xie, R.Z.; et al. Quantitative effects of solar radiation on maize lodging resistance mechanical properties. Field Crops Res. 2020, 255, 107906. [Google Scholar] [CrossRef]
- Mohammadi, G.R.; Ghobadi, M.E.; Sheikheh-Poor, S. Phosphate biofertilizer, row spacing and plant density effects on maize (Zea mays L.) yield and weed growth. Am. J. Plant Sci. 2012, 3, 425–429. [Google Scholar] [CrossRef]
- Maddonni, G.A.; Otegui, M.E.; Cirilo, A.G. Plant population density, row spacing and hybrid effects on maize cannoy architecture and light attention. Field Crops Res. 2001, 71, 183–193. [Google Scholar] [CrossRef]
- Qi, B.Q.; Ma, B.Y.; Xue, J.; Li, B.X.; Hu, J.; Zhang, W.F.; Gou, L. Lodging resistance increased by varying the distance between adjacent maize rows. Agron. J. 2021, 113, 3315–3325. [Google Scholar] [CrossRef]
- Chen, S.H.; Chen, H.L.; Shen, X.S.; Liu, D.H. Effects of planting density and nitrogen amount on stalk lodging-resistance and yield of summer maize in Sichuan basin. Agric. Sci. Technol. 2012, 13, 2147–2151. [Google Scholar]
- Shi, D.Y.; Li, Y.H.; Zhang, J.W.; Liu, P.; Zhao, B.; Dong, S.T. Effects of plant density and nitrogen rate on lodging-related stalk traits of summer maize. Plant Soil Environ. 2016, 62, 299–306. [Google Scholar] [CrossRef]
- Yang, J.S.; Geng, W.J.; Zhang, J.W.; Ren, B.Z.; Wang, L.C. Responses of the lodging resistance of summer maize with different gene types to plant density. Agronomy 2022, 12, 10. [Google Scholar] [CrossRef]
- Xue, J.; Qi, B.Q.; Ma, B.Y.; Li, B.X.; Gou, L. Effect of altered leaf angle on maize stalk lodging resistance. Crops Sci. 2021, 61, 689–703. [Google Scholar] [CrossRef]
- Li, G.H.; Zhong, X.H.; Tian, K.; Huang, N.R.; Pan, J.F.; He, T.H. Effect of nitrogen application on stem lodging resistance of rice and its morphological and mechanical mechanisms. Sci. Agric. Sin. 2013, 46, 1323–1334. [Google Scholar]
- Gao, J.F. Plant Physiology Experiment Guidance; Higher Education Press: Beijing, China, 2006; pp. 105–107. [Google Scholar]
- Jiang, T.D. Lignin, 2nd ed.; Chemical Industry Press: Beijing, China, 2009; pp. 88–103. [Google Scholar]
- Ma, Q.Q.; Wang, X.H.; Sun, J.B.; Mao, T.L. Coordinated regulation of hypocotyl cell elongation by light and ethylene through a microtubule destabilizing protein. Plant Physiol. 2018, 176, 678–690. [Google Scholar] [CrossRef]
- Zhong, X.H.; Liang, K.M.; Peng, B.L.; Tian, K.; Li, X.J.; Huang, N.R.; Liu, Y.Z.; Pan, J.F. Basal internode elongation of rice as affected by light intensity and leaf area. Crops J. 2020, 8, 62–70. [Google Scholar] [CrossRef]
- Xu, Y.; Wang, C.; Zhang, R.; Ma, C.M.; Dong, S.K.; Gong, Z.P. The relationship between internode elongation of soybean stems and spectral distribution of light in the canopy under different plant densities. Plant Prod. Sci. 2021, 24, 326–338. [Google Scholar] [CrossRef]
- Su, G.X.; An, Z.F.; Zhang, W.H.; Liu, Y.L. Light promotes the synthesis of lignin through the production of H2O2 mediated by diamine oxidases in soybean hypocotyls. J. Plant Physiol. 2005, 162, 1297–1303. [Google Scholar] [CrossRef]
- Chang, J.F.; Zhang, H.H.; Li, H.P.; Dong, P.F.; Li, C.H. Effects of different row spaces on canopy structure and resistance of summer maize. Acta Agron. Sin. 2016, 42, 104–112. [Google Scholar] [CrossRef]
- Yang, J.S.; Gao, H.Y.; Liu, P.; Li, G.; Dong, S.T.; Zhang, J.W.; Wang, J.F. Effects of planting density and row spacing on canopy apparent photosynthesis of high-yield summer maize. Acta Agron. Sin. 2010, 36, 1226–1233. [Google Scholar] [CrossRef]
- Xue, J.; Zhao, Y.S.; Gou, L.; Shi, Z.G.; Yao, M.N.; Zhang, W.F. How High Plant Density of Maize Affects Basal Internode Development and Strength Formation. Crops Sci. 2016, 56, 3295–3306. [Google Scholar] [CrossRef]
- Bernhard, B.J.; Below, F.E. Plant population and row spacing effects on maize: Plant growth, phenology, and grain yield. Agron. J. 2020, 112, 2456–2465. [Google Scholar] [CrossRef]
- Gao, Y.B.; Tao, H.B.; Huang, S.B.; Tian, B.J.; Wang, L.J.; Yun, L.; Ren, J.H.; Pu, W. Effects of high planting density and row spacing on canopy light distribution and photosynthetic characteristics of summer maize. J. China Agric. Univ. 2015, 20, 9–15. [Google Scholar]
- Cui, H.Y.; Jin, L.B.; Li, B.; Zhang, J.W.; Zhao, B.; Dong, S.T.; Liu, P. Effects of shading on stalks morphology, structure and lodging of summer maizein field. Sci. Agric. Sin. 2012, 45, 3497–3505. [Google Scholar]
- Appenzeller, L.; Doblin, M.; Barreiro, R.; Wang, H.Y.; Niu, X.M.; Kollipara, K.; Carrigan, L.; Tomes, D.; Chapman, M.; Dhugga, K.S. Cellulose synthesis in maize: Isolation and expression analysis of the cellulose synthase (CesA) gene family. Cellulose 2004, 11, 287–299. [Google Scholar] [CrossRef]
- Yan, Q.J.; Huo, S.P.; Zhang, F.K.; Zhang, X.D.; Zhang, J.; Xiang, Z.F.; Yu, Z.J.; Feng, Y.C. Effects of artificial shaded-humid environment on growth characteristics in different maize inbred lines. Acta Agron. Sin. 2013, 39, 2253–2261. [Google Scholar] [CrossRef]
- Shao, L.P.; Li, G.; Zhao, Q.N.; Li, Y.B.; Sun, Y.T.; Wang, W.N.; Cai, C.; Chen, W.P.; Liu, R.H.; Luo, W.H.; et al. The fertilization effect of global dimming on crop yields is not attributed to an improved light interception. Global Change Biol. 2020, 26, 1697–1713. [Google Scholar] [CrossRef]
Disclaimer/Publisher’s Note: The statements, opinions and data contained in all publications are solely those of the individual author(s) and contributor(s) and not of MDPI and/or the editor(s). MDPI and/or the editor(s) disclaim responsibility for any injury to people or property resulting from any ideas, methods, instructions or products referred to in the content. |
© 2023 by the authors. Licensee MDPI, Basel, Switzerland. This article is an open access article distributed under the terms and conditions of the Creative Commons Attribution (CC BY) license (https://creativecommons.org/licenses/by/4.0/).