Article

Optimizing Nitrogen Management for Summer Maize in the Yellow River Basin a Water Heat Carbon and N Simulator Model Approach with Entropy-Weighted Technique for Order Preference by Similarity to Ideal Solution Analysis

1
School of Water Conservancy, North China University of Water Resources and Electric Power, Zhengzhou 450046, China
2
Collaborative Innovation Center for the Efficient Utilization of Water Resources, Zhengzhou 450046, China
*
Author to whom correspondence should be addressed.
Agronomy 2023, 13(12), 3081; https://doi.org/10.3390/agronomy13123081
Submission received: 21 November 2023 / Revised: 9 December 2023 / Accepted: 14 December 2023 / Published: 18 December 2023
(This article belongs to the Section Agroecology Innovation: Achieving System Resilience)

Abstract

:
Summer maize constitutes a major food crop in the Yellow River Basin. Optimizing nitrogen (N) application management for this crop not only elevates its yield but also reduces N leaching, thereby ensuring food security and lessening agricultural surface pollution. Utilizing two years of summer maize field experiments, the soil water heat carbon and N simulator (WHCNS) was calibrated and validated against empirical measurements. Subsequent analyses employed the calibrated WHCNS to analyze 56 different N management scenarios. These scenarios varied in terms of N application levels, basal N to topdress application ratios, and chase ratios. The entropy-weighted TOPSIS method was utilized for the optimization, considering agronomic, environmental, and economic aspects. The model’s calibration accuracy was validated by root mean square errors, relative root mean square errors, and mean errors for soil volumetric water content and soil nitrate N content. The calibration results demonstrated that the new model was capable of simulating the soil hydraulic characteristics, N cycling, and the growth and development of summer maize during the reproductive phase in the Yellow River Basin. Scenario analyses revealed that increasing the N application initially elevated, then stabilized, summer maize yields, whereas the N agronomic efficiency first increased and then decreased. Moreover, reducing the basal N to topdress application ratios and increasing the chase ratios during the tasseling and flowering stages could minimize the nitrate N leaching and optimize both the yield and N fertilizer agronomic utilization. Specifically, the optimal N management for the current year involved applying 170 kg·ha−1 of N with a basal N to the topdress N application ratio of 1:5 and a chase ratio of 1:1 during the tasseling and flowering stages. This study lays the foundation for developing N fertilizer management strategies for summer maize cultivation in the Yellow River Basin. Furthermore, the methodology established here can be adapted for optimizing the management of diverse crops in different geographical regions.

1. Introduction

The Yellow River Basin serves as a significant base for maize cultivation in northern China. In recent years, the maize-cultivated area within this basin has expanded progressively, highlighting the crop’s vital role in safeguarding food security [1]. Owing to initiatives promoted by the Chinese government, such as water conservation concepts and the deployment of agricultural water-saving technologies, irrigation water-use efficiency in the region has been on the rise.
Maize is inherently a high-yield, N-loving crop. Enhancing the application of N fertilizer can lead to marked improvements in maize yields [2]. In fact, N fertilizers contribute as much as 50% to maize yields [3]. Despite its significance, the lack of scientific N fertilizer management remains a critical factor contributing to both the excessive annual usage of N fertilizer and low N utilization efficiency in the Yellow River Basin. The aver-application of N fertilizer results in an overly N-rich environment for maize, subsequently inducing high N stress and adversely affecting crop quality as well as economic viability.
Previous research conducted by Fang et al. [4] examined the optimal N application rate for a winter wheat–summer maize rotation system in the northern region of the North China Plain, considering the environmental effects. Their findings indicated that, beyond a certain application rate, increasing N amounts no longer elevated maize yields but did lead to residual N accumulation in the soil. This excess N has the potential to leach into lower soil layers, causing groundwater nitrate contamination [5,6] and soil acidification [7], thereby posing a risk to human food security [8,9].
Therefore, formulating scientific N fertilizer management strategies is necessary for resolving food security concerns and mitigating the agricultural surface pollution in the Yellow River Basin. Such strategies are crucial for elevating the N fertilizer utilization efficiency and promoting sustainable, high-quality agricultural development.
Numerous studies have explored the problem of N application management in maize cultivation [10,11,12]. Insufficient N application has been found to hinder maize growth and development, leading to issues such as delayed maturity [13], weakened plant vigor, and reduced leaf functionality. This ultimately results in diminished yields and compromised seed quality. Conversely, excessive N application can result in a rapid expansion of the leaf area coefficient in the crop’s later growth stages, leading to a decline in chlorophyll content per unit leaf area and premature leaf aging, thereby inhibiting nutrient accumulation within the plant and consequently lowering yields [14].
The maize planting season in the Yellow River Basin typically spans from May to October, coinciding with a period of substantial and concentrated rainfall. During this period, the over-application of N fertilizer could exacerbate nitrate N leaching from the soil. Some research suggests that appropriate N application can benefit plant growth and grain development while optimizing the N fertilizer utilization and reducing N leaching, thereby alleviating agriculture-induced surface pollution [15]. Tilman et al. [16] also emphasized that soil nitrate N concentration played a crucial role in controlling nitrate N leaching.
Nakamura et al. [17] explored the effects of both concentrated and split N applications on N leaching under specific crop and management conditions. They concluded that split N applications were more effective in minimizing N leaching compared to concentrated applications. While field experiments offer valuable insights, they are often time-consuming and expensive to conduct. Moreover, the generalizability of findings is limited due to variable soil, geological, and climatic conditions across different study locations. To overcome these limitations and provide more universally applicable results, researchers have combined agroecosystem modeling approaches with field experiments [18,19].
For instance, Zhang et al. [18] determined the optimal N application rate for summer maize in the North China Plain through a five-year field study combined with the denitrification–decomposition (DNDC) model. Their integrated approach, which took environmental impacts into account, indicated that an N application rate of 180 kg·ha−1 led to lower nitrate N leaching (The nitrate N leaching is 18.4 kg·ha−1) and maximized crop yields. Similarly, Liang et al. [19] utilized the water heat carbon and N simulator (WHCNS) model alongside field trials in Alashan, Inner Mongolia, to compare traditional with improved water N treatments. They found that the improved treatment reduced water leakage and N leaching by 165 mm and 93 kg·ha−1, respectively, compared to traditional farmer practices. Nonetheless, the preceding studies primarily concentrated on optimizing the N application amount, fertilizer chasing practices, and mitigating N leaching from a single perspective, which can be considered somewhat limited in scope.
There is currently limited comprehensive research concerning the optimal N application rates for summer maize in the Yellow River Basin that accounts for agronomic, economic, and environmental considerations. Additionally, the impact of varying N application periods and rates on maize physiology and N utilization remains largely unexplored.
The present study aims to address these gaps by focusing on summer maize cultivation in the Yellow River Basin. Utilizing two years of field trial data (2022–2023), we calibrated and validated the WHCNS model. The validated model was then combined with the entropy-weighted technique for order preference by similarity to ideal solution (TOPSIS) method to conduct a comprehensive evaluation. This integrated approach enabled us to examine various N application periods, application rates, and basal N to topdress application ratios. Ultimately, our goal was to identify an optimal N fertilizer management strategy that maximizes both the N utilization efficiency and crop yields while minimizing the nitrate N leaching. This study aims to contribute to safeguarding food security in the Yellow River Basin, controlling nitrate N leaching from agricultural lands, and mitigating the environmental pollution.

2. Materials and Methods

2.1. Overview of the Study Area

The study was conducted from June 2022 to September 2022 and from June 2023 to September 2023 at the Experimental Station for Efficient Water Use in Agriculture, affiliated with North China University of Water Resources and Hydropower. Located 9.8 km from the right bank of the Yellow River in northeastern Zhengzhou City, the station’s geographic coordinates are 113°46′56″E, 34°47′3″N, at an elevation of 85.5 m. Figure 1 illustrates the location of the experimental site.
The station experiences a temperate continental monsoon climate with an average annual temperature of 14.3 °C, 6.57 h of daily sunshine, and an average annual rainfall of 637.1 mm. Figure 2 presents temperature and rainfall data for the test area during the reproductive period of summer maize. Precipitation predominantly occurs from July to September, coinciding with the peak growth period of summer maize. Precipitation in 2023 was mainly concentrated 40–50 days after planting, while precipitation in 2023 was more scattered and peaked lower than in 2022. The topography is relatively flat, the groundwater depth exceeds 3 m, and the soil profile up to 100 cm is characterized by sandy loam. The soil contains 13.6 g·kg−1 of organic matter, 539 mg·kg−1 of total N, 11.8 mg·kg−1 of readily available phosphorus, and 104.4 mg·kg−1 of readily available potassium. Table 1 presents the soil’s basic physicochemical properties.

2.2. Experimental Design

A field trial for summer maize was conducted from June 2022 to September 2023. The maize variety used was “Zhengdan 958”, and basin irrigation was employed for the study. Each experimental plot measured 10 m × 1.5 m, with protective rows set at a distance of 1.5 m between adjacent plots. A ternary compound fertilizer, containing 60 kg·ha−1 each of N, K, and P [20], was uniformly applied as the base fertilizer. Chase fertilization involved the use of urea, which contains 46.3% N.
Three levels of N application were established, featuring N application rates of 120 kg·ha−1, 220 kg·ha−1, and 320 kg·ha−1, respectively. According to the fertilizer application times, three time points for fertilizer application were designated: the nodulation stage on 20 June, the tasseling stage on 18 July, and the flowering stage on 7 August, based on the 2022 summer maize cycle. Each fertilizer application type was administered during the flowering stage of the summer maize’s fertility period.
During each of these stages, the different N application levels were further divided into three N fertilizer treatments. Additionally, a blank control group, which received no fertilizer, was included. This culminated in a total of 10 N fertilizer treatments, each replicated three times.
Due to varying weather conditions, the sowing date for the 2023 summer maize season (13 June 2023) was delayed by five days compared to the previous year (8 June 2022). Consequently, the dates for chase fertilizer applications were also postponed by five days. The specific experimental design is shown in Table 2.

2.3. Observational Items and Methods

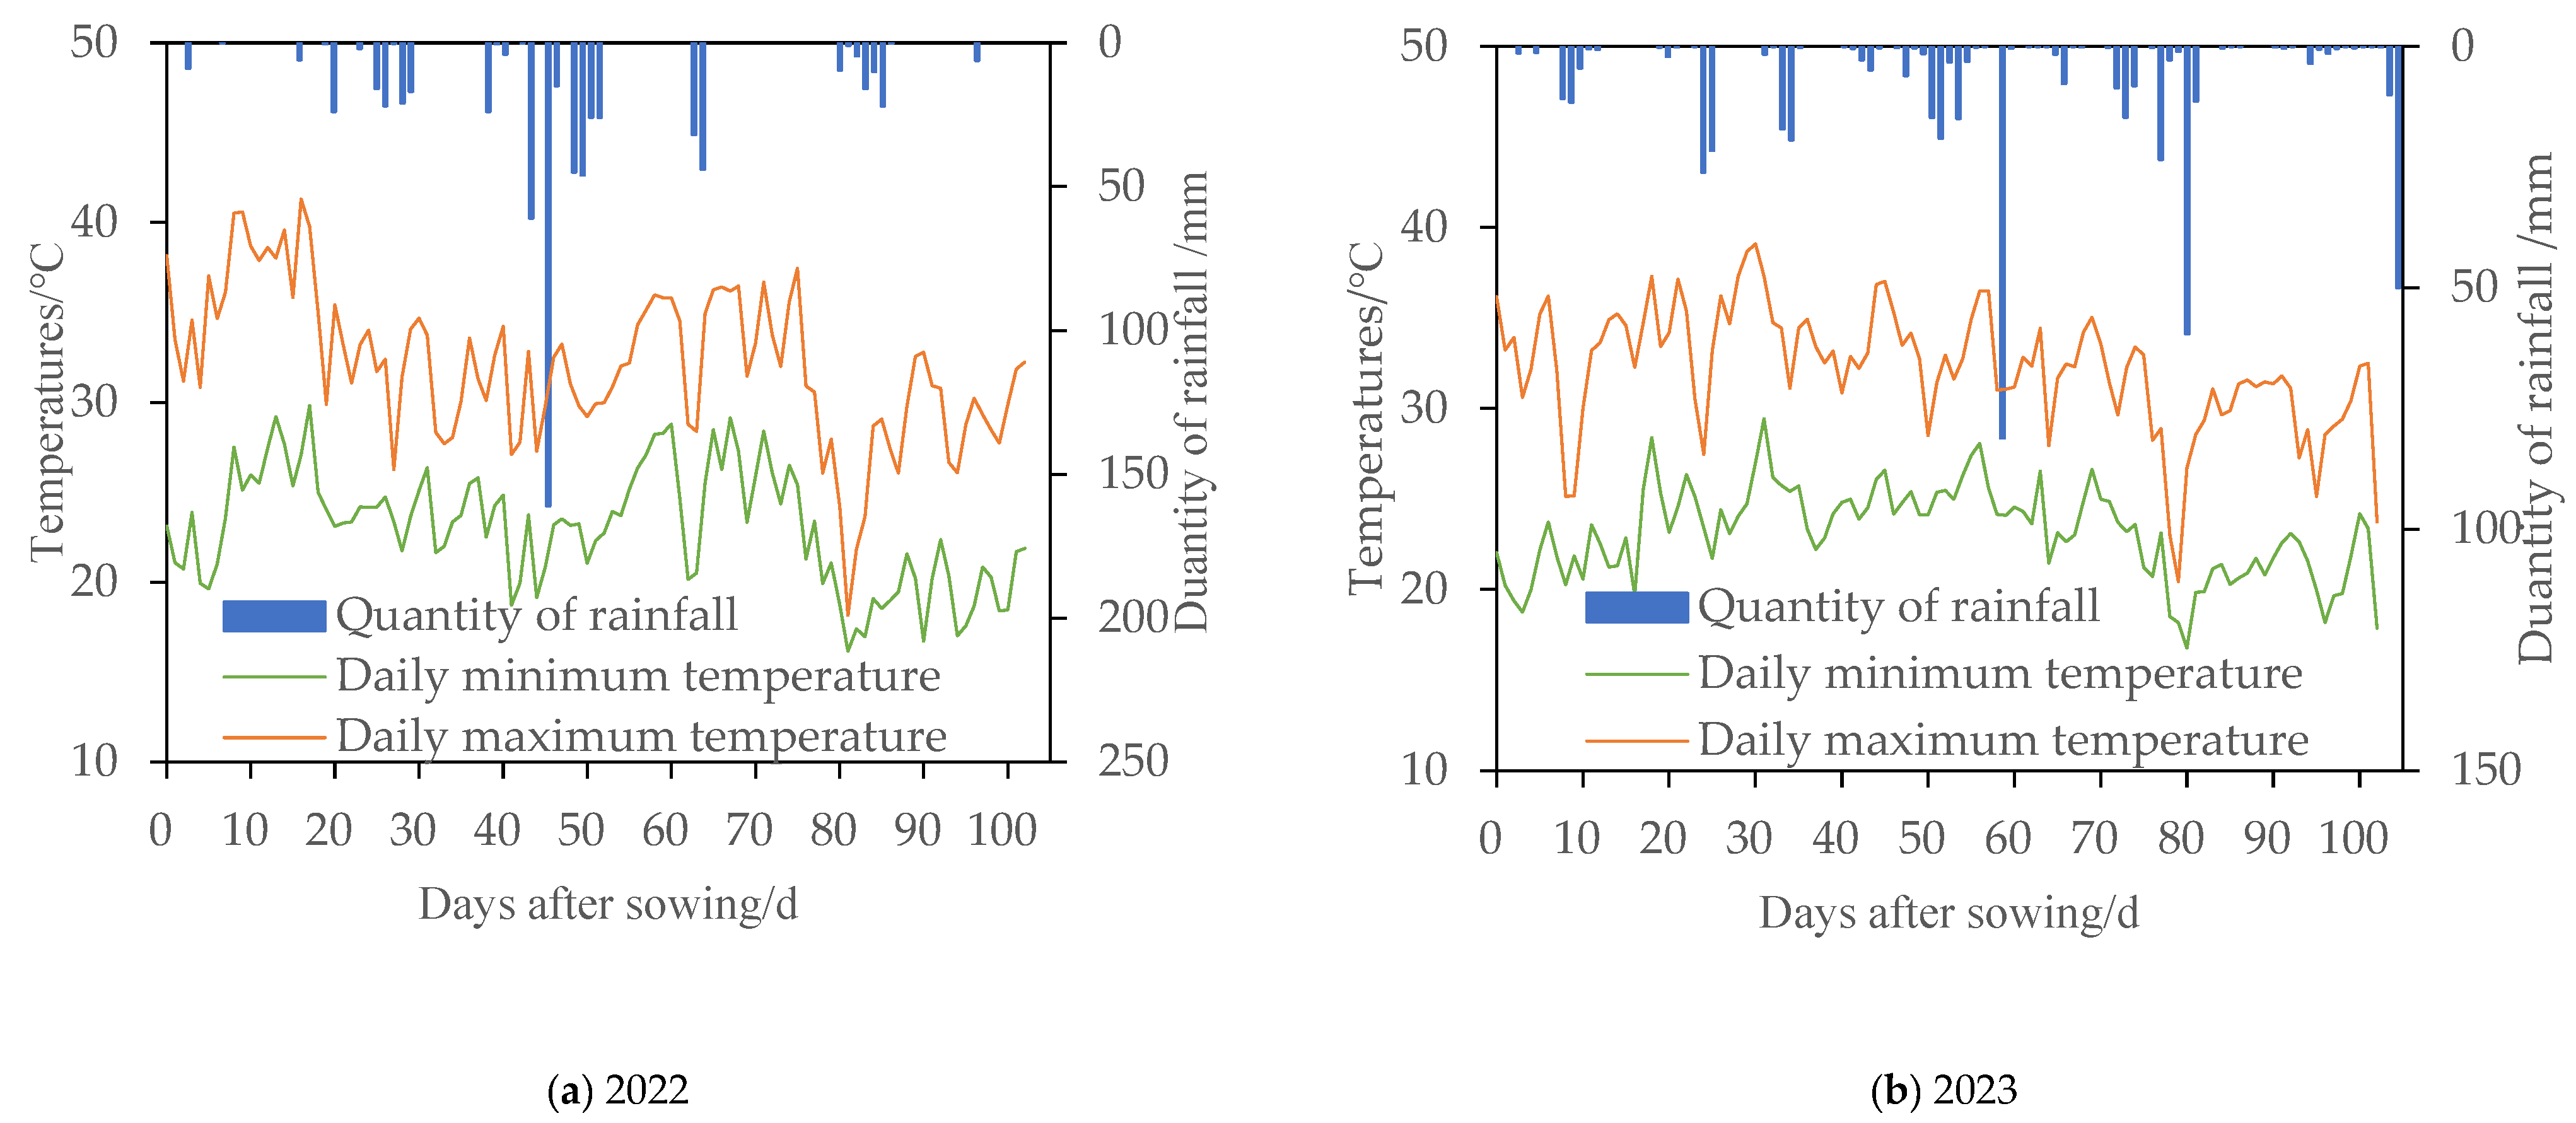
2.3.1. Meteorological Data

Meteorological data for the test site were collected using a high-precision automatic weather station (HM-HL08).

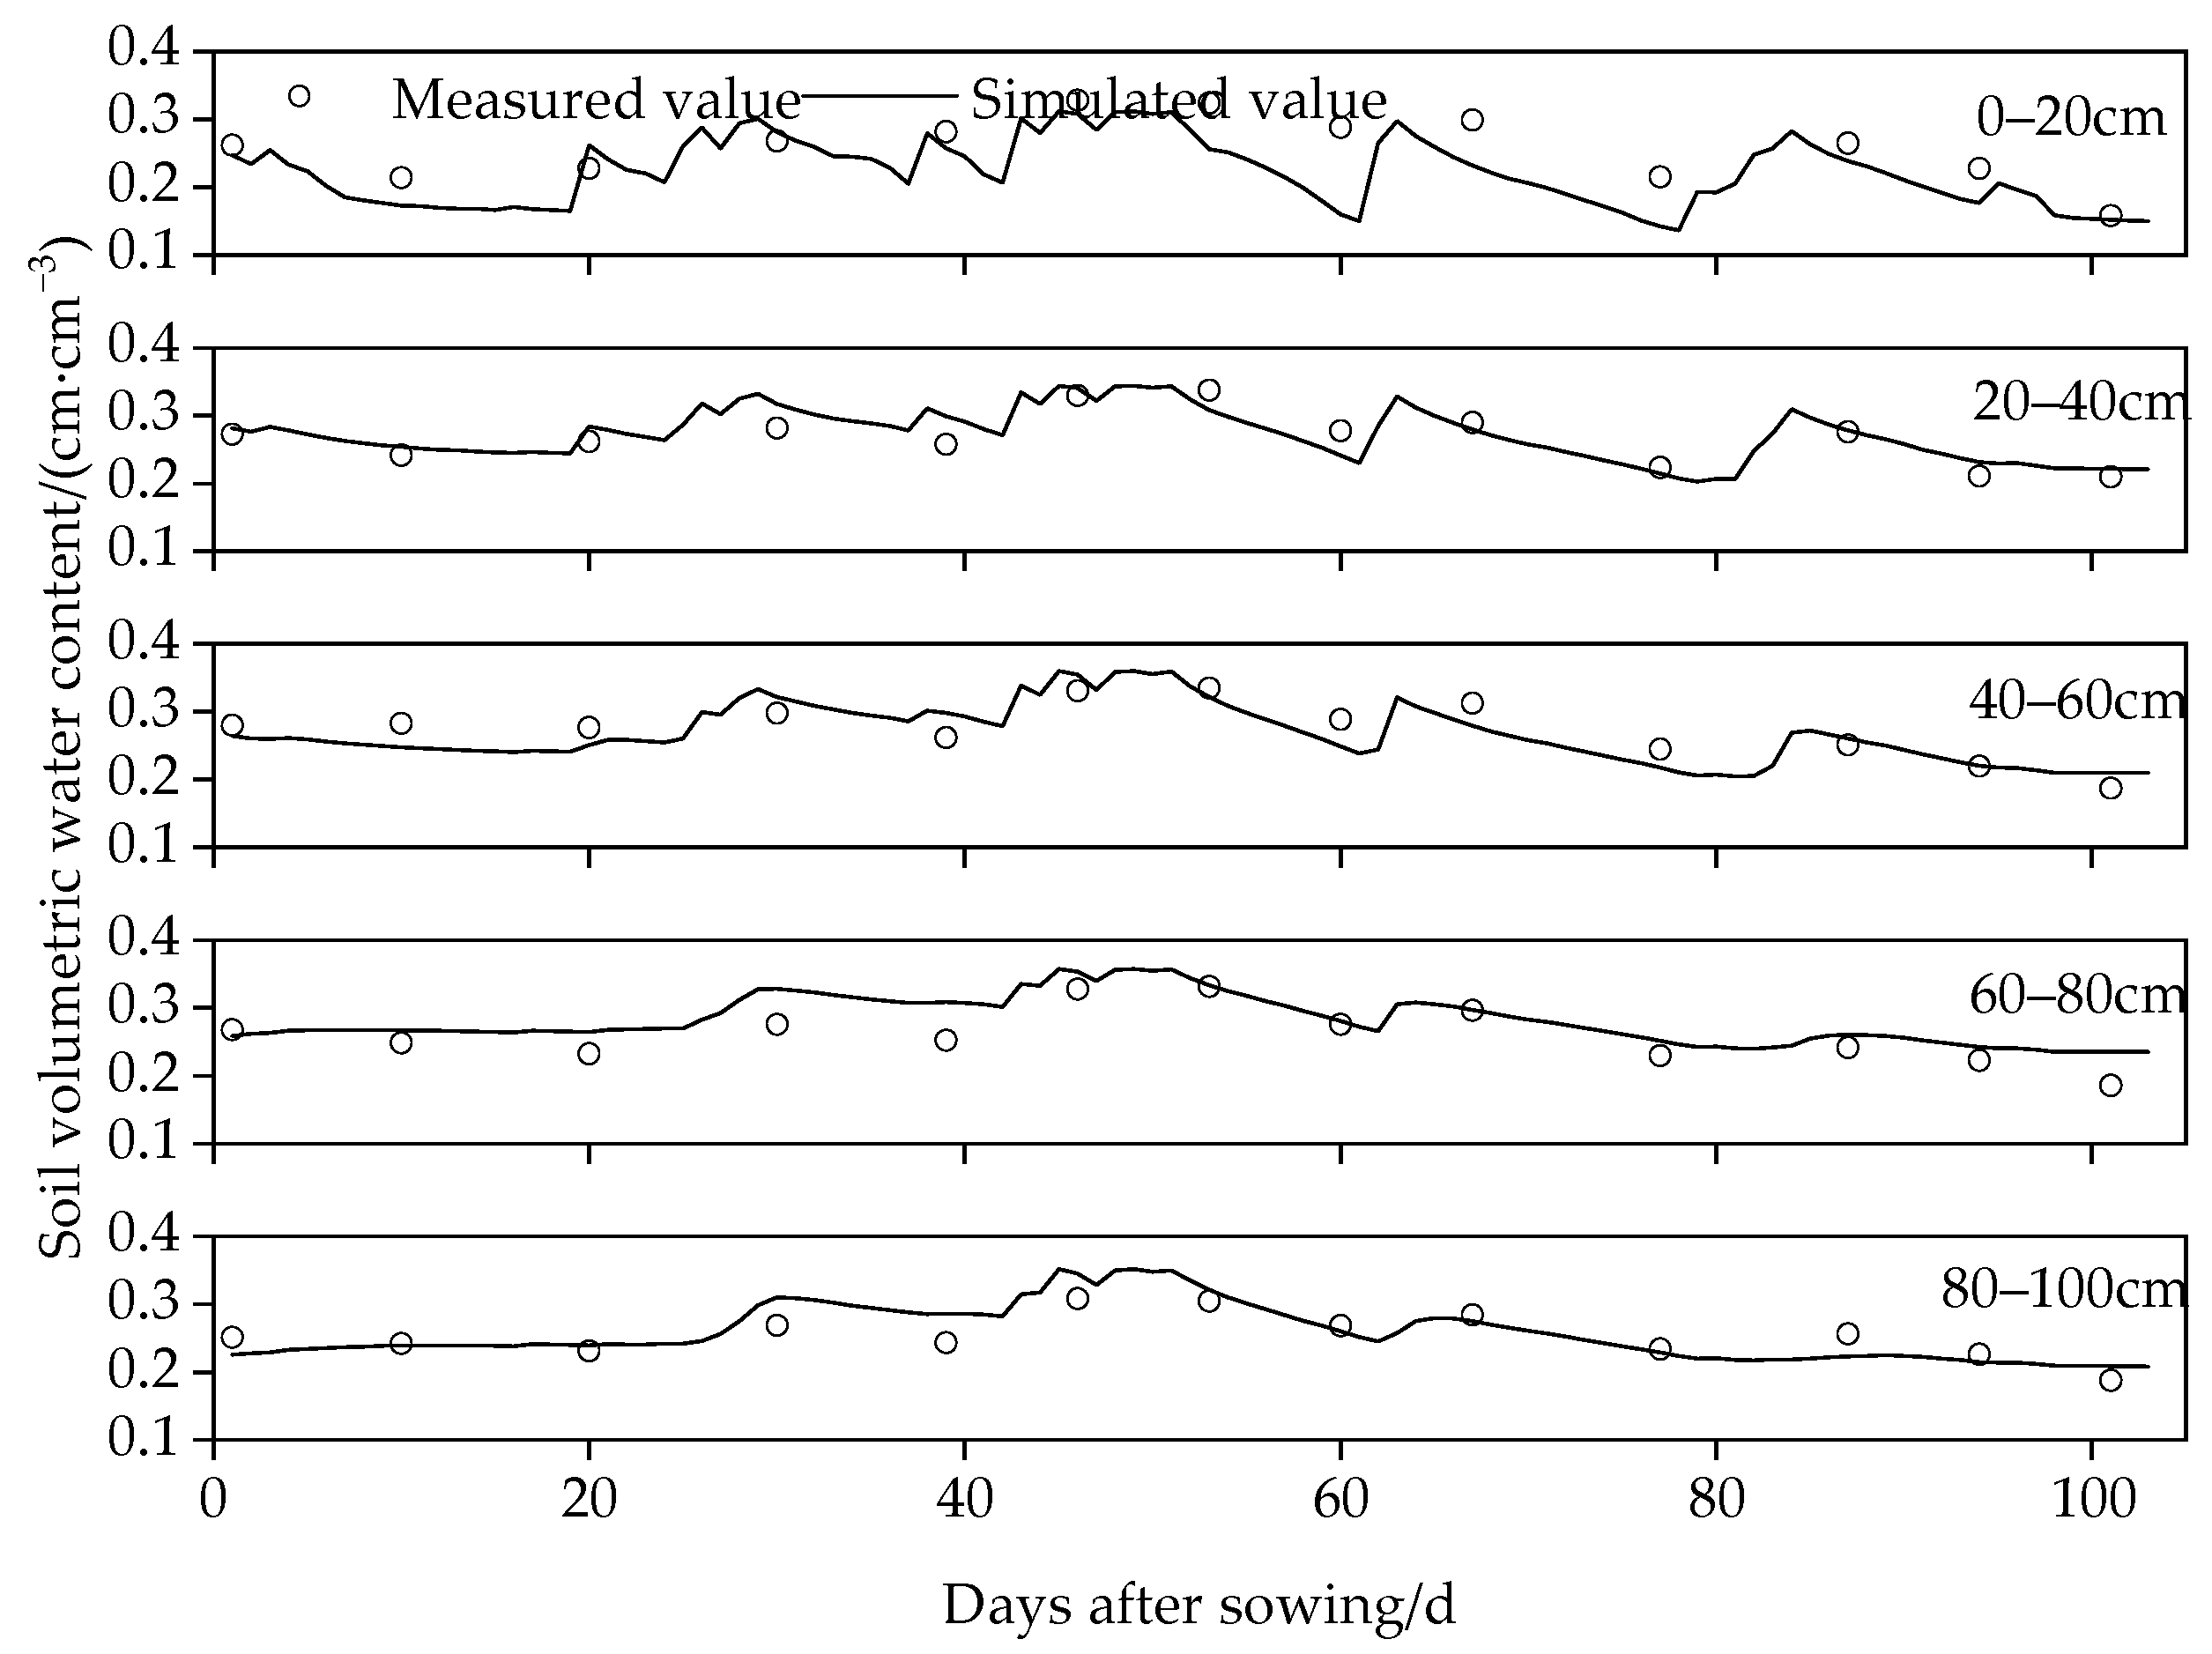
2.3.2. Soil Moisture Content

Soil moisture was determined using an approach that combined the drying method and the TRIME tube test. Measurements were conducted in 20 cm soil layers at depths ranging from 0 to 100 cm. These measurements were taken at intervals of 5–10 days prior to sowing, post-harvest, and during critical periods of fertility.

2.3.3. Soil Nitrate-N Content

The soil nitrate N content was assessed using UV spectrophotometry [21]. Measurements were taken three days before and after each base and chase fertilizer application. Soil samples were extracted using a soil auger at 20 cm intervals, down to a depth of 100 cm.

2.3.4. Above-Ground Biomass

During the ripening phase of the summer maize, three representative plants were selected from each experimental plot. The above-ground portions were harvested, chopped, and initially oven-dried at 105 °C for 30 min. Subsequent drying continued at 80 °C until a constant weight was achieved. The above-ground biomass for each experimental plot was then calculated in accordance with the crop’s planting density.

2.3.5. Yield

To assess the yield, a 1 m × 1 m area was chosen from each experimental plot during the maize harvest. The maize from this area was threshed, dried, and weighed to obtain maize yield measurements. The total maize yield of each experimental plot was later calculated from the measured values (kg·ha−1).

2.4. Model Introduction

The WHCNS model serves as a quantitative tool for analyzing key processes within the soil–crop system. It comprises several modules, including meteorological, soil water–heat–N co-transport, crop growth, organic matter, root water, and N uptake, inorganic N, and field management modules. Soil water infiltration was modeled using the Green–Ampt model [22], whereas soil water redistribution relied on the Richards equation. Evapotranspiration was calculated via the Penman–Monteith formula [23]. Soil heat movement was represented by the convection–conduction equation, and inorganic mass movement within the soil was described using the convection–dispersion equation. Carbon and N cycling in the soil were linked to the organic matter conversion module of the DAISY model [24]. For crop growth modeling, the PS123 generic crop model from Wageningen University, Netherlands [25], was employed.

2.5. Inputs and Rates of Model Parameters

The WHCNS model operates on a daily timestep, and its primary inputs include meteorological data (daily maximum and minimum temperatures, daily average wind speed, solar radiation intensity, daily average relative humidity, and precipitation), basic soil physicochemical properties, crop parameters, and field management data (such as sowing and harvest dates, planting density, and fertilizer application strategies).
Model parameter rates were established based on prior studies, utilizing treatments that were devoid of moisture and nutrient stress. This was done to ensure that these stresses did not compromise the model’s simulation accuracy for various treatments [26]. Calibration was performed using data gathered from the 2022 summer maize field trial. This involved the iterative adjustments of parameters using the "trial-and-error method" until simulated outputs closely matched the measured data. Subsequently, appropriate parameters for soil hydraulic properties, carbon and N cycling, and crop growth were confirmed. Table 3, Table 4 and Table 5 present the soil hydraulic parameters, carbon and N cycling parameters, and crop parameters, respectively.

2.6. Inputs and Rates of Model Parameters

To assess the consistency between model simulation results and measured data, as well as the overall performance of the simulation, three key evaluation indicators were employed in this study:
(1)
Root mean square error (RMSE)
R M S E = 1 n i = 1 n ( P i - O i ) 2
(2)
Relative root mean square error (nRMSE)
n R M S E = R M S E O × 100 %
(3)
Mean error (ME)
M E = 1 n i = 1 n P i O i
where n is the number of measured values; Pi and Oi are the ith simulated and measured values, respectively; and O is the average value of measured values.
RMSE is utilized to quantify the absolute deviation between simulated and measured values. nRMSE reveals the degree of consistency between simulated and measured values. A value closer to zero indicates a more accurate simulation. According to prior research [27], an nRMSE of less than 15% suggests good consistency; between 15% and 30% indicates moderate consistency; and greater than 30% signifies poor consistency with considerable divergence between the simulated and measured values. ME serves to indicate whether the model error is positively or negatively skewed.

2.7. Indicator System for Evaluating the Effectiveness of N Application Management

To optimize the agronomic, environmental, and economic outcomes, an evaluation system comprising four key indicators was established. These include the yield, N agronomic efficiency (NAE), nitrate-N loss, and value-to-cost ratio (VCR). This system aims to assess the effectiveness of N management in each summer maize crop.
(1)
N agronomic efficiency (NAE):
N A E = Y Y c k F
(2)
Value-to-cost ratio (VCR):
V C R = Y × Y P F × F P
where Y is the yield (kg·ha−1); Yck is the yield of the control group without N application (kg·ha−1); YP is the crop unit price (CNY·kg−1); F is the N amount applied (kg·ha−1); and FP is the N fertilizer unit price (CNY·kg−1). Both the N application rates and the unit cost of N fertilizer are evaluated in terms of N content. According to local agricultural practices in the Yellow River Basin, the unit price for summer maize is set at 2 CNY·kg−1, and for N fertilizer, it is 5 CNY·kg−1. The evaluation is conducted on a per hectare basis [28].

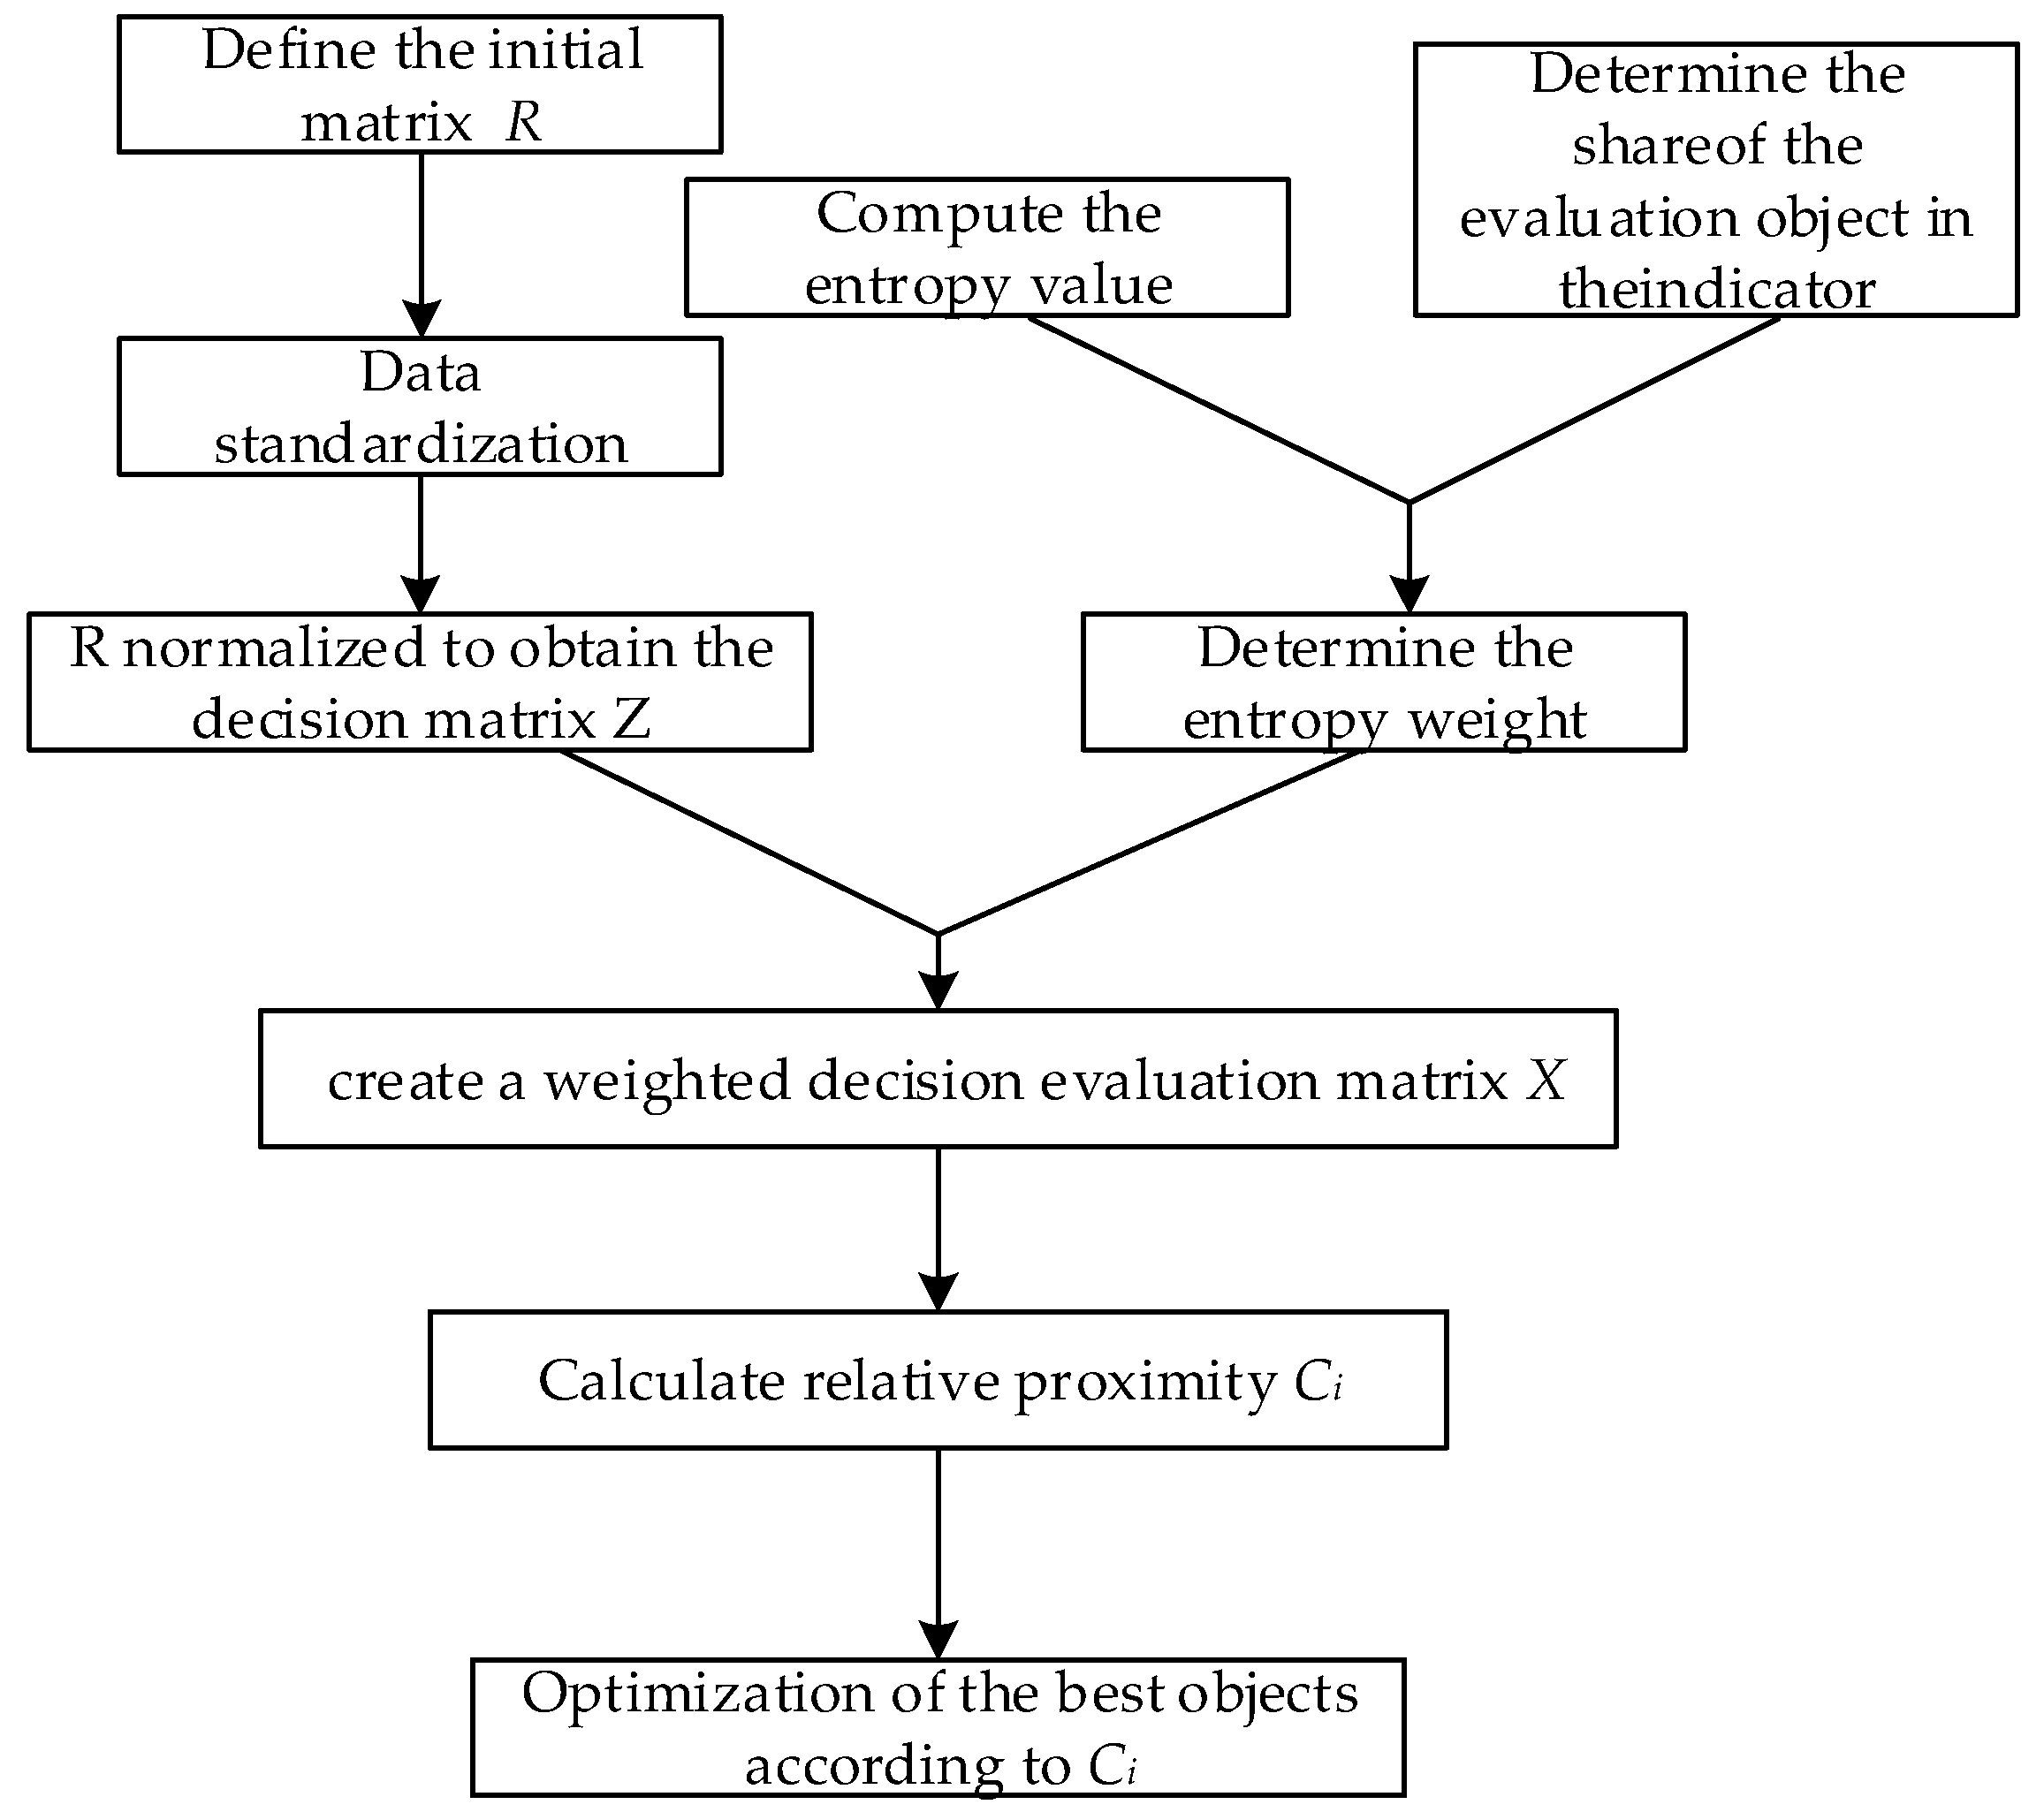
2.8. Entropy-Weighted TOPSIS Method

TOPSIS is one of many multi-objective decision-making tools [29,30] frequently employed to address multi-level and multi-objective preferences due to its wide applicability and high efficiency [31]. Numerous scholars have already used this method to solve problems in agriculture [32,33]. However, the traditional TOPSIS method relies on expert opinions to assign indicator weights, making the approach subjective. Integrating the entropy weight method with the TOPSIS method and forming the entropy-weighted TOPSIS method effectively solves this limitation. It employs the entropy weight method to objectively determine the indicator weights, thereby making the evaluation more accurate and impartial. Figure 3 shows the Methodological scheme of the method used in this study. The entropy-weighted TOPSIS method involves the eight following steps:
(1)
Define the initial matrix as R, with i representing the evaluation objects and j representing evaluation indicators, and rij is the original data.
R = r 11 r 12 r 1 j r 21 r 22 r 2 j r i 1 r i 2 r i j , i 1 , m , j 1 , n
The standardized data aij are computed using Equation (7) for a benefit indicator j and Equation (8) for a cost indicator j.
a i j = r i j r j max
a i j = r j min r i j
(2)
Determine the share pij of the ith evaluation object in the jth indicator.
P i j = a i j i = 1 m a i j
(3)
Compute the entropy value ej for the jth indicator.
e j = k i = 1 m p i j · ln P i j
(4)
Determine the entropy weight wj for the jth indicator.
w j = ( 1 e j ) j = 1 n ( 1 e j )
To avoid the impact of diverse units among indicators, the original matrix R is normalized to yield the decision matrix Z.
z i j = r i j i = 1 m r i j 2
(5)
Multiply the weights derived from the entropy weighting method with the normalized decision matrix to create a weighted decision evaluation matrix X.
x i j = w j z i j
(6)
Compute the positive ( x j + ) and negative ( x j ) ideal solutions for each indicator.
x j + = max x i j
x j = min x i j
(7)
Calculate the distance of each object to the positive and negative ideal solutions.
d i + = j = 1 n ( x i j x j + ) 2
d i = j = 1 n ( x i j x j ) 2
(8)
Calculate Ci, relative proximity, and the progress of each object toward the positive ideal solution. The value of Ci ranges between 0 and 1, with values closer to 1 indicating a higher level of N application management effectiveness.
C i = d i d i + d i +

3. Results and Analyses

3.1. Model Calibration

The WHCNS model was verified using measured data from the 2023 summer maize field trials. Figure 4 provides a comparison between the simulated and measured values of soil volumetric water content across varying soil depths for the N320 (1:1:0) treatment. Due to space constraints, only data for this particular treatment are displayed. The simulated values exhibit a strong correlation with the measured values.
Figure 5 illustrates the dynamic shifts in soil nitrate-N content at different soil depths. The simulated values closely align with the measured values. The soil volumetric water content and nitrate-N content at different depths reached their highest levels following both precipitation and fertilizer application. Similar patterns were noted in the case of the two other treatments, N320 (1:0:1) and N320 (0:1:1), at this N application level.
Figure 6 confirms that the model effectively simulates the above-ground biomass. Similarly, yield estimates for all treatments closely approximate the empirically measured values.
Table 6 provides a statistical analysis of soil volumetric water content across different depths and treatments. RMSE values range from 0.02 to 0.05 cm3·cm−3, suggesting a minimal deviation from the measured data. Moreover, ME values lie between -0.036 and 0.004 cm3·cm−3, confirming the model’s efficacy [34]. Notably, the nRMSE values for soil volumetric water content vary from 9% to 21%. For the soil layer spanning 20–100 cm, nRMSE values are all below 15%, indicating a strong consistency between the simulated and measured data [27]. These statistics confirm that the WHCNS model offers a highly accurate simulation for soil volumetric water content, particularly in the 20–100 cm depth range. The simulation effect on the soil volumetric water content within the 0–20 cm depth layer is deemed acceptable, making it highly applicable and valuable for various uses.
Field data show that the soil nitrate-N content peaks 5–10 days post-fertilizer application. During the maize’s reproductive phase, elevated levels of nitrate-N are observed in the 0–40 cm soil layer, while lower concentrations are found between depths of 40 and 100 cm. The overall pattern in soil nitrate-N distribution shows a decrease in nitrate-N content as the soil depth increases, with relatively minor fluctuations in nitrate-N levels observed in the deeper soil layers.
Table 7 further proves this observation, revealing RMSE values from 0.23 to 3.20 mg·kg−1 and ME values that align well with both the simulated and measured data (−1.730–0.050 mg·kg−1). nRMSE values fluctuate between 9% and 29%, all falling below the 30% threshold. This affirms that the WHCNS model provides a reliable simulation of soil nitrate-N content across various soil depths and treatments [35].
Figure 6 presents the correlation coefficients for simulated versus measured values of yield and above-ground biomass. With correlation coefficients of 0.9496 for yield and 0.8562 for above-ground biomass, the simulation demonstrates high reliability to empirical measurements. The regression equations for yield and above-ground biomass exhibit slopes of 0.976 and 0.891, respectively. RMSE values for these metrics are 310.33 kg·ha−1 and 740.80 kg·ha−1, respectively, while ME values are 43.181 kg·ha−1 and 162.428 kg·ha−1. nRMSE values for both parameters are below 10%, indicating a high degree of consistency between the simulated and observed values.
In summary, the WHCNS model, after thorough parameter calibration, effectively simulates key soil and plant indicators, including soil volumetric water content, nitrate-N levels, yield, and above-ground biomass. The statistical indicators RMSE, nRMSE, and ME validate the model’s robustness in capturing the intricate dynamics of soil moisture, N cycling, and crop growth in the Yellow River Basin under varying N application regimes.

3.2. Situational Application Analysis

3.2.1. Scenario Setting

To optimize N fertilizer management for summer maize cultivation in the Yellow River Basin, a comprehensive scenario analysis was conducted for the 2023 growing season. The N application rate varied from 80 to 260 kg·ha−1 in increments of 30 kg·ha−1 [28], resulting in seven distinct levels of N application. Additionally, two basal N to topdress the application ratios (1:5 and 1:4) were investigated to examine their influence on maize growth during different developmental stages [36]. Four configurations of chase fertilization schedules were also considered (1:1:0, 1:0:1, 0:1:1, 1:1:1). The timing for all fertilizer applications remained consistent. A total of 56 N fertilizer management scenarios were thus formulated, as illustrated in Table 8.

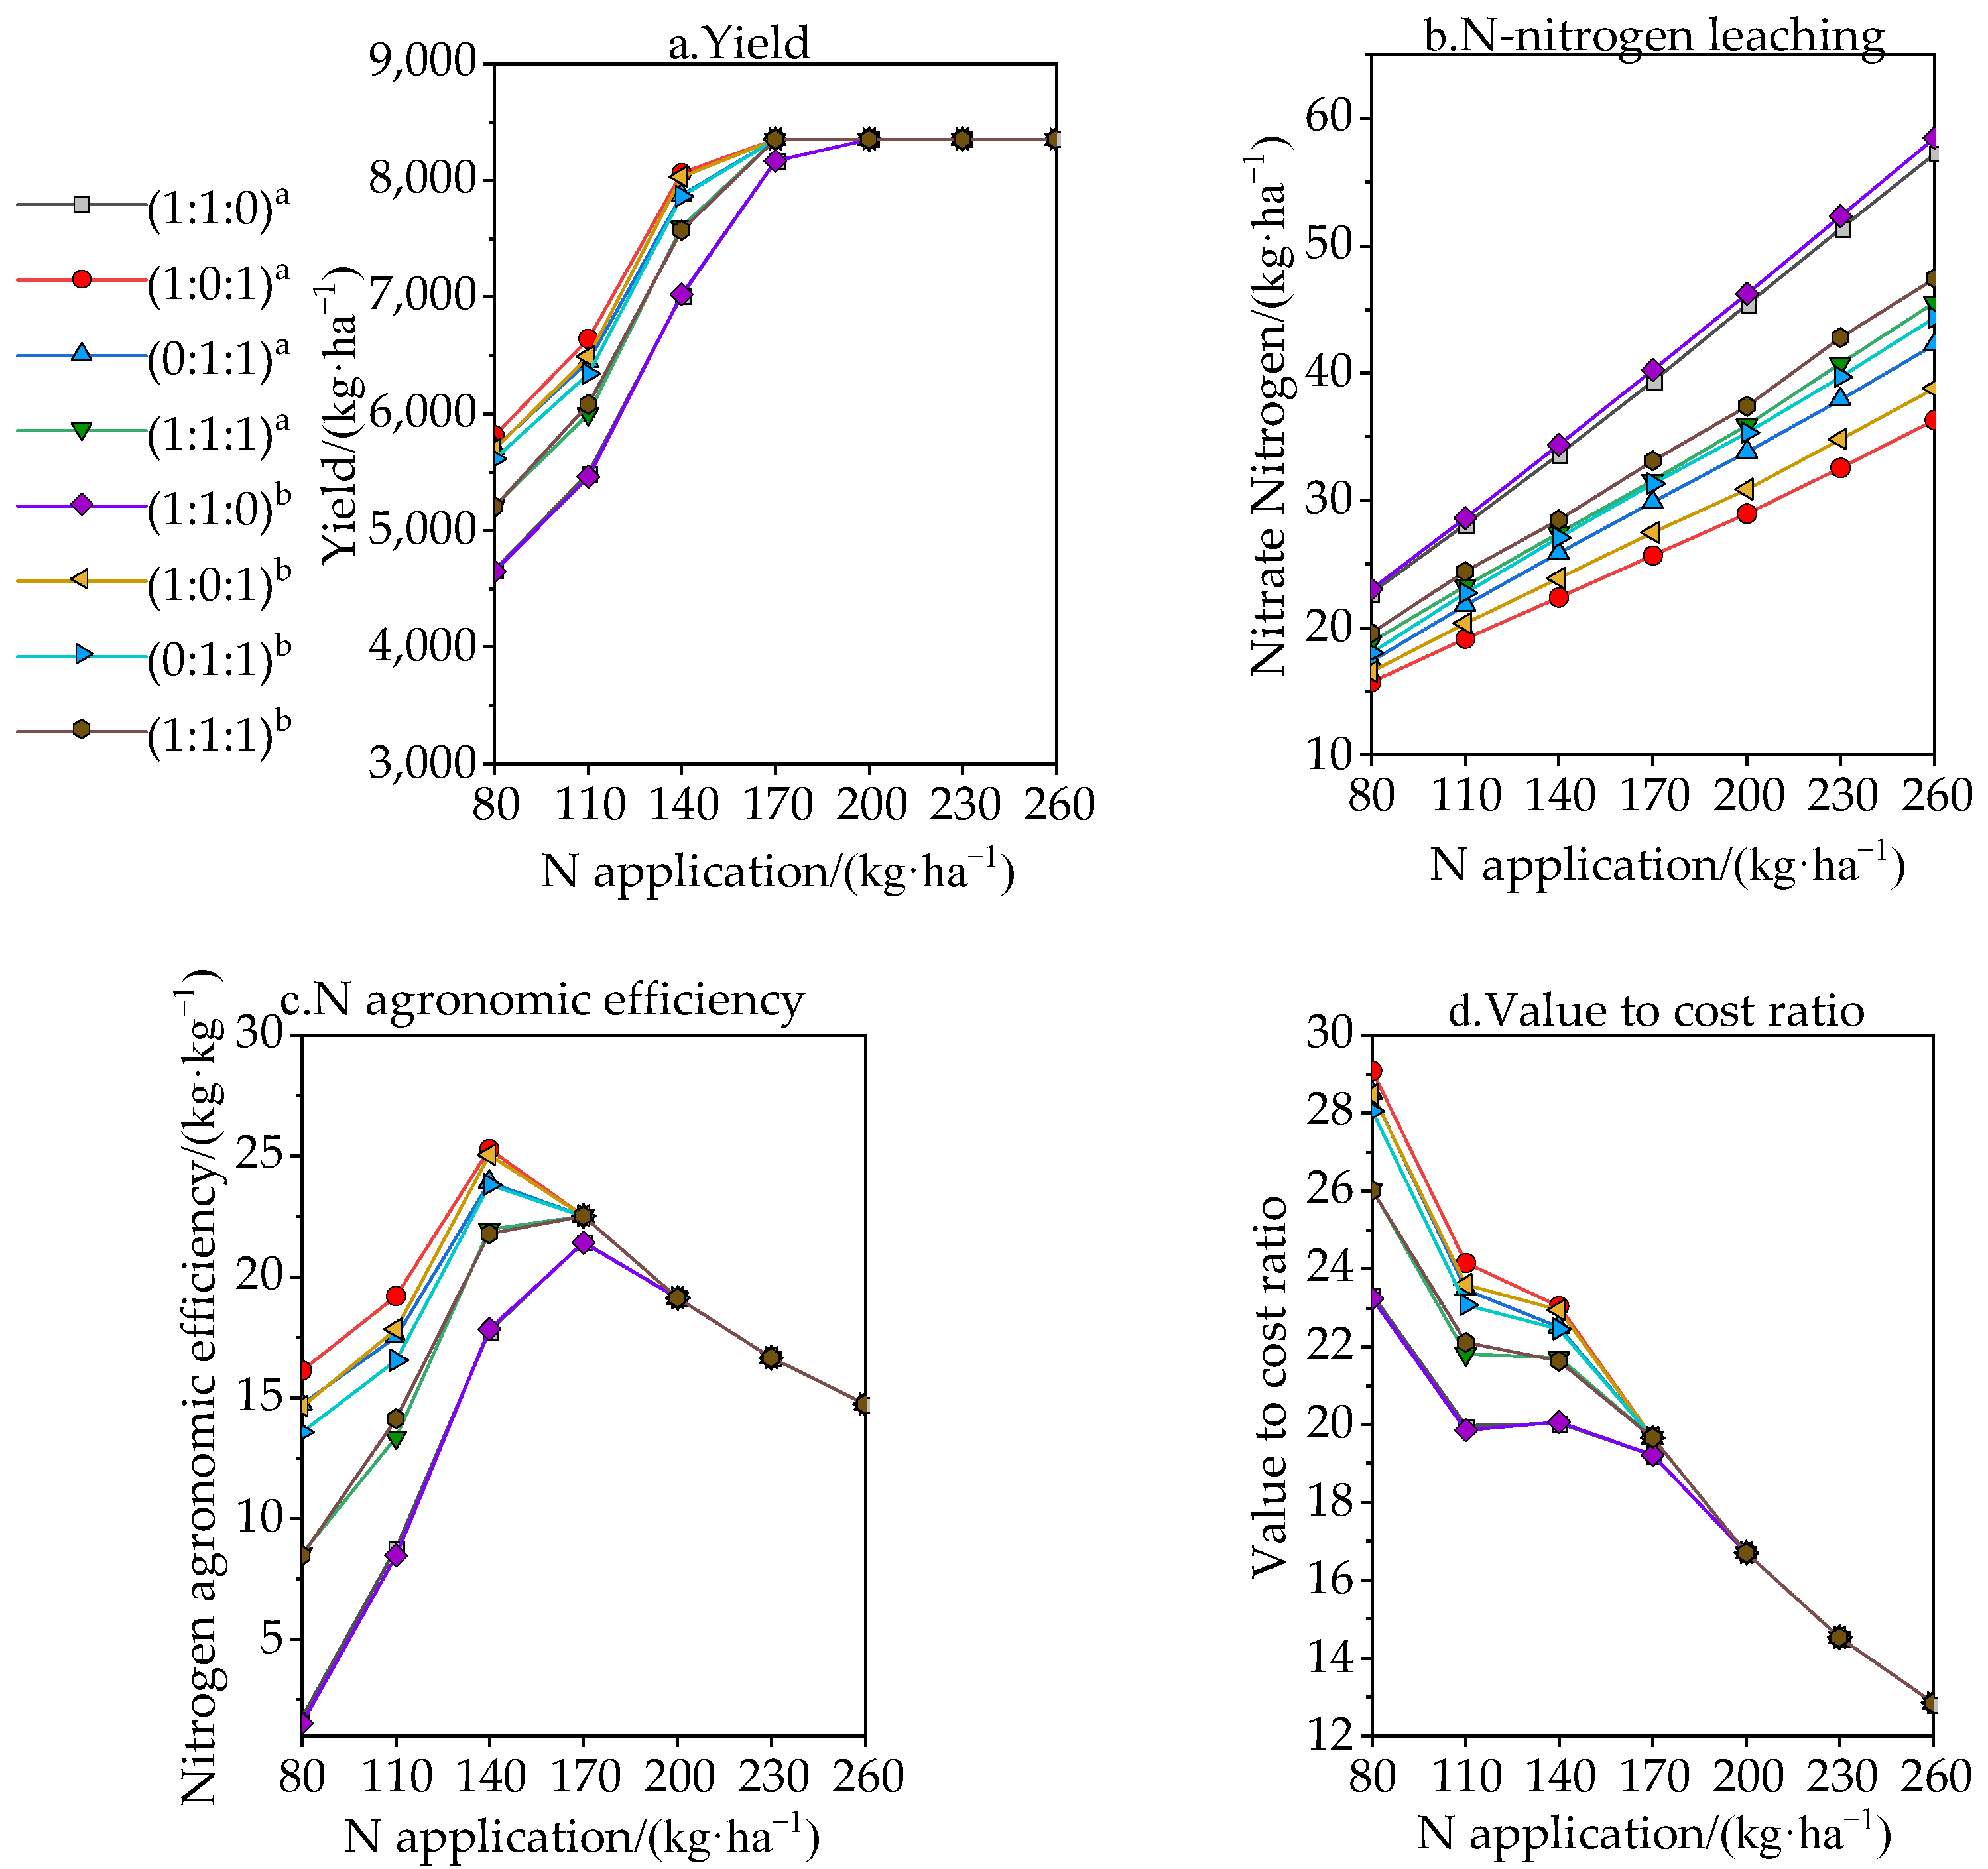
3.2.2. Scenario Simulation Results

Utilizing the calibrated WHCNS model, the 56 N management scenarios were simulated to evaluate the yield, nitrate-N leaching, NAE, and VCR under different N management scenarios.
Figure 7a reveals that crop yield generally increases with increasing N application rates. For most treatments, the yield plateaued at 170 kg·ha−1, while only treatment (1:1:0) showed an exceptional maximum at 200 kg·ha−1. A basal N to the topdress N application ratio of 1:5 consistently outperforms the 1:4 ratio in terms of yield. The relationship between the yields for the same basal N to the topdress N application ratio with different chase times and chase ratios was (0:1:1) > (1:1:1) > (1:0:1) > (1:1:0). This suggests that decreasing the amount of base fertilizer and increasing the proportion of chase fertilizer during the tasseling and flowering stages can enhance the growth and grain development of summer maize, ultimately leading to higher yields.
Figure 7b establishes a linear relationship between N application and nitrate-N leaching, indicating increased leaching with higher rates of N application. Among basal N to topdress application ratios, the (1:1:0) treatment incurred the greatest nitrate-N losses, and the (0:1:1) treatment the lowest nitrate-N losses, particularly when the basal ratio was 1:5.
As depicted in Figure 7c, the NAE initially increased with higher N application rates but peaked at 140 kg·ha−1, after which it declined.
Figure 7d demonstrates that the VCR progressively diminishes with rising N application rates. Beyond 230 kg·ha−1 of N, the ratio remained constant across treatments due to yield stabilization. The (1:1:0) treatment showed the lowest VCR, while variations among other treatments were marginal.

3.2.3. Analysis of Optimal N Fertilizer Management Based on the Entropy-Weighted TOPSIS Method

To identify the optimal N fertilizer management strategy for summer maize, a multi-objective decision-making analysis was conducted using the entropy-weighted TOPSIS method. This comprehensive approach evaluated the agronomic efficiency, environmental impact, and economic feasibility. The entropy weighting method determined the weighting coefficients for crop yield, nitrate-N leaching, NAE, and VCR to be 7.03%, 51.17%, 27.13%, and 14.67%, respectively. Table 9 reveals that the highest relative proximity was achieved with an N application rate of 170 kg·ha−1, a basal N to topdress N application ratio of 1:5, and a chase ratio of 1:1 at both the tasseling and flowering stages. This scenario resulted in a maximum yield of 8,354.3 kg·ha−1 and a maximum NAE of 32.80 kg·ha−1, and minimized nitrate-N leaching to 25.7 kg·ha−1, constituting a 56% reduction compared to the maximum leaching value. In summary, the optimal N management strategy for the 2023 summer maize season in the study area involved these specific rates and ratios.

4. Discussion

4.1. Evaluation of WHCNS Model Simulations

In this investigation, the WHCNS model was parameterized using the data collected from a 2022 field trial involving summer maize. The calibrated model was subsequently employed to simulate various parameters, such as soil hydraulic characteristics, N cycling, and crop growth and development. These simulations were conducted during the fertility phase of summer maize within the Yellow River Basin and further calibrated with 2023 field data. The calibration confirmed that the WHCNS model is proficient at precisely simulating soil hydraulics, N cycling, and crop growth during this critical period.
Various statistical indicators were employed to evaluate the model’s performance. For instance, the RMSE, nRMSE, and ME for soil volumetric water content in the soil layers of 20–100 cm were as follows: the RMSE of 0.02–0.03 cm3·cm−3, nRMSE between 9% and 13%, and ME from -0.025 to 0.003 cm3·cm−3. For the topsoil layer (0–20 cm), the mean RMSE, nRMSE, and ME values were 0.05 cm3·cm−3, 21%, and -0.036 cm3·cm−3, respectively. Notably, the model demonstrated less accuracy in simulating the surface soil water content, confirming the findings of a previous study [37].
The limited accuracy in modeling the surface soil water content might be attributable to the inherent variability and instability of the soil moisture conditions in the field, which can be influenced by various factors, including crops, climatic conditions, and human intervention. Moreover, the spatial and temporal variations in soil hydraulic properties during field tests make it challenging for the model to replicate these conditions.
Regarding N cycling, the RMSE, nRMSE, and ME for soil nitrate-N content were found to be 0.23–3.20 mg·kg−1, 9–29%, and -1.730–0.050 mg·kg−1, respectively. Although the model’s simulation accuracy for nitrate-N was not as strong as for soil moisture, it was still within acceptable limits [38].
Furthermore, our model displayed greater fluctuations in simulated values when compared to measured data, especially concerning the nitrate-N content peaks, which was different from the results in [39]. This discrepancy may be rooted in the complex interactions of soil physicochemical properties, climatic conditions, and crop-related factors that influence the rate of fertilizer decomposition [40]. Therefore, the model tends to overestimate the decomposition rate, leading to early and elevated peaks in simulated nitrate-N levels.
In terms of crop growth metrics, the RMSE, nRMSE, and ME for crop yield were 310.33 kg·ha−1, 4%, and 43.181 kg·ha−1, respectively. For above-ground biomass, these values were 740.80 kg·ha−1, 6%, and 162.428 kg·ha−1. The coefficient of determination (R2) between the simulated and measured data for these metrics was 0.9496 and 0.8562, respectively, indicating a high degree of correlation and simulation accuracy [41].

4.2. Optimal N Management for Summer Maize Based on the Entropy-Weighted TOPSIS Method

The optimization of N application in summer maize has been extensively studied, revealing a multitude of variables that influence the practice, such as planting methods, crop varieties, sowing times, soil types, N application schedules, and basal N to the topdress application ratios [41,42,43]. These variables contribute to disparate findings among researchers working in different geographical contexts. For example, Zhao et al. [42] employed the Agricultural Production Systems Simulator (APSIM) model to suggest an optimal N application rate of 180 kg·ha−1 for summer maize in the North China Plain. Conversely, Wang and Huang [41] recommended a rate of 120 kg·ha−1 for summer maize in Beijing. Furthermore, a three-year field trial by Jin et al. [43] in Wengkou, Shandong Province, advocated for a shift to direct sowing and an N application of 185 kg·ha−1. This approach significantly outperformed traditional tillage methods, enhancing the yield, N bias productivity, and N use efficiency by 67.0%, 104.0%, and 53.5%, respectively.
In the current investigation, a multi-criteria approach that incorporated agronomic, economic, and environmental factors was adopted. Evaluation indicators such as crop yield, nitrate-N leaching, NAE, and VCR were considered. Consequently, the optimal N management strategy for summer maize in the Yellow River Basin was determined to be an N application of 170 kg·ha−1, with a basal N to topdress the N application ratio of 1:5. Fertilization is recommended at both the tasseling and flowering stages, maintaining a balanced fertilization ratio of 1:1. This prescribed N application level is notably lower than the traditional practices commonly employed by farmers in the Yellow River Basin for summer maize cultivation.
The reduction in N application to 170 kg·ha−1, compared to a previously higher level of 240 kg·ha−1 [44], resulted in a 29.2% decrease in N fertilizer use. This change not only yields greater economic benefits but also addresses the environmental concern of surface water pollution caused by excessive N fertilizer application in the Yellow River Basin [45], all while sustaining high crop yields.
Recent studies affirm that N management strategies aligned with crop demand can substantially minimize N losses while enhancing N fertilizer utilization and maintaining high yields [46]. For instance, Huang et al. [47] proposed an N application rate of 180 kg ha−1 for summer maize in the North China Plain, as per a three-year rotation trial with winter wheat. This rate balances the need for reduced N leaching and sustained crop yields. Similarly, Yin et al. [48] observed effective nitrate N leaching reduction in a rice–wheat rotation system in Suzhou City, Jiangsu Province, through improved farmland management measures.
This study’s findings reinforce these observations. Specifically, the utilization of a basal N to the topdress N application ratio of 1:5 and a balanced 1:1 N application at the tasseling and flowering stages diminished nitrate N losses by 56% while maintaining optimal yields and an improved VCR. Past research also suggests that reducing the base and seedling stage fertilizers can enhance the resilience of summer maize to adverse conditions [49]. Min-Wei et al. [50] noted that 43.9–50.9% of the summer maize’s N accumulation occurs during the post-flowering fertility phase, advocating for increased post-flowering N application in line with the crop’s N requirements.

5. Conclusions

(1) The current study, focused on summer maize under different N management practices in Zhengzhou City for the years 2022–2023, validated soil hydraulic movement, carbon and N cycling, and crop growth parameters through the WHCNS model. The simulated soil volumetric water content, nitrate-N levels, crop yield, and above-ground biomass closely matched the observed data. Therefore, the WHCNS model is a robust tool for simulating soil moisture movement, N cycling, and crop growth during summer maize’s reproductive phase in the Yellow River Basin.
(2) Our simulations revealed that, while the increasing N application initially improved the crop yield, the yield eventually plateaued; meanwhile, the nitrate N loss consistently escalated. Among various N application scenarios, a 1:5 basal N to topdress N application ratio showed a superior performance in crop yield, NAE, VCR, and nitrate N loss compared to a 1:4 ratio. Within the same N application levels and basal N to topdress application ratios, employing a balanced 1:1 N application at the tasseling and flowering stages proved optimal. This method yielded a 79.7% increase in crop yield and a 56% reduction in nitrate-N leaching compared to the worst treatment. Through entropy-weighted TOPSIS analysis, it was concluded that the optimal N management strategy for summer maize in the Yellow River Basin involves an N application of 170 kg·ha−1, a basal N to topdress N application ratio of 1:5, and a chase ratio of 1:1 during the tasseling and flowering stages.

Author Contributions

Conceptualization, T.L.; methodology, M.L. and Y.L. (Yuan Li); validation, D.W.; formal analysis, W.Z.; data curation, M.Y.; writing—original draft preparation, Y.L. (Yulong Liu); writing—review and editing, S.L.; visualization, Y.Z.; project administration, S.W. All authors have read and agreed to the published version of the manuscript.

Funding

This research was supported by the National Natural Science Foundation of China (52079051); Supported by Program for Innovative Research Team (in Science and Technology) in University of Henan Province (24IRTSTHN012); Supported by key scientific research projects (22A570004, 23A570006) of colleges and universities in Henan Province; Henan Provincial Water Conservancy Science and Technology Tackling Project (GG202336). The support was not involved in the collection, analysis, and interpretation of data for this study; the writing of the report; or the submission of the report. We thank the anonymous reviewers for their valuable and constructive comments.

Data Availability Statement

The data presented in this study are available on request from the corresponding author.

Conflicts of Interest

The authors declare no conflict of interest.

References

  1. Song, X.S. Study on Production Water Footprint of Main Grain Crops in Yellow River Basin. Master’s Thesis, North China Electric Power University, Beijing, China, 2018. [Google Scholar]
  2. Zand-Parsa, S.; Sepaskhah, A.R.; Ronaghi, A. Development and evaluation of integrated water and nitrogen model for maize. Agric. Water Manag. 2006, 81, 227–256. [Google Scholar] [CrossRef]
  3. Huang, S.M.; Bao, D.J.; Huangfu, X.R.; Zhang, H.C.; Zhao, B.Q.; Zhang, F.D.; Shi, X.H. Effect of long-term fertilizer application and contribution to crop yield in fluvo-aquic soil. Plant Nutr. Fertil. Sci. 2002, 8, 141–145. [Google Scholar]
  4. Fang, Q.; Ma, L.; Yu, Q.; Malone, R.W.; Saseendran, S.A.; Ahuja, L.R. Modeling nitrogen and water management effects in a wheat-maize double-cropping system. J. Environ. Qual. 2008, 37, 2232–2242. [Google Scholar] [CrossRef] [PubMed]
  5. Zhu, Z.L.; Chen, D.L. Nitrogen fertilizer use in China-Contributions to food production, impacts on the environment and best management strategies. Nutr. Cycl. Agroecosystems 2002, 63, 117–127. [Google Scholar] [CrossRef]
  6. Huang, J.; Xu, C.C.; Ridoutt, B.G.; Wang, X.C.; Ren, P.A. Nitrogen and phosphorus losses and eutrophication potential associated with fertilizer application to cropland in China. J. Clean. Prod. 2017, 159, 171–179. [Google Scholar] [CrossRef]
  7. Guo, J.H.; Liu, X.J.; Zhang, Y.; Shen, J.L.; Han, W.X.; Zhang, W.F.; Christie, P.; Goulding, K.W.; Vitousek, P.M.; Zhang, F.S. Significant acidification in major Chinese croplands. Science 2010, 327, 1008–1010. [Google Scholar] [CrossRef] [PubMed]
  8. Schindler, D.W.; Hecky, R.E. Eutrophication: More Nitrogen Data Needed. Science 2009, 324, 721–722. [Google Scholar] [CrossRef] [PubMed]
  9. Hvistendahl, M. China’s push to add by subtracting fertilizer. Science 2010, 327, 801. [Google Scholar] [CrossRef]
  10. Hu, H.; Ning, T.; Li, Z.; Han, H.; Zhang, Z.; Qin, S.; Zheng, Y. Coupling effects of urea types and subsoiling on nitrogen–water use and yield of different varieties of maize in northern China. Field Crops Res. 2013, 142, 85–94. [Google Scholar] [CrossRef]
  11. Zhang, J.; Zhao, G.; Dang, Y.; Fan, T.; Wang, L.; Li, S.; Zhou, G.; Fudjoe, S.K.; Wang, L.; Palta, J.A. Enhancing Maize Yield and Resource Efficiency through Controlled-Release Nitrogen Fertilization on the Semiarid Loess Plateau. Agronomy 2023, 13, 2320. [Google Scholar] [CrossRef]
  12. Wang, Q.X.; Wang, P.; Shen, L.X.; Wang, X.L.; Zhai, Z.X. Effect of nitrogen application time on dynamics of nitrate content and apparent nitrogen budget in the soil of summer maize fields. Acta Ecol. Sin. 2004, 24, 1582–1588. [Google Scholar]
  13. Ying, Z.; Yan-An, T.; Hu-Bing, Z. Effects of different N rates on nutrients accumulation, transformation and yield of summer maize. Plant Nutr. Fertil. Sci. 2006, 12, 622–627. [Google Scholar]
  14. Zhang, X.Z.; Shang, W.B.; Qi, Z.J.; Zheng, E.N.; Liu, M. Effects of Different Water and Nitrogen Managements on Nitrogen Remobilization Efficiency during Leaf Senescence in Maize. Trans. Chin. Soc. Agric. Mach. 2019, 50, 8. [Google Scholar] [CrossRef]
  15. Wang, H.Y.; Hu, K.L.; Li, B.G.; Jin, L. Analysis of Water and Nitrogen Use Efficiencies and Their Environmental Impact Under Different Water and Nitrogen Management Practices. Sci. Agric. Sin. 2011, 44, 2701–2710. [Google Scholar] [CrossRef]
  16. Tilman, D.; Cassman, K.G.; Matson, P.A.; Naylor, R.; Polasky, S. Agricultural sustainability and intensive production practices. Nature 2002, 418, 671–677. [Google Scholar] [CrossRef]
  17. Nakamura, K.; Harter, T.; Hirono, Y.; Horino, H.; Mitsuno, T. Assessment of Root Zone Nitrogen Leaching as Affected by Irrigation and Nutrient Management Practices. Vadose Zone J. 2004, 3, 1353–1366. [Google Scholar] [CrossRef]
  18. Zhang, Y.; Wang, H.; Liu, S.; Lei, Q.; Liu, J.; He, J.; Zhai, L.; Ren, T.; Liu, H. Identifying critical nitrogen application rate for maize yield and nitrate leaching in a Haplic Luvisol soil using the DNDC model. Sci. Total Environ. 2015, 514, 388–398. [Google Scholar] [CrossRef]
  19. Liang, H.; Qi, Z.; Hu, K.; Prasher, S.O.; Zhang, Y. Can nitrate contaminated groundwater be remediated by optimizing flood irrigation rate with high nitrate water in a desert oasis using the WHCNS model? J. Environ. Manag. 2016, 181, 16–25. [Google Scholar] [CrossRef]
  20. Lambers, H.; Barrow, N.J. P2O5, K2O, CaO, MgO, and basic cations: Pervasive use of references to molecules that do not exist in soil. Plant Soil 2020, 452, 1–4. [Google Scholar] [CrossRef]
  21. Liu, G.S. Soil Physical and Chemical Analysis & Description of Soil Profiles; Standards Press of China: Beijing, China, 1996. [Google Scholar]
  22. Green, W.H. Studies on Soil Physics—Part 1. The flow of air and water through soils. J. Agric. Sci. 1911, 4, 1–24. [Google Scholar]
  23. Allen, R.G. Crop Evapotranspiration-Guidelines for computing crop water requirements. FAO Irrig. Drain. Pap. 1998, 300, D05109. [Google Scholar] [CrossRef]
  24. Hansen, S.; Jensen, H.E.; Nielsen, N.E.; Svendsen, H. DAISY: Soil Plant Atmosphere System Model. NPo-Research 1990, A10, 272. [Google Scholar]
  25. Driessen, P.M.; Konijn, N.T. Land-Use Systems Analysis; Deptartment of Soil Science & Geology Wageningen Agricultural University: Wageningen, The Netherlands, 1992. [Google Scholar]
  26. Fang, Q.X.; Ma, L.; Green, T.R.; Yu, Q.; Ahuja, L.R. Water resources and water use efficiency in the North China Plain: Current status and agronomic management options. Agric. Water Manag. 2010, 97, 1102–1116. [Google Scholar] [CrossRef]
  27. Li, Z.T.; Yang, J.Y.; Drury, C.F.; Hoogenboom, G. Evaluation of the DSSAT-CSM for simulating yield and soil organic C and N of a long-term maize and wheat rotation experiment in the Loess Plateau of Northwestern China. Agric. Syst. 2015, 135, 90–104. [Google Scholar] [CrossRef]
  28. Xu, Q.; Li, Z.J.; Hu, K.L.; Li, B.G. Optimal management of water and nitrogen for farmland in North China Plain based on osculating value method and WHCNS model. Trans. Chin. Soc. Agric. Eng. 2017, 33, 152–158. [Google Scholar]
  29. Basilio, M.P.; Pereira, V.; Yigit, F. New Hybrid EC-Promethee Method with Multiple Iterations of Random Weight Ranges: Applied to the Choice of Policing Strategies. Mathematics 2023, 11, 4432. [Google Scholar] [CrossRef]
  30. Bilbao-Terol, A.; Arenas-Parra, M.; Cañal-Fernández, V.; Antomil-Ibias, J. Using TOPSIS for assessing the sustainability of government bond funds. Omega 2014, 49, 1–17. [Google Scholar] [CrossRef]
  31. Chung, E.S.; Kim, Y. Development of fuzzy multi-criteria approach to prioritize locations of treated wastewater use considering climate change scenarios. J. Environ. Manag. 2014, 146, 505–516. [Google Scholar] [CrossRef]
  32. Zhu, S.; Liu, J.; Tang, G.; Sun, T.; Jia, H.; Zhao, H.; Zhang, Y.; Lin, L.; Xu, W. Evaluating the Application Potential of Acid-Modified Cotton Straw Biochars in Alkaline Soils Based on Entropy Weight TOPSIS. Agronomy 2023, 13, 2807. [Google Scholar] [CrossRef]
  33. Zhou, Y.; Zhang, X.; Chen, Y.; Li, H. An Optimisation–Evaluation Framework for the Sustainable Management of the Water–Energy–Food Nexus for an Irrigation District under Uncertainty. Agronomy 2023, 13, 1714. [Google Scholar] [CrossRef]
  34. Li, Z.; Hu, K.; Li, B.; He, M.; Zhang, J. Evaluation of water and nitrogen use efficiencies in a double cropping system under different integrated management practices based on a model approach. Agric. Water Manag. 2015, 159, 19–34. [Google Scholar] [CrossRef]
  35. Hu, C.; Saseendran, S.A.; Green, T.R.; Ma, L.; Li, X.; Ahuja, L.R. Evaluating Nitrogen and Water Management in a Double-Cropping System Using RZWQM. Vadose Zone J. 2006, 5, 493–505. [Google Scholar] [CrossRef]
  36. Zhou, Q.S.; Wu, Q.X.; Zhu, J.Q.; Qiao, Y.; Peng, R.X.; Fan, C.J. Effects of different basal-topdressing ratios of nitrogen fertilizer on nitrogen absorption, transportaiton and utilization of direct-seeding rice. Jiangsu J. Agric. Sci. 2022, 38, 915–923. [Google Scholar] [CrossRef]
  37. Wang, S.S.; Luo, M.P.; Liu, T.F.; Li, Y.; Ding, J.L.; Yang, R.J.; Liu, Y.L.; Zhou, W.; Wang, D.R.; Zhang, H. Optimization of Nitrogen Fertilizer Management in the Yellow River Irrigation Area Based on the Root Zone Water Quality Model. Agronomy 2023, 13, 1628. [Google Scholar] [CrossRef]
  38. Li, H.; Wang, L.; Qiu, J.; Li, C.; Gao, M.; Gao, C. Calibration of DNDC model for nitrate leaching from an intensively cultivated region of Northern China. Geoderma 2014, 223, 108–118. [Google Scholar] [CrossRef]
  39. Li, Z.J. Evaluating Nitrogen Loss and Water and Nitrogen Use Efficiencies in a Double Cropping System under Different Integrated Mangagements in the North China Plain; China Agricultural University: Beijing, China, 2015. [Google Scholar]
  40. Lu, R.K. Soil-Plant Nutrition Principles and Fertilisation; Chemical Industry Press: Beijing, China, 1998. [Google Scholar]
  41. Wang, X.; Huang, G. Evaluation on the irrigation and fertilization management practices under the application of treated sewage water in Beijing, China. Agric. Water Manag. 2008, 95, 1011–1027. [Google Scholar] [CrossRef]
  42. Zhao, Z.G.; Qin, X.; Wang, E.L.; Carberry, P.; Zhang, Y.H.; Zhou, S.L.; Zhang, X.Y.; Hu, C.S.; Wang, Z.M. Modelling to increase the eco-efficiency of a wheat-maize double cropping system. Agr. Ecosyst. Environ. 2015, 210, 36–46. [Google Scholar] [CrossRef]
  43. Jin, L.; Cui, H.; Li, B.; Zhang, J.; Dong, S.; Liu, P. Effects of integrated agronomic management practices on yield and nitrogen efficiency of summer maize in North China. Field Crops Res. 2012, 134, 30–35. [Google Scholar] [CrossRef]
  44. Zou, X.J.; Zhang, X.Y.; An, J.W. Effect of reducing and postponing of N application on yield, plant N uptake, utilization and N balance in maize. Soil Fertil. Sci. China 2011, 6, 25–29. [Google Scholar]
  45. Zhang, W.L.; Tian, Z.X.; Zhang, N.; Li, X.Q. Nitrate pollution of groundwater in northern China. Ecosyst. Environ. 1996, 59, 223–231. [Google Scholar] [CrossRef]
  46. Cao, Q.H.; Gong, Y.S. Simulation and analysis of water balance and nitrogen leachingusing Hydrus-1D under winter wheat crop. Plant Nutr. Fertil. Sci. 2003, 9, 7. [Google Scholar] [CrossRef]
  47. Huang, M.X.; Liang, T.; Ou-Yang, Z.; Wang, L.Q.; Zhang, C.S.; Zhou, C.H. Leaching losses of nitrate nitrogen and dissolved organic nitrogen from a yearly two crops system, wheat-maize, under monsoon situations. Nutr. Cycl. Agroecosystems 2011, 91, 77–89. [Google Scholar] [CrossRef]
  48. Cao, Y.S.; Tian, Y.H.; Yin, B.; Zhu, Z.L. Improving agronomic practices to reduce nitrate leaching from the rice-wheat rotation system. Agric. Ecosyst. Environ. 2014, 195, 61–67. [Google Scholar] [CrossRef]
  49. Tang, L.-Y.; Li, C.-F.; Ma, W.; Zhao, M.; Li, X.-L.; Li, L.-L. Characteristics of Plant Morphological Parameters and Its Correlation Analysis in Maize under Planting with Gradually Increased Density. Acta Agron. Sin. 2012, 38, 1529–1537. [Google Scholar] [CrossRef]
  50. Min-Wei, D.; Xiong, D.U.; Meng-Xing, L.; Jian-Heng, Z.; Yan-Hong, C. Effects of nitrogen management modes on yield formation and nitrogen utilization efficiency of summer maize. Plant Nutr. Fertil. Sci. 2010, 16, 1100–1107. [Google Scholar]
Figure 1. Location of the test area.
Agronomy 13 03081 g001
Figure 2. Temperature and rainfall in the test area during the reproductive period of summer maize.
Agronomy 13 03081 g002
Figure 3. Methodological scheme.
Agronomy 13 03081 g003
Figure 4. Comparison of simulated and measured values of soil volumetric water content in each soil layer across the 0–100 cm depth for N320 (1:1:0) treatment in 2023.
Agronomy 13 03081 g004
Figure 5. Comparison of simulated and measured values of soil nitrate-N content in each soil layer across the 0–100 cm depth for N320 (1:1:0) treatment in 2023.
Agronomy 13 03081 g005
Figure 6. Relationship between simulated and measured values of summer maize yield and above-ground biomass in 2023. (a) Yield. (b) Above-ground biomass.
Agronomy 13 03081 g006
Figure 7. Crop yield, nitrate-N leaching, N agronomic efficiency, and value-to-cost ratio under different N fertilizer managements. a is the basal N to topdress N application ratio of 1:5, b is the basal N to topdress N application ratio of 1:4.
Agronomy 13 03081 g007
Table 1. Basic physicochemical properties of soil (0–100 cm soil layer).
Soil Depth/cmVolume/(g·cm−3)Mechanical Composition/%Soil Organic Matter
/(g·kg−1)
Initial
Nitrate-N
Content
/(mg·kg−1)
GritGranuleAgglomerate
0–201.5242.243.314.515.66.8
20–401.4844.235.320.513.24.8
40–601.4638.439.522.13.23.8
60–801.5543.738.617.73.54.1
80–1001.5543.338.518.21.64.0
Table 2. Field management practices for different N application treatments during the period 2022–2023.
TreatmentBase Fertilizer/(kg·ha−1)Fertilizer DatesN Application/(kg·ha−1)
June 20
(June 25) **
July 18
(July 23)
August 7
(August 12)
N120 (1:1:0) *6030300120
N120 (1:0:1)6030030120
N120 (0:1:1)6003030120
N220 (1:1:0)6080800220
N220 (1:0:1)6080080220
N220 (0:1:1)6008080220
N320 (1:1:0)601301300320
N320 (1:0:1)601300130320
N320 (0:1:1)600130130320
CK00000
* Proportions in parentheses are the ratios of the fertilizer amounts at three fertilizer time points. ** Data in parentheses are the timing of each fertilizer application for summer maize in the second season.
Table 3. Parameters of soil hydraulic properties after rate determination.
Soil Depth/cmSaturated Hydraulic Conductivity Ks
/(cm·d−1)
Saturated Water Content θs
/(cm3·cm−3)
Residual Moisture Content θr
/(cm3·cm−3)
α/(cm−1) *mnl
0–2014.70.3650.0560.020.251.340.5
20–4033.80.3800.0460.0160.211.270.5
40–6021.00.4000.0460.0160.251.340.5
60–8028.90.3800.0300.0110.221.290.5
80–10030.20.3800.0300.0150.241.320.5
* α, m, n, and l are parameters of the van Genuchten moisture signature curve.
Table 4. Main parameters of soil carbon and N cycling after rate determination.
ParameterNumerical ValueUnit
SOM1 library decomposition rate2.7 × 10−6d−1
SOM2 library decomposition rate1.4 × 10−4d−1
SMB1 library death rate1.85 × 10−4d−1
SMB2 library death rate1 × 10−2d−1
AOM1 library decomposition rate5 × 10−2d−1
AOM2 pool decomposition rate5 × 10−2d−1
Maximum nitrification rate Vn20g·(m3·d)−1
Nitrification half-saturation constant Kn80g·m−3
Denitrification example coefficient Kd0.5/
Denitrification empirical constant Ad0.05/
Ammonia volatilization first-order kinetic constant Kv0.05d−1
Table 5. Main crop parameters after rate determination.
ParameterNumerical ValueUnit
Accumulated temperature required for crop maturity1660
Early crop coefficient Kc0.6/
Middle crop coefficient Kc1.55/
Late crop coefficient Kc1.05/
Maximum specific leaf area27m2·kg−1
Minimum specific leaf area18m2·kg−1
Minimum assimilation rate0.5kg·ha−1·h−1
Maximum assimilation rate60kg·ha−1·h−1
Maximum root length120cm
Table 6. Statistical indicators of soil volumetric water content across the 0–100 cm depth soil layer under various treatments for summer maize in 2023.
TreatmentStatistical IndicatorSoil Depth/cm
0–2020–4040–6060–8080–100
N120 (1:1:0)RMSE/(cm3·cm−3)0.050.020.030.030.02
nRMSE/%21%9%10%13%10%
ME/(cm3·cm−3)−0.0360.008−0.0040.0250.008
N120 (1:0:1)RMSE/(cm3·cm−3)0.040.020.030.030.02
nRMSE/%21%9%10%13%10%
ME/(cm3·cm−3)−0.0360.008−0.0030.0250.009
N120 (0:1:1)RMSE/(cm3·cm−3)0.050.020.030.030.02
nRMSE/%21%9%10%13%10%
ME/(cm3·cm−3)−0.0360.008−0.0030.0250.008
N220 (1:1:0)RMSE/(cm3·cm−3)0.050.020.030.030.02
nRMSE/%21%9%10%11%10%
ME/(cm3·cm−3)−0.0360.006−0.0060.0220.005
N220 (1:0:1)RMSE/(cm3·cm−3)0.050.020.030.030.02
nRMSE/%21%9%10%12%10%
ME/(cm3·cm−3)−0.0350.007−0.0040.0240.008
N220 (0:1:1)RMSE/(cm3·cm−3)0.050.020.030.030.02
nRMSE/%21%9%10%12%10%
ME/(cm3·cm−3)−0.0360.007−0.0040.0240.008
N320 (1:1:0)RMSE/(cm3·cm−3)0.050.020.030.030.02
nRMSE/%21%9%10%11%10%
ME/(cm3·cm−3)−0.0360.006−0.0060.0220.005
N320 (1:0:1)RMSE/(cm3·cm−3)0.050.020.030.030.02
nRMSE/%21%9%10%12%10%
ME/(cm3·cm−3)−0.0350.007−0.0040.0240.008
N320 (0:1:1)RMSE/(cm3·cm−3)0.050.020.030.030.02
nRMSE/%21%9%10%12%10%
ME/(cm3·cm−3)−0.0360.007−0.0040.0240.008
CKRMSE/(cm3·cm−3)0.050.020.030.030.02
nRMSE/%21%9%10%13%10%
ME/(cm3·cm−3)−0.0360.008−0.005−0.0240.008
Table 7. Statistical indicators of soil nitrate-N content across the 0–100 cm depth soil layer under various treatments of summer maize in 2023.
TreatmentStatistical IndicatorSoil Depth/cm
0–2020–4040–6060–8080–100
N120 (1:1:0)RMSE/(mg·kg−1)2.761.191.000.780.46
nRMSE/%27%23%24%25%16%
ME/(mg·kg−1)−1.6290.036−0.1000.4290.257
N120 (1:0:1)RMSE/(mg·kg−1)2.181.070.810.240.36
nRMSE/%24%26%26%9%16%
ME/(mg·kg−1)−1.2880.083−0.3160.0020.071
N120 (0:1:1)RMSE/(mg·kg−1)1.340.470.340.470.23
nRMSE/%28%22%18%27%13%
ME/(mg·kg−1)−0.817 −0.098 0.065 0.174 −0.051
N220 (1:1:0)RMSE/(mg·kg−1)3.202.071.051.160.37
nRMSE/%27%22%15%25%10%
ME/(mg·kg−1)0.3331.0970.6540.872−0.110
N220 (1:0:1)RMSE/(mg·kg−1)3.101.870.960.330.58
nRMSE/%26%29%25%12%24%
ME/(mg·kg−1)−1.730−0.605−0.4670.1280.162
N220 (0:1:1)RMSE/(mg·kg−1)0.850.830.690.540.33
nRMSE/%13%24%27%28%17%
ME/(mg·kg−1)−0.503−0.157−0.1770.3350.101
N320 (1:1:0)RMSE/(mg·kg−1)3.092.251.711.430.54
nRMSE/%29%25%27%28%14%
ME/(mg·kg−1)1.8381.5101.2220.9830.235
N320 (1:0:1)RMSE/(mg·kg−1)2.031.371.260.710.90
nRMSE/%17%22%22%18%25%
ME/(mg·kg−1)−1.4710.792−0.4790.230−0.213
N320 (0:1:1)RMSE/(mg·kg−1)2.301.570.970.560.40
nRMSE/%25%29%28%21%16%
ME/(mg·kg−1)−0.3790.412−0.1050.4020.128
CKRMSE/(mg·kg−1)1.560.890.780.430.23
nRMSE/%23%27%23%15%12%
ME/(mg·kg−1)0.2310.2100.1640.1510.080
Table 8. N fertilizer management scenarios for summer maize.
TreatmentBase Fertilizer
/(kg·ha−1)
Fertilizer/(kg·ha−1)TreatmentBase Fertilizer
/(kg·ha−1)
Fertilizer/(kg·ha−1)
13
June
23
July
12
August
13
June
23
July
12
August
N80 (1:1:0)a *1632320N170 (1:1:0)b4364640
N80 (0:1:1)a1603232N170 (0:1:1)b4306464
N80 (1:0:1)a1632032N170 (1:0:1)b4364064
N80 (1:1:1)a16212121N170 (1:1:1)b43434343
N80 (1:1:0)b2030300N200 (1:1:0)a4080800
N80 (0:1:1)b2003030N200 (0:1:1)a4008080
N80 (1:0:1)b2030030N200 (1:0:1)a4080080
N80 (1:1:1)b20202020N200 (1:1:1)a40535353
N110 (1:1:0)a2244440N200 (1:1:0)b5075750
N110 (0:1:1)a2204444N200 (0:1:1)b5007575
N110 (1:0:1)a2244044N200 (1:0:1)b5075075
N110 (1:1:1)a22292929N200 (1:1:1)b50505050
N110 (1:1:0)b2841410N230 (1:1:0)a4692920
N110 (0:1:1)b2804141N230 (0:1:1)a4609292
N110 (1:0:1)b2841041N230 (1:0:1)a4692092
N110 (1:1:1)b28282828N230 (1:1:1)a46616161
N140 (1:1:0)a2856560N230 (1:1:0)b5886860
N140 (0:1:1)a2805656N230 (0:1:1)b5808686
N140 (1:0:1)a2856056N230 (1:0:1)b5886086
N140 (1:1:1)a28373737N230 (1:1:1)b58585858
N140 (1:1:0)b3553530N260 (1:1:0)a521041040
N140 (0:1:1)b3505353N260 (0:1:1)a520104104
N140 (1:0:1)b3553053N260 (1:0:1)a521040104
N140 (1:1:1)b35353535N260 (1:1:1)a52696969
N170 (1:1:0)a3468680N260 (1:1:0)b6598980
N170 (0:1:1)a3406868N260 (0:1:1)b6509898
N170 (1:0:1)a3468068N260 (1:0:1)b6598098
N170 (1:1:1)a34454545N260 (1:1:1)b65656565
* a is the basal N to topdress N application ratio of 1:5, b is the basal N to topdress N application ratio of 1:4, and the ratio of N applied between the three chase fertilizers is in parentheses.
Table 9. Results of optimal N fertilizer management analysis using the entropy-weighted TOPSIS method.
Deal withYield
/(kg·ha−1)
Nitrate-N
Leaching/(kg·ha−1)
N
Agronomic
Efficiency/(kg·kg−1)
Evaluation of Calculation
Results
VCRRelative Proximity CSorting Results
N170(0:1:1)a *8354.325.722.519.70.9801
N170(0:1:1)b8354.327.522.519.70.9772
N200(0:1:1)a8354.329.019.116.70.9733
N170(1:0:1)a8354.329.922.519.70.9724
N200(0:1:1)b8354.330.919.116.70.9705
N110(1:1:0)b5459.028.68.519.90.22552
N80(1:1:1)a5210.418.98.626.10.16753
N80(1:1:1)b5202.819.68.526.00.16554
N80(1:1:0)a4666.022.71.823.30.06655
N80(1:1:0)b4648.623.01.523.20.06556
* a is the basal N to topdress N application ratio of 1:5, b is the basal N to topdress N application ratio of 1:4, and the ratio of N applied between the three chase fertilizers is in parentheses.
Disclaimer/Publisher’s Note: The statements, opinions and data contained in all publications are solely those of the individual author(s) and contributor(s) and not of MDPI and/or the editor(s). MDPI and/or the editor(s) disclaim responsibility for any injury to people or property resulting from any ideas, methods, instructions or products referred to in the content.

