Abstract
Crop quality tends to decrease with an increasing grain yield. Nitrogen is an important nutrient and moderate nitrogen foliage application (NFA) can significantly improve the wheat yield and quality. The objective of this study was to investigate the effect of NFA on the grain yield and quality of wheat and its genotype-dependent variation. Eighteen wheat cultivars were used, and two NFA levels (N1 and N2; 10.70 and 21.40 kg N ha−1 two day−1, respectively) were applied. Significant genotypic differences in the yield and quality were observed among the 18 varieties, and their responses to NFA differed. For nine varieties in the experiment, N1 increased the grain yield, but N2 did not. In contrast, high concentrations of NFA had no effect on the grain yield in the other nine varieties. The protein content and composition and trace element (Fe, Zn, etc.) are all nutrient elements that notably affect the wheat grain quality and yield. NFA significantly increased the grain prolamin and glutelin concentrations in the grains, thereby increasing the total protein concentration. The prolamin, glutelin, and total protein concentrations in the grains of the lower-protein cultivars were more sensitive to NFA than those of the higher-protein cultivars. In addition, NFA significantly decreased the amylose concentration in the grains. By affecting the prolamin, glutelin, and amylose concentrations in the grains, NFA significantly increased the development and stability times of the corresponding wheat flour dough, thereby improving the dough quality. Moreover, NFA reduced the molar ratio of phytic acid to Fe and Zn, increasing the bioavailability of trace elements. The judicious application of nitrogen fertilizer resulted in the synergistic improvement in the yield and quality.
1. Introduction
With economic development and improvements in living standards, the demand for high-quality wheat and flour has rapidly increased. However, crop quality tends to decrease with an increasing grain yield [1]. Therefore, balancing the yield and quality has become a priority for wheat production in China. Nitrogen (N) is an important nutrient that significantly affects the yield and quality of wheat [2]. Dick, Thompson [3] indicated that late-season N treatments significantly influenced protein but did not significantly increase or decrease the grain yield. Mohammed, Kelly [4] have shown that applying the right quantity of N at the appropriate times may allow producers to increase the grain protein content of their wheat without sacrificing the yield. Wheat varieties of different genotypes were selected for these experiments. These studies indicate that genotypic differences have been observed in the effect of N on the grain yield and quality. Therefore, clarifying the effect of N fertilizer on the yield and quality of different wheat varieties is important to ensure food security and achieve simultaneous improvements in quality and quantity.
Klikocka, Cybulska [5] showed that judicious soil application of N fertilizer can simultaneously increase the yield and quality of wheat. Foliar spraying is an important supplementary measure for soil fertilization that can improve the efficiency of crop absorption and transformation of nutrients and is typically recommended and used in wheat production [6]. The effect of N foliage application (NFA) on the grain yield has been elucidated in several studies. Lv, Ding [7] suggested that late-season applications of foliar N have the potential to increase the yield in winter wheat. Abad, Lloveras [8] showed that NFA had no effect on the wheat yield. However, Dick, Thompson [3] showed that NFA reduced the wheat yield. Moreover, N fertilizers significantly affect the protein composition, as well as the starch concentration and composition [9,10]. Nitrogen also significantly affects and is strongly correlated with grain Fe and Zn contents [11]. In addition, studies have shown that the application of N fertilizers can increase the nutrient content, thereby enhancing the bioavailability of trace elements [12]. This implies that protein and trace element concentrations notably affect the wheat grain quality and yield [10]. These studies suggest that NFA significantly affects the wheat grain yield and quality. However, the effects of NFA on the yield and quality of wheat varieties of different genotypes are not well understood.
In the late stage of wheat filling, the climate is relatively dry, the availability of soil nutrition decreases, and the vitality of root systems continues to decrease, with limited growth potential [13]. At this time, it is necessary to supplement nutrients in a timely manner to ensure a high yield and high-quality production of wheat. Rossmann, Buchner [14] showed that leaf N application could effectively increase the grain protein content. Structural proteins, such as albumin and globulin, are less affected by environmental factors [15]. Ben Mariem, González-Torralba [16] showed that N application increased the concentration of trace elements in grains. Trace elements such as Fe and Zn are important indicators of the nutritional quality of wheat grains and support normal growth in humans [17]. Phytic acid is the main factor related to the bioavailability of Fe, Zn, and other trace elements in wheat, as it is the most effective inhibitor of trace elements in cereal crops [18]. The bioavailability of microelements is indirectly expressed by their molar ratio to phytic acid [19]. More importantly, the content of trace elements, such as Fe and Zn, in wheat grains and their bioavailability are generally low, leading to deficiencies in these micronutrients in countries where wheat is consumed as a staple food [20]. A previous study showed a positive correlation between grain weight proteins and trace elements, such as Zn [20]. Agronomic measures, such as fertilization, are also considered effective ways to increase the yield and quality [15,21,22,23]. Therefore, it is necessary to implement corresponding agricultural measures (e.g., N fertilizer application) to improve grain processing and the nutritional quality.
It has been suggested that the effect of N on the grain yield and quality presents genotypic differences [24]. Notably, NFA is an important measure to realize the simultaneous improvement in the grain yield and quality. In this study, 18 wheat cultivars and 2 NFA levels were used. The grain yield, protein, starch, microelements, phytate concentration, and gluten characteristics were determined. The objectives of this study were to investigate the effect of NFA on the grain yield and quality for different wheat genotypes and determine whether NFA can balance the relationship between the grain yield and quality for wheat production.
2. Materials and Methods
2.1. Study Site Description
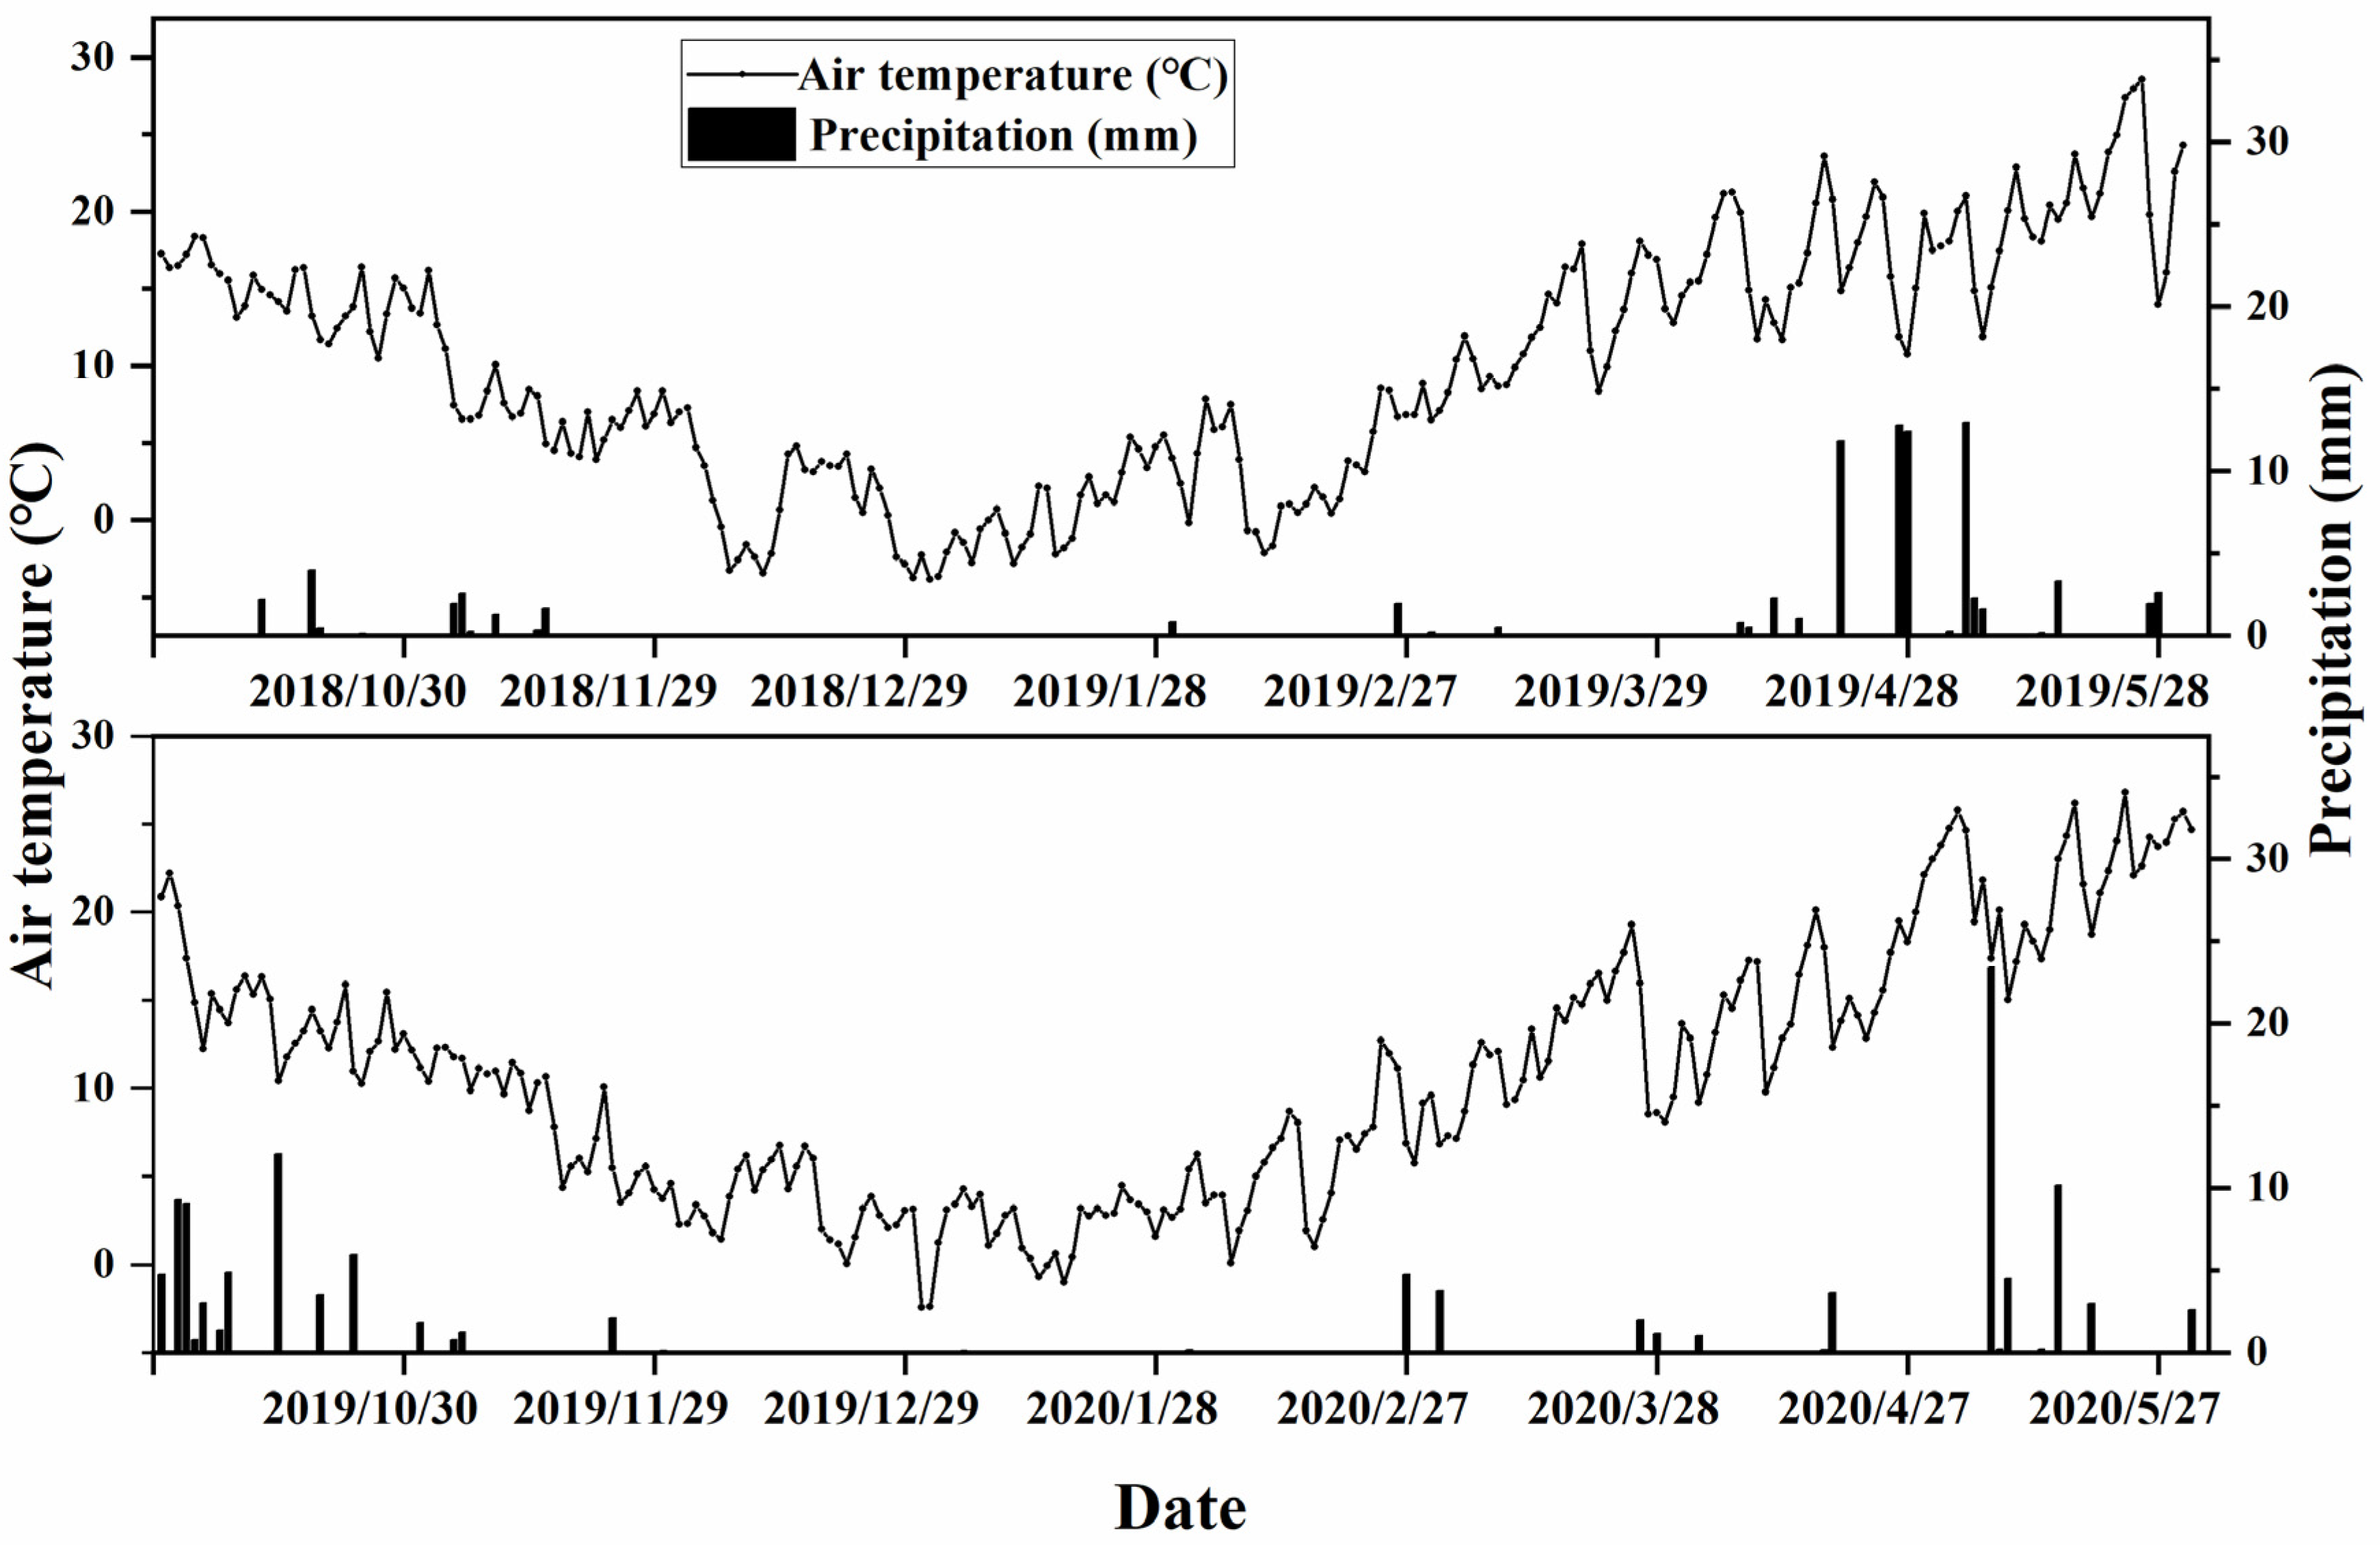
This study was conducted from 2018 to 2020 at the Doukou Experimental Farm of Northwest A&F University, Shaanxi Province, China (34°36′ N, 108°52′ E). Meteorological data (rainfall, temperature, etc.) were recorded at the Vantage Pro2 meteorological station (Davis Instruments Corporation, Hayward, CA, USA) located next to the experimental field. The method reported in [12,25] was used to determine soil physicochemical properties. The soil type was loamy clay. The organic matter content and available N, P, and K of the 0–20 cm topsoil of the cropland in this study in 2018 were 15.11 g kg−1, 37.52 mg kg−1, 19.2 mg kg−1, and 207.64 mg kg−1, respectively. Temperature and rainfall are shown in Figure 1.
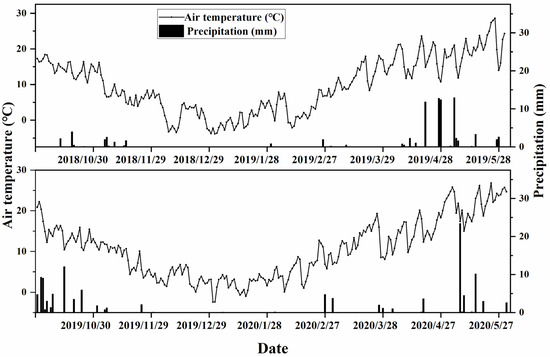
Figure 1.
Daily temperature and precipitation during the winter wheat growing seasons.
2.2. Experimental Design
Eighteen wheat cultivars, Luomai18 (LM18), Bonong6 (BN6), Luohan7 (LH7), Xinong509 (XN509), Xinong528 (XN528), Weilong323 (WL323), Xinong836 (XN836), Xinong109 (XN109), Xingmai918 (XM918), Nongda1108 (ND1108), Xinong5812 (XN5812), Weilong123 (WL123), Zhengmai158 (ZM158), Jimai22 (JM22), Xinong256 (XN256), Xiaoyan22 (XY22), Xiaoyan58 (XY58), and Xinong585 (XN585) were grown. Wheat varieties widely cultivated in the Huanghuai wheat area were selected as the experimental materials. The origin of these varieties and their physiological characteristics are shown in Table 1.

Table 1.
Origin, thousand grain weight, and breeding sites of the 18 wheat cultivars in this study.
The seeding rate was 150 kg ha−1 and the row spacing was 0.25 m with mechanical planting. Urea (nitrogen content: 46%) and diammonium or thophosphate (phosphate content: 46%) were applied at basal levels, whose contents of nitrogen and phosphate were 240 kg ha−1 and 100 kg ha−1, respectively. At the flowering stage, either N1 or N2 (urea; 10.70 and 21.40 kg N ha−1 two day−1, respectively) were sprayed onto the leaves at the rate of 750 L ha−1 using a sprayer after 5 PM. An equal volume of deionized water was applied to the control plants (CK). All solutions and deionized water contained 0.01% (v/v) Tween-20, sprayed evenly at the rate of 750 L ha−1 with a backpack sprayer. The experiment was based on an 18 × 3 factorial design (18 cultivars, 3 NFA application rates). Each treatment was applied to three plots as replicates with a completely randomized block design, and the dimensions of each plot were 5 m × 3 m.
2.3. Sampling and Measurement
2.3.1. Grain Yield Determination
Three 1 m2 areas in each plot (excluding the boundary) were selected, and the plants in those areas were harvested. After natural drying of wheat grains, the yield per unit area was calculated.
2.3.2. Determination of Protein Content and Components, Starch, and Dough Rheological Properties
Grain protein concentration, development time, and dough stability time were determined using a near-infrared analyzer (DA7250, Perton, Hagersten, Stockholm, Sweden) [26]. The sample plate containing the instrument was filled with wheat grains and flattened. Then, the sample tray was placed in the analysis position for analysis.
Protein composition was determined based on the method of Liu et al. [27]. Four protein fractions were sequentially extracted in the following order: albumin, globulin, prolamin, and glutelin. The protein components were heated and digested with H2SO4 and measured using an AA3 auto-analyzer (SEAL, Norderstedt, Germany) [27]. Amylose and amylopectin concentrations were determined using dual-wavelength spectrophotometry according to the method of Schirmer et al. [28].
2.3.3. Determination of the Microelement and Phytic Acid Contents
To determine the Fe and Zn concentrations, samples were pretreated according to the method described by Husted [29]. After digestion, the resulting solution was analyzed using an atomic absorption flame emission spectrophotometer (Z-2000; Hitachi Ltd., Tokyo, Japan). The phytic acid content of the flour was measured using the method of Liu et al. [27]. The molar ratios of phytic acid to Fe and Zn ([phytic acid]:[Fe] and [phytic acid]:[Zn]) were calculated according to a previously reported method by Gargari et al. [19]. Each sample was measured in triplicate based on internal calibration, and the average value was calculated.
2.4. Statistical Analysis
There was little change in the climate between the two years (Figure 1). In addition, the study found that the wheat grain yield and quality indexes did not change significantly for two years. So, the average value over two years was used for analysis. To separate the sources of variation, two-way analysis of variance (ANOVA) was performed using SPSS 19.0 (IBM, New York, NY, USA) for the cropping variety, NFA application, and interaction between these on the yield and quality indicators. Correlation analysis heat maps were drawn using GraphPad Prism 8.0.2 (GraphPad Software, Boston, MA, USA). The least significant difference method was at p ≤ 0.05 (LSD 0.05). Principal component analysis (PCA) was performed using the software package “factoextra” in R v3.5.3 (http://www.r-project.org, accessed on 1 November 2023).
3. Results
3.1. Grain Yield and Total Protein
The ANOVA indicated that the NFA, cultivar, and their interaction significantly affected the grain yield and total protein content of the wheat (Table S1). The wheat grain yield and total protein concentration also showed significant genotypic differences among the studied varieties (Table S1). Significant genotypic differences were observed in the yield and protein between all 18 varieties, and the responses to NFA were different for each variety (Table 2). Among them, the yields of nine varieties first increased and then decreased with the increase in the N fertilizer concentration, whereas those of the other varieties did not respond significantly to the N fertilizer. Except for WL123 and XN836, the protein content of all varieties increased with the increasing N fertilizer concentration, and the highest yield for any variety was obtained at the N2 level in WL323. XY22 had the lowest grain weight, while XN528 and XN585 had the highest and lowest grain protein concentrations, respectively, among the varieties. Compared to the yield, NFA had a more significant impact on the protein content.
Table 2.
Effect of NFA on grain yield and total protein content of 18 wheat varieties.
NFA significantly affected both the grain yield and protein concentration, although its effect was greater on the protein concentration. For some varieties, the grain yield first increased and then decreased with the increasing N levels, with the highest yield obtained at the N1 level. However, both NFA treatments significantly increased the grain protein concentration, with that of the N2 treatment being significantly higher than that of the N1 treatment.
3.2. Grain Protein Component
The ANOVA indicated that NFA significantly affected the total protein, prolamin, and glutelin concentrations of the wheat flour (Table S1). NFA had no significant effect on the albumin and globulin concentrations. The interaction between the variety and N fertilizer also significantly affected the grain yield and quality indices.
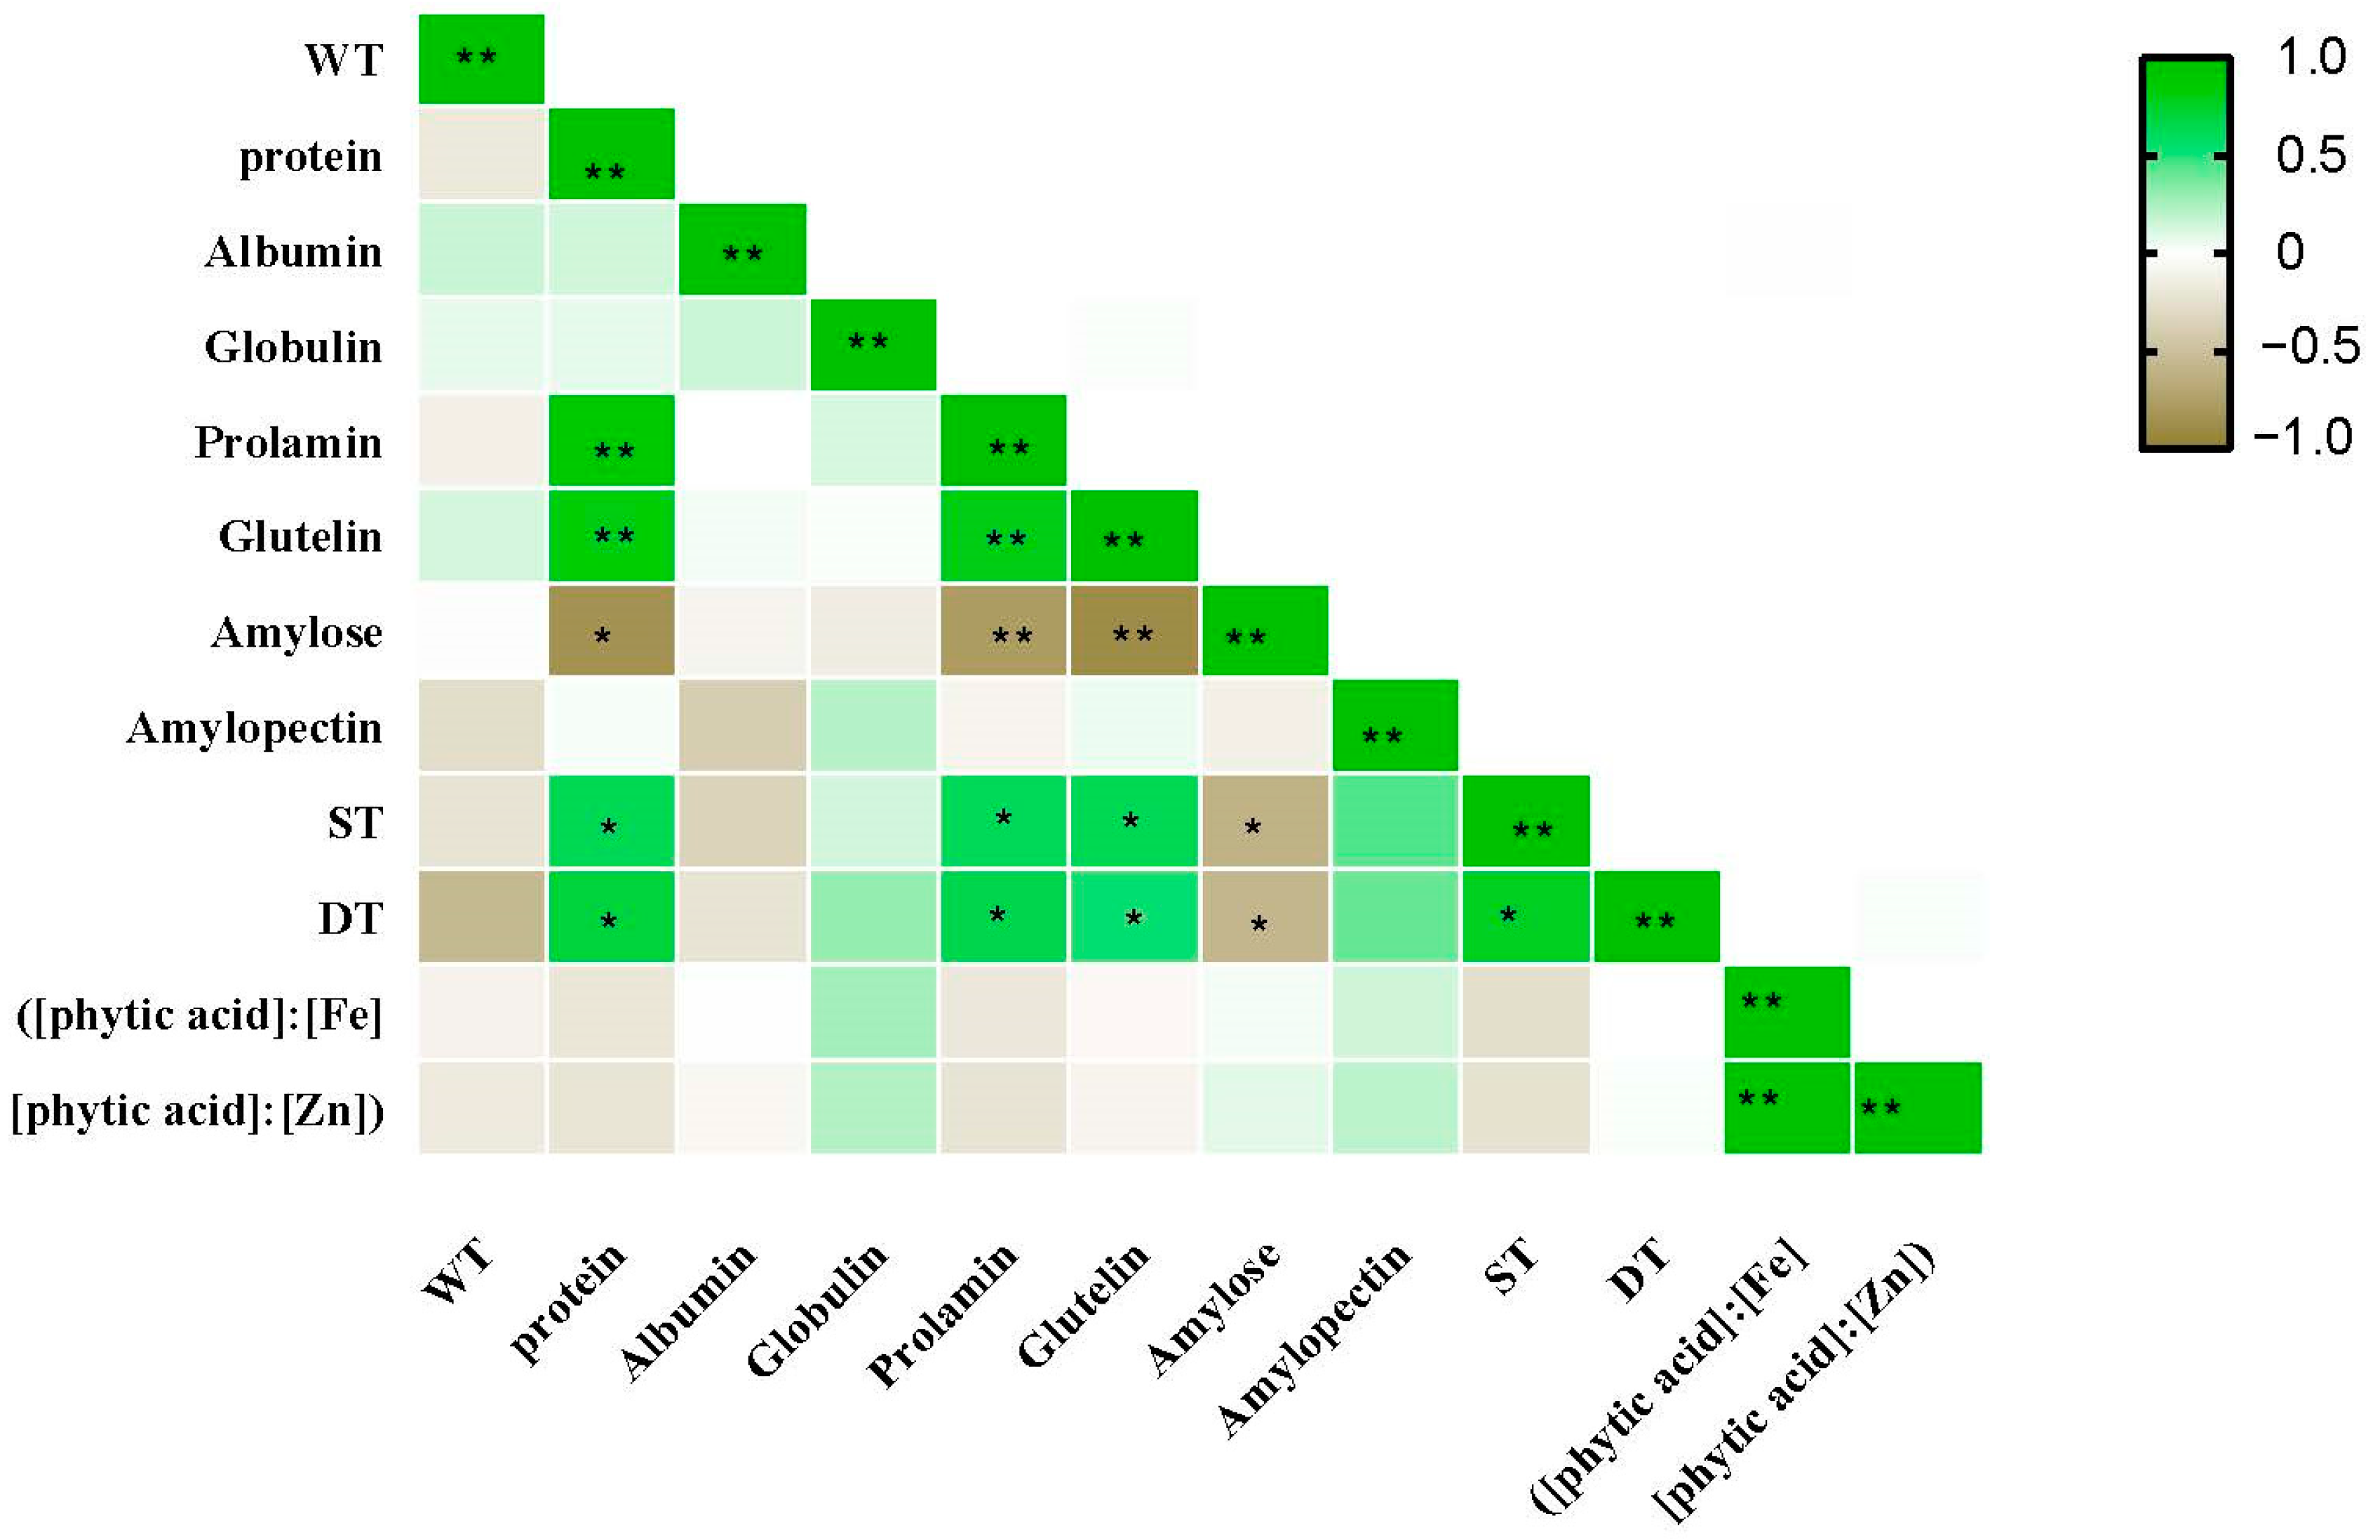
The protein components, albumin, globulin, prolamin, and glutelin, showed significant genotypic differences (Table 3). However, NFA had different effects on the concentrations of the four protein components. NFA significantly promoted the prolamin and glutelin concentrations but had no significant effect on the albumin and globulin concentrations of the wheat flour. Additionally, the effect of NFA on the prolamin and glutelin concentrations showed notable genotypic differences. Among the 18 varieties, NFA had no significant effect on the prolamin concentration in 4 varieties, and no significant effect on the glutelin concentration in 7 varieties. Correlation analysis showed that the total protein content was positively correlated with gliadin and glutenin (Figure 2).
Table 3.
Effects of NFA on grain protein components of 18 wheat varieties.

Figure 2.
Correlation analysis between grain yield and quality of 18 wheat varieties under NFA. The * indicates p ≤ 0.05, ** indicates p ≤ 0.01.
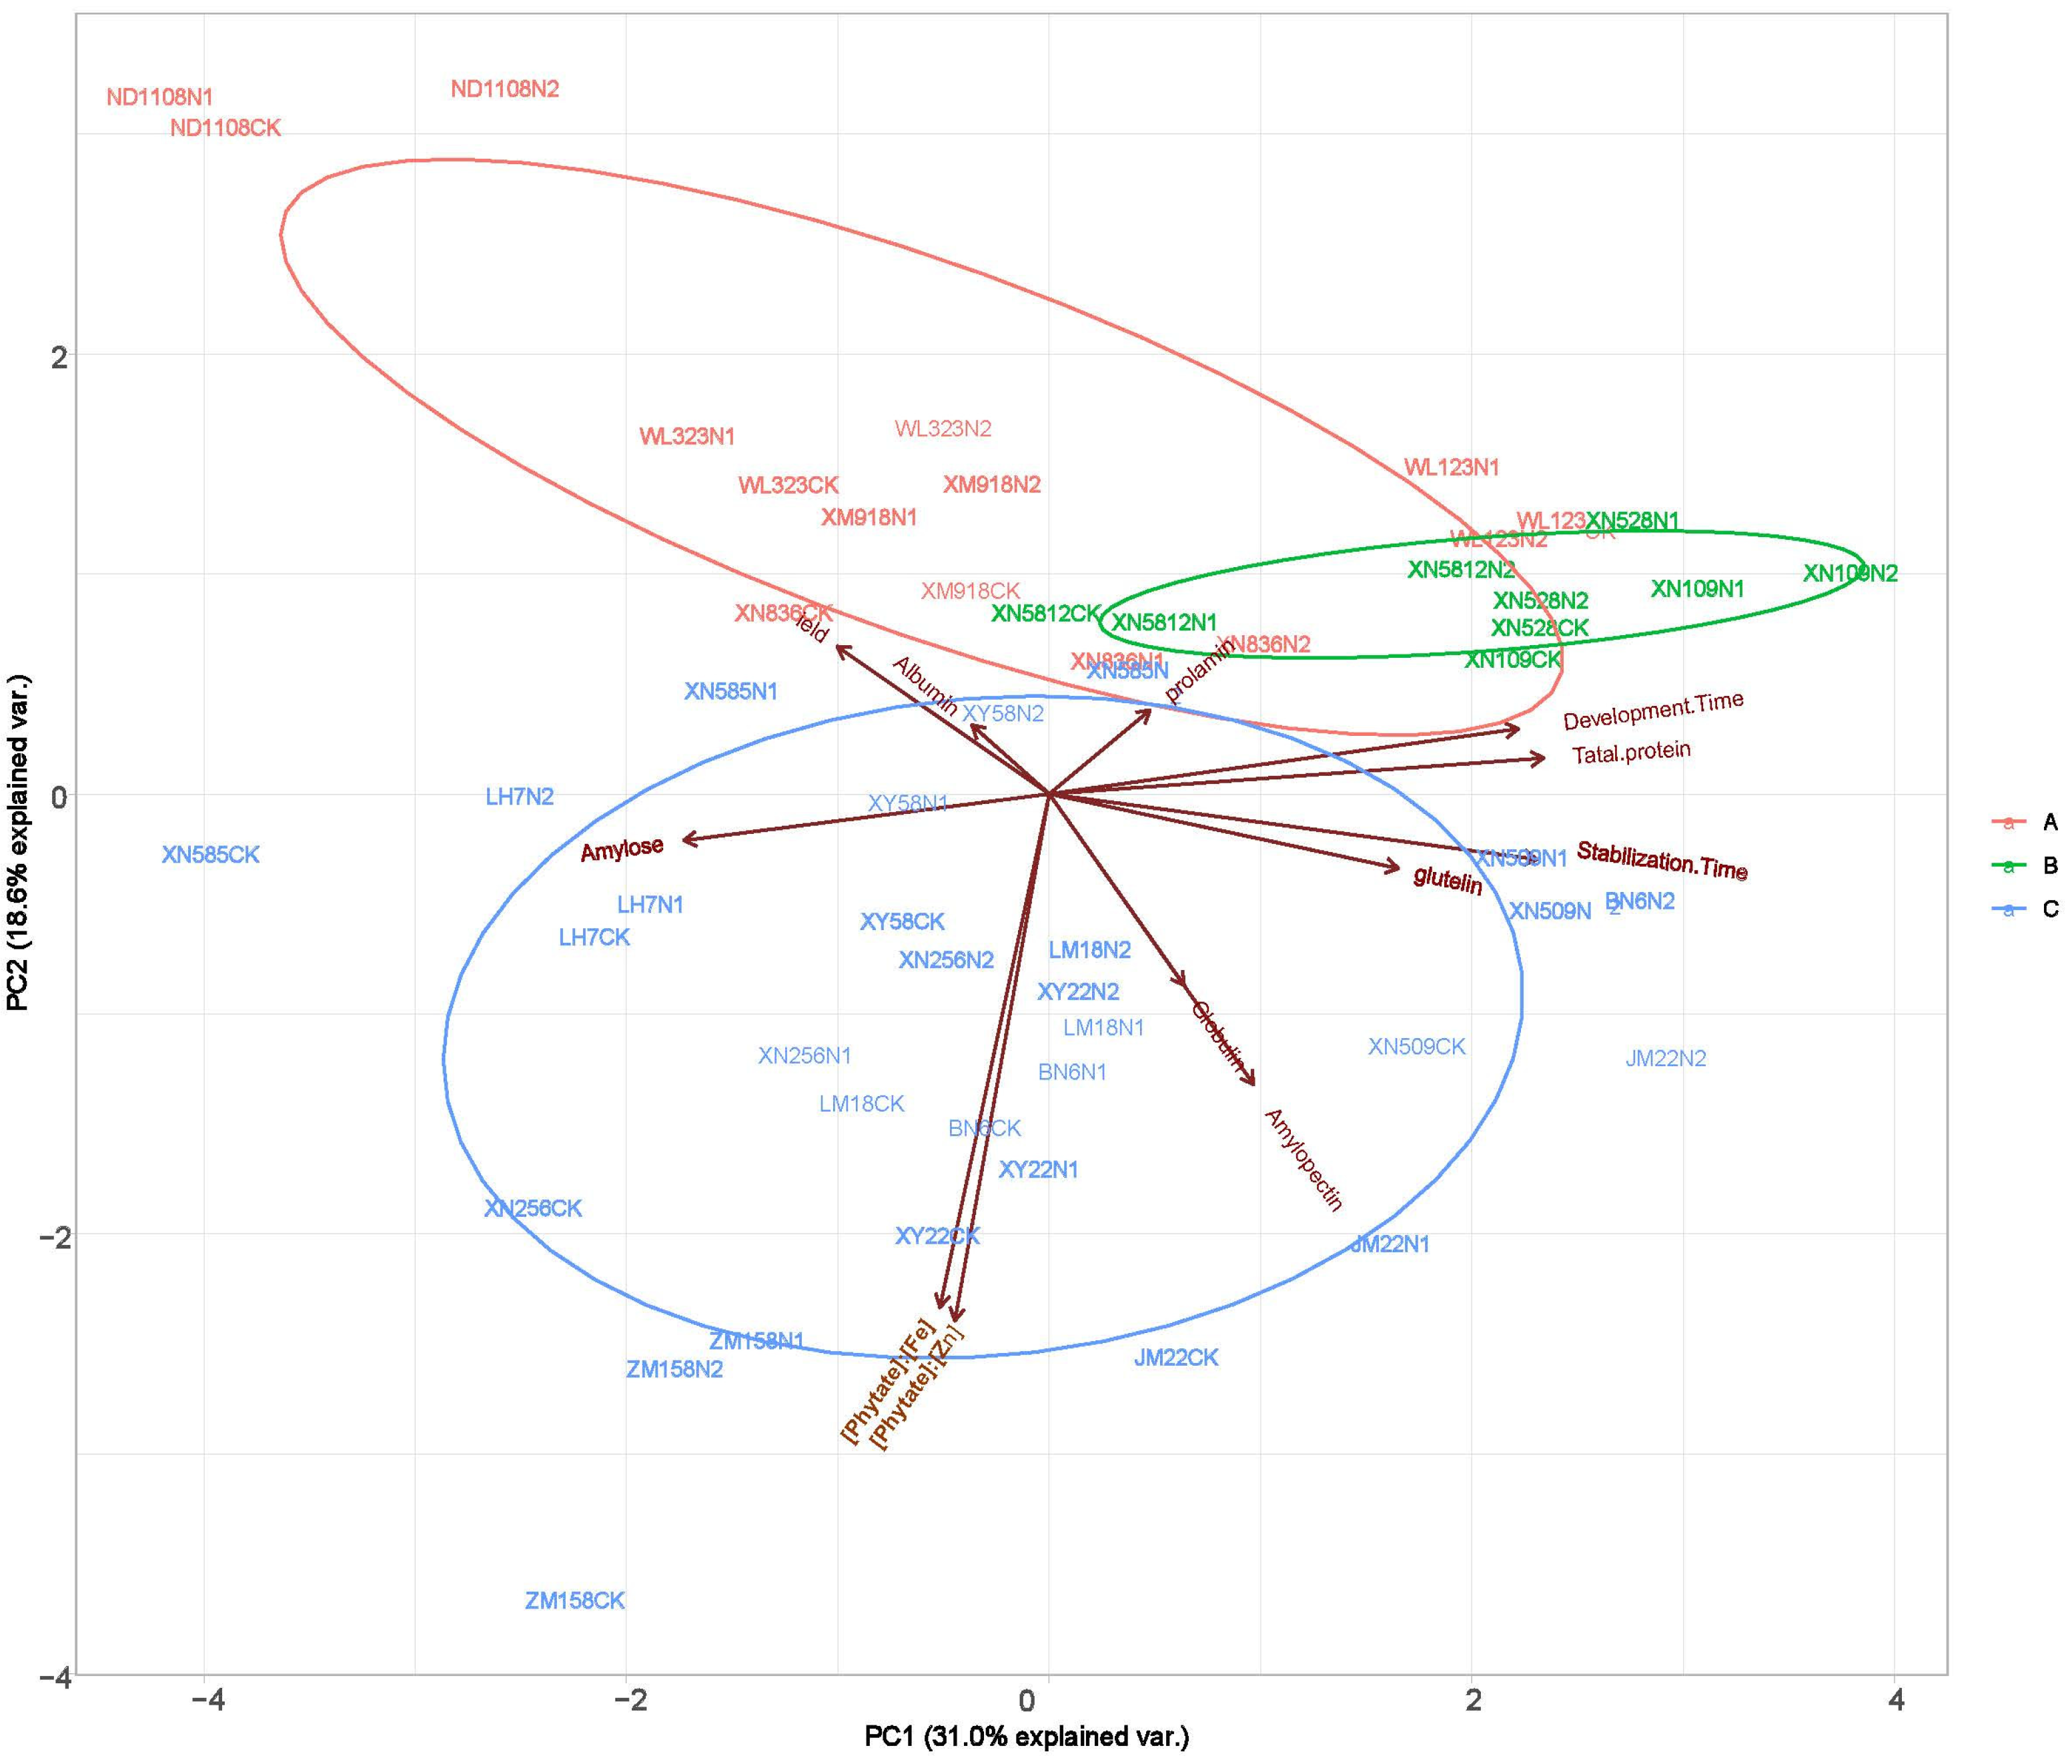
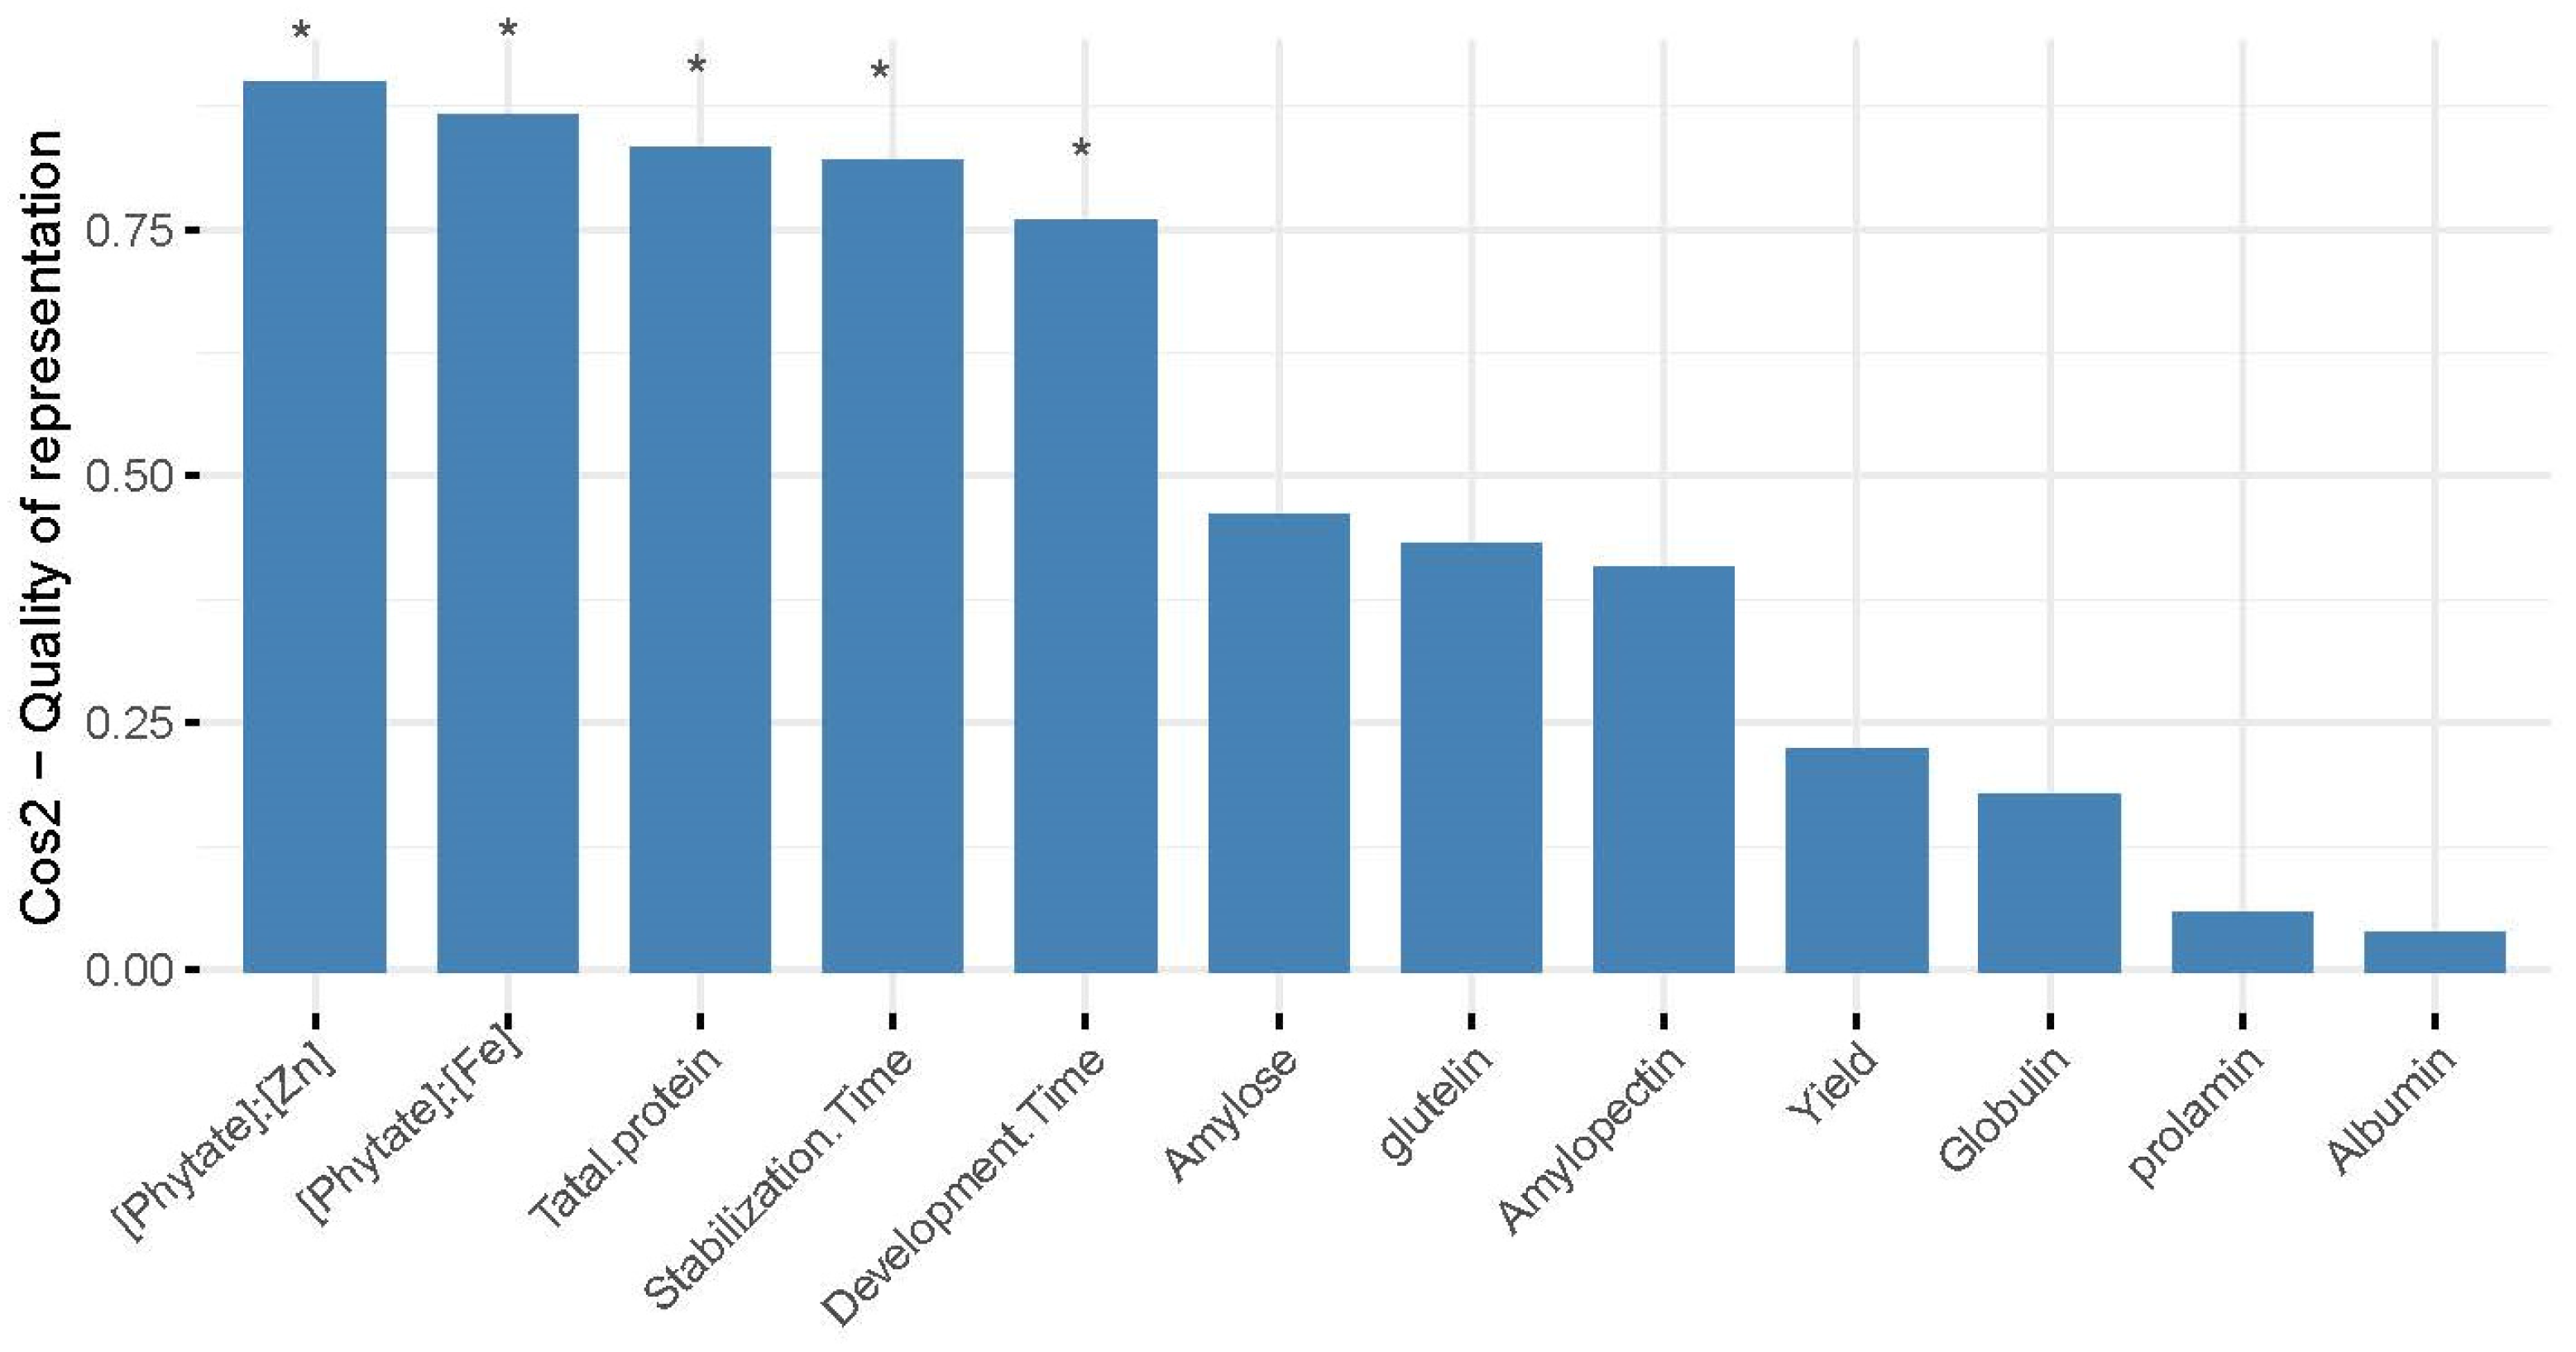
The grain yield and quality indices were clustered using a systematic clustering method, and the results showed that the 18 wheat varieties were clustered into three groups (Figure 3). Among them, five varieties clustered into group I (red); XN528, XN109, and XN5812 clustered into group II (green); and ten varieties clustered into group III (blue). For group I, the higher content of the yield and albumin were the main reason for the clustering of the five varieties. For group II, the higher content of prolamin was the main reason for the clustering of the three wheat varieties. For group III, both the yield and measured quality indicators are relatively high, which were the main factors causing the clustering of 10 varieties into groups. [Phytate]:[Fe], [Phytate]:[Zn], total protein, stabilization time, and development time had significant differences (p < 0.05) between treatments; also, these traits contributed mostly to the total variations in the agronomic traits among the different varieties (Figure 4).

Figure 3.
Principal components analysis (PCA) displays the difference in yield and quality trait profiles between N1, N2, CK.

Figure 4.
Contribution of each quality trait to the overall yield and quality trait variations based on the results of PCA. Asterisks above bars indicate the index are significantly different (p < 0.05) between treatments.
3.3. Grain Starch Component and Dough Properties
The ANOVA indicated that NFA significantly affected the amylose and amylopectin concentrations, development time, and stability time of the flour (Table S1). The interaction between the variety and N fertilizer also significantly affected the development and stabilization times. The amylose and amylopectin concentrations showed significant genotypic differences (Table 4). XN256 had the highest flour amylose concentration (14.86%) and XN528 had the lowest (12.20%). The coefficient of variation (CV) of amylose among the varieties was 6.68%. The highest and lowest amylopectin concentrations were 54.11% and 42.31% for XN5812 andND1108, respectively. The CV of amylopectin among the varieties was 5.33%. NFA had different effects on the amylose and amylopectin concentrations in the wheat flour. Overall, NFA significantly decreased the amylose concentration but had no significant effect on the amylopectin concentration.
Table 4.
Effect of NFA on grain starch content and dough characteristics of 18 wheat varieties.
The development and stability times of the dough also showed significant genotypic differences (Table 4). ND1108 showed the maximum development and dough stability times. Collectively, NFA significantly promoted the development and stability of the dough. The total protein content positively correlated with the gliadin and glutenin levels (Figure 2). A significant negative correlation was observed between the amylose and dough development and stabilization times.
3.4. Bioavailability of Trace Elements
The ANOVA indicated that for NFA, the interaction between the variety and N fertilizer significantly affected the molar ratio of phytic acid to the trace elements (Fe and Zn) in the wheat (Table S1). The Fe, Zn, and phytic acid contents in the grains also showed significant genotypic differences (Table S2). NFA significantly increased the contents of Fe and Zn, and the higher the concentration of N fertilizer, the more evident the increase. The Impact of NFA on the phytic acid content was relatively small and reduced the phytic acid content in XM918, ZM158, XN585, and ND1108, but had no significant effect on the phytic acid content of the other 13 varieties. Table 5 shows the changes in [phytate]:[Fe] and [phytate]:[Zn] in grains under different N treatments. Genotypic differences were observed in the molar ratios of phytic acid to Fe and Zn; however, the responses to N were similar. NFA reduced the molar ratio of phytic acid to Fe and Zn and increased the bioavailability of the trace elements. In general, the higher the concentration of NFA, the more significant the effect.
Table 5.
Effect of NFA on the molar ratio of phytic acid to trace elements of 18 wheat varieties.
4. Discussion
In the drylands of northern China, NFA is primarily used for wheat production. However, the reported effect on the wheat grain yield differs among studies [3,5]. Dick, Thompson [3] indicated that N fertilizer did not significantly affect the grain yield. However, Klikocka, Cybulska [5] showed that N fertilizer could increase the yield of wheat. This study showed that NFA significantly affected the grain yield of wheat, and this effect was significantly related to the N concentration and variety applied. We also showed that the responses of the 18 studied varieties to NFA differed, and both the yield and quality of 9 varieties were improved after the application of N fertilizer. However, the yields of the other varieties decreased with the quality index improvement. This indicated that the concentration of N fertilizer to be applied must be tailored to each variety. A previous study showed that N fertilizer significantly affected the cereal grain filling and weight [30]. Moderately increasing the N fertilizer application during the middle and late growth stages notably promoted the grain filling rate and weight of cereals, but excessive N fertilizer application during these stages significantly decreased the cereal grain yield [31]. The reason for this was that excessive N fertilizer application during the middle and late growth stage promoted excessive vegetative growth, with an accompanying diversion of nutrients from the grain [31]. This implies that for some varieties, high concentrations of NFA N2 (21.40 kg N ha−1 two day−1) may promote carbohydrate transport to grain, thereby increasing the grain weight; however, for other varieties, NFA might inhibit this process and decrease the grain weight.
Previous studies have suggested that NFA significantly increased the wheat grain protein concentration [3,5]. Similar results were obtained in the present study, which was due to the re-transport of N in vegetative organs promoted by the application of N fertilizer [13]. Overall, NFA significantly increased the wheat grain protein concentration. This was primarily achieved by promoting the storage of gliadin and glutenin (Figure 2). However, in the XN528 and XN109 cultivars (high-protein cultivars, group II), the protein concentrations in the grains were not significantly different among the N1, N2, and CK treatments. In the ND1108 and WL323 cultivars (low-protein cultivars, group I), the protein concentrations in the grains were significantly increased with the nitrogen fertilizer concentration. This implied that the protein concentration in the grains of the low-protein cultivars was more sensitive to NFA than that of the high protein cultivars. Based on this result, we suggest that in wheat production, NFA can be used to improve the protein quality of wheat cultivars with a low protein concentration in the grain. For the high-protein wheat cultivar, NFA had no significant effect on the grain protein concentration. The diversity in the wheat variety groups resulted in different responses to NFA. In the present study, NFA had no significant effect on the albumin and globulin concentrations in the wheat grains, which was because they were structural proteins that were less affected by environmental factors [15]. Gliadin and glutenin, also known as gluten proteins, were closely related to the wheat processing quality and were controlled by genetic and environmental factors [32]. A previous study showed that the application of N fertilizer increased the content of alcohol-soluble protein and gluten [33], and the same results were obtained in this study. The results suggest that NFA increased the total protein content in the wheat grain by increasing the prolamin and glutelin concentrations. However, notable genotypic differences were observed in the grain prolamin and glutelin concentrations in the wheat grains to NFA among the different cultivars studied. Both the genotype and NFA contribute to this difference (Figure 3 and Figure 4). This study focused on the effect of NFA on protein components. The prolamin and glutelin concentrations in seven cultivars did not significantly differ among the N1, N2, and CK treatments (group I and group II). In addition, the present study showed that the grains of cultivars with lower prolamin and glutelin concentrations were more sensitive to NFA than those of cultivars with high concentrations (group II). This was similar to the trend observed for the protein concentration. Therefore, we concluded that NFA increased the protein content by increasing the content of alcohol-soluble proteins and gluten, and the effect was more significant for low-protein wheat varieties. This finding indicates that different wheat varieties had different responses to N fertilizer, and there were significant differences in the degree of N metabolism. Studies have shown that nitrate reductase (NR), glutamine synthetase (GS), and glutamate–pyruvate aminotransferase (GPT) are key enzymes in the N metabolism process [34]. Increasing their enzyme activities can promote N metabolism in plants and promote the synthesis and transformation of proteins [35]. After NFA treatment, it may promote the activity of key enzymes of nitrogen synthesis in low-protein varieties to promote more synthesis of alcohol-soluble proteins and gluten, and finally, increase the total protein content.
The protein content and composition and trace element (Fe, Zn, etc.) are all nutrient elements that notably affect the wheat grain quality and yield. In addition, protein and trace element synthesis are closely related, and protein can create a reservoir for Zn [36]. N increases the concentration of trace elements in grains [16] and decreases the molar ratio of phytic acid to trace elements, thereby increasing their bioavailability [37]. Similar results were obtained in the present study; however, the effect of N on each of the varieties studied differed (Table S1 and Table 5). Significant genotypic differences were observed in the Fe, Zn, and phytic acid contents of the wheat grains (Table S1). The Fe and Zn contents were significantly increased by the application of N fertilizer; however, the phytic acid content was not significantly affected. Therefore, NFA improved the bioavailability of trace elements by increasing their content. This phenomenon may be caused by the interaction between the regulation of N and the accumulation of mineral elements in different varieties, and the different mobilities of the mineral elements. Nicotinamide is a non-protein amino acid that is involved in the transport of mineral elements in the phloem and their distribution to grains [23]. The effect of NFA on the content of trace elements, such as Zn, might be due to the increased content of this N-containing amine compound [38]. N fertilizers enhance the bioavailability of trace elements, which might also be related to the activity and abundance of N-promoted transport proteins and N-containing compounds [12].
The formation and stability times, and sedimentation value of dough, directly affect the dough strength and are the most direct and accurate indicators of the wheat grain processing quality [39]. Therefore, it is important to improve the processing quality of wheat by improving the sedimentation value, stability time, and formation time of the wheat flour dough. N application increases the formation and stability times of wheat dough and improved its characteristics [40]. Similar results were obtained in the present study. Correlation analysis showed that the concentrations of protein and gluten in the grains were positively correlated with the dough formation and stability times (Figure 2). These results indicate that NFA can improve the wheat dough quality by increasing the concentration of protein and gluten in the grain.
Previous studies have shown that the amylose concentration notably affects the grain quality of wheat [41] and that the response of starch to N is complex [42,43]. The present study showed that NFA significantly decreased the amylose concentration in wheat grains but had no significant effect on the amylopectin concentration. This indicated that NFA primarily regulates the amylose concentration to affect the starch concentration in wheat grains. In 3 of the 18 studied cultivars, the amylose content in the grain had no significant response to NFA. This implies that the amylose in grains may be more sensitive to NFA and exhibit genotypically different responses upon NFA treatment. The reason for this might be that NFA can be directly absorbed by wheat plants and transported to the grains, directly affecting the N and C absorption of the plant [44,45]. In the present study, NFA significantly decreased the amylose concentration in the wheat grains, and the correlation analysis showed that the amylase concentration in the grains was significantly and negatively correlated with the wet gluten concentration, and the development and stability time of the dough. This indicates that the effect of NFA on the grain quality of the wheat was significantly related to amylose.
5. Conclusions
We concluded that NFA positively affected the wheat grain quality and significantly affected the grain yield. Significant genotypic differences were observed in the yield and quality among the studied varieties. Overall, the response of the yield to NFA was positive but differed among varieties and some varieties showed an increase in both the yield and quality even with a high N concentration. NFA had multiple effects in grains (e.g., on amylose, prolamin, and glutelin concentrations), thereby improving the dough properties and increasing the bioavailability of trace elements, rather than a single effect that impacts the grain quality. The higher the NFA concentration, the more significant the improvement in the wheat quality. However, high NFA levels notably decreased the wheat grain weight, and the effect of NFA on the grain quality showed significant genotypic differences. It was concluded that N1 (10.70 kg N ha−1 two day−1, 750 L ha−1) was the most suitable concentration for application in wheat production in Shaanxi Province. Judicious and efficient use of NFA for wheat production requires further study to better define the optimal N application protocols and expand these findings to other varieties and other regions.
Supplementary Materials
The following supporting information can be downloaded at: https://www.mdpi.com/article/10.3390/agronomy13123077/s1, Table S1: ANOVA of grain yield and quality of 18 wheat varieties under nitrogen application. Table S2: effects of NFA on Fe, Zn, and phytate content of 18 varieties.
Author Contributions
Funding acquisition, X.G. and X.Y.; data curation, X.G. and Y.L. (Yuze Li); methodology, Y.L. (Yuze Li) and Y.L. (Yang Liu); software, J.Z. and L.J.; validation, H.Z., S.H., X.Y., J.Z. and Y.C.; formal analysis, X.G. and H.Z.; investigation, J.Z. and X.G.; writing—original draft preparation, X.G.; writing—review and editing, Y.L. (Yuze Li) and Y.L. (Yang Liu). All authors have read and agreed to the published version of the manuscript.
Funding
This research was funded by the Hunan Innovative Province Construction Project (2022NK2001), Hunan Agricultural Science and Technology Innovation Project (2023CX93), and Hunan Province Modern Agricultural Industrial Technology System Cultivation and Plant protection Post (Xiangnongfa 2019 No. 26).
Data Availability Statement
Data will be made available on request.
Conflicts of Interest
The authors declare no conflict of interest.
References
- Lin, Z.; Chang, X.; Wang, D.; Zhao, G.; Zhao, B. Long-term fertilization effects on processing quality of wheat grain in the North China Plain. Field Crops Res. 2015, 174, 55–60. [Google Scholar] [CrossRef]
- Giordano, N.; Sadras, V.O.; Lollato, R.P. Late-season nitrogen application increases grain protein concentration and is neutral for yield in wheat. A global meta-analysis. Field Crops Res. 2023, 290, 108740. [Google Scholar] [CrossRef]
- Dick, C.D.; Thompson, N.M.; Epplin, F.M.; Arnall, D.B. Managing late-season foliar nitrogen fertilization to increase grain protein for winter wheat. Agron. J. 2016, 108, 2329–2338. [Google Scholar] [CrossRef]
- Mohammed, Y.A.; Kelly, J.; Chim, B.K.; Rutto, E.; Waldschmidt, K.; Mullock, J.; Torres, G.; Desta, K.G.; Raun, W. Nitrogen fertilizer management for improved grain quality and yield in winter wheat in Oklahoma. J. Plant Nutr. 2013, 36, 749–761. [Google Scholar] [CrossRef]
- Klikocka, H.; Cybulska, M.; Bożena, B.; Narolski, B.; Szostak, B.; Kobiałka, A.; Nowak, A.; Wójcik, E. The effect of sulphur and nitrogen fertilization on grain yield and technological quality of spring wheat. Plant Soil Environ. 2016, 62, 230–236. [Google Scholar] [CrossRef]
- Fernández, V.; Brown, P.H. From plant surface to plant metabolism: The uncertain fate of foliar-applied nutrients. Front. Plant Sci. 2013, 4, 221–232. [Google Scholar] [CrossRef] [PubMed]
- Lv, X.; Ding, Y.; Long, M.; Liang, W.; Gu, X.; Liu, Y.; Wen, X. Effect of foliar application of various nitrogen forms on starch accumulation and grain filling of wheat (Triticum aestivum L.) under drought stress. Front. Plant Sci. 2021, 12, 645379. [Google Scholar] [CrossRef]
- Abad, A.; Lloveras, J.; Michelena, A. Nitrogen fertilization and foliar urea effects on durum wheat yield and quality and on residual soil nitrate in irrigated Mediterranean conditions. Field Crops Res. 2004, 87, 257–269. [Google Scholar] [CrossRef]
- Xue, C.; Schulte auf’m Erley, G.; Warnig, A.; Schuster, R.; Koehler, P.; Mühling, K. Split nitrogen application improves wheat baking quality by influencing protein composition rather than concentration. Front. Plant Sci. 2016, 7, 112–133. [Google Scholar] [CrossRef]
- Altenbach, S.; Tanaka, C.; Whitehand, L.; Vensel, W. Effects of post-anthesis fertilizer on the protein composition of the gluten polymer in a US bread wheat. J. Cereal Sci. 2015, 68, 333–366. [Google Scholar] [CrossRef]
- Zhang, P.; Ma, G.; Wang, C.; Zhu, Y.; Guo, T. Mineral elements bioavailability in milling fractions of wheat grain response to Zinc and nitrogen application. Agron. J. 2019, 111, 2504–2511. [Google Scholar] [CrossRef]
- Wang, S.; Li, M.; Tian, X.; Li, J.; Li, H.; Ni, Y.; Zhao, J.; Chen, Y.; Guo, C.; Zhao, A. Foliar zinc, nitrogen, and phosphorus application effects on micronutrient concentrations in winter wheat. Agron. J. 2015, 107, 61–72. [Google Scholar] [CrossRef]
- Zhang, Z.; Yu, Z.; Zhang, Y.; Shi, Y. Optimized nitrogen fertilizer application strategies under supplementary irrigation improved winter wheat (Triticum aestivum L.) yield and grain protein yield. PeerJ 2021, 9, e11467. [Google Scholar] [CrossRef] [PubMed]
- Rossmann, A.; Buchner, P.; Savill, G.P.; Hawkesford, M.J.; Scherf, K.A.; Mühling, K.H. Foliar N application at anthesis alters grain protein composition and enhances baking quality in winter wheat only under a low N fertiliser regimen. Eur. J. Agron. 2019, 109, 125909. [Google Scholar] [CrossRef]
- Li, X.; Zhou, L.; Liu, F.; Zhou, Q.; Cai, J.; Wang, X.; Dai, T.; Cao, W.; Jiang, D. Variations in protein concentration and nitrogen sources in different positions of grain in wheat. Front. Plant Sci. 2016, 7, 56–75. [Google Scholar] [CrossRef]
- Ben Mariem, S.; González-Torralba, J.; Collar, C.; Aranjuelo, I.; Morales, F. Durum Wheat Grain Yield and Quality under Low and High Nitrogen Conditions: Insights into Natural Variation in Low- and High-Yielding Genotypes. Plants 2020, 9, 1636. [Google Scholar] [CrossRef]
- Wieser, H.; Koehler, P.; Scherf, K. The two faces of wheat. Front. Nutr. 2020, 7, 517313. [Google Scholar] [CrossRef]
- Guo, J.; Bian, Y.-Y.; Zhu, K.-X.; Guo, X.-N.; Peng, W.; Zhou, H.-M. Reducing phytate content in wheat bran by directly removing the aleurone cell content with teeth roller mill and ultrasonic cleaner. J. Cereal Sci. 2015, 64, 133–138. [Google Scholar] [CrossRef]
- Gargari, B.P.; Mahboob, S.; Razavieh, S.V. Content of phytic acid and its mole ratio to zinc in flour and breads consumed in Tabriz, Iran. Food Chem. 2007, 100, 1115–1119. [Google Scholar] [CrossRef]
- Balk, J.; Connorton, J.M.; Wan, Y.; Lovegrove, A.; Moore, K.L.; Uauy, C.; Sharp, P.A.; Shewry, P.R. Improving wheat as a source of iron and zinc for global nutrition. Nutr. Bull. 2019, 44, 53–59. [Google Scholar] [CrossRef]
- Warnig, A.; Pitann, B.; Mühling, K. Splitting nitrogen applications improves wheat storage protein composition under low N supply. J. Plant Nutr. Soil Sci. 2019, 182, 347–355. [Google Scholar]
- Wang, S.; Li, M.; Liu, K.; Tian, X.; Li, S.; Chen, Y.; Jia, Z. Effects of Zn, macronutrients, and their interactions through foliar applications on winter wheat grain nutritional quality. PLoS ONE 2017, 12, e0181276. [Google Scholar] [CrossRef] [PubMed]
- Lee, S.; Persson, D.P.; Hansen, T.H.; Husted, S.R.; Schjoerring, J.K.; Kim, Y.S.; Jeon, U.S.; Kim, Y.K.; Kakei, Y.; Masuda, H. Bio-available zinc in rice seeds is increased by activation tagging of nicotianamine synthase. Plant Biotechnol. J. 2011, 9, 865–873. [Google Scholar] [CrossRef] [PubMed]
- Latshaw, S.P.; Vigil, M.F.; Haley, S.D. Genotypic differences for nitrogen use efficiency and grain protein deviation in hard winter wheat. Agron. J. 2016, 108, 2201–2213. [Google Scholar] [CrossRef]
- Feng, X.-M.; Yang, Y.; Ren, C.-Z.; Hu, Y.-G.; Zeng, Z.-H. Effects of legumes intercropping with oat on photosynthesis characteristics of and grain yield. Acta Agron. Sin. 2015, 41, 1426–1434. [Google Scholar] [CrossRef]
- Zhao, H.; Guo, B.; Wei, Y.; Zhang, B. Near infrared reflectance spectroscopy for determination of the geographical origin of wheat. Food Chem. 2013, 138, 1902–1907. [Google Scholar] [CrossRef] [PubMed]
- Liu, Z.H.; Cheng, F.M.; Cheng, W.D.; Zhang, G.P. Positional variations in phytic acid and protein content within a panicle of japonica rice. J. Cereal Sci. 2005, 41, 297–303. [Google Scholar] [CrossRef]
- Schirmer, M.; Jekle, M.; Becker, T.; Arendt, E. Physicochemical and morphological characterization of different starches with variable amylose/amylopectin content. Food Hydrocoll. 2012, 32, 52–63. [Google Scholar] [CrossRef]
- Persson, D.P.; De Bang, T.C.; Pedas, P.R.; Kutman, U.B.; Cakmak, I.; Andersen, B.; Finnie, C.; Schjoerring, J.K.; Husted, S. Molecular speciation and tissue compartmentation of zinc in durum wheat grains with contrasting nutritional status. New Phytol. 2016, 211, 1255–1265. [Google Scholar] [CrossRef]
- Zhang, H.; Chen, T.; Wang, Z.; Yang, J.; Zhang, J. Involvement of cytokinins in the grain filling of rice under alternate wetting and drying irrigation. J. Exp. Bot. 2010, 61, 3719–3733. [Google Scholar] [CrossRef]
- Zheng, Y.-M.; Ding, Y.-F.; Liu, Z.-H.; Wang, S.-H. Effects of panicle nitrogen fertilization on non-structural carbohydrate and grain filling in Indica rice. Agric. Sci. China 2010, 9, 1630–1640. [Google Scholar] [CrossRef]
- Altenbach, S.B.; Chang, H.C.; Simon-Buss, A.; Jang, Y.R.; Denery-Papini, S.; Pineau, F.; Gu, Y.Q.; Huo, N.; Lim, S.H.; Kang, C.S. Towards reducing the immunogenic potential of wheat flour: Omega gliadins encoded by the D genome of hexaploid wheat may also harbor epitopes for the serious food allergy WDEIA. BMC Plant Biol. 2018, 18, 223–239. [Google Scholar] [CrossRef] [PubMed]
- Zörb, C.; Ludewig, U.; Hawkesford, M.J. Perspective on wheat yield and quality with reduced nitrogen supply. Trends Plant Sci. 2018, 23, 1029–1037. [Google Scholar] [CrossRef] [PubMed]
- Hou, W.; Xue, X.; Li, X.; Khan, M.R.; Yan, J.; Ren, T.; Cong, R.; Lu, J. Interactive effects of nitrogen and potassium on: Grain yield, nitrogen uptake and nitrogen use efficiency of rice in low potassium fertility soil in China. Field Crops Res. 2019, 236, 14–23. [Google Scholar] [CrossRef]
- Chen, Y.; Liu, Y.; Ge, J.; Li, R.; Zhang, R.; Zhang, Y.; Huo, Z.; Xu, K.; Wei, H.; Dai, Q. Improved physiological and morphological traits of root synergistically enhanced salinity tolerance in rice under appropriate nitrogen application rate. Front. Plant Sci. 2022, 13, 112–129. [Google Scholar] [CrossRef] [PubMed]
- Peck, A.W.; McDonald, G.K.; Graham, R.D. Zinc nutrition influences the protein composition of flour in bread wheat (Triticum aestivum L.). J. Cereal Sci. 2008, 47, 266–274. [Google Scholar] [CrossRef]
- Shiwakoti, S.; Jeliazkov, V.; Gollany, H.; Kleber, M.; Xing, B. Micronutrients decline under long-term tillage and nitrogen fertilization. Sci. Rep. 2019, 9, 12020. [Google Scholar] [CrossRef]
- Li, M.; Wang, S.X.; Tian, X.H.; Zhao, J.H.; Li, H.Y.; Guo, C.H.; Chen, Y.L.; Zhao, A.Q. Zn distribution and bioavailability in whole grain and grain fractions of winter wheat as affected by applications of soil N and foliar Zn combined with N or P. J. Cereal Sci. 2015, 61, 26–32. [Google Scholar] [CrossRef]
- Unbehend, L.; Unbehend, G.; Lindhauer, M.G. Protein composition of some Croatian and German wheat varieties and their influence on the loaf volume. Food/Nahrung 2003, 47, 145–148. [Google Scholar] [CrossRef]
- Kozlovsky, O.; Balik, J.; Cerny, J.; Kulhanek, M.; Kos, M.; Prasilova, M. Regulation of nitrogen application on grain yield and qualityof strong-gluten wheat in Huaibei region. J. Triticeae Crops 2022, 42, 99–112. [Google Scholar]
- Gozé, P.; Rhazi, L.; Pauss, A.; Aussenac, T. Starch characterization after ozone treatment of wheat grains. J. Cereal Sci. 2016, 70, 39–51. [Google Scholar] [CrossRef]
- Zhu, D.; Zhang, H.; Guo, B.; Xu, K.; Dai, Q.; Wei, C.; Zhou, G.; Huo, Z. Effects of nitrogen level on structure and physicochemical properties of rice starch. Food Hydrocoll. 2017, 63, 525–532. [Google Scholar] [CrossRef]
- Gu, D.-D.; Liu, Z.-H.; Liu, Y.; Wang, S.-H.; Wang, Q.-S.; Li, G.-H.; Ding, Y.-F. Effect of lipid content and components on cooking quality and their responses to nitrogen in milled japonica rice. Acta Agron. Sin. 2011, 37, 2001–2010. [Google Scholar] [CrossRef]
- Zi, Y.; Ding, J.; Song, J.; Humphreys, G.; Peng, Y.; Li, C.; Zhu, X.; Guo, W. Grain yield, starch content and activities of key enzymes of waxy and non-waxy wheat (Triticum aestivum L.). Sci. Rep. 2018, 8, 4548–4567. [Google Scholar] [CrossRef]
- Cheng, W.; Sakai, H.; Yagi, K.; Hasegawa, T. Combined effects of elevated [CO2] and high night temperature on carbon assimilation, nitrogen absorption, and the allocations of C and N by rice (Oryza sativa L.). Agric. For. Meteorol. 2010, 150, 1174–1181. [Google Scholar] [CrossRef]
Disclaimer/Publisher’s Note: The statements, opinions and data contained in all publications are solely those of the individual author(s) and contributor(s) and not of MDPI and/or the editor(s). MDPI and/or the editor(s) disclaim responsibility for any injury to people or property resulting from any ideas, methods, instructions or products referred to in the content. |
© 2023 by the authors. Licensee MDPI, Basel, Switzerland. This article is an open access article distributed under the terms and conditions of the Creative Commons Attribution (CC BY) license (https://creativecommons.org/licenses/by/4.0/).