Article

Spatiotemporal Evolution of Precipitation Heterogeneity Characteristics in the Heilongjiang Province from 1961 to 2020

1
School of Hydraulic and Electric Power, Heilongjiang University, Harbin 150080, China
2
School of Water Conservancy and Civil Engineering, Northeast Agricultural University, Harbin 150030, China
*
Author to whom correspondence should be addressed.
Fanxiang Meng and Zhimin Sun contributed equally to the work and should be regarded as co-first authors.
Agronomy 2023, 13(12), 3057; https://doi.org/10.3390/agronomy13123057
Submission received: 28 October 2023 / Revised: 8 December 2023 / Accepted: 12 December 2023 / Published: 14 December 2023

Abstract

:
Precipitation unevenness significantly influences the rational allocation of water resources and the management of agricultural irrigation. Based on precipitation data from 29 meteorological stations in Heilongjiang Province, China, from 1961 to 2020, this study calculated the precipitation concentration index (PCI), precipitation concentration degree (PCD), and precipitation concentration period (PCP) to analyze the spatial distribution characteristics of precipitation heterogeneity at three distinct timescales: year, maize growth period, and the four stages of the maize growth period. The findings reveal that the rainy season in Heilongjiang Province commences earlier in the southwest compared with the northeast and northwest, with a primary concentration in July. At the annual scale, PCI in southwestern Heilongjiang Province surpasses that in the southeastern region, displaying an approximate east–west gradient in PCD and PCP values ranging from 0.544 to 0.746 and 196 to 203, respectively. During the growth period scale, precipitation concentrates in the southwest and central regions, occurring earlier than in the northeast and northwest. In contrast to the annual scale, the PCI value is smaller, and precipitation predominantly concentrates in mid and late July. Examining the four stages of the maize growth period, PCD generally exhibits a decreasing gradient from west to east. The highest values of PCI and PCD manifest in the southwestern part of Heilongjiang Province, with precipitation concentrated in the middle of each growth stage. The research results serve as a valuable reference for policymakers and stakeholders involved in water resource allocation and agricultural water management in Heilongjiang Province.

1. Introduction

Precipitation, as a critical climate element, serves not only as a vital water resource for natural ecosystems and human societies but also exerts profound impacts on the water requirements for crop growth [1,2,3,4]. In recent decades, heightened by global climate warming and escalating human activities, precipitation has exhibited increased temporal and spatial variability, leading to heightened uncertainties and a surge in occurrences of droughts and floods [5,6]. Consequently, the uneven distribution of precipitation has garnered widespread attention from scholars [7,8,9,10,11].
The present study primarily employs indicators such as PCI, PCD, and PCP to analyze the uneven distribution of precipitation [12,13,14]. These three widely used indicators reflect the concentration characteristics of precipitation. PCD and PCP, representing the concentration level and period of concentration, are mainly used to assess the distribution of total precipitation and determine the periods during which maximum precipitation occurs [15,16,17]. PCI was used to assess the contribution of the maximum precipitation days to the total precipitation amount [18,19] (see Section 2 for details). Simultaneously, considering these three indicators provides a comprehensive understanding of the uneven characteristics of precipitation from different perspectives [20].
Scholars have conducted research on precipitation unevenness using indicators such as PCI, PCD, and PCP across various scales. For example, for long-term analysis, based on daily precipitation data from meteorological stations, Bai and Liu et al. [21], Darand M and Pazhoh F et al. [22], Li et al. [23], Liu et al. [24], and Wang et al. [25] investigated the multi-year precipitation inhomogeneity in the Chinese region, Iran, Xinjiang, China, and Yangtze River Basin, respectively, by using the metrics of PCI, PCD, and PCP. On a short time scale, Jiang et al. [26] analyzed the distribution characteristics of daily and monthly precipitation in China using CI and PCI. Liu et al. [17] analyzed the spatial and temporal distribution characteristics of daily, monthly, and seasonal precipitation in the Longchuan River Basin from 1977 to 2017 and investigated the trends of precipitation and rainy days as well as the PCI for each intensity. The aforementioned studies primarily analyze the spatiotemporal distribution characteristics of precipitation unevenness at annual, seasonal, monthly, and daily scales, with less integration into the water demand processes of crop growth. Due to the strong dependence of crops on water, the concentration of precipitation directly impacts the water supply during critical growth periods [27]. By focusing research on the short temporal scale of crop growth stages, including the overall crop growth period, we can more accurately understand the impact of precipitation unevenness on agriculture and provide more targeted agricultural management recommendations. Research at the scale of crop growth stages contributes to a better understanding of precipitation variations during critical growth periods [28], while studies at the annual scale may obscure details of these key periods. Therefore, addressing the aforementioned issues, this study, building upon the analysis at the annual scale, emphasizes the spatiotemporal distribution characteristics of precipitation unevenness, specifically during the corn growth stages. This approach aims to provide a theoretical basis for efficient rainwater resource utilization and alleviating agricultural water shortages.
Through this study, daily precipitation data of Heilongjiang Province as the research area are acquired from Heilongjiang Province spanning the period 1961–2020; this study refined the temporal scale of investigating precipitation unevenness by incorporating annual scale analysis and specific crop growth periods as a practical foundation. The aims of this study are as follows: (1) examine the spatial distribution of PCI, PCD, and PCP at three temporal scales, including annual, maize growth period, and various stages of maize growth period; (2) identify and quantified trends in precipitation unevenness for the study area in Heilongjiang Province. The outcomes of this research study can offer a more precise and detailed reference for water management measures in agricultural irrigation and the rational allocation of water resources in Heilongjiang Province.

2. Materials and Methods
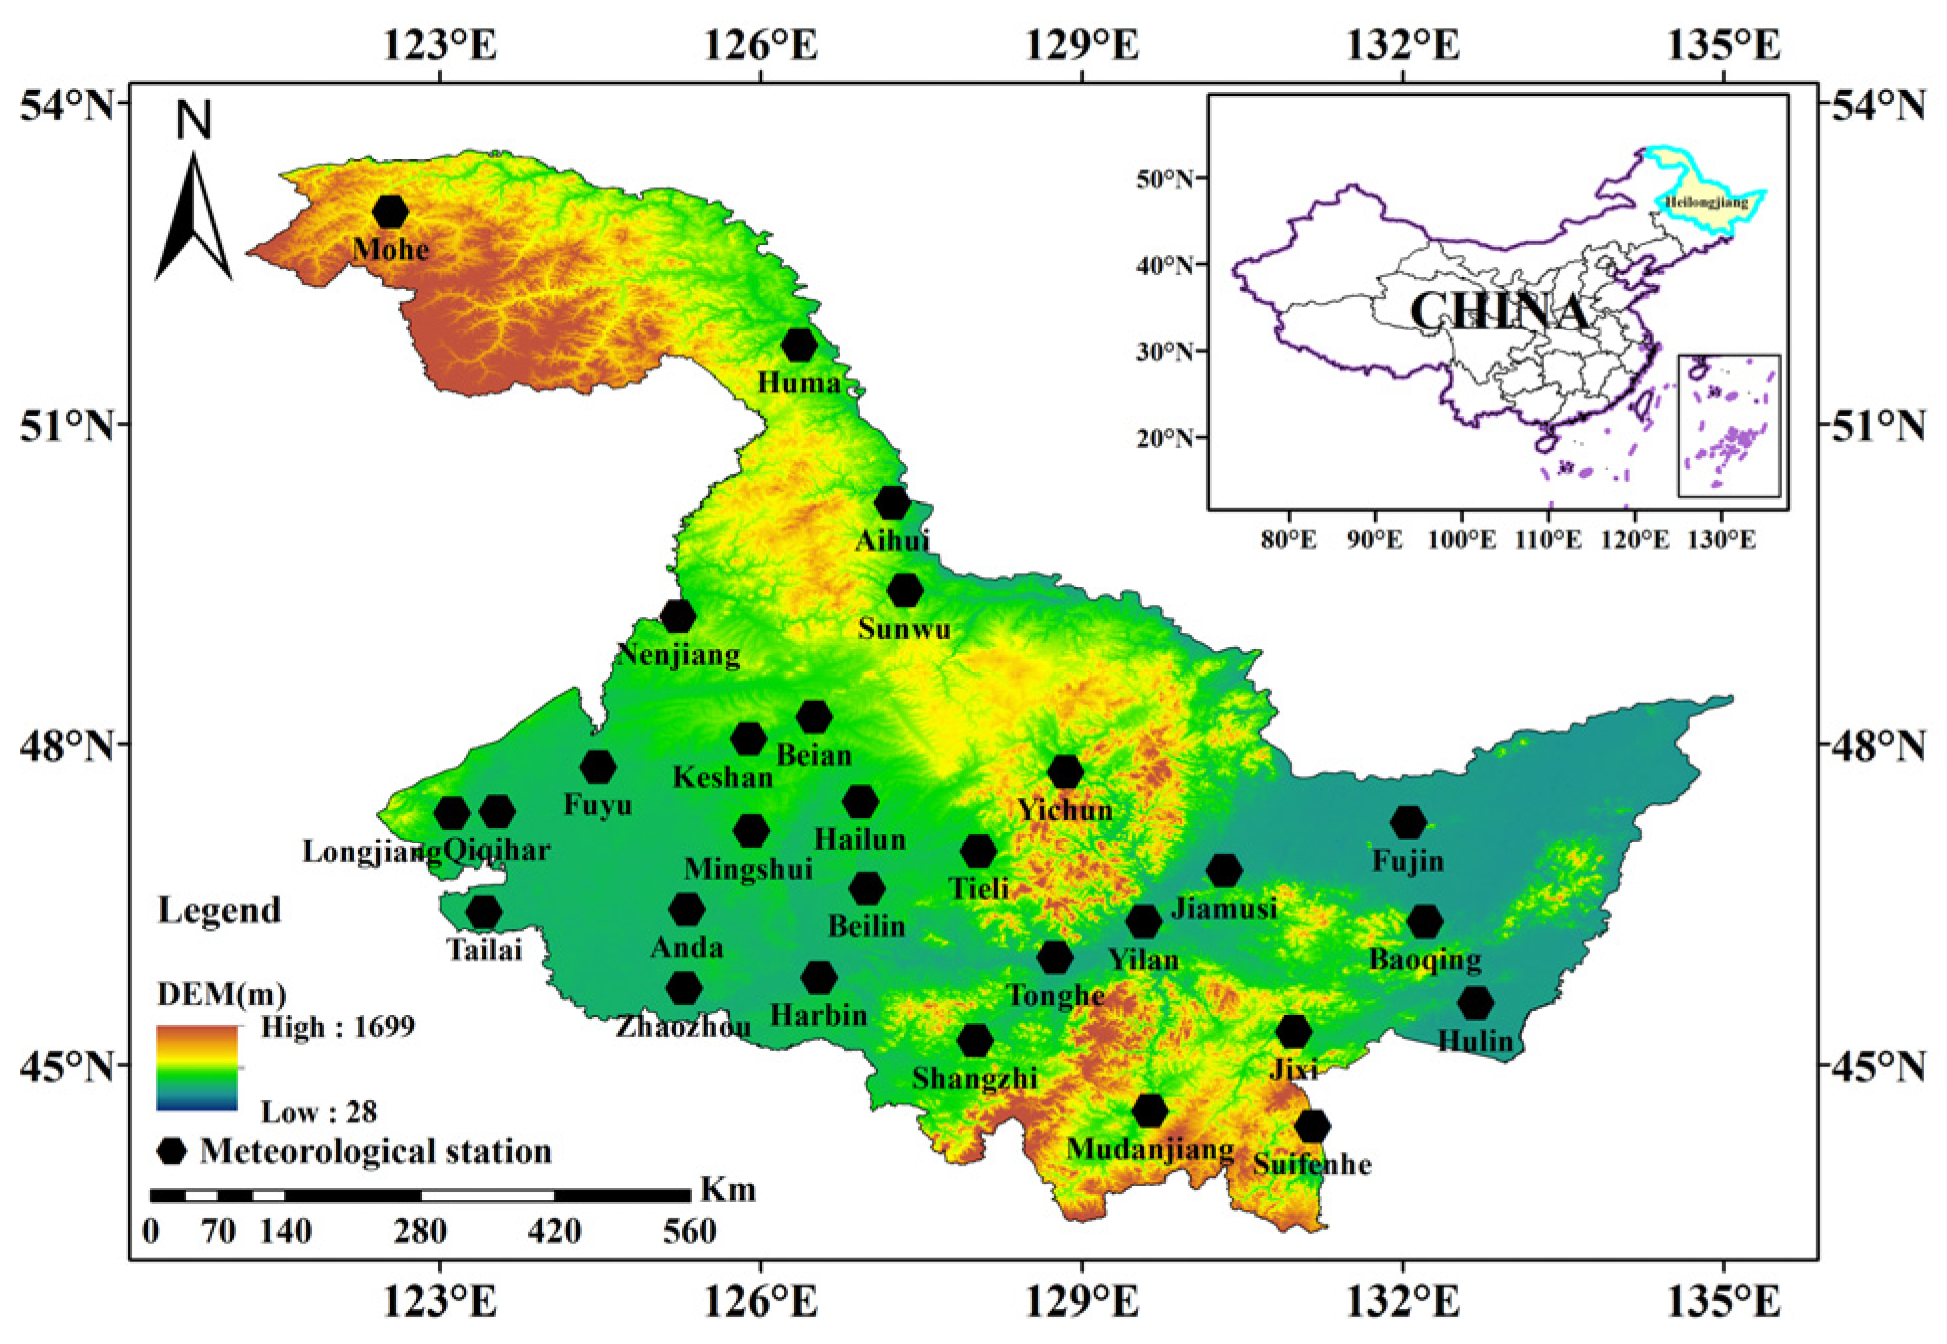
2.1. Study Region

Heilongjiang Province is located in the northeastern region of China, spanning 43°26′ to 53°33′ N latitude and 121°11′ to 135°05′ E longitude (Figure 1). The province extends approximately 1120 km from north to south and 930 km from east to west, covering an area of about 4.73 × 10⁵ km2. It features a temperate continental climate characterized by harsh, dry winters and mild, humid summers. The region experiences abundant precipitation, with an annual average rainfall ranging from 500 to 600 mm. There is a notable annual temperature variation, with an average annual temperature of 2.48 °C. Summer temperatures can soar to 35 °C, while winter temperatures can plummet to −36 °C. Heilongjiang Province boasts the largest arable land area in China and is a primary grain production center [29,30], playing a pivotal role in the country’s socioeconomic landscape. Current research indicates that rainfed agriculture predominantly dominates dryland farming in Heilongjiang Province. Crop growth heavily relies on precipitation. A mismatch between the precipitation pattern (PCP) and the cropping period of dryland crops can adversely affect crop growth, posing challenges to water resource management. The uneven spatial distribution of precipitation contributes to occasional flooding and drought disasters. Statistics reveal that since the early to mid-1990s, Heilongjiang Province has faced severe and prolonged drought conditions. In 1998, the region experienced an unprecedented and historically rare flood disaster, suggesting an overall worsening trend of drought and flood disasters [31,32]. Given the scarcity of water resources in Heilongjiang Province and the crucial role of precipitation in agricultural water supply, research into the spatial distribution irregularities of precipitation in the province holds significant practical significance. Such studies can further our understanding of both flood and drought events [33] and help assess the tangible impact of precipitation disparities on the growth of rainfed crops [34,35,36].
Research data used in this study comprise daily precipitation records from 29 meteorological observation stations in Heilongjiang Province spanning from 1961 to 2020. With a time series covering 60 years, this extensive dataset ensures the reliability and robustness of our research findings. Data for this study were sourced from the China Meteorological Administration (http://data.cma.cn/, accessed on 18 January 2021). The specific distribution of meteorological stations is shown in Figure 1.

2.2. Methods

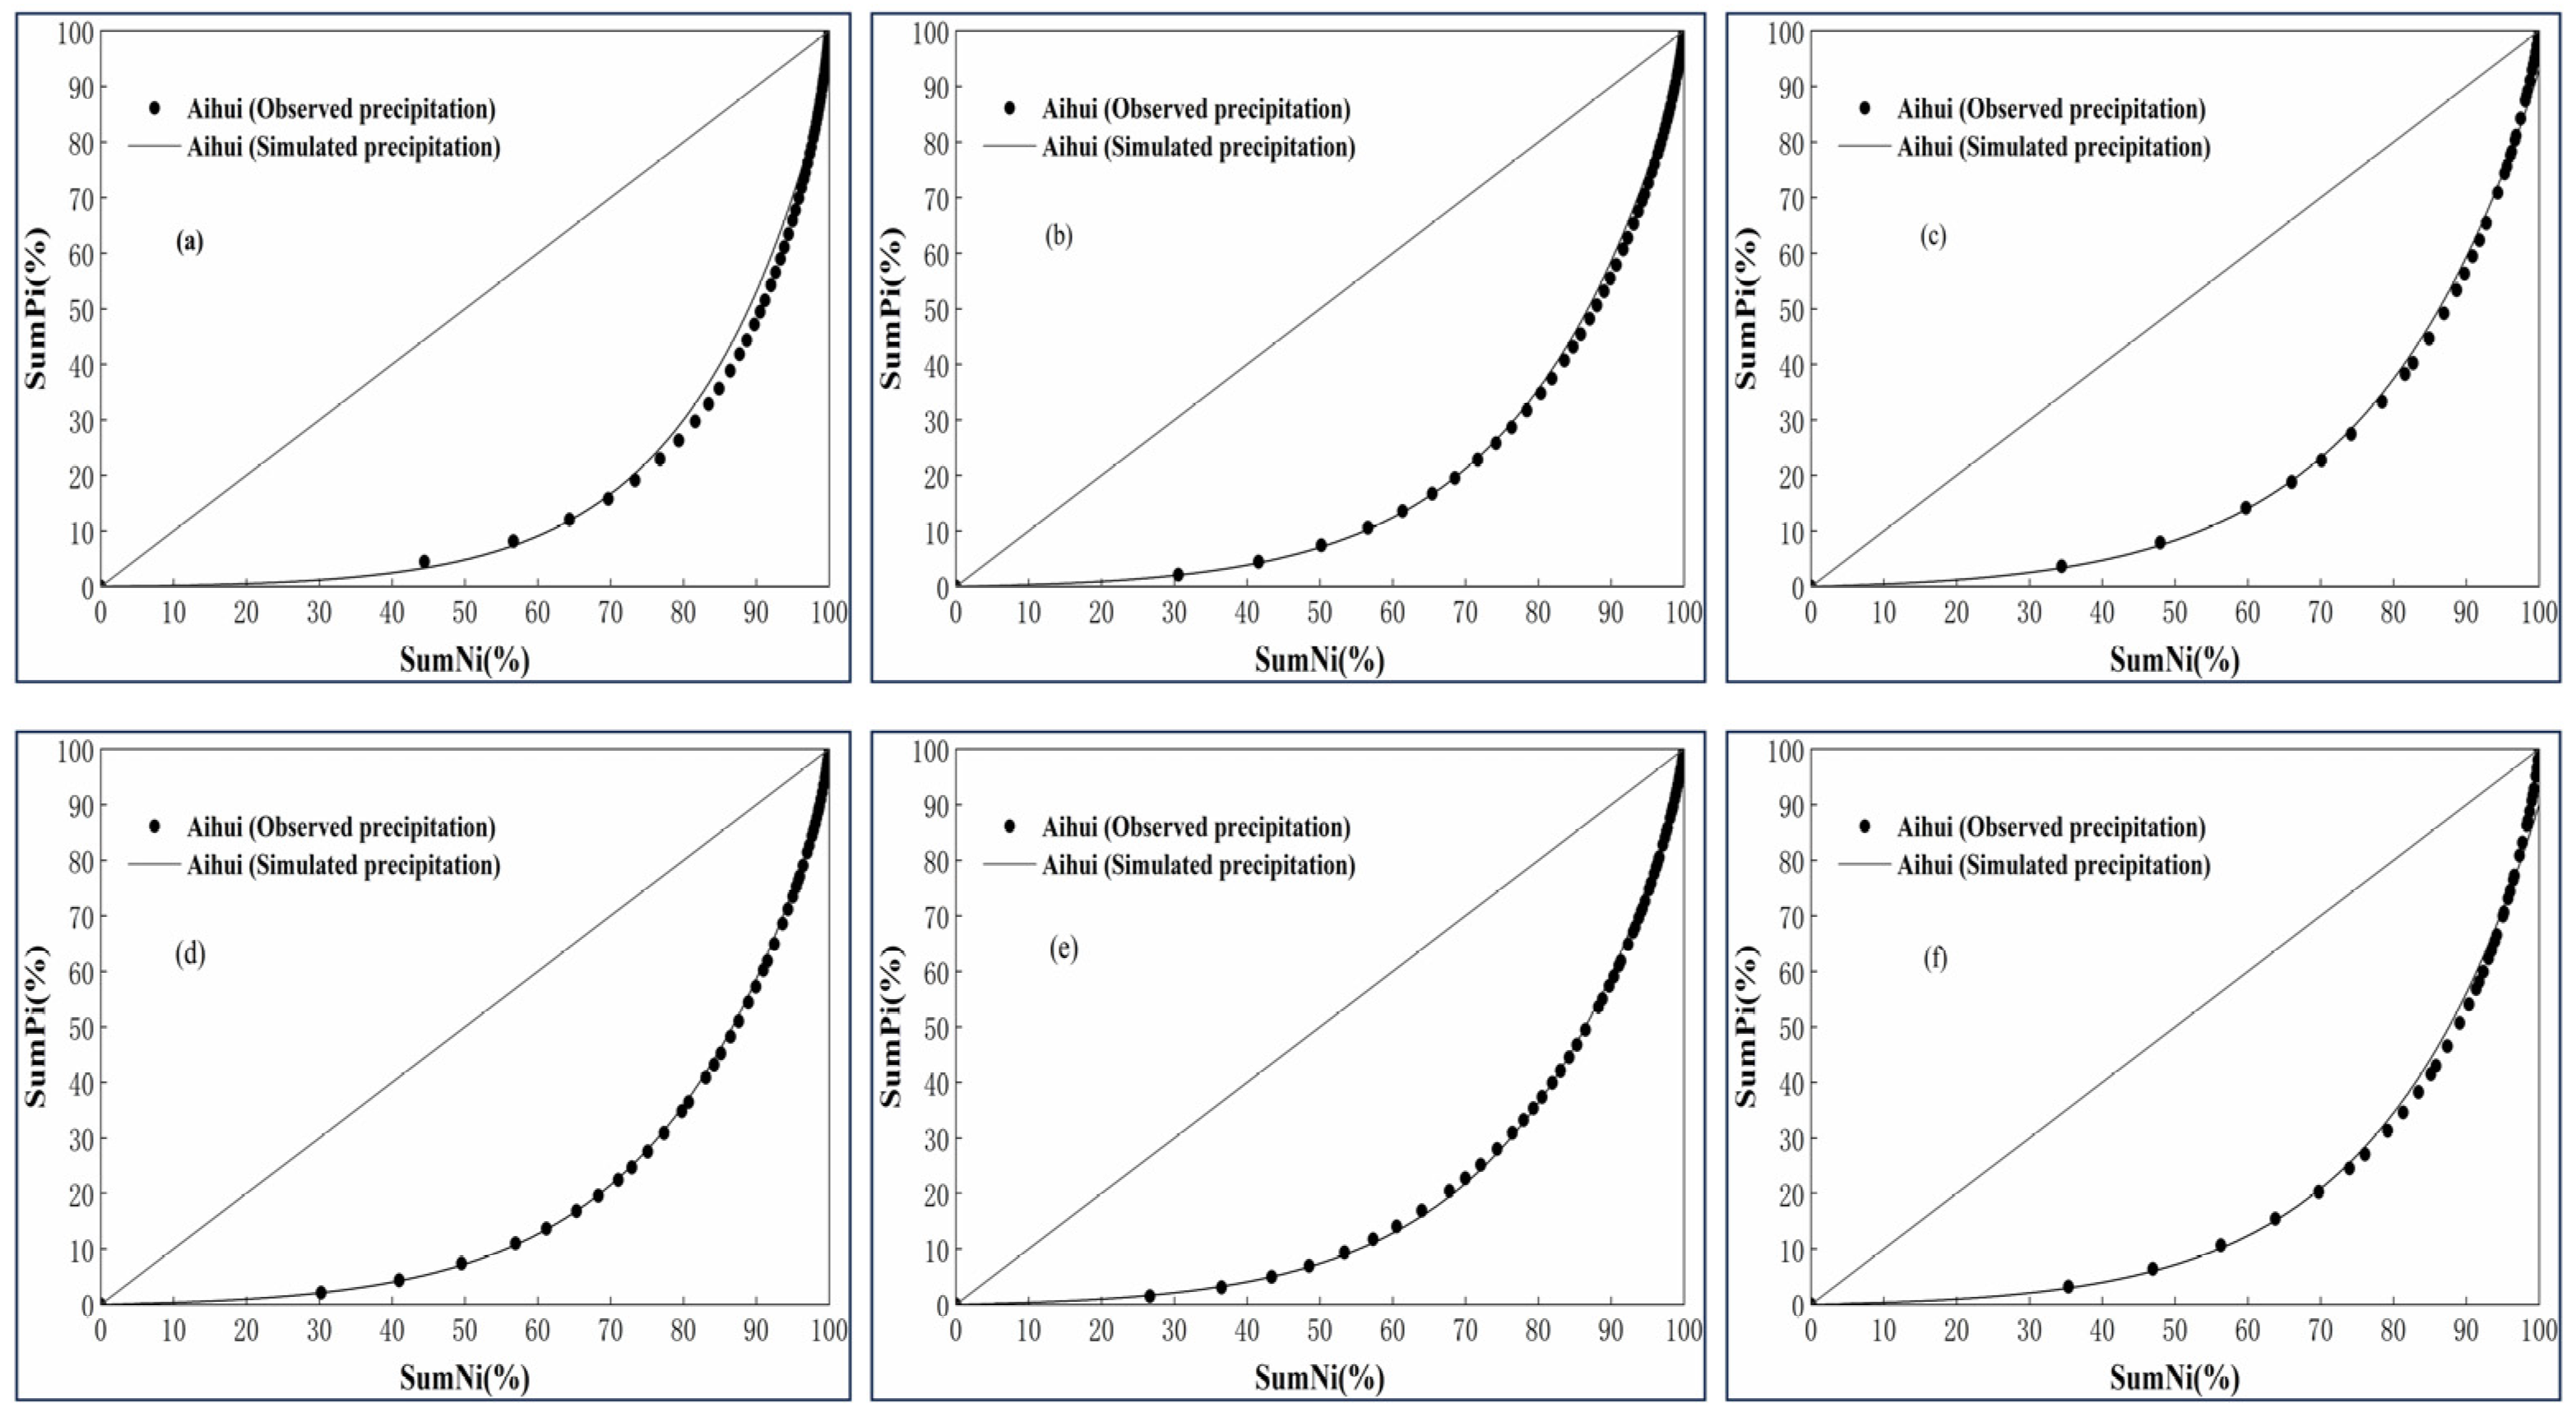
2.2.1. Method for Calculating PCI

PCI was introduced as a metric to assess the influence of days with the greatest rainfall on the total precipitation. It is formulated based on the influence of precipitation on the total number of rainy days and is typically modeled using an exponential distribution [37,38]. Broadly speaking, within a specific period and location, there is a greater likelihood of small average daily precipitation, while the likelihood of large average daily precipitation is lower. However, these occurrences of heavy rain in small amounts are more likely to impact hydrological input [37]. To evaluate the relative impact of different daily precipitation values, particularly the contribution of the maximum precipitation value on the total precipitation value, an analysis of the contribution of the percentage of accumulated days (X) to the percentage of accumulated precipitation (Y) was conducted [23,37,39,40,41]. The computational procedure for this method can be described as follows: (1) This study uses 1 mm precipitation as the grade interval for classifying precipitation grade boundaries; (2) the precipitation grade boundaries are arranged in ascending order; (3) the number of days falling into each precipitation class is tallied, and the corresponding precipitation amount is computed; (4) the cumulative summation of the output from step 3 is calculated; (5) based on the results of step 4, the cumulative percentage of rainy days and the associated precipitation amount are derived. After the above steps, a relationship between the index curves X and Y is obtained, which can be expressed according to the recommended exponential model by Martin-Vide as follows:
Y = a X e x p ( b X )
Equation (1), with constants a and b determined through the least squares method, can produce a polyline known as a concentration curve or Lorenz curve, widely employed across various disciplines [42]. The area S, enclosed by the bisectors and polylines within the quadrant, serves as a metric for concentration. The precipitation concentration assembles the Gini coefficient, representing the area between the ideal distribution (45°) line and the Lorenz curve. As the parameters of Equation (1) can be established by the least squares method, the definite integral of the Lorenz curve’s area (A) within the range from 0 to 100 can be formulated as follows:
  A = 5000 0 100 a x   e x p ( b x ) d x
Then, the area S can be expressed as:
S = 5000 A
Then, the PCI, similar to the Gini coefficient, can be expressed as:
P C I = S / 5000
Therefore, the PCI value corresponds to the ratio of S to the surface area of the lower triangle defined by the equidistribution line. A higher PCI value indicates a greater concentration of precipitation on a few rainy days within that timescale and vice versa. For a comprehensive understanding of this method, refer to Martin-Vide (2004) [37]. This method will be used to reveal the structure of accumulated precipitation contributed by the cumulative precipitation days.

2.2.2. PCD and PCP Calculations

According to [43], PCD and PCP were proposed to evaluate the distribution of total precipitation and determine the period when maximum precipitation occurs. It is believed that the precipitation of each segment under the total precipitation is a vector, including changes in magnitude and direction, represented by the arctangent function as a 360° circle [44]. From this, the definitions of PCP and PCD are as follows:
P C D i j = R x i 2 + R y i 2 R i
P C P i j = arctan ( R x i R y i )
In the formula, where i represents the timescale, which may denote a year, a growth period, or various stages within the growth period, and j represents the segmentation within the corresponding timescale. Ri is the total precipitation in the i-th period; Rij is the precipitation in the j-th segment in the i-th period; θj is the azimuth angle of the j-th segment (the azimuth angle of the entire study period is set to 360°); Rxi and Ryi are the composite vectors of the total precipitation Ri in the x and y directions.
It is evident from Equations (5) and (6) that PCD can depict the precipitation concentration level within a specific timescale, with a value ranging from 0 to 1. As an extreme example, if precipitation occurs only in one month of the year, the ratio of the composite component to the annual precipitation is 1, indicating the maximum value of PCD reaching 1. Conversely, if total precipitation is evenly distributed across each month of the year, PCD will attain the minimum value of 0. PCP indicates the period when precipitation is most concentrated within a specific timescale. Precipitation PCD and PCP carry distinct physical meanings. PCD underscores the distribution of precipitation in each segment of the total annual precipitation by reflecting the distribution level of total annual precipitation within each time segment. PCP primarily centers on all segments, emphasizing the period during which precipitation occurs with the largest amount. Due to the differing focuses of these two indicators, we conducted a comprehensive evaluation of the spatial distribution characteristics of PCD and PCP based on the daily precipitation dataset of Heilongjiang Province.
This study analyzes the spatial distribution characteristics of PCD and PCP in Heilongjiang Province from 1961 to 2020 at three timescales: year, maize growth period (May–September), and each stage of the maize growth period. Following Zhao’s research, maize growth in Heilongjiang Province will be assessed. The planting period is segmented into four stages: seeding–emergence period (1–31 May), emergence–jointing period (1 June–10 July), tasseling–milky ripening period (11 July–31 August), and mature period (1–30 September) [44]. When the year serves as the timescale, Ri represents the year, and PCD and PCP are calculated based on monthly segments. The corresponding azimuth angles are outlined in Table 1. When the growth period is the timescale, Ri represents the maize growth period, and ten days serve as a segment. PCD and PCP are computed within these segments, and the corresponding azimuth angles are provided in Table 2. When each growth period stage is the timescale, Ri represents each growth period stage, one day serves as a segment for PCD and PCP calculations, and the growth period is considered the scale. The corresponding azimuth angles are presented in Table 3 (using the mature stage’s azimuth angles as an example, with the other three stages being similar). The respective azimuth angles under the three timescales are detailed in Table 1, Table 2 and Table 3.

2.2.3. MK Trend Test

Mann–Kendall (MK) trend test [45,46] can detect trends in time series. Since it is a nonparametric method, variables need not obey normal or linear distribution [47]. It is also used by many scholars to evaluate hydrometeorological time series monotonic trends [48]; therefore, this study used this method to analyze the changing trend of PCI.
In the MK trend test, the null hypothesis H0 is that data in the time series (Xi, i = 1, 2, …, n) are independent and identically distributed random variables, and hypothesis H1 is that there is a trend in the sequence [49], then the statistical parameter S0 is defined as following [45,46]:
S 0 = k = 1 n 1 j = k + 1 n s g n ( x j x k )
s g n ( x j x k ) = { + 1 ,         ( x j x k ) > 0 0 ,               ( x j x k ) = 0 1 ,         ( x j x k ) < 0
where n is the length of the sequence (n > 40), k = 1, 2, …, n − 1, j = 2, 3, …, n, it has been proved that when n ≥ 8, S0 approximately obeys the normal distribution with mean and variance 0 (assuming no tied groups):
  V a r ( S 0 ) = [ n ( n 1 ) ( 2 n + 5 ) ] / 18
The standardized statistic Z can be calculated as:
Z = { S 0 1 V a r ( S 0 ) ,       S 0 > 0 0 ,                                             S 0 = 0     S 0 + 1 V a r ( S 0 ) ,         S 0 < 0    
The Z value less than zero indicates a downward trend, whereas the Z value greater than zero indicates an upward trend. If |Z| > 1.96, the trend is significant at the 95% confidence level; if |Z| > 2.58, the trend is significant at the 99% confidence level. Significant at the confidence level; vice versa. Before performing the MK trend test, autocorrelation analysis was first used to determine whether the PCI time series had autocorrelation.

3. Result and Discussions

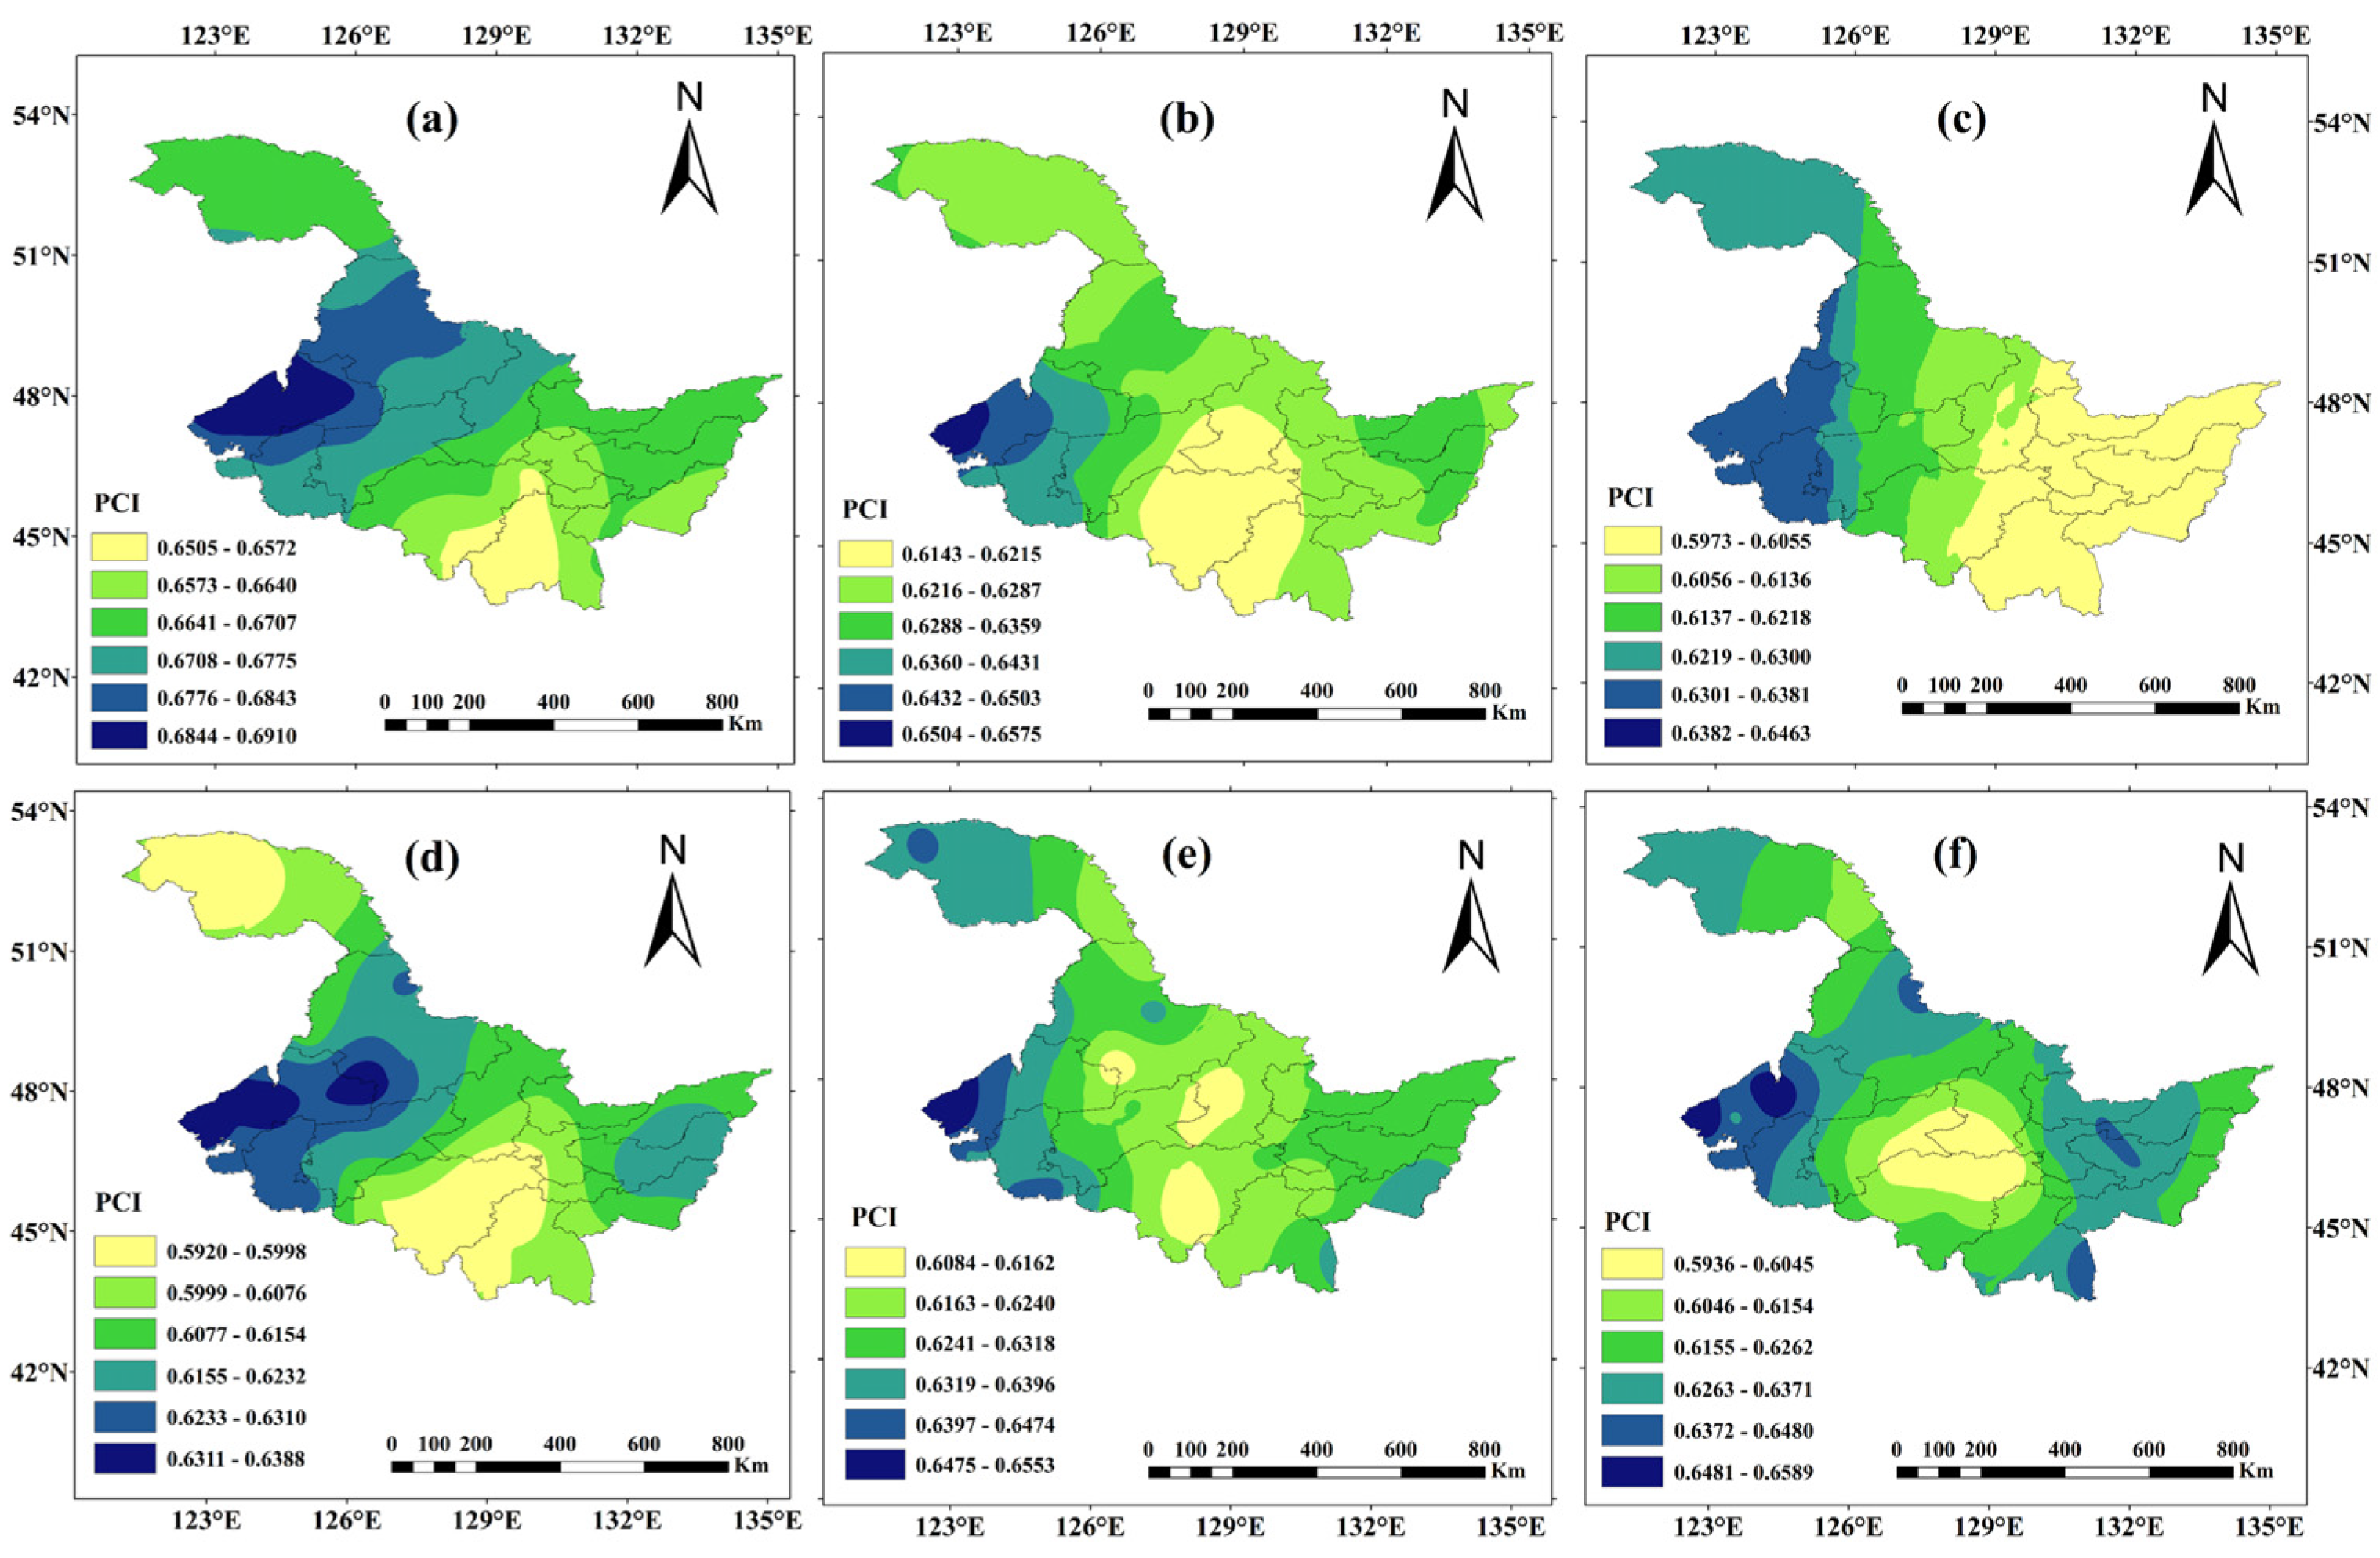
3.1. Spatial Pattern of PCI at Different Timescales

In accordance with Equations (1)–(4), this study employs Aihui Station as an illustrative example to elucidate the PCI calculation process. The coefficients a, b, and PCI corresponding to three timescales, year, maize growth period, and various stages of the maize growth period are subsequently computed. The calculated results of a, b, and PCI are tabulated in Table 4, while the Lorenz curve is depicted in Figure 2. Based on this calculation process, PCI values corresponding to each timescale are obtained and presented in Table 5. The spatial distribution of PCI for each timescale is illustrated in Figure 3. Overall, PCI values exceed 0.59, signifying that precipitation is more concentrated on a few rainy days at the respective timescale rather than being evenly distributed. The spatial distribution map of PCI on an annual scale reveals a discernible decreasing gradient from southwest to surrounding areas, particularly from southwest to southeast. Higher PCI values are observed in southwestern Heilongjiang Province, especially at Qiqihar Station and Fuyu Station, while smaller values are prevalent in the southeast, most of which are less than 0.67. Mudanjiang Station, for instance, records a PCI of only 0.6503, indicating fewer rainy days annually in southwestern Heilongjiang Province compared with the southeast. Turning to the PCI spatial distribution map at the growth period scale, PCI varies between 0.61 and 0.65, which is smaller than the annual PCI. Overall, it exhibits an increasing gradient from the middle to the surrounding areas. Higher values persist in the southwest, albeit smaller than the annual PCI. Lower values occur in the central part, particularly at the Tonghe and Shangzhi stations.
Analyzing the PCI spatial distribution map of the four growth stages, values are smaller than the annual PCI. The seeding–emergence period shows a decreasing trend from west to east, with smaller PCI values covering a larger proportion. Longjiang Station records a maximum value of 0.6657, while Tieli Station exhibits a minimum value of 0.5767. Compared with the seeding–emergence stage, the PCI value in the emergence–jointing stage is smaller. It shows a decreasing gradient from southwest to southeast and northwest, with Tonghe Station exhibiting the smallest PCI values. During the tasseling–milky stages, areas with lower PCI values are scattered, with Longjiang Station recording the maximum value of 0.6554 and Bei’an Station the minimum value of 0.6078. In the mature stage, PCI values exhibit a gradient of low in the middle and high around the edges, with Fuyu Station recording the maximum value and Tieli Station the minimum value.

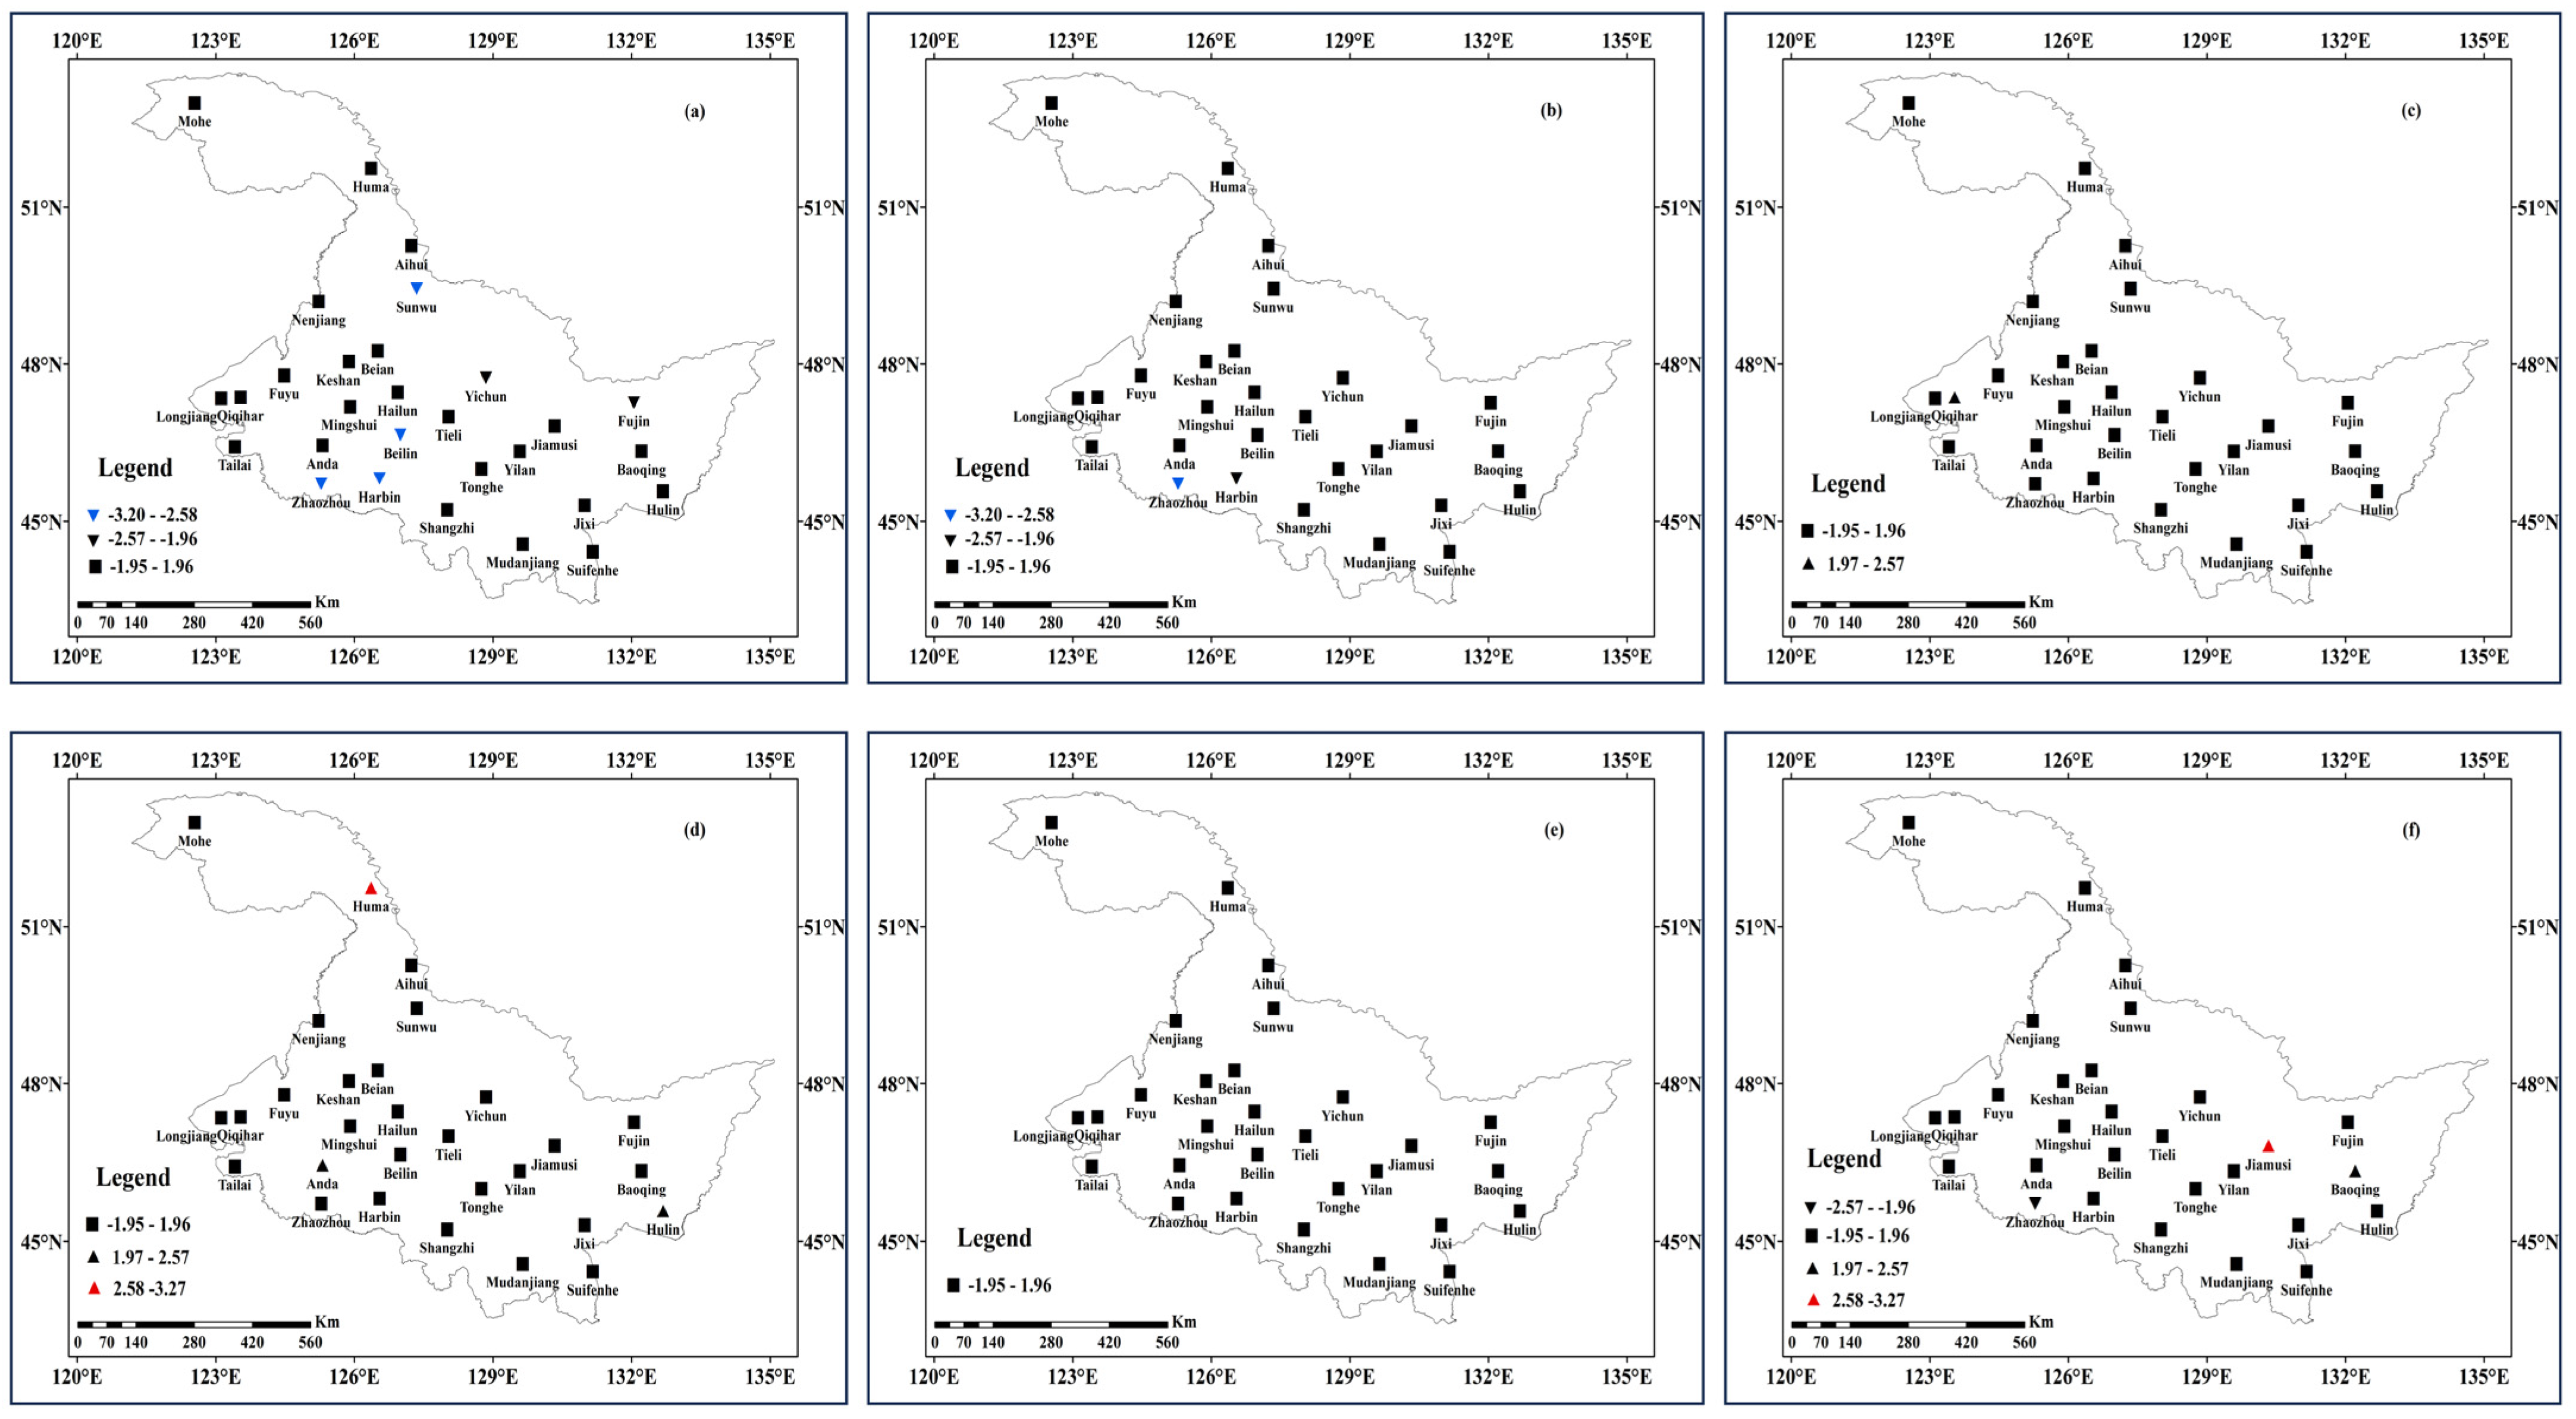
3.2. Spatial Distribution of PCI Trends at Different Timescales

After conducting autocorrelation analysis on the PCI time series and obtaining autocorrelation coefficients close to 0, indicating no autocorrelation, the Mann–Kendall (MK) trend test was applied to the PCI values derived from the previous analysis. The resulting trend values (Z-values) for PCI are presented in Table 6. The spatial distribution of Z-values for PCI across three timescales (year, maize growth period, and various stages of the maize growth period) is illustrated for the 29 meteorological stations in Heilongjiang Province in Figure 4. Analyzing the PCI trend distribution map on the annual scale, it is observed that PCI in most areas of Heilongjiang Province exhibits no significant trend at the 0.05 significance level, with no significantly rising sites. Notably, Yichun and Fujin show significant annual PCI declines at a significance level of 0.05. In a few areas, such as Beilin, Harbin, Sunwu, and Zhaozhou, the downward trend of PCI values is more significant, with the significance level reaching 0.01. Specifically, the PCI trend decreased significantly in the central and eastern regions of Heilongjiang Province. Examining the PCI trend distribution map at the maize growth period scale, no significantly rising sites are observed. Both Zhaozhou and Harbin exhibit significant declining trends, with the former having a significance level of 0.01 and the latter 0.05. Turning to the PCI trend distribution map for the four stages of the maize growth period, during the seeding–emergence stage, only Qiqihar shows a significant upward trend in PCI, with a significance level of 0.05. No significant upward or downward trend is evident during the tasseling–milky stage. However, significantly increased sites are observed at both the emergence–jointing and mature stages. In the emergence–jointing stages, the PCI values of Anda and Hulin increased significantly at the 0.05 level, while Huma’s PCI value increased significantly at the 0.01 level. In the mature stage, the PCI values of Jiamusi and Baoqing both exhibit an upward trend, whereas those of Zhaozhou show a significant downward trend.

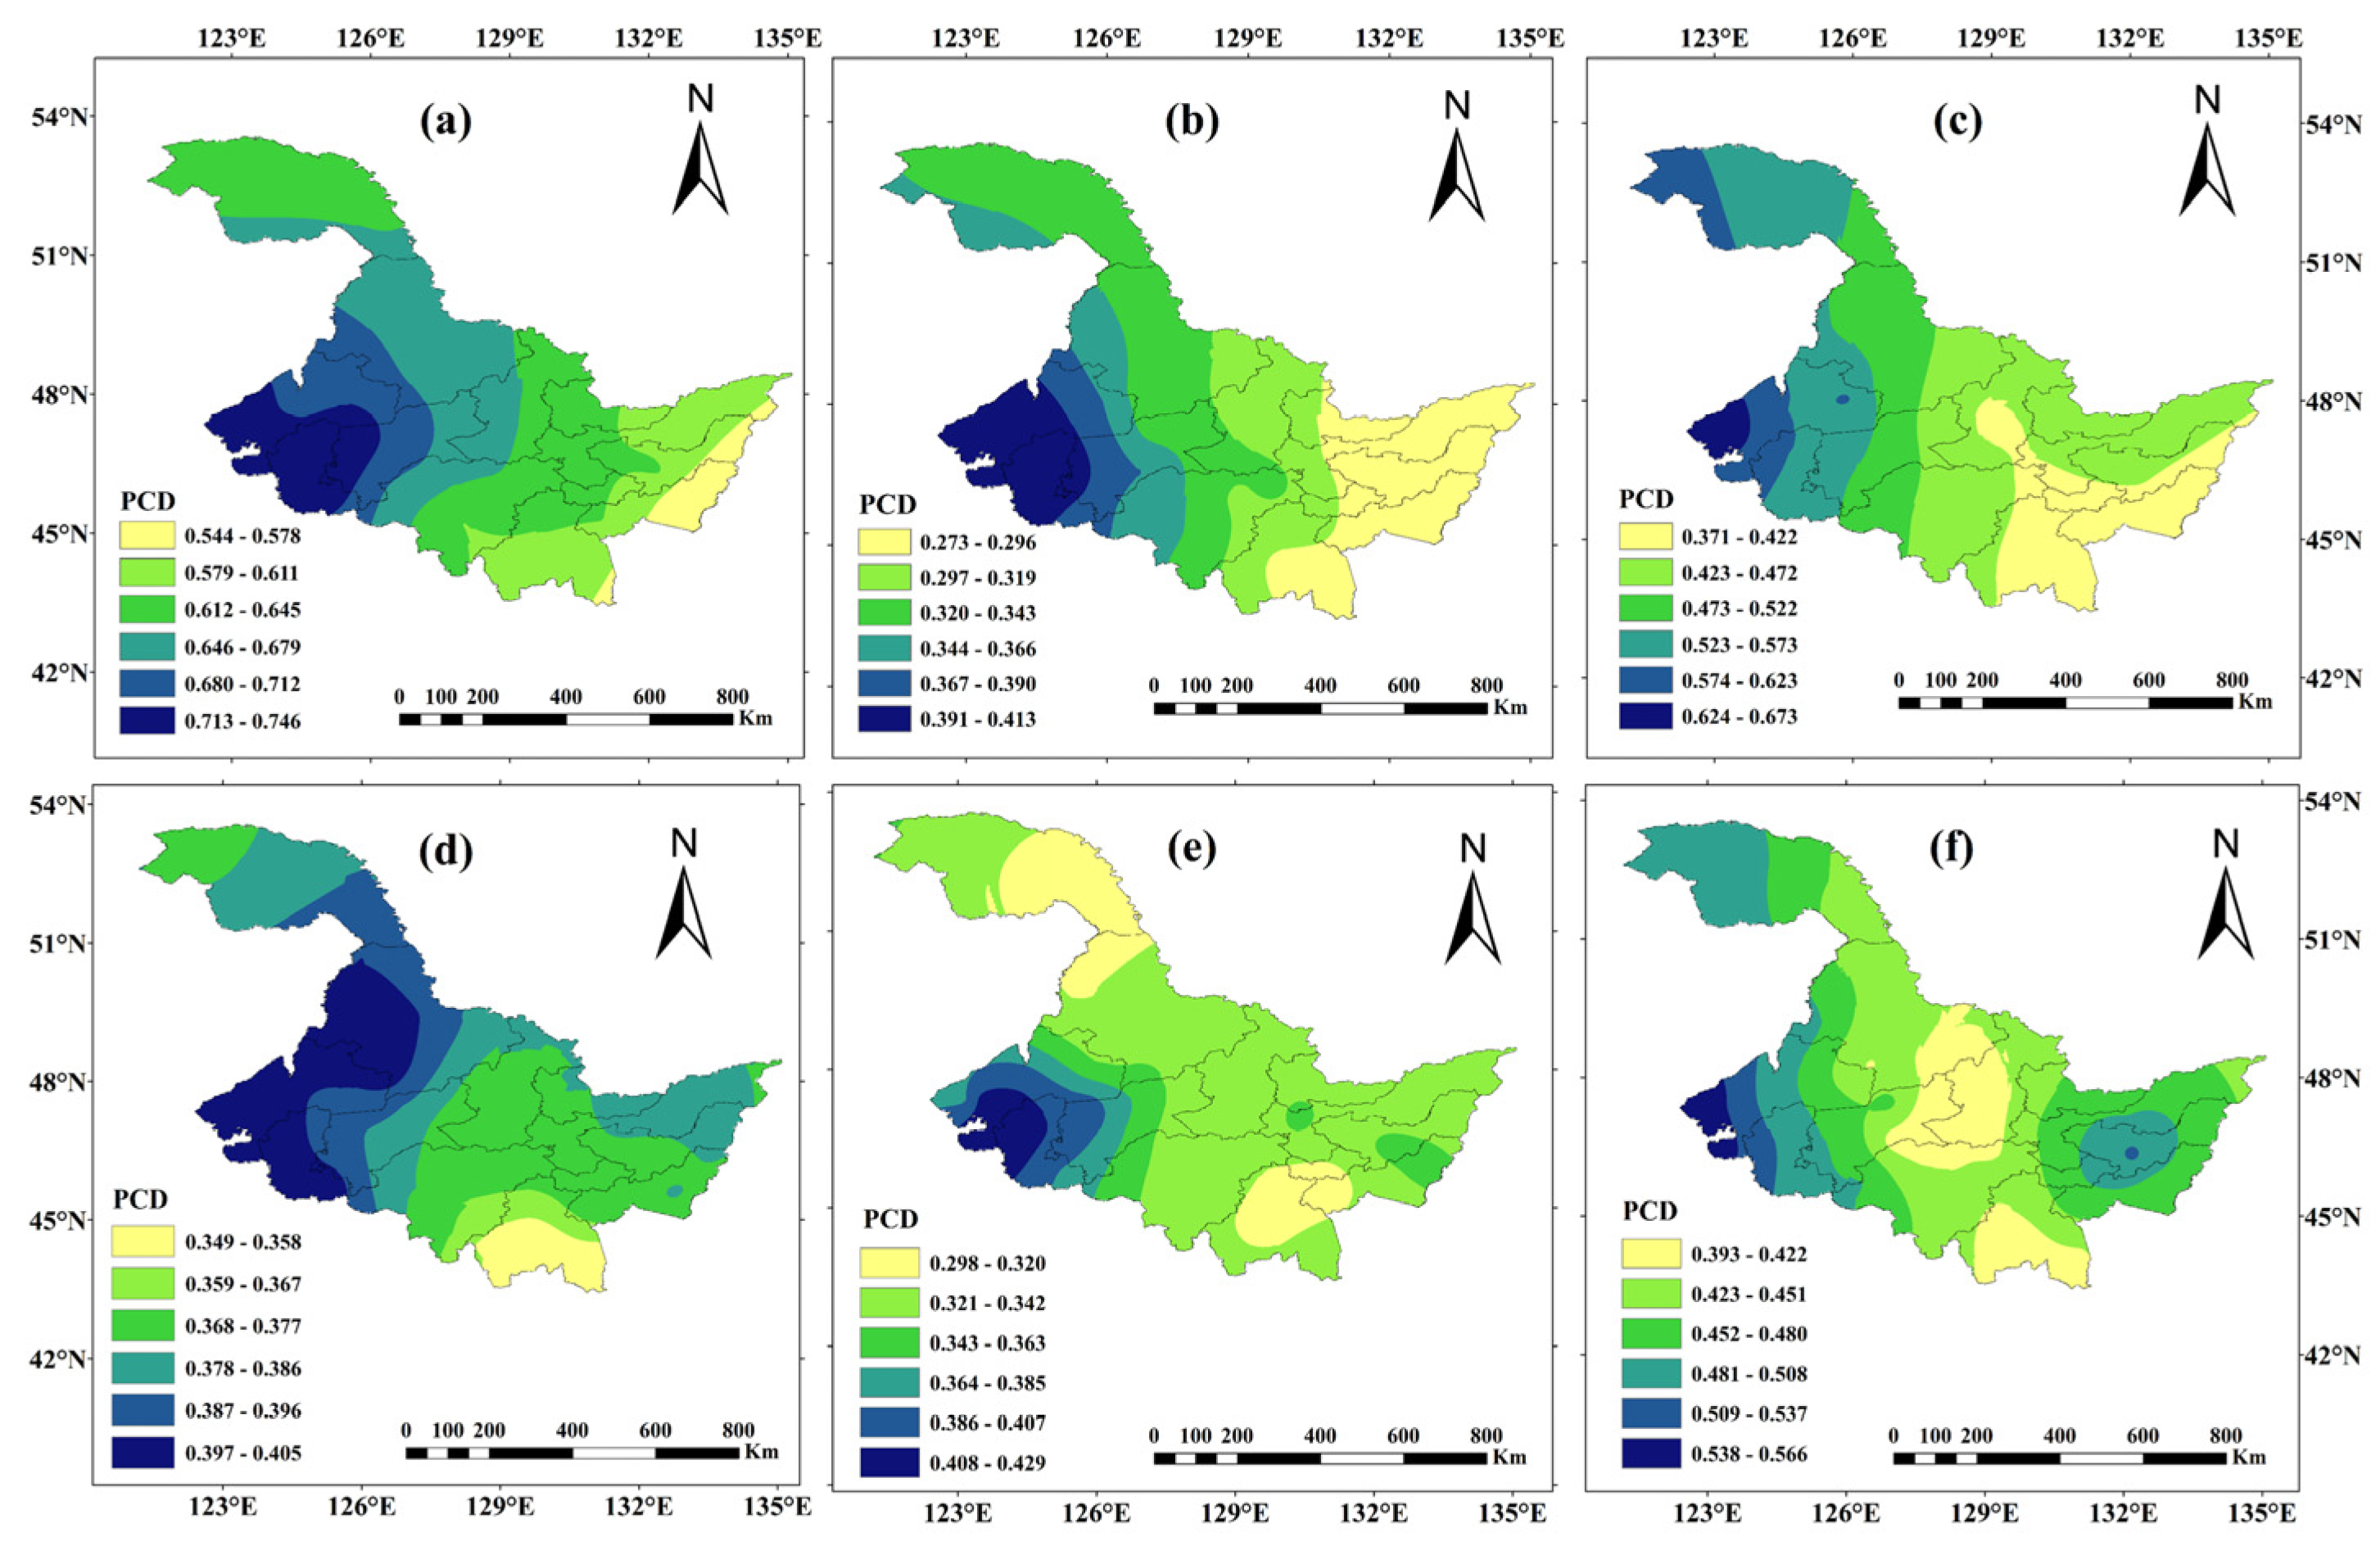
3.3. Spatial Patterns of PCD at Different Timescales

The average PCD for the 29 meteorological stations in Heilongjiang Province from 1961 to 2020, spanning the yearly maize growth period and four stages of maize growth period across three timescales, were calculated, as per Equation (5). The results of the average PCD calculations and the corresponding spatial distribution map are presented in Table 7 and Figure 5, respectively. Figure 5 illustrates that, generally, the PCD values in Heilongjiang Province from 1961 to 2020 exhibit a gradient of high in the west and low in the east. This indicates an increasing concentration of precipitation from east to west in Heilongjiang Province. Specifically, across various timescales and on an annual basis, the PCD values consistently surpass 0.5. However, at the growth period scale, all PCD values are less than 0.5. Most PCD values in the four stages of the growth period are also less than 0.5. This suggests that precipitation in Heilongjiang Province is relatively concentrated on an annual scale, while during the growth period and each growth period stage, it tends to be more scattered under these two timescales. Furthermore, larger PCD values are predominantly observed in the western part of Heilongjiang Province, particularly in the Qiqihar area, whereas smaller values are more prevalent in the Mudanjiang and Suifenhe areas in the southeast. Additionally, upon comparing the spatial distribution of PCD values at each stage of the growth period, it is evident that the PCD values and their change amplitudes during the seeding–emergence and maturity stages are larger than those during the emergence–jointing and tasseling–milky maturity stages. This indicates that the seeding–emergence and maturity stages are relatively concentrated but exhibit substantial spatial variability.

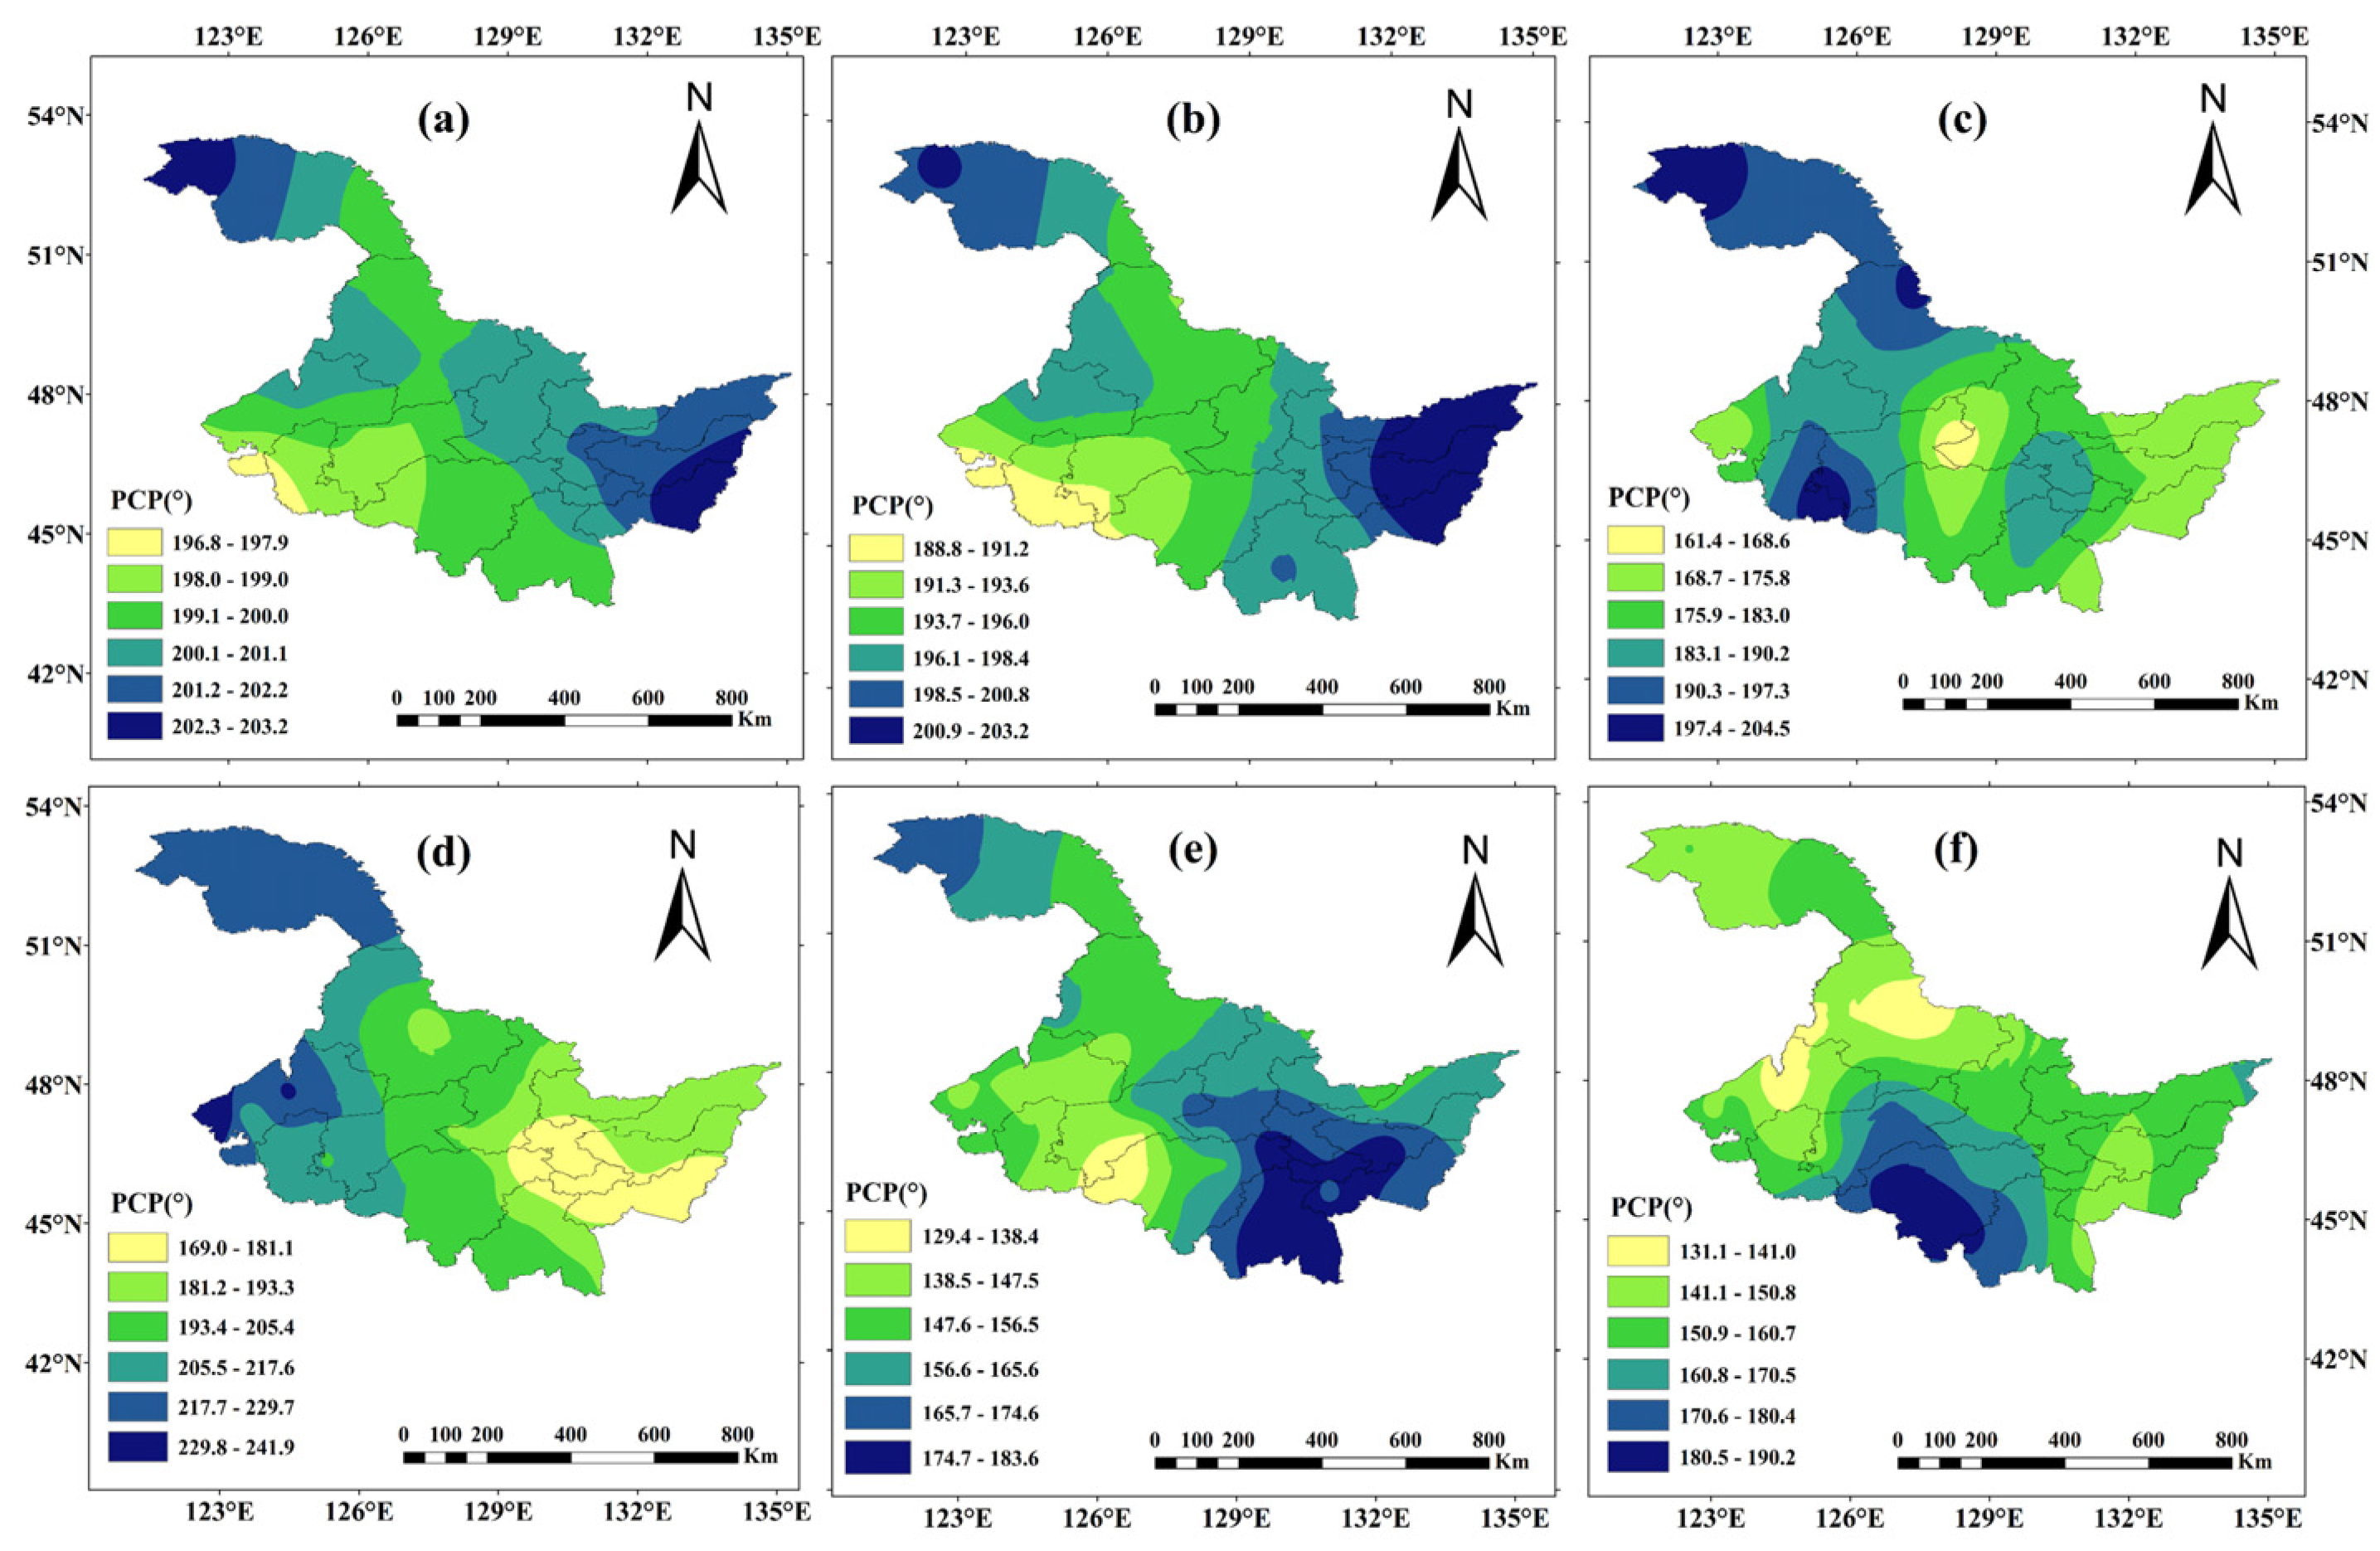
3.4. Spatial Patterns of PCP at Different Timescales

The average PCP for the 29 meteorological stations in Heilongjiang Province from 1961 to 2020, covering the yearly maize growth period and four stages of the maize growth period across three timescales, were calculated using Equation (6). The results of the average PCP calculations and the corresponding spatial distribution map are presented in Table 8 and Figure 6, respectively. From Figure 6, it is evident that the PCP values for Heilongjiang Province range between 196° and 203° on an annual scale. Precipitation on an annual scale is predominantly concentrated in July, with a spatial distribution indicating lower values in the southwest and higher values in the northeast and northwest. This suggests that the rainy season in the southwest of Heilongjiang Province occurs earlier than in the northeast and northwest. At the growth period scale, the PCP values vary between 188° and 203°, and the spatial distribution is akin to that at the annual scale. The lowest value is observed at Tailai Station, while the highest value is noted at Hulin Station. For the four stages of the growth period, PCP values exhibit noticeable spatial variability. Overall, the PCP values in these stages fluctuate between 129° and 241°, emphasizing a relatively consistent precipitation pattern across these stages. However, there is a focus on the midpoints of each stage. Simultaneously, the PCP values for the seeding–emergence stage and the emergence–jointing stage vary between 161° and 204° and between 169° and 241°, respectively. These represent the smallest and largest changes among the four stages, indicating that the PCP during the seeding–emergence period exhibits the least spatial variability, while the opposite is true for the emergence–jointing stage.
From the analysis, the precipitation unevenness in Heilongjiang Province shows certain differences for various time scales. The PCI values at the annual scale and the growth period scale have no obvious trends. Only the PCI of Zhaozhou and Harbin have an obvious downward trend at both timescales, the annual and the maize growth period. However, further analysis found that Harbin’s PCI did not show a significant trend in the four growth stages timescale, whereas Zhaozhou’s PCI value only showed a significant downward trend during the maize maturity period timescale. The spatial distributions of PCD and PCP at the annual timescale and the growth period timescale are very similar, but there is a certain spatial difference in the timescale of the four stages of the growth period.

3.5. Interpretation of the Precipitation Unevenness

Heilongjiang Province, situated in northeastern China, experiences a temperate continental climate influenced by the temperate continental monsoon. During the summer, a moist monsoon originates from the southeast but encounters obstacles in penetrating further inland due to the mountainous terrain in the central and southern regions of the province [50]. This climatic phenomenon is evident in observed data spanning from 1961 to 2008, revealing a declining trend in annual average precipitation and summer precipitation in northeastern China, following a trajectory from the southeast to the northwest [51]. As a result, the southeastern part of Heilongjiang Province receives relatively higher precipitation, albeit characterized by lower concentration levels. The monsoon plays a crucial role in contributing to the observed irregularities in precipitation patterns within Heilongjiang Province.

4. Conclusions

Heilongjiang Province, located in a cold climate zone, typically undergoes a single-crop growing season annually. In this study, PCI, PCD, and PCP were employed to examine the spatial characteristics of precipitation at three distinct timescales: yearly, during the maize growth period, and within different growth stages of maize cultivation. The outcomes of this research study carry scientific and practical significance for water resource management, agricultural planning, and irrigation in Heilongjiang Province. The main findings of this study are summarized as follows:
(1)
At the three scales of year, growth period, and growth stage, the PCI values in southwestern Heilongjiang Province are higher, while the areas with lower values are more scattered. This indicates that precipitation in southwestern Heilongjiang Province is more concentrated, corresponding to fewer rainy days on a given timescale.
(2)
At the three scales of year, growth period, and growth period, the PCD shows a decreasing trend from west to east. On an annual scale, precipitation in the western part of Heilongjiang Province is relatively concentrated and occurs relatively early, while precipitation in the eastern part is scattered and concentrated later. Precipitation displays uneven distribution in both space and time. While the overall trend of precipitation at the growth period scale remains unchanged compared with the annual scale, the overall precipitation concentration is lower, and precipitation is relatively evenly distributed. In each stage of the growth period, the largest PCD values appear in the Qiqihar and Daqing areas, while the smallest value appears in the Mudanjiang area.
(3)
On the annual scale, the spatial distribution of PCP is high in the northeast and northwest and low in the southwest and central parts. The PCP decreases from 203° to 196°, indicating that the annual precipitation concentration period in the southwest and central parts of Heilongjiang Province is earlier than that in the northeast. In the central and northwest regions, the annual precipitation is mainly concentrated in July. The PCP decreases from 203° to 188° at the growth period scale, indicating that the growth period precipitation occurs earlier in the southwest and central Heilongjiang Province than in the northeast and northwest, and the precipitation during the growth period is mainly concentrated in mid- and late July. The distribution of PCP in each growth stage is quite different, but the PCP values are concentrated in the range of 129°~241°, indicating that precipitation in each growth stage is concentrated in the middle of each growth stage.
The mechanisms underlying precipitation irregularity are intricate, involving numerous factors that warrant further investigation. Factors such as the Pacific Decadal Oscillation (PDO), Arctic Oscillation (AO), El Niño-Southern Oscillation (ENSO), and solar activity (represented by sunspots, SS) may also influence the causes of precipitation irregularity. Therefore, there is a need for more in-depth research to elucidate the precise mechanisms underlying precipitation irregularity. This understanding is crucial for better comprehending the impacts of climate change and uneven precipitation distribution on agriculture, water resource management, and related fields. In addition, the analysis of precipitation heterogeneity at smaller scales also needs further research.

Author Contributions

Conceptualization, F.M., Z.S. and E.Z.; software, F.M., Z.S. and Y.J.; formal analysis, F.M., Z.S., Y.J. and E.Z.; data curation, L.Y. and F.D.; writing—original draft preparation, Z.S.; writing—review and editing, F.M., Z.S., H.Z. and T.L. All authors have read and agreed to the published version of the manuscript.

Funding

This research has been supported by the National Nature Science Foundation of China Youth Fund (Grant No. 52109055), Science Fund for Distinguished Young Scholars of Heilongjiang University (Natural Science) (JCL202105) and the Basic Scientific Research Fund of Heilongjiang Provincial Universities: (2022-KYYWF-1044).

Data Availability Statement

The information used in the analysis is accessible from the public data sources.

Conflicts of Interest

The authors declare no conflict of interest.

References

  1. Molua, E.L. An empirical assessment of the impact of climate change on smallholder agriculture in Cameroon. Glob. Planet. Change 2009, 67, 205–208. [Google Scholar] [CrossRef]
  2. Sohoulande, C.D.D.; Stone, K.; Szogi, A.; Bauer, P. An investigation of seasonal precipitation patterns for rainfed agriculture in the Southeastern region of the United States. Agric. Water Manag. 2019, 223, 105728. [Google Scholar] [CrossRef]
  3. Zhang, Q.; Sun, P.; Singh, V.P.; Chen, X.H. Spatial-temporal precipitation changes (1956–2000) and their implications for agriculture in China. Glob. Planet. Change 2012, 82–83, 86–95. [Google Scholar] [CrossRef]
  4. Wang, T.Y.; Du, C.; Nie, T.Z.; Sun, Z.Y.; Zhu, S.J.; Feng, C.X.; Dai, C.L.; Chu, L.L.; Liu, Y.; Liang, Q.Z. Spatiotemporal analysis of maize water requirement in the Heilongjiang Province of China during 1960–2015. Water 2020, 12, 2472. [Google Scholar] [CrossRef]
  5. Piao, S.L.; Ciais, P.; Huang, Y.; Shen, Z.H.; Peng, S.S.; Li, J.S.; Zhou, L.P.; Liu, H.Y.; Ma, Y.C.; Ding, Y.H.; et al. The impacts of climate change on water resources and agriculture in China. Nature 2010, 467, 43–51. [Google Scholar] [CrossRef] [PubMed]
  6. Pendergrass, A.G.; Knutti, R.; Lehner, F.; Deser, C.; Sanderson, B.M. Precipitation variability increases in a warmer climate. Sci. Rep. 2017, 7, 17966. [Google Scholar] [CrossRef] [PubMed]
  7. He, B.R.; Zhai, P.M. Changes in persistent and non-persistent extreme precipitation in China from 1961 to 2016. Adv. Clim. Change Res. 2018, 9, 177–184. [Google Scholar] [CrossRef]
  8. Yang, X.J.; Xu, Z.X.; Liu, W.F.; Liu, L. Spatiotemporal characteristics of extreme precipitation at multiple timescales over Northeast China during 1961–2014. J. Water Clim. Change 2017, 8, 535–556. [Google Scholar] [CrossRef]
  9. Huang, H.P.; Winter, J.M.; Osterberg, E.C.; Horton, R.M.; Beckage, B. Total and extreme precipitation changes over the Northeastern United. J. Hydrometeorol. 2017, 18, 1783–1798. [Google Scholar] [CrossRef]
  10. Zhang, L.J.; Li, Y.S.; Zhang, F.; Chen, L.; Pan, T.; Wang, B.; Ren, C. Changes of winter extreme precipitation in Heilongjiang province and the diagnostic analysis of its circulation features. Atmos. Res. 2020, 245, 105094. [Google Scholar] [CrossRef]
  11. O’Gorman, P.A. Precipitation extremes under climate change. Curr. Clim. Change Rep. 2015, 1, 49–59. [Google Scholar] [CrossRef]
  12. Huang, Y.; Wang, H.; Xiao, W.H.; Chen, L.H.; Yang, H. Spatiotemporal characteristics of precipitation concentration and the possible links of precipitation to monsoons in China from 1960 to 2015. Theor. Appl. Climatol. 2019, 138, 135–152. [Google Scholar] [CrossRef]
  13. Zhang, R.; Li, A.Q.; Chen, T.T.; Xia, G.M.; Wu, Q.; Chi, D.C. Analysis of precipitation concentration degree changes and its spatial evolution in the western plain of Jilin Province. Mausam 2020, 71, 291–298. [Google Scholar]
  14. Amiri, M.A.; Gocic, M. Analyzing the applicability of some precipitation concentration indices over Serbia. Theor. Appl. Climatol. 2021, 146, 645–656. [Google Scholar] [CrossRef]
  15. Chatterjee, S.; Khan, A.; Akbari, H.; Wang, Y.P. Monotonic trends in spatio-temporal distribution and concentration of monsoon precipitation (1901–2002), West Bengal, India. Atmos. Res. 2016, 182, 54–75. [Google Scholar] [CrossRef]
  16. Silva, B.K.N.; Lucio, P.S. Characterization of risk/exposure to climate extremes for the Brazilian Northeast-case study: Rio Grande do Norte. Theor. Appl. Climatol. 2015, 122, 59–67. [Google Scholar] [CrossRef]
  17. Liu, Y.; Yan, D.C.; Wen, A.B.; Shi, Z.L.; Chen, T.L.; Chen, R.Y. Relationship between precipitation characteristics at different scales and drought/flood during the past 40 years in Longchuan river, Southwestern China. Agriculture 2022, 12, 89. [Google Scholar] [CrossRef]
  18. Llano, M.P. Spatiotemporal variability of monthly precipitation concentration in Argentina. J. South. Hemisph. Earth Syst. Sci. 2023, 73, 168–177. [Google Scholar] [CrossRef]
  19. Zaman, M.; Shahid, M.A.; Ahmad, I.; Shen, Y.J.; Usman, M.; Khan, M.I.; Saifullah, M. Spatiotemporal variability of precipitation concentration in Pakistan. Int. J. Climatol. 2023. ahead of print. [Google Scholar] [CrossRef]
  20. Huang, Y.; Wang, H.; Xiao, W.H.; Chen, L.H.; Yan, D.H.; Zhou, Y.Y.; Jiang, D.C.; Yang, M.Z. Spatial and Temporal Variability in the Precipitation Concentration in the Upper Reaches of the Hongshui River Basin, Southwestern China. Adv. Meteorol. 2018, 2018, 4329757. [Google Scholar] [CrossRef]
  21. Bai, A.J.; Liu, X.D. Characteristics of rainfall variation over East China for the last 50 years and their relationship with droughts and floods. J. Trop. Meteorol. 2010, 16, 255–262. [Google Scholar]
  22. Darand, M.; Pazhoh, F. Spatiotemporal changes in precipitation concentration over Iran during 1962–2019. Clim. Change 2022, 173, 25. [Google Scholar] [CrossRef]
  23. Li, X.M.; Jiang, F.Q.; Li, L.H.; Wang, G.Q. Spatial and temporal variability of precipitation concentration index, concentration degree and concentration period in Xinjiang, China. Int. J. Climatol. 2011, 31, 1679–1693. [Google Scholar] [CrossRef]
  24. Liu, X.P.; Tong, X.H.; Jia, Q.Y.; Xin, Z.H.; Yang, J.R. Precipitation concentration characteristics in China during 1960–2017. Adv. Water Sci. 2021, 32, 10–19. [Google Scholar] [CrossRef]
  25. Wang, W.G.; Xing, W.Q.; Yang, T.; Shao, Q.X.; Peng, S.Z.; Yu, Z.B.; Yong, B. Characterizing the changing behaviours of precipitation concentration in the Yangtze River Basin, China. Hydrol. Process. 2013, 27, 3375–3393. [Google Scholar] [CrossRef]
  26. Jiang, P.; Wang, D.; Cao, Y. Spatiotemporal characteristics of precipitation concentration and their possible links to urban extent in China. Theor. Appl. Climatol. 2016, 123, 757–768. [Google Scholar] [CrossRef]
  27. Guo, S.B.; Yang, X.G.; Zhang, Z.T.; Zhang, F.L.; Liu, T. Spatial Distribution and Temporal Trend Characteristics of Agro-Climatic Resources and Extreme Climate Events during the Soybean Growing Season in Northeast China from 1981 to 2017. J. Meteorol. Res. 2020, 34, 1309–1323. [Google Scholar] [CrossRef]
  28. Li, C.; Li, Z.; Xu, H.; Huang, J.; Zhang, F.; Qian, Z. Fluctuation Characteristics of Wheat Yield and Their Relationships with Precipitation Anomalies in Anhui Province, China. Int. J. Plant Prod. 2022, 16, 483–494. [Google Scholar] [CrossRef]
  29. Xu, S. Temporal and spatial characteristics of the change of cultivated land resources in the black soil region of Heilongjiang Province (China). Sustainability 2019, 11, 38. [Google Scholar] [CrossRef]
  30. Li, D.; He, L.Y.; Qu, J.G.; Xu, X.F. Spatial evolution of cultivated land in the Heilongjiang Province in China from 1980 to 2015. Environ. Monit. Assess. 2022, 194, 444. [Google Scholar] [CrossRef]
  31. Zhao, Q.; Zou, C.H.; Wang, K.F.; Gao, Q.; Yao, T. Spatial and temporal distribution characteristics of drought and its influencing factors in Heilongjiang Province, China from 1956 to 2015. Appl. Ecol. Environ. Res. 2019, 17, 2631–2650. [Google Scholar] [CrossRef]
  32. Fu, Q.; Zhou, Z.Q.; Li, T.X.; Liu, D.; Hou, R.J.; Cui, S.; Yan, P.R. Spatiotemporal characteristics of droughts and floods in northeastern China and their impacts on agriculture. Stoch. Environ. Res. Risk Assess. 2018, 32, 2913–2931. [Google Scholar] [CrossRef]
  33. Xie, Y.Y.; Liu, S.Y.; Fang, H.Y.; Ding, M.H.; Liu, D.F. A study on the precipitation concentration in a Chinese region and its relationship with teleconnections indices. J. Hydrol. 2022, 612, 128203. [Google Scholar] [CrossRef]
  34. Liu, Z.J.; Yang, X.G.; Hubbard, K.G.; Lin, X.M. Maize potential yields and yield gaps in the changing climate of northeast China. Glob. Change Biol. 2012, 18, 3441–3454. [Google Scholar] [CrossRef]
  35. Pei, W.; Fu, Q.; Liu, D.; Li, T.X. A drought index for rainfed agriculture: The standardized precipitation crop evapotranspiration index (SPCEI). Hydrol. Process. 2019, 33, 803–815. [Google Scholar] [CrossRef]
  36. Koimbori, J.K.; Wang, S.; Pan, J.; Guo, L.P.; Li, K. Yield response of spring maize under future climate and the effects of adaptation measures in Northeast China. Plants 2022, 11, 1634. [Google Scholar] [CrossRef]
  37. Martin-Vide, J. Spatial distribution of a daily precipitation concentration index in peninsular Spain. Int. J. Climatol. 2004, 24, 959–971. [Google Scholar] [CrossRef]
  38. Brooks, B.C.E.P.; Carruthers, N. Handbook of statistical methods in meteorology. R. Stat. Soc. J. Ser. A Gen. 1953, 116, 460–461. [Google Scholar]
  39. Riehl, H. Some aspects of Hawaiian rainfall. Bull. Am. Meteorol. Soc. 1949, 30, 176–187. [Google Scholar] [CrossRef]
  40. Zhang, Q.; Xu, C.Y.; Gemmer, M.; Chen, Y.D.; Liu, C.L. Changing properties of precipitation concentration in the Pearl River basin, China. Stoch. Environ. Res. Risk Assess. 2009, 23, 377–385. [Google Scholar] [CrossRef]
  41. Olascoaga, M.J. Some Aspects of Argentine Rainfall. Tellus 1950, 2, 312–318. [Google Scholar] [CrossRef]
  42. Shaw, G.; Wheeler, D. Statistical Techniques in Geographical Analysis; Halsted Press: New York, NY, USA, 1988; Volume 5, pp. 145–147. [Google Scholar]
  43. Zhang, L.J.; Qian, Y.F. Annual distribution features of precipitatioon in China and their interannual variations. Acta Meteorol. Sin. 2003, 17, 146–163. [Google Scholar]
  44. Zhao, F. Response of Maize Growth and Development to Climate Change in Heilongjiang Province. Master’s Thesis, Ningxia University, Yinchuan, China, 2019. [Google Scholar]
  45. Kendall, M.G. Rank correlation methods. Br. J. Psychol. 1990, 25, 86–91. [Google Scholar] [CrossRef]
  46. Mann, H.B. Nonparametric test against trend. Econometrica 1945, 13, 245–259. [Google Scholar] [CrossRef]
  47. Wang, W.; Chen, X.; Shi, P.; van Gelder, P.H.A.J.M. Detecting changes in extreme precipitation and extreme streamflow in the Dongjiang River Basin in southern China. Hydrol. Earth Syst. Sci. 2008, 12, 207–221. [Google Scholar] [CrossRef]
  48. Jiang, X.T. Observed trends of annual maximum water level and streamflow during past 130 years in the Yangtze River basin, China. J. Hydrol. 2006, 324, 255–265. [Google Scholar] [CrossRef]
  49. Partal, T.; Kahya, E. Trend analysis in Turkish precipitation data. Hydrol. Process. 2006, 20, 2011–2026. [Google Scholar] [CrossRef]
  50. Zhou, X.J.; Na, J.H.; Pan, H.S. Climatic characteristics and cause of summer drought in Heilongjiang Province. J. Nat. Disasters 2011, 20, 131–135. [Google Scholar]
  51. Liang, L.Q.; Li, L.J.; Liu, Q. Precipitation variability in Northeast China from 1961 to 2008. J. Hydrol. 2011, 404, 67–76. [Google Scholar] [CrossRef]
Figure 1. Study area and meteorological stations distribution map.
Agronomy 13 03057 g001
Figure 2. Lorenz curves at various timescales at Aihui Station. (a) yearly; (b) maize growth period; (c) seeding–emergence period; (d) emergence–jointing stage; (e) tasseling–milky stage; (f) mature.
Agronomy 13 03057 g002
Figure 3. PCI spatial distribution map at each timescale. (a) yearly; (b) maize growth period; (c) seeding–emergence period; (d) emergence–jointing stage; (e) tasseling–milky stage; (f) mature stage.
Agronomy 13 03057 g003
Figure 4. Spatial distribution map of PCI trends at each timescale (Z value). (a) yearly; (b) maize growth period; (c) seeding–emergence period; (d) emergence–jointing stage; (e) tasseling–milky period; (f) mature period.
Agronomy 13 03057 g004
Figure 5. Spatial distribution map of PCD at each timescale. (a) yearly; (b) maize growth period; (c) seeding–emergence period; (d) emergence–jointing stage; (e) tasseling–milky stage; (f) mature stage.
Agronomy 13 03057 g005
Figure 6. Spatial distribution map of PCP at each timescale. (a) yearly; (b) maize growth period; (c) seeding–emergence period; (d) emergence–jointing stage; (e) tasseling–milky stage; (f) mature stage.
Agronomy 13 03057 g006
Table 1. Azimuth angle of each month in a year.
MonthJanuaryFebruaryMarchAprilMayJune
θ(°)154575105135165
MonthJulyAugustSeptemberOctoberNovemberDecember
θ(°)195225255285315345
Table 2. Azimuth angle of each 10 days in a growth period.
MonthMayJuneJuly
timefirstmidlastfirstmidlastuppermidlast
θ(°)12366084108132156180204
MonthAugustSeptember
timefirstmidlastfirstmidlast
θ(°)228252276300324348
Table 3. Azimuth angle of each day in a stage of the growth period.
Day12345678
θ(°)618304254667890
Day910111213141516
θ(°)102114126138150162174186
Day1718192021222324
θ(°)198210222234246258270282
Day252627282930
θ(°)294306318330342354
Table 4. Corresponding coefficients a, b, and PCI values at each timescale at Aihui Station.
AihuiYearGrowth PeriodSeeding–Emergence
Stage
Emergence–Jointing
Stage
Tasseling–Milky
Stage
Mature Stage
a0.01000.02090.02980.02330.02260.0227
b0.04530.03820.03440.03750.03750.0368
PCI0.68090.63020.61040.62610.62060.6405
Table 5. Calculation results of PCI values at various timescales.
Station NameStation
Number
Annual PCIPCI in Growth PeriodPCI in Seeding–Emergence
Stage
PCI in Emergence–Jointing
Stage
PCI in Tasseling–Milky
Stage
PCI in Mature Stage
Aihui504680.68090.63020.61040.62610.62060.6405
Anda508540.67140.63630.63880.62030.63200.6249
Baoqing508880.66780.62660.59710.62170.62480.6383
Beian506560.67680.62730.61430.63800.60780.6241
Beilin508530.67140.62410.61450.61760.62060.5984
Fujin507880.66670.63270.62390.61400.63120.6358
Fuyu507420.69110.64730.64950.63570.63610.6614
Harbin509530.66640.62320.60450.59990.62910.6069
Hailun507560.67540.63360.63270.62420.62590.6182
Huma503530.66620.62300.61640.60900.62000.6106
Hulin509830.66010.62890.60640.61400.63810.6247
Jixi509780.66330.62310.61280.60550.62130.6262
Jiamusi508730.66000.62160.60170.60110.62420.6331
Keshan506580.68550.63980.64840.63330.62460.6318
Mingshui507580.67980.63630.64990.62400.62350.6170
Mohe501360.66520.62640.61300.59250.64030.6265
Mudanjiang540940.65030.62090.60710.60050.62190.6229
Nenjiang505570.67950.62830.59340.61010.63820.6230
Qiqihar507450.68670.64970.66140.63140.64790.6299
Shangzhi509680.65770.61500.59650.59370.61060.6192
Suifenhe540960.66540.62480.60820.60130.63420.6450
Sunwu505640.67930.63230.60420.61570.63620.6360
Tailai508440.67380.63970.62620.62450.63930.6411
Tieli508620.67040.61560.57670.61120.61510.5929
Tonghe509630.66560.61430.59330.59200.61820.5956
Yichun507740.67440.62040.58990.61210.61190.6101
Yilan508770.65620.62040.60760.59390.62500.5948
Zhaozhou509500.67700.64100.62280.62680.64140.6337
Longjiang507390.68640.65770.66570.63900.65540.6597
Table 6. Calculation results of Z values at various timescales.
Station NameStation
Number
Annual ZZ in Growth PeriodZ in Seeding–Emergence
Stage
Z in Emergence–Jointing
Stage
Z in Tasseling–Milky
Stage
Z in Mature Stage
Aihui50468−0.760.36−0.48−0.431.080.62
Anda50854−0.170.361.022.01−0.52−0.43
Baoqing50888−0.81−0.120.070.66−0.341.98
Beian50656−1.78−1.88−1.000.52−1.68−0.16
Beilin50853−3.20−1.40−0.38−1.310.200.76
Fujin50788−2.23−1.49−0.98−0.99−0.351.51
Fuyu507420.301.120.951.221.80−1.21
Harbin50953−3.03−2.48−1.75−0.73−0.96−0.20
Hailun50756−1.51−0.50−0.780.110.85−0.96
Huma503530.950.451.843.27−0.96−1.35
Hulin50983−1.15−1.41−0.622.39−1.52−0.71
Jixi50978−1.19−0.98−0.49−0.45−0.670.15
Jiamusi50873−0.13−0.34−0.960.36−0.852.84
Keshan50658−0.84−0.41−1.581.22−0.07−1.47
Mingshui50758−0.31−0.38−0.04−1.220.240.71
Mohe501360.610.470.10−0.290.77−0.17
Mudanjiang540940.290.31−0.850.990.18−0.47
Nenjiang50557−1.100.00−1.351.030.72−0.62
Qiqihar507450.390.502.090.331.380.23
Shangzhi50968−0.91−1.040.31−1.31−0.860.96
Suifenhe540960.390.840.630.75−0.45−0.59
Sunwu50564−2.86−1.55−0.680.310.01−1.88
Tailai50844−0.27−0.011.440.410.91−1.84
Tieli50862−1.74−0.40−0.660.380.620.24
Tonghe50963−0.900.060.55−0.661.010.87
Yichun50774−2.02−1.13−1.60−0.66−1.540.70
Yilan50877−0.27−0.18−0.82−0.66−0.020.35
Zhaozhou50950−3.06−2.69−1.58−0.49−1.91−2.32
Longjiang50739−1.00−1.55−0.38−0.55−0.06−0.53
Table 7. Calculation results of PCD values at various timescales.
Station NameStation
Number
Annual PCDPCD in Growth PeriodPCD in Seeding–Emergence
Stage
PCD in Emergence–Jointing
Stage
PCD in Tasseling–Milky
Stage
PCD in Mature Stage
Aihui504680.6700.3270.4780.3890.3250.424
Anda508540.7330.4010.5470.3820.4000.489
Baoqing508880.6140.2860.4320.3510.3460.515
Beian506560.6840.3400.5180.4230.3350.419
Beilin508530.6870.3660.5000.3820.3480.409
Fujin507880.6020.2750.4550.3960.3290.476
Fuyu507420.7070.4030.5740.3930.3990.492
Harbin509530.6620.3560.4830.3760.3530.478
Hailun507560.6890.3310.4940.3830.3610.461
Huma503530.6410.3280.5120.3900.3030.427
Hulin509830.5440.2730.3710.3880.3410.463
Jixi509780.6130.2950.3990.3940.2970.469
Jiamusi508730.6130.3000.4240.3670.3470.460
Keshan506580.7040.3680.5770.3960.3460.442
Mingshui507580.7230.3780.5410.3810.3980.461
Mohe501360.6250.3360.5780.3680.3320.497
Mudanjiang540940.6030.2890.4070.3320.3150.407
Nenjiang505570.6900.3670.5300.4010.3240.493
Qiqihar507450.7190.4110.6410.4200.4140.527
Shangzhi509680.6110.3380.4590.3670.3250.438
Suifenhe540960.5810.2940.4010.3450.3360.425
Sunwu505640.6570.3310.4870.3990.3380.433
Tailai508440.7300.4040.5960.4050.4300.547
Tieli508620.6630.3320.4370.3620.3270.393
Tonghe509630.6410.3140.4420.3790.3340.427
Yichun507740.6540.3140.4160.3620.3240.403
Yilan508770.6360.3290.4200.3800.3220.425
Zhaozhou509500.7190.3860.5430.4210.3810.483
Longjiang507390.7460.4130.6740.3870.3800.566
Table 8. Calculation results of PCP values at various timescales.
Station NameStation
Number
Annual PCP (°)PCP in Growth Period (°)PCP in Seeding–Emergence
Stage (°)
PCP in Emergence–Jointing
Stage (°)
PCP in Tasseling–Milky
Stage (°)
PCP in Mature Stage (°)
Aihui50468199.5191.9199.2206.7152.0143.4
Anda50854198.8192.1199.2204.2145.9138.1
Baoqing50888201.9209.7176.1184.7185.2147.0
Beian50656200.2203.0186.6201.6142.9155.3
Beilin50853198.8188.5184.5199.6136.7174.0
Fujin50788200.9200.4170.3186.5152.4149.8
Fuyu50742200.2202.3189.6232.7144.3131.0
Harbin50953198.6191.8188.8211.0128.4183.1
Hailun50756199.0193.9183.2199.4164.1174.3
Huma50353199.1194.1196.3225.0147.6155.5
Hulin50983203.2203.0170.3174.0167.9153.5
Jixi50978200.9192.1180.9176.2172.9149.2
Jiamusi50873201.1197.2187.8175.5171.9153.1
Keshan50658200.0198.4188.8211.3139.6152.4
Mingshui50758198.9187.2185.2217.5146.0168.0
Mohe50136202.6203.8204.6219.3170.7151.1
Mudanjiang54094199.7204.7184.3199.7183.1176.6
Nenjiang50557200.7199.9184.5210.9161.4139.5
Qiqihar50745199.3193.0171.7209.6148.5161.3
Shangzhi50968199.5193.2174.8195.3159.5194.3
Suifenhe54096199.7193.3169.4190.6181.7141.9
Sunwu50564199.9191.7192.6189.6148.9127.2
Tailai50844196.8183.7178.1222.4155.4160.1
Tieli50862200.0196.7161.1192.3169.8168.3
Tonghe50963199.5193.9176.7198.0154.0160.5
Yichun50774200.7194.1171.8200.3162.5153.1
Yilan50877200.3199.1190.1168.8179.9170.0
Zhaozhou50950198.4189.8202.5207.4140.6169.8
Longjiang50739199.4192.0173.6242.0145.7143.2
Disclaimer/Publisher’s Note: The statements, opinions and data contained in all publications are solely those of the individual author(s) and contributor(s) and not of MDPI and/or the editor(s). MDPI and/or the editor(s) disclaim responsibility for any injury to people or property resulting from any ideas, methods, instructions or products referred to in the content.

