Article

The Interaction Effects of Drought–Flood Abrupt Alternation on Rice Yield and Dry Matter Partitioning

1
Farmland Irrigation Research Institute of CAAS, Xinxiang 453002, China
2
State Key Laboratory of Water Resource and Hydropower Engineering Science, Wuhan University, Wuhan 430072, China
*
Authors to whom correspondence should be addressed.
Agronomy 2023, 13(12), 2994; https://doi.org/10.3390/agronomy13122994
Submission received: 28 September 2023 / Revised: 2 December 2023 / Accepted: 4 December 2023 / Published: 5 December 2023

Abstract

:
The frequent occurrence of drought–flood abrupt alternation (DFAA) seriously affects crop yield. It is particularly important to explore the dynamics of material accumulation and distribution under DFAA stress to analyze the mechanism of yield formation. In this study, a bucket experiment with DFAA stress groups, drought control (DC) groups, flood control (FC) groups, and normal irrigation (CK) groups was set up from the jointing to the heading stage of rice to analyze the interaction effects of DFAA stress on rice yield and dry matter partitioning. The results showed that compared with the CK group, the average yield reduction rate of rice in the DFAA groups was 23.03%, and the number of grains per panicle, total grain number, thousand-seed mass, and seed setting rate decreased. Compared with the DC groups, the DFAA groups had a significant reduction in yield and its components during the flooding period. Compared with the FC groups, the DFAA groups showed a compensation phenomenon in the yield and its components during the drought period. From the end of DFAA stress to the harvest period, the root partitioning index (PI) of the DFAA groups decreased, the stem PI increased first and then decreased, the leaf PI decreased, and the panicle PI increased. The results showed that the rice leaves increased and thickened, and the stems thickened under DFAA conditions to enhance the ability to resist drought and flooding stress, but the panicle rate was reduced, the growth period of rice was delayed, and the redundant growth of stems and leaves was increased. It is suggested that the depth and duration of stagnant water storage during the flood period of DFAA should be controlled, and the transfer and supply of photosynthetic products to grains should be increased to avoid serious yield reductions. The research results provide a theoretical basis for the rational development of farmland DFAA mitigation measures.

1. Introduction

Drought–flood abrupt alternation (DFAA) is an environmental event that involves a rapid shift from drought to flooding. It is a serious threat to China’s water security and food security; in particular, it will have a serious impact on production in crop planting areas with relatively low drought and drainage standards [1,2,3,4]. In 2019, the “Liqima” DFAA event in Shandong Province affected an area of 46,300 hectares of crops and resulted in CNY 404 million of agricultural economic losses. In July 2021, Henan Province experienced DFAA, which has been rare in history. The affected area of crops was 75,000 hectares, the severely affected area was 25,200 hectares, the area of no harvest was 4700 hectares, and the agricultural economic loss was CNY 542 million. Rice is the grain crop with the highest yield per unit area and the highest total yield in China. The national rice planting area accounts for approximately 27.5% of the total crop planting area. The average yield per unit area of rice is approximately 35.7% higher than that of other grain crops, and the rice yield contributes more than 37.3% of the total grain yield [5]. Many climatic disasters, such as droughts and floods, affect the main rice production areas. DFAA mostly occurs from mid-to-late July to mid-to-late August, which coincides with the jointing to flowering stage of rice. Thus, the growth and yield of rice are highly susceptible to DFAA stress.
It is very important to study the superposition effect of combined drought and flood stress to explore the interaction effects of DFAA disasters on rice [6,7,8]. Studies have shown that compared with the normal group, the occurrence of DFAA will generally reduce crop yield. The yield reduction rate of the DFAA group at the tillering stage was between 20% and 30%, and the yield reduction rate of early rice at the panicle differentiation stage was between 20% and 50%. The yield reduction degree of late rice at the panicle differentiation stage is slightly lower than that of early rice, and the yield reduction rate is approximately 20% [9,10,11,12]. Different degrees of DFAA have different effects on yield, and for both early rice and late rice, the yield of combined heavy drought and heavy flood decreased the most, but the interaction between the early drought stage and late flooding stage of DFAA did not result in a unified conclusion. Some studies have found that compared with single-drought and single-flood conditions, the impact of DFAA stress on yield is more serious. The overall yield reduction rate was reported as follows: DFAA group > single-drought group > single-flood group > normal group [10,11,12]. However, some studies have suggested that compared with the single-drought and -flood groups, drought stress in the early stage of DFAA has a certain compensation effect on crop yield [13]. The grain yield of rice is determined by the total dry matter production and its partitioning to the grain. It is particularly important to explore the dynamics of material accumulation, partitioning and migration under DFAA conditions to analyze the mechanism of yield formation.
The process of dry matter accumulation and transport in rice is easily affected by drought and flooding stress. A change in the soil moisture content will change the synergy and competition between different organs during the crop growth cycle. Studies have shown that moderate drought stress effectively promotes the export of carbohydrates stored in stems, increases the grain transport rate, and contributes more than 30% to grain yield [14], but this does not compensate for the loss of photosynthetic assimilation [15,16,17,18]. The translocation rate and conversion rate of stem and sheath matter under severe water stress were higher than those under normal irrigation conditions [19]. Flooding stress can cause changes in the morphological structure of plants, mainly manifested as dry matter reduction, growth retardation, root thinning, root activity decline, etc. [20]. However, some studies suggest that flooding at the jointing–booting stage increases plant dry matter quality [21,22]. Another study pointed out that with the extension of flooding time, dry matter accumulation showed a trend of decreasing first and then increasing [23]. The process of dry matter accumulation and distribution of rice under DFAA is different from that under drought or flood stress alone. The results showed that [24] when DFAA occurred in the panicle differentiation stage, drought and flood stress had a superimposed reduction effect on the total dry matter accumulation. The combination of severe drought and severe flood treatment had the most serious effect on the total dry matter quality. Drought and flood stress caused a decrease in stem and leaf dry matter quality, but flood damage to leaves was less severe. Severe drought in the early stage of DFAA had a greater effect on the dry matter quality of panicles than severe flooding in the later stage of DFAA [24]. When DFAA occurred at the jointing stage, the dry matter accumulation decreased, and the reduction rate was between 10% (light drought + flood) and 35% (heavy drought + heavy flood). From the perspective of dry matter partitioning, the decrease in total dry matter was related to the decrease in stem and sheath dry matter. The decrease in the export rate of stem and sheath storage material and the conversion rate to grain led to a decrease in the harvest index [25]. However, some studies have suggested that DFAA reduced the accumulation of photosynthetic assimilates in various organs at subsequent growth stages but increased the partitioning ratio of photosynthetic assimilates in rice and reduced the growth redundancy of photosynthetic assimilates in stems and leaves [26]. Therefore, the compensation or reduction effect of drought stress in the early stage of DFAA and flood stress in the later stage of DFAA on rice yield and dry matter partitioning needs to be further explored.
In this study, the dynamic change process of dry matter partitioning in rice under DFAA stress was analyzed. By comparing the drought groups and flood groups, the compensation or reduction effect of early drought stress of DFAA and later flood stress of DFAA on rice yield and dry matter distribution was obtained. The research results provide a theoretical basis for the rational development of farmland DFAA mitigation measures.

2. Materials and Methods

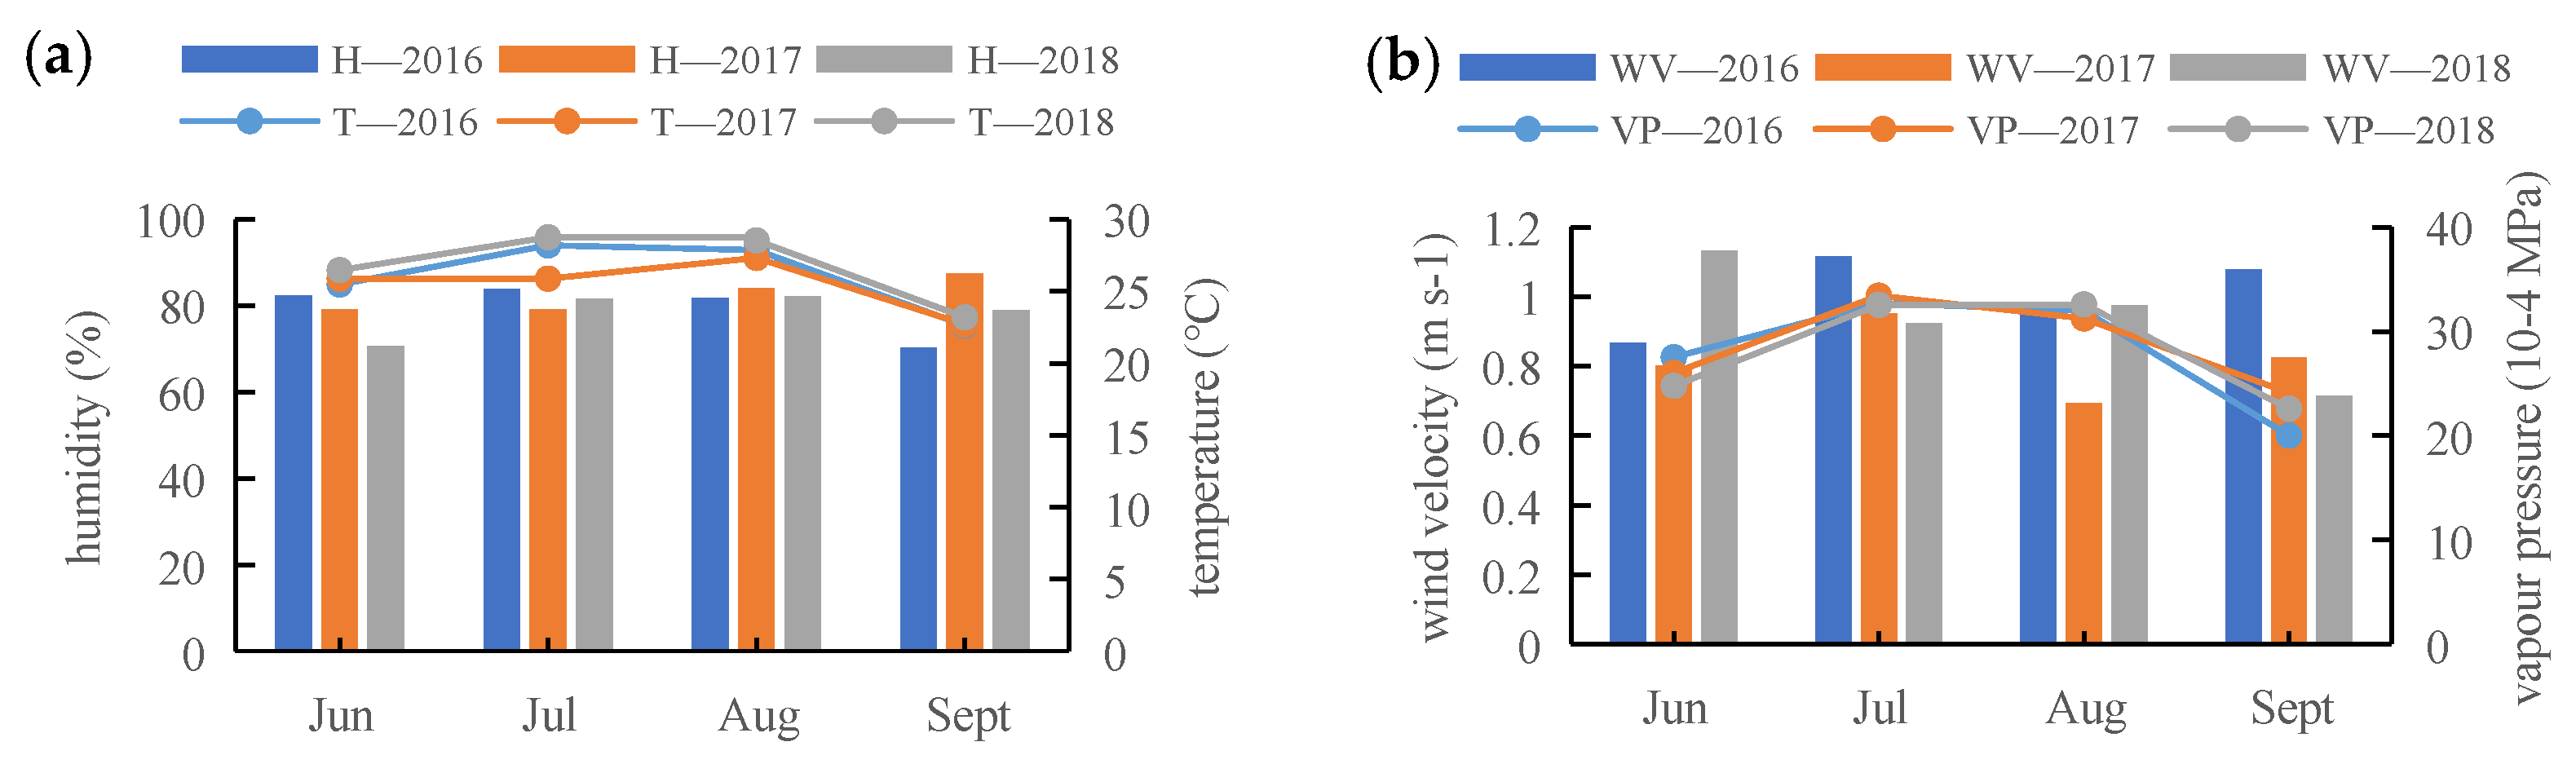
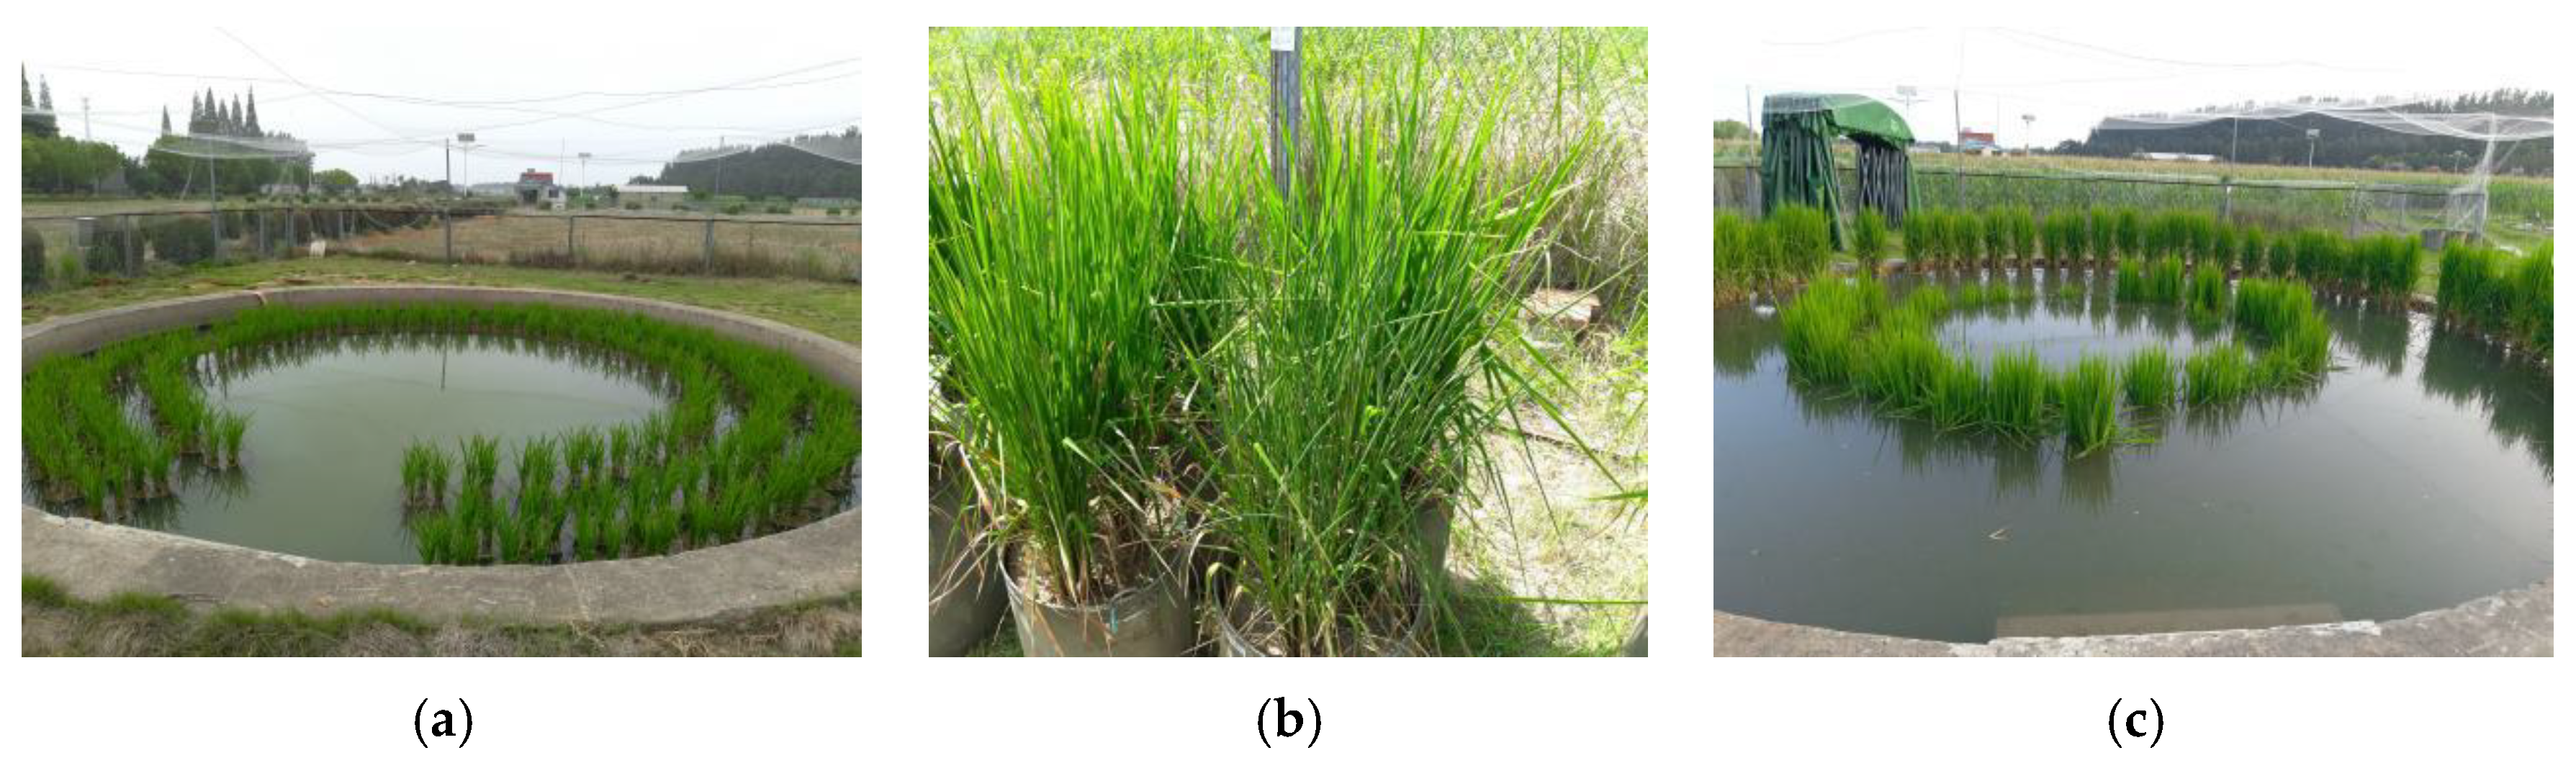
2.1. Experimental Setting

The test site is located at the Xinmaqiao Agricultural and Water Comprehensive Test Station (117°22′ E, 33°09′ N) (Bengbu, China), in the subtropical and tropical transitional zone. Due to the specific geographical location in the mid-latitude zone, the climate in this area is clearly transitional. The annual average temperature is 14.9 °C, the rainfall is 871 mm, the sunshine duration is 2170 h, and the average altitude is 16.0–22.5 m. The relative humidity, air temperature, wind speed and water vapor pressure were roughly the same during the test period (June to September 2016–2018) (Figure 1). In this study, the dominant local middle-season rice variety, II You 898, cultivated by the China Rice Research Institute (Hangzhou, China), was selected, which is sensitive to drought and flooding stress. The sowing date was approximately 20 May every year. The bucket test method was used in this study. The inner diameter of the bucket was 35 cm, and its height was 45 cm. The bucket was placed in a large water storage pit. A water depth of 2–3 cm was maintained to ensure the normal growth of rice (Figure 2a). During the dry period, the bucket was removed from the test pit, a rain shelter was set up, and the soil moisture of the bucket was controlled by daily weighing (Figure 2b). During the flooding period, the bucket was moved to different depths of the pit to simulate flooding (Figure 2c). The planting density was 3 holes per bucket and 2 plants per hole. The soil texture was medium loam, and the soil bulk density was 1.24 g/cm3. The field moisture capacity of the soil was 28%, and the saturated moisture content was 42.9%. The soil physical and chemical properties were as follows: pH: 7.79, available potassium: 93.91 mg/kg, available phosphorus: 16.10 mg/kg, organic matter: 8.59 g/kg, total nitrogen: 632 mg/kg, and alkali-hydrolysable nitrogen: 92.11 mg/kg. Urea (3.0 g/buckets) and compound fertilizer (7.2 g/buckets) were applied as basal fertilizers.
Nine orthogonal treatments (DFAA1-DFAA9) without considering the interaction between drought and flood stress and one normal irrigation condition (CK) were set up in the experiment. In addition, the drought groups (DC1-DC9) and the flood groups (FC1-FC9) were supplemented to analyze the compensation or reduction effect of the early drought stress and the latter flood stress of DFAA. Three degrees of drought (50%, 60%, and 70% of field capacity) and three drought durations (5, 10, 15 days) were set up in the drought stage of the DFAA groups, and three flood depths (50%, 75%, and 100% of plant height) and three flooding durations (5, 7, 9 days) were set up in the flood stage. Supplementary Figure S1 is the experimental design. The drought treatment began at the jointing stage (approximately July 20). The dry matter quality of the roots, stems, leaves, and panicles was measured at the end of DFAA flooding, after 10 days of rewatering, after 20 days of rewatering, and at harvest. Yield was measured at harvest. In view of the limitation of the flooded pool volume and the test bucket number, the dry matter quality of the severe-drought-stress groups (DFAA7-9, DC7-9, and FC7-9) was measured in 2016, the dry matter quality of the moderate-drought-stress groups (DFAA4-6, DC4-6, and FC4-6) was measured in 2017, and the dry matter quality of the light-drought-stress groups (DFAA1-3, DC1-3, and FC1-3) was measured in 2018. Each group had three replicates. The parameters of each treatment group are shown in Table 1. According to the degree of yellow maturity of rice in different treatments, the harvest was carried out in batches. The growth period index of rice is shown in Table 2.

2.2. Water Control Method

In a growth period without drought and flood stress, rice is normally irrigated to ensure that the rice is not affected by drought, and a canopy is used to ensure that the rice is not affected by rainfall. During the period of drought treatment, the weight of each bucket in the experimental groups was measured at 8:00 a.m. and 6:00 p.m. every day, and the difference between the two bucket weights indicated evaporation during the day. The difference between the bucket weight in the evening of one day and the bucket weight the following morning indicated the overnight evaporation amount. To control the corresponding degree of drought, it was necessary to add water to the measuring bucket so that it was in accordance with the moisture content requirement when the bucket was weighed in the morning and evening. After reaching the corresponding drought time, the buckets in the DFAA groups were moved into the flooded pool for the flooding treatment. The depth of the water layer in the flooded pool was observed at 9:00 a.m. every day, and a certain amount of water was added to allow the water level of the flooded pool to flood the bucket at different depths. In the case of rainy weather, according to the amount of precipitation, the depth of the submerged pool was controlled to meet the requirements of the flooding treatment. In addition to different water control conditions in each treatment group, other agronomic measures were based on local farming methods, and pests and weeds were strictly controlled during the whole growth period.

2.3. Determination of Dry Matter Quality and Yield

The roots, stems, leaves, and panicles were sampled at four stages: the flooding end of DFAA, after 10 days of rewatering, after 20 days of rewatering, and at harvest. The separated roots, stems, leaves and panicles were placed in an oven at 105 °C for 30 min and then dried to constant weight at 80 °C. Afterward, they were weighed with an electronic balance with an accuracy of 0.01 g.
After the rice matured, the field was dried for one week, and the three groups of repeated test buckets for each treatment were harvested. Two days of sunny weather were selected for drying, and then the number of panicles, the number of grains per panicle, the total number of grains, the thousand-seed mass, and the yield of each test bucket were examined. Among these measurements, the panicle number, total grain number, thousand-seed mass and yield were all in per bucket units.

2.4. Data Processing and Statistical Analysis

(1)
Relative rate of yield and yield components
R C K = Y D F A A Y C K Y C K
R D C = Y D F A A Y D C Y D C
R F C = Y D F A A Y F C Y F C
In the formula above, RCK (rate relative to the CK group), RDC (rate relative to DC groups), and RFC (rate relative to FC groups) are the increase or decrease rate of yield and yield components of DFAA groups compared with the normal irrigation group, drought groups, and flood groups, respectively, unit %; YDFAA, YDC, YFC, and YCK are the yield and yield components of the DFAA group, drought group, flood group, and the normal irrigation group, respectively, in units of g.
(2)
Partitioning index of roots, stems, leaves, and panicles
P I = D M p a r t D M t o t a l
In the formula above, PI is the partition index of the root, leaf, stem, and panicle, DMpart is the dry matter quality of the root, leaf, stem, and panicle, and DMtotal is the total dry matter quality of the rice.

3. Results

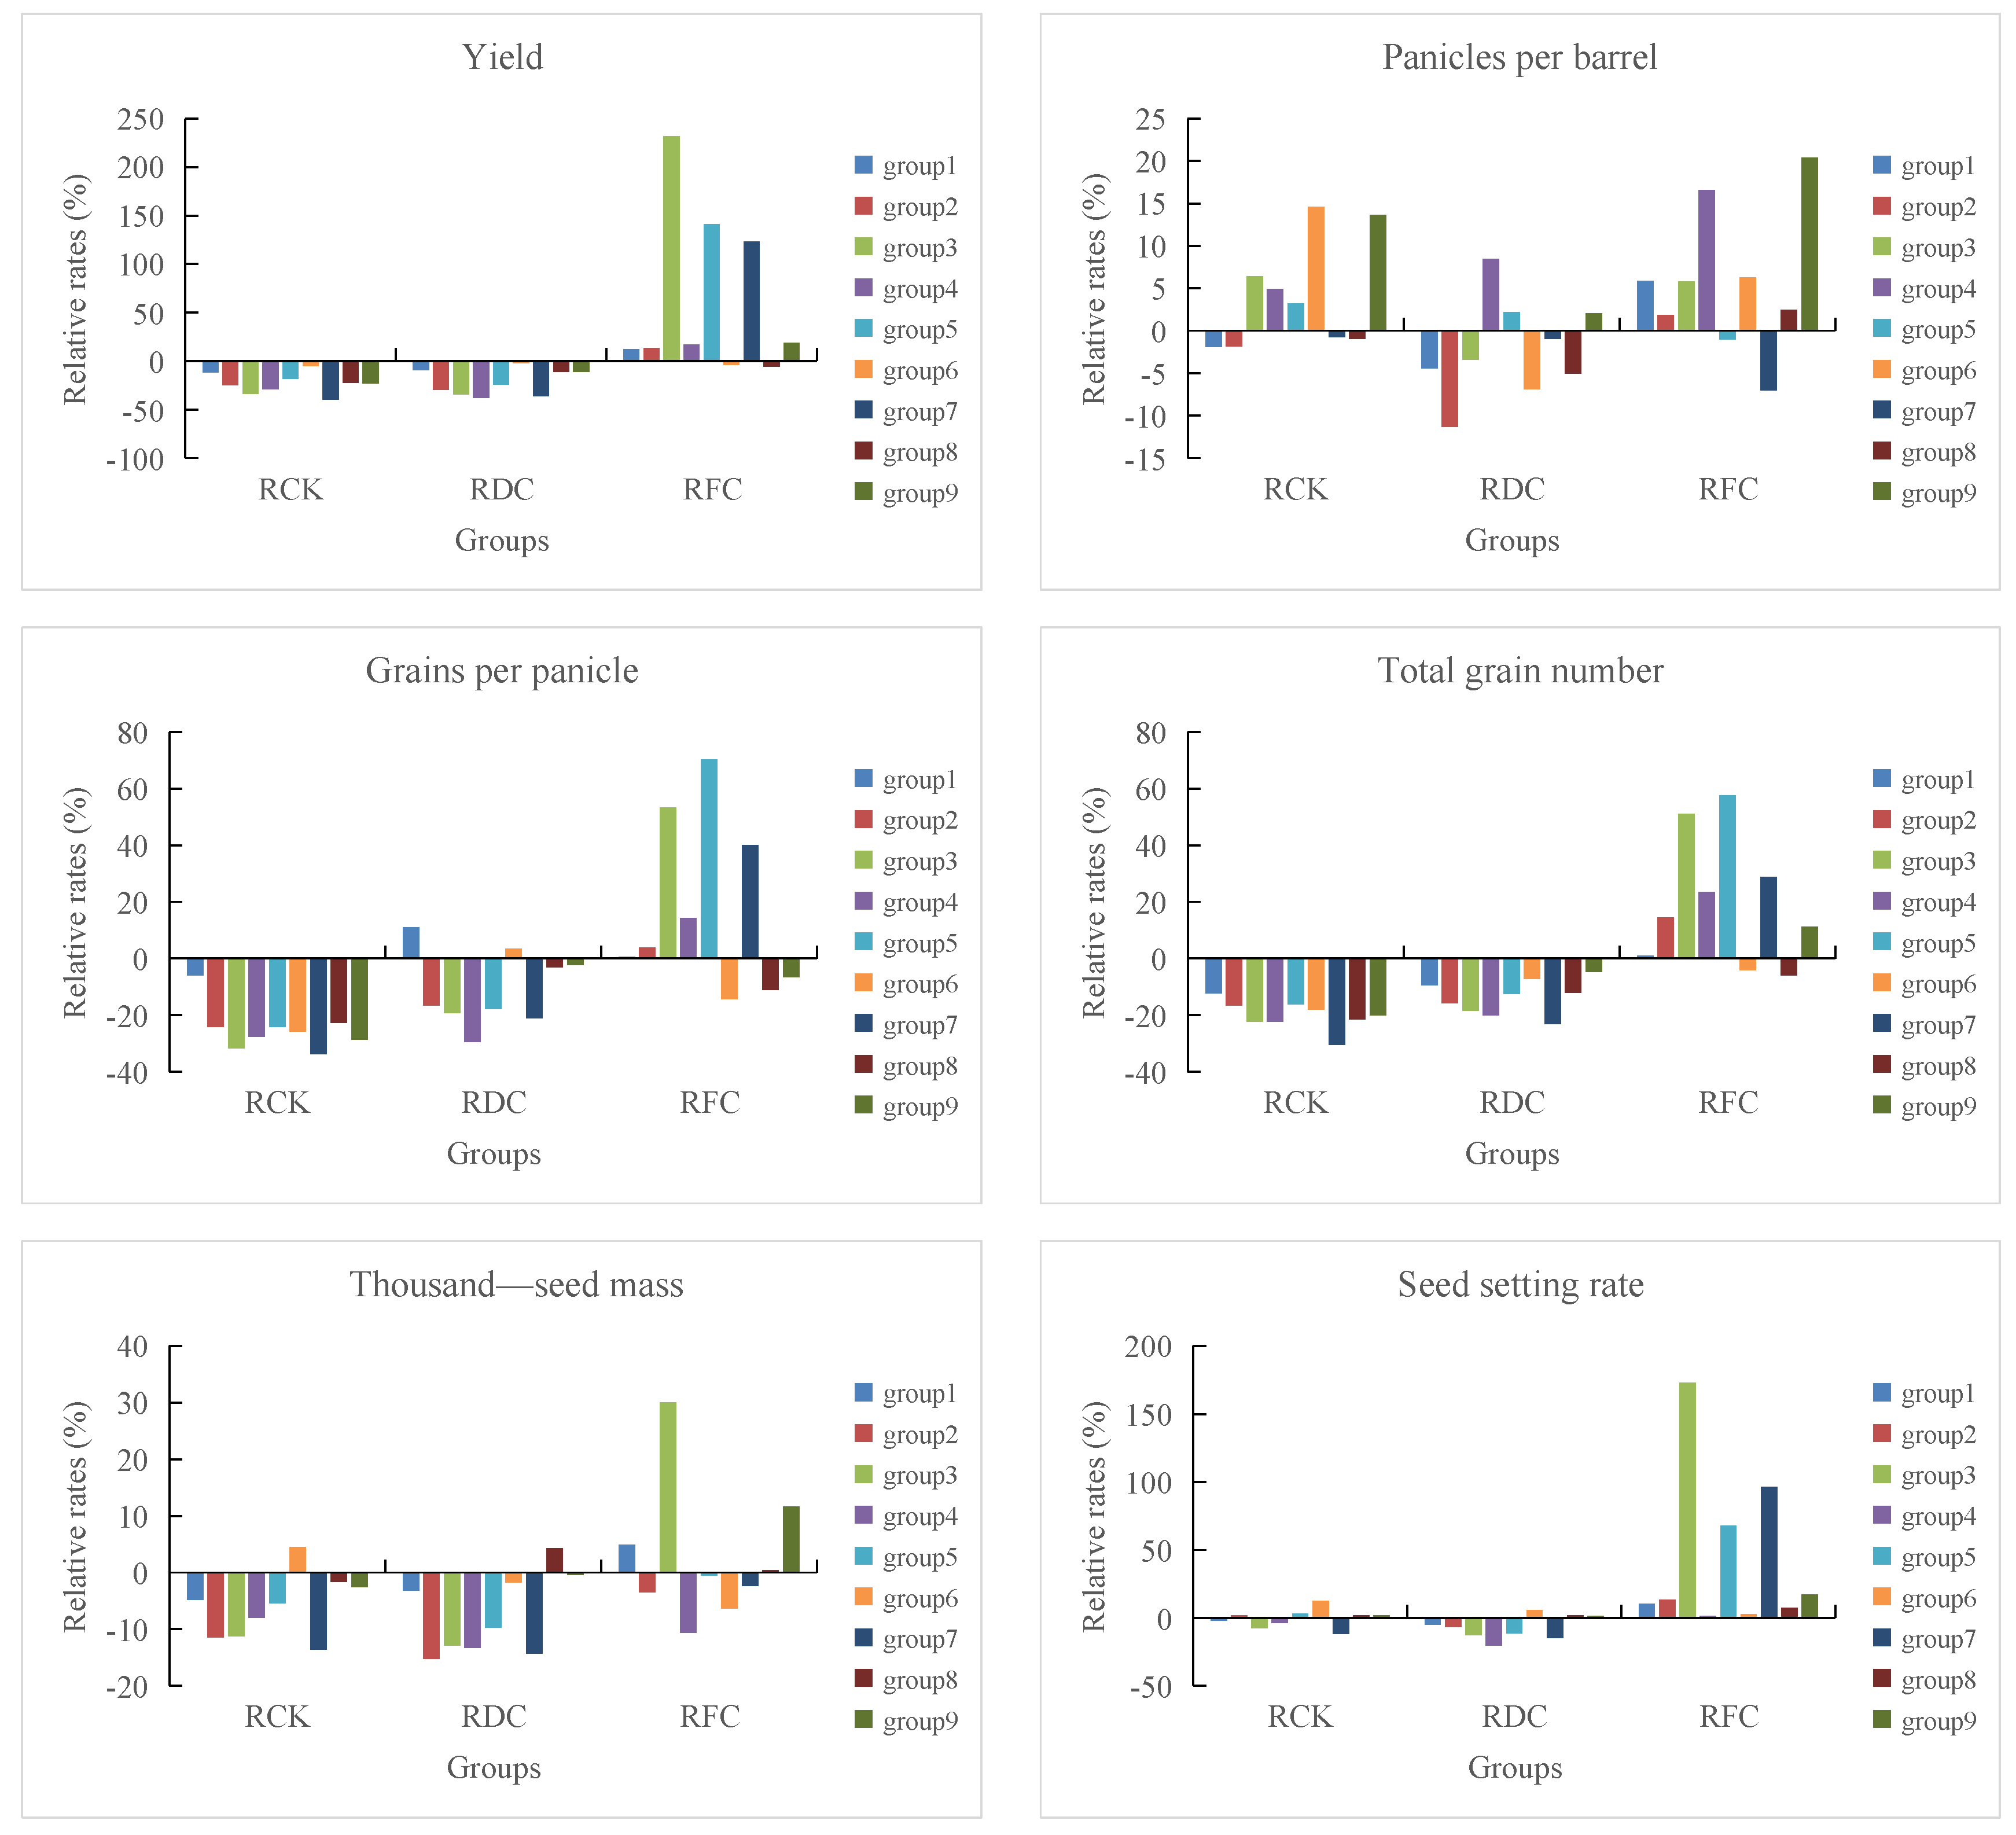
3.1. Effects of DFAA Stress on Rice Yield

The RCK calculation results (Figure 3) show that the yield of the DFAA groups was lower than that of the normal group, and the yield reduction range was 5.1–39.65%. The average yield reduction rate of DFAA1-DFAA9 was 23.03%, among which DFAA6 had the lowest yield reduction rate of 5.1%, followed by DFAA1, with a yield reduction rate of 11.65%. The yield reduction of DFAA7 and DFAA3 was more serious, with yield reduction rates higher than 30%. This result showed that short- and medium-term (5 days, 7 days) mild flooding (submerged depth of 50% of the plant height) had little effect on yield, while medium- and long-term (7 days, 9 days) heavy flooding (submerged top flooding) had an adverse effect on yield. According to the results of RDC, compared with the drought groups, late flooding had an obvious yield reduction effect, with an average yield reduction rate of 21.66%. Among these treatments, the yield reduction of DFAA2, DFAA3, DFAA4 and DFAA7 exceeded 30%, indicating that medium- and long-term (7 days, 9 days) moderate flooding (submerged depth of 75% of the plant height) and heavy flooding (submerged top flooding) aggravated the yield reduction effect. The RFC results showed that compared with the flood groups, early drought had a more obvious yield compensatory effect, and the yield of the DFAA1-DFAA9 groups increased by 60.84% on average. The yield compensation rates of DFAA3, DFAA5 and DFAA7 exceeded 100%, and the yield compensation rate of DFAA3 even exceeded 200%, indicating that early drought stress improved the ability of rice to resist severe flooding (submergence), especially under long-term (9 days) heavy flooding (submergence).
According to the calculation results of the yield component RCK, compared with the normal group, the number of panicles in the DFAA groups increased by 4.14% on average, and the number of grains per panicle, total grains, thousand-seed mass and seed setting rate decreased by 25.03%, 19.98%, 6.04% and 0.41% on average, respectively. Among these variables, the panicle number of DFAA6 increased the most, at 14.57%; the reductions in the grain number per panicle and total grain number of DFAA1 were the smallest, at 6.09% and 12.39%, respectively. The thousand-seed mass and seed setting rate of DFAA6 increased by 4.48% and 12.61%, respectively. Therefore, the increase in panicle number and grain weight and the minimum reduction in grain number were the main reasons for the minimum yield loss in the DFAA6 and DFAA1 groups, respectively. The results of RDC and RFC showed that the number of panicles, the number of grains per panicle, the total number of grains, the thousand-seed mass and the seed setting rate were reduced by late flooding stress. The average RDC values of the DFAA groups were −2.15%, −10.62%, −13.76%, −7.4% and −7.05%. In the early stage of drought stress, the yield components were compensated. The average RFC values of the DFAA groups were 5.69%, 16.73%, 19.72%, 2.64%, and 43.24%, respectively. The total number of grains in the DFAA1-DFAA9 groups showed consistent reductions in late flooding stress; early drought stress increased the seed setting rate, and early drought had a significant compensatory effect on the number of grains per panicle, total grains and seed setting rate.

3.2. Variance and Range Analyses of the Four Factors of Dfaa Stress

Variance consistency analysis of the four factors of DFAA stress from 2016 to 2018 was carried out, and the results are shown in Table 3. Table 3 shows that rice yield was affected by drought and flood stress. The number of grains per panicle was significantly affected by the flooding degree and flood time. The total grain number and seed setting rate were significantly affected by the degree of flooding. The panicle number and thousand-seed mass had interannual differences under drought and flood stress and did not show a consistent effect. Therefore, flooding is more likely than drought to have an adverse aftereffect on yield and its composition. The flooding experiment was set up around 2 August, and the start and end of rewatering (9 August to 29 August) were at the critical period of heading and grain filling. The formation of crop yield requires a large amount of photosynthetic products to be transferred to the grain. The dry matter distribution strategy of the plants during this period directly affects the final yield of the crop.
Range analysis of the four factors of DFAA stress from 2016 to 2018 determined the drought and flood factors that had the greatest impact on rice yield and the optimal combination with the least impact. The results are shown in Figure 4. The rice yield and total grain number were greatly affected by the degree of flooding, and the maximum values were 34.773 g and 1268.666, respectively. The panicle number was greatly affected by drought time, and the maximum value was 9.333. The thousand-seed mass was greatly affected by the degree of drought, and the maximum value was 3.073 g. There were interannual differences in the grain number per panicle and seed setting rate, and no consistent effect was shown. The combination of medium- and long-term (10 days, 15 days) light and moderate drought (60% and 70% of field capacity) stress and short-term (5 days) nonheavy flooding (nonsubmerged flooding) stress had the smallest effect on yield and total grain number. Nonheavy drought (60% and 70% of field capacity) stress and short- and medium-term (5 days, 7 days) moderate flooding (submerged depth of 75% of the plant height) had the smallest effect on panicle number. Nonheavy drought (60%, 70% of field capacity) stress and short-term (5 days) light flooding (submerged depth of 50% of the plant height) had the smallest effect on the number of grains per panicle; medium- and long-term (10 days, 15 days) nonheavy drought (60%, 70% of field capacity) stress and short-term (5 days, 7 days) light flooding (submerged depth of 50% of the plant height) had the smallest effect on the thousand-seed mass. Medium-term (10 days) nonsevere drought (60%, 70% of field capacity) stress and medium- and long-term (10 days, 15 days) flooding had the smallest effect on the seed setting rate. Therefore, early nonsevere drought (60%, 70% of field capacity) stress was beneficial for rice to adapt to DFAA stress with minimal yield loss.

3.3. Effect of DFAA Stress on the Rice Partitioning Index

The effect of DFAA stress on the rice partition index is shown in Figure 5. Figure 5 shows that the average root partition index of the DFAA groups was close to that of the CK group, DC groups and FC groups and showed a decreasing trend from the end of DFAA stress until harvest (0.15→0.09→0.09→0.05). The root partition index of the DFAA1-DFAA3 groups (70% of field capacity) in the rewatering period (rewatering for 10 days: 0.1–0.13; rewatering for 20 days: 0.13–0.14) was much higher than that of the CK group, DC groups and FC groups, indicating that early mild drought stress was more conducive to root recovery during the rewatering period. To ensure the supply of mineral nutrients and water, the plants expanded their root absorption surface area, and the photosynthetic assimilates were more inclined to be allocated to the growth and development of root hairs. The average value of the stem partition index in the DFAA group first increased and then decreased (0.53→0.62→0.59→0.48), and the average value of the leaf partition index decreased (0.31→0.26→0.21→0.13). The stem partition index (rewatering for 20 days: 0.59–0.65; harvesting time: 0.54–0.57) and leaf partition index (the end of DFAA: 0.32–0.36; rewatering for 10 days: 0.28–0.34; rewatering for 20 d: 0.22–0.28; harvesting time: 0.09–0.1) of the DFAA7-DFAA9 groups (50% of field capacity) were higher than those of the CK group, DC groups and FC groups, indicating that DFAA stress delayed the growth period of rice so that the rate of vegetative growth in the rewatering stage was significantly higher than that of reproductive growth, and early severe drought stress accelerated the redundant growth of stems and leaves. Compared with the DC groups and the FC groups, the average leaf partition index of the DC groups was 0.27, which was slightly higher than that of the FC groups (0.26), and the average stem partition index of the FC groups was 0.58, which was slightly higher than the average value of the DC groups (0.57), indicating that rice made adaptive adjustments to cope with drought and flood stress. For example, the increase or thickening of leaves enhances photosynthesis, and the increase in photosynthetic substances can provide more energy for rice to resist drought stress. Similarly, a strong stem is also conducive to rice resistance to damage from flooding stress.
The average panicle partition index of the DFAA groups showed an increasing trend (0.005→0.04→0.11→0.36). After the end of DFAA, only the DFAA1 and DFAA2 groups produced panicles, and the panicle partition indices were 0.008 and 0.04, respectively, indicating that light drought (70% of field capacity) in the short and medium term (5 days, 7 days) was beneficial to the formation of dry matter for partitioning. After 10 days of rewatering, all groups except the DFAA5, DFAA7 and DFAA9 groups showed earing phenomena. Among these groups, the partition ratio of panicle dry matter in the DFAA1 and DFAA6 groups was relatively high, at 0.11 and 0.08, respectively, which was close to the CK group partition index of 0.12, indicating that early nonsevere drought stress (60% and 70% of field capacity) optimized the partition direction of total dry matter in rice to reduce the adverse effects of light flooding stress (submerged depth of 50% of the plant height). After 20 d of rewatering, all treatment groups had panicles, and the panicle partition index of DFAA6 (0.26) was relatively high among the DFAA groups, which was close to the partition index of the CK group (0.31), indicating that under the stress of long-term (15 days) moderate drought (60% field water-holding capacity) and medium-term (7 days) light flooding (submerged depth of 50% of the plant height), rice optimized the partition index of its roots, stems, leaves and panicles to adapt to the adverse effects of DFAA superposition. At harvest, the panicle partition index of DFAA6 (0.50) was relatively high among the DFAA groups and exceeded the average panicle partition index of the CK group (0.45), indicating that the dry matter partition ratio of rice under the combination of drought and flooding was optimal. The average panicle partition index of the DC groups and the FC groups (0.08, 0.09) was lower than the average value of the CK group (0.12) and higher than the average value of the DFAA groups (0.04) after 10 days of rewatering. The average panicle partition index of the DC groups and the FC groups (0.19, 0.17) was still between that of the CK group (0.31) and the DFAA groups (0.11) after rewatering for 20 days, so drought and flood stress resulted in a superimposed reduction in rice in the rewatering period. At harvest, the average panicle partition index of the DFAA groups (0.36) was lower than that of the DC groups (0.44) and higher than that of the FC groups (0.28), indicating that there was a compensatory effect between drought stress and flood stress in the DFAA groups.

4. Discussion

4.1. Interaction Effect of DFAA on Rice Yield

Abnormal global climate change has led to frequent DFAA occurrence, which seriously threatens China’s water security and food security. An urgent problem to be solved in agricultural production is to determine the impact of DFAA on rice yield and to formulate reasonable measures for farmland disaster reduction to reduce yield loss. A study [27] showed that the yield reduction rate of DFAA at the jointing stage was between 20% and 50% and that the yield reduction of the severe drought and severe flood group was the greatest. From the perspective of yield composition, some studies have suggested that the main reason for yield reduction is a reduction in the number of effective panicles and the number of grains per panicle, and some studies have suggested that it is related to a decrease in the seed setting rate [28,29]. In this study, the yield reduction range of DFAA was 5.1–39.65%, and the reduction in grain number and grain weight was the main factor influencing yield reduction. The results of this study showed that compared with the flood groups, early drought stress increased the rice yield under flooding conditions, with an average increase of 60.84%, and early drought had a significant compensatory effect on the number of grains per panicle, total grains and seed setting rate under heavy flooding stress. The reason may be that flooding stress damaged the photosynthetic capacity of rice leaves, such as reducing the leaf light quantum efficiency, maximum photosynthetic rate and maximum photochemical efficiency [30,31]. A decrease in the photosynthetic capacity means that the demand for CO2 in rice leaves is weakened, which in turn leads to lower stomatal conductance [32], making it impossible for sufficient carbon assimilation at maturity [33,34], which in turn leads to serious yield reduction. Notably, the period of DFAA occurrence is the key period for crop yield formation [30]. In this study, the occurrence time of flooding was approximately August 2, and the beginning and end of rewatering (August 9 to August 29) was the critical period of flowering and grain filling. Therefore, flooding was more likely to have adverse aftereffects on yield and its composition.

4.2. Effects of DFAA Interaction on the Dry Matter Partitioning of Rice

Under DFAA conditions, crops are affected by the dual stress factors of drought and flooding. There is an effect of the interaction between different drought and flood stress combinations on the process of dry matter partitioning. The dry matter partitioning pattern adopted by rice for survival and production during the DFAA period will affect the final yield. Previous studies have shown that a heavy drought and heavy flood treatment of early and late rice had the greatest impact on the dry matter quality of panicles and total dry matter quality at the maturity stage of rice, showing a superimposed damage effect [12,24,25]. Drought and flooding stress can cause a reduction in the dry matter of stems and leaves. Early severe drought is more harmful to the dry matter of panicles than late severe flooding, while flood stress is less harmful to the dry matter quality of rice leaves than drought and DFAA stress [24,25]. The results obtained in this study indicate that DFAA stress caused more of the total dry matter to be distributed to the stems and leaves. By comparing the drought groups with the flood groups, it was found that the leaf dry matter partition ratio was slightly higher under drought stress in the early stage of DFAA, and the stem dry matter was slightly higher under flooding stress in the later stage of DFAA. In the rewatering period, the aftereffect of drought and flood stress had a superimposed reduction on the panicle partition index, while the drought stress from the end of the rewatering period to harvest had a compensatory aftereffect. In the flooded environment, the concentrations of ethylene and gibberellin in rice plants increase, which stimulates cell division and elongation [22,35] and then promotes the elongation of leaf sheaths, leaves, and stem nodes so that the plant has more contact area with the air to maintain respiration [36,37,38]. However, this “avoidance” strategy of elongating stem nodes or leaves requires a considerable amount of carbon [39], which reduces the dry matter partitioning index of panicles [40,41]. According to the research, in the period of DFAA, rice adopts the survival strategy of increasing and thickening its leaves and stems, regulating photosynthesis to accumulate energy to resist flooding stress. Rice uses more of the limited carbon assimilates for the growth of stems and leaves rather than the formation of yield, which is the root cause of yield reduction at the jointing–booting stage.

5. Conclusions

The purpose of this paper was to reveal the effect of the interaction between the early drought stress of drought–flood abrupt alternation (DFAA) and the later flood stress of drought–flood abrupt alternation (DFAA) on rice yield and dry matter quality. The yield of the DFAA groups was lower than that of the normal group, and short-term and medium-term light floods had the least impact on the yield, while medium-term and long-term heavy floods had an adverse impact on the yield. Later flooding had a significant reduction effect on yield and yield components. Early drought of DFAA reduced the yield reduction caused by later flooding and had a compensatory effect on the grain number per panicle, total grain number and seed setting rate under severe flooding stress. Under DFAA stress, rice allocates more dry matter to stems and leaves for survival and production and enhances flooding tolerance by the “avoidance” strategy of elongating stem nodes or leaves. Therefore, it is necessary to control the depth and duration of water storage in the DFAA period and adjust the dry matter allocation strategy of rice during the flooding period through horticultural measures or manual intervention to increase the transfer and supply of photosynthetic products to grains and ultimately avoid serious yield reductions. The research results provide a theoretical basis for the rational development of farmland DFAA mitigation measures.

Supplementary Materials

The following supporting information can be downloaded at: https://www.mdpi.com/article/10.3390/agronomy13122994/s1, Figure S1: Experimental setting.

Author Contributions

Conceptualization, Y.G. and T.H.; Methodology, Y.G.; Validation, P.L.; Writing—original draft, Y.G.; Writing—review & editing, X.Q.; Funding acquisition, Y.G. and P.L. All authors have read and agreed to the published version of the manuscript.

Funding

This research was funded by the National Natural Science Foundation of China (No. 52309073), Henan Province Key R&D and Promotion Special Project (No. 222102110385), and the Agricultural Science and Technology Innovation Program of Chinese Academy of Agricultural Sciences (No. CAAS-ASTIP).

Data Availability Statement

All data generated or analyzed during this study are included in this published article and Supplementary Figure S1.

Conflicts of Interest

The authors declare that there are no conflict of interest. All authors declare that the described work is original research that has not been published previously and is not under consideration for publication elsewhere, in whole or in part.

Abbreviations

DFAADrought–flood abrupt alternation
DCDrought control
FCFlood control
CKNormal irrigation
RCKRate relative to the CK group
RDCRate relative to DC groups
RFCRate relative to FC groups

References

  1. Bi, W.X.; Weng, B.S.; Wang, X.; Yan, D.H.; Wang, M.K.; Dong, N.P. Research progress of sudden turn of drought and flood based on knowledge map. Water Resour. Prot. 2021, 37, 40–48. [Google Scholar]
  2. Wang, M.K.; Bi, W.X.; Weng, B.S.; Yu, Z.L.; Xu, T. Review on impact from drought-flood abrupt alternation on crop growth and yield. Water Resour. Hydropower Eng. 2019, 50, 189–196. [Google Scholar]
  3. Yan, D.H.; Wu, D.; Huang, R.; Wang, L.N.; Yang, G.Y. Drought evolution characteristics and precipitation intensity changes during alternating dry-wet changes in the Huang-Huai-Hai River basin. Hydrol. Earth Syst. Sci. 2013, 17, 2859–2871. [Google Scholar] [CrossRef]
  4. Li, X.H.; Ye, X.C. Spatiotemporal characteristics of dry-wet abrupt transition based on precipitation in Poyang Lake Basin, China. Water 2015, 7, 1943–1958. [Google Scholar] [CrossRef]
  5. Statistics Bureau of the People’s Republic of China. China Statistical Yearbook; China Statistical Publishing House: Beijing, China, 2022. [Google Scholar]
  6. Gao, Y.; Hu, T.S.; Wang, Q.; Yuan, H.W.; Yang, J.W. Effect of Drought-Flood Abrupt Alternation on Rice Yield and Yield Components. Crop Sci. 2019, 58, 1–13. [Google Scholar] [CrossRef]
  7. Gao, Y.; Hu, T.S.; Yuan, H.W.; Yang, J.W. Analysis on yield reduced law of rice in Huaibei plain under drought-flood abrupt alternation. Trans. Chin. Soc. Agric. Eng. 2017, 33, 128–136. [Google Scholar]
  8. Akhtar, I.; Nazir, N. Effect of waterlogging and drought stress in plants. Int. J. Water Resour. Environ. Sci. 2013, 2, 34–40. [Google Scholar]
  9. Xiong, Q.Q.; Shen, T.H.; Zhong, L.; Chen, X.R.; Zhu, C.L.; Peng, X.S.; He, H.H. Effect of a sudden change from drought to waterlogging at the tilleringor young spiking stage on yield and grain of hybrid rice. J. Irrig. Drain. 2017, 36, 39–45. [Google Scholar]
  10. Deng, Y.; Zhong, L.; Chen, X.R.; Zhu, C.L.; Peng, X.S.; He, X.P.; Fu, J.R.; Bian, J.M.; Hu, L.F.; Ou Yang, L.J.; et al. Effects of drought-floods abrupt alternation on physiological and yield characteristics in super hybrid early rice during panicle differentiation stage. J. Nucl. Agric. Sci. 2017, 31, 768–776. [Google Scholar]
  11. Xiong, Q.Q.; Zhong, L.; Shen, T.H.; Chen, X.R.; Zhu, C.L.; Peng, X.S.; Fu, J.R.; He, H.H. Effects of drought-floods abrupt alternation during panicle differentiation stage on matter accumulation and yield formation in double-season super hybrid rice. Chin. J. Agrometeorol. 2017, 38, 597–608. [Google Scholar]
  12. Guo, X.P.; Yang, S.; Wang, Z.C.; Yang, J.H.; Li, X.P. Effects of Alternative stress of drought and waterlogging on rice yield and quality. J. Irrig. Drain. 2015, 34, 13–16. [Google Scholar]
  13. Huang, J.; Hu, T.S.; Yasir, M.; Gao, Y.; Chen, C.; Zhu, R.; Wang, X.; Yuan, H.; Yang, J. Root growth dynamics and yield responses of rice (Oryza sativa L.) under drought–flood abrupt alternating conditions. Environ. Exp. Bot. 2019, 157, 11–25. [Google Scholar] [CrossRef]
  14. Zhang, H.; Xue, Y.G.; Wang, Z.Q.; Yang, J.C.; Zhang, J.H. An alternate wetting and moderate soil drying regime improves root and shoot growth in rice. Crop Sci. 2009, 49, 2246–2260. [Google Scholar] [CrossRef]
  15. Wang, W.; Zhang, J.H.; Yang, J.C.; Zhu, Q.S. Effect of Water Stress on Metabolism of Stored Carbohydrate of Stem and Yield in Rice Grown under Unfavorable-delayed Senescence. Acta Agron. Sin. 2004, 30, 196–204. [Google Scholar]
  16. Wang, W.; Cai, Y.X.; Zhang, Z.J.; Lang, Y.Z.; Yang, J.C.; Zhu, Q.S. Effects of Low Soil Water Potential on the Grain-filling Characters and the Main Quality Properties of Superior and Inferior Grains in Rice during Filling Period. Chin. Agric. Sci. Bull. 2005, 21, 170–183. [Google Scholar]
  17. Yang, J.C.; Xu, G.W.; Wang, Z.Q.; Chen, X.H.; Zhu, Q.S. Remobilization of Carbon Assimilates in the Stems during Grain Filling and Its Phy-siological Mechanism in Dry-cultivated Rice. Acta Agron. Sin. 2004, 30, 108–114. [Google Scholar]
  18. Wang, H.Z.; Xu, G.W.; Ma, J.; Li, X.Y.; Zhang, R.P. Effects of water stress on growth, development and yield of rice. China Seed Ind. 2009, 1, 47–49. [Google Scholar]
  19. Cui, G.X.; Shen, Q.R.; Cui, G.Q.; Li, L.Y. Advances in studies on upland planting and upland adaptability of rice. Crop Res. 2001, 15, 70–76. [Google Scholar]
  20. Engelaar, W.M.H.G.; Matsumaru, T.; Yoneyama, T. Combined effects of soil waterlogging and compaction on rice (Oryza sativa L.) growth, soil aeration, soil N transformations and 15N discrimination. Biol. Fertil. Soil 2000, 32, 484–493. [Google Scholar] [CrossRef]
  21. Wang, K.; Wang, Y.Z.; Tang, G.M. Effects of Submergence Stress on Rice Yield Factors in Jointing-booting Stage. J. Irrig. Drain. 2015, 34, 40–43. [Google Scholar]
  22. Wang, K.; Wang, Y.Z.; Tang, G.M. Experimental Study of Response Rice Jointing-booting Stage to Inundation Condition. China Rural. Water Hydropower 2016, 58, 81–87. [Google Scholar]
  23. Yu, Y.M.; Li, F.H.; Lian, P.; Jiang, L.X.; Meng, Y. Effects of submergence stress on rice growth in jointing stage. J. Water Resour. Water Eng. 2018, 29, 240–244. [Google Scholar]
  24. Xiong, Q.Q.; Zhong, L.; Chen, X.R.; Zhu, C.L.; Peng, X.S.; He, X.P.; Fu, J.R.; Bian, J.M.; Hu, L.F.; Ouyang, L.J.; et al. Effects of Drought-floods Abrupt Alternation During Panicle Initiation Stage on δ13C and δ15N Stable Isotope Ratios of Leaves in Double-season Super Hybrid Rice. J. Nucl. Agric. Sci. 2017, 31, 559–565. [Google Scholar]
  25. Wang, Z.C.; Guo, X.P.; Yang, J.H.; Chen, S.; Huang, S.S.; Wang, F.; Qiu, R.J.; Liu, C.W.; Cao, X.C.; Zhu, J.B.; et al. Effect of alternate flooding and drought stress on biomass production, distribution and lodging characteristic of rice. Trans. Chin. Soc. Agric. Eng. 2016, 32, 114–123. [Google Scholar]
  26. Guo, X.P.; Li, X.P.; Lu, H.F.; Wang, Z.C.; Yang, S. Study on Dry Matter Accumulation and Nitrogen Uptake under Alternating Drought and Flooding Stress in Rice Tillering Stage. J. Irrig. Drain. 2015, 34, 20–24. [Google Scholar]
  27. Cheng, X.F. Study on Response Law and Water Production Function of Rice under the Condition of Rapid Drought and Flood; Wuhan University: Wuhan, China, 2017. [Google Scholar]
  28. Huang, J.; Wu, F.; Hu, T.; Liu, L.; Wang, J.; Wang, X.; Liang, C.; Liu, J. Interactive Effects of Drought-Flood Abrupt Alternation on Morpho-Agronomic and Nutrient Use Traits in Rice. Agronomy 2021, 11, 2103. [Google Scholar] [CrossRef]
  29. Shao, G.C.; Cheng, X.; Liu, N.; Zhang, Z. Effect of drought pretreatment before anthesis and post-anthesis waterlogging on water relation, photosynthesis, and growth of tomatoes. Arch. Agron. Soil Sci. 2016, 62, 935–946. [Google Scholar] [CrossRef]
  30. Cheng, T.; Hu, J.C.; Li, Y.X.; Xie, X.J.; Li, Y.X. Effects of flooding stress on leave’s photosynthetic capability of paddy rice. Meteorol. Environ. Sci. 2019, 42, 26–33. [Google Scholar]
  31. Zhen, B.; Zhou, X.G.; Lu, H.F.; Li, H.Z. The effects of alternate hot wave and waterlogging on physiological traits of rice at booting stage. J. Irrig. Drain. 2019, 38, 1–7. [Google Scholar]
  32. Lawson, T.; Blatt, M.R. Stomatal size, speed, and responsiveness impact on photosynthesis and water use efficiency. Plant Physiol. 2014, 164, 1556–1570. [Google Scholar] [CrossRef]
  33. Roche, D. Stomatal Conductance Is Essential for higher yield potential of C3 crops. Crit. Rev. Plant Sci. 2015, 34, 429–453. [Google Scholar] [CrossRef]
  34. Li, J.T.; Ju, H.; Wang, H.F.; Jiang, S.; Hao, X.Y.; Han, X.; Gao, J. Effects of elevated CO2 concentration on accumulation and translocation of carbon and nitrogen of winter wheat under different water conditions. Chin. J. Eco-Agric. 2015, 23, 954–963. [Google Scholar]
  35. Van Der Straeten, D.; Zhou, Z.; Prinsen, E.; Van Onckelen, H.A.; Van Montagu, M.C. A comparative molecular-physiological study of submergence response in lowland and deepwater rice. Plant Physiol. 2001, 125, 955–968. [Google Scholar] [CrossRef] [PubMed]
  36. Kende, H.; Van Der Knaap, E.; Cho, H.T. Deepwater rice: A model plant to study stem elongation. Plant Physiol. 1998, 118, 1105–1110. [Google Scholar] [CrossRef] [PubMed]
  37. Ning, J.H.; Lu, K.D.; Huo, Z.G.; Xie, N.; Huang, W.H. Effects of waterlogging stress on rice morphology and yield component at the jointing stage. Chin. J. Ecol. 2014, 33, 1818–1825. [Google Scholar]
  38. Vergara, B.S.; Jackson, B.; De Datta, S.K. Deepwater rice and its response to deepwater stress Proceedings of the Symposium on Climate and Rice. LosBanos Philipp. Int. Rice Res. Inst. 1976, 1, 301–319. [Google Scholar]
  39. Sauter, M. Rice in deep water: “how to take heed against a sea of troubles”. Naturwissenschaften 2000, 87, 289–303. [Google Scholar] [CrossRef]
  40. Cheng, T.; Hu, J.C.; Lin, Z.J. Effects of submergence stress on partition of dry matter and yield of rice plant. J. Henan Agric. Univ. 2019, 53, 689–693. [Google Scholar]
  41. Wu, F.Y.; Wang, H.; Zhu, R.; Zhai, L.N.; Hu, T.S. Post-effects of waterlogging on the rice growth at the jointing-booting stage. Trans. Chin. Soc. Agric. Eng. 2021, 37, 85–93. [Google Scholar]
Figure 1. Meteorological data. Legend: (a) monthly mean humidity and temperature, (b) monthly mean wind velocity and vapor pressure.
Agronomy 13 02994 g001
Figure 2. Drought and flood setting. Legend: (a) normal irrigation, (b) drought control, (c) flood control.
Agronomy 13 02994 g002
Figure 3. The damage degree in the DFAA groups. Legend: Note: RCK (rate relative to CK group), RDC (rate relative to DC groups) and RFC (rate relative to FC groups) are the increase or decrease rates of yield and yield components of DFAA groups compared with the normal irrigation group, drought groups and flood groups, respectively. Group 1 represents the increase or decrease rate of the DFAA1 group relative to the CK (or DC1 or FC1) group, group 2 represents the increase or decrease rate of the DFAA2 group relative to the CK (or DC1 or FC1) group, and group 9 represents the increase or decrease rate of the DFAA9 group relative to the CK (or DC1 or FC1) group.
Agronomy 13 02994 g003
Figure 4. Range analysis of the drought and flooding degree and duration in the DFAA groups. Legend: Y, yield/g; P, panicles per bucket; G, grains per panicle; SS, total grain number; x3, thousand-seed mass/g; x4, seed setting rate/%; (a): Trend analysis of change in 2016 year; (b): Trend analysis of change in 2017 year; (c): Trend analysis of change in 2018 year.
Agronomy 13 02994 g004
Figure 5. Root, stem, leaf and ear partitioning index of each treatment group. Legend: FE—at the end of DFAA, PR—after rewatering for 10 days, LR—after rewatering for 20 d, HT—at harvest. The PI of the DFAA, CK, DC and FC groups was the average dry matter partitioning index value of the repeated group.
Agronomy 13 02994 g005
Table 1. Destructive sampling experimental scheme for drought–flood abrupt alternation in the jointing–booting stage of rice.
TreatmentDrought Degree (%)Drought Time (d)Flood Degree (%)Flood Time (d)
DFAA1705505
DFAA27010757
DFAA370151009
DFAA4605759
DFAA560101005
DFAA66015507
DFAA75051007
DFAA85010509
DFAA95015755
DC1705normal irrigation
DC27010
DC37015
DC4605
DC56010
DC66015
DC7505
DC85010
DC95015
FC1normal irrigation505
FC2757
FC31009
FC4759
FC51005
FC6507
FC71007
FC8509
FC9755
CKnormal irrigation
Legend: The moisture content is the average value of the soil moisture in the measuring bucket and was controlled by the weighing method. The flooding depth is the percentage of the plant height. CK—normal irrigation. 70%, 60%, and 50% of field capacity—the soil moisture content accounted for 70%, 60% and 50% of the field water-holding rate, respectively.
Table 2. Rice growth period.
TreatmentTillering StageJointing StageHeading StageMilking StageHarvest Time
DFAA20 June17 July14 August26 August23 September
DC20 June17 July9 August25 August22 September
FC20 June20 July8 August23 August20 September
CK20 June20 July8 August21 August20 September
Legend: The dates in this table are the start dates of each growth period.
Table 3. The significant influence of test factors on yield and yield components.
Drought/Flood Degree and TimeYieldPanicles per BucketGrains per PanicleTotal Grain NumberThousand-Seed MassSeed Setting Rate
2016Drought degree0.000 **0.000 **0.000 **0.000 **0.012 *0.000 **
Drought time0.001 **0.000 **0.000 **0.985 NS0.099 NS0.000 **
Flood degree0.000 **0.066 NS0.033 *0.005 **0.082 NS0.000 **
Flood time0.000 **0.019 *0.011 *0.004 **0.960 NS0.260 NS
2017Drought degree0.003 **0.693 NS0.155 NS0.114 NS0.066 NS0.159 NS
Drought time0.013 *0.031 *0.540 NS0.299 NS0.655 NS0.290 NS
Flood degree0.000 **0.461 NS0.001 **0.003 **0.002 **0.000 **
Flood time0.000 **0.004 **0.021 *0.192 NS0.106 NS0.083 NS
2018Drought degree0.000 **0.820 NS0.013 *0.000 **0.082 NS0.000 **
Drought time0.000 **0.073 NS0.001 **0.000 **0.112 NS0.003 **
Flood degree0.000 **0.165 NS0.000 **0.000 **0.126 NS0.000 **
Flood time0.000 **0.654 NS0.000 **0.000 **0.332 NS0.006 **
Legend: This table presents the data and significance levels. ** represents very significant, i.e., p value ≤ 0.01. * represents significance, i.e., 0.01 < p value ≤ 0.05. NS represents no significant.
Disclaimer/Publisher’s Note: The statements, opinions and data contained in all publications are solely those of the individual author(s) and contributor(s) and not of MDPI and/or the editor(s). MDPI and/or the editor(s) disclaim responsibility for any injury to people or property resulting from any ideas, methods, instructions or products referred to in the content.

