

Optimized In Vitro Restriction Digestion Protocol for Preparing Maize and Barley ddRAD-Seq Libraries


Abstract
:1. Introduction
2. Materials and Methods
2.1. Plant Materials and DNA Extraction
2.2. Double Digestion with Restriction Enzymes of Genomic DNA
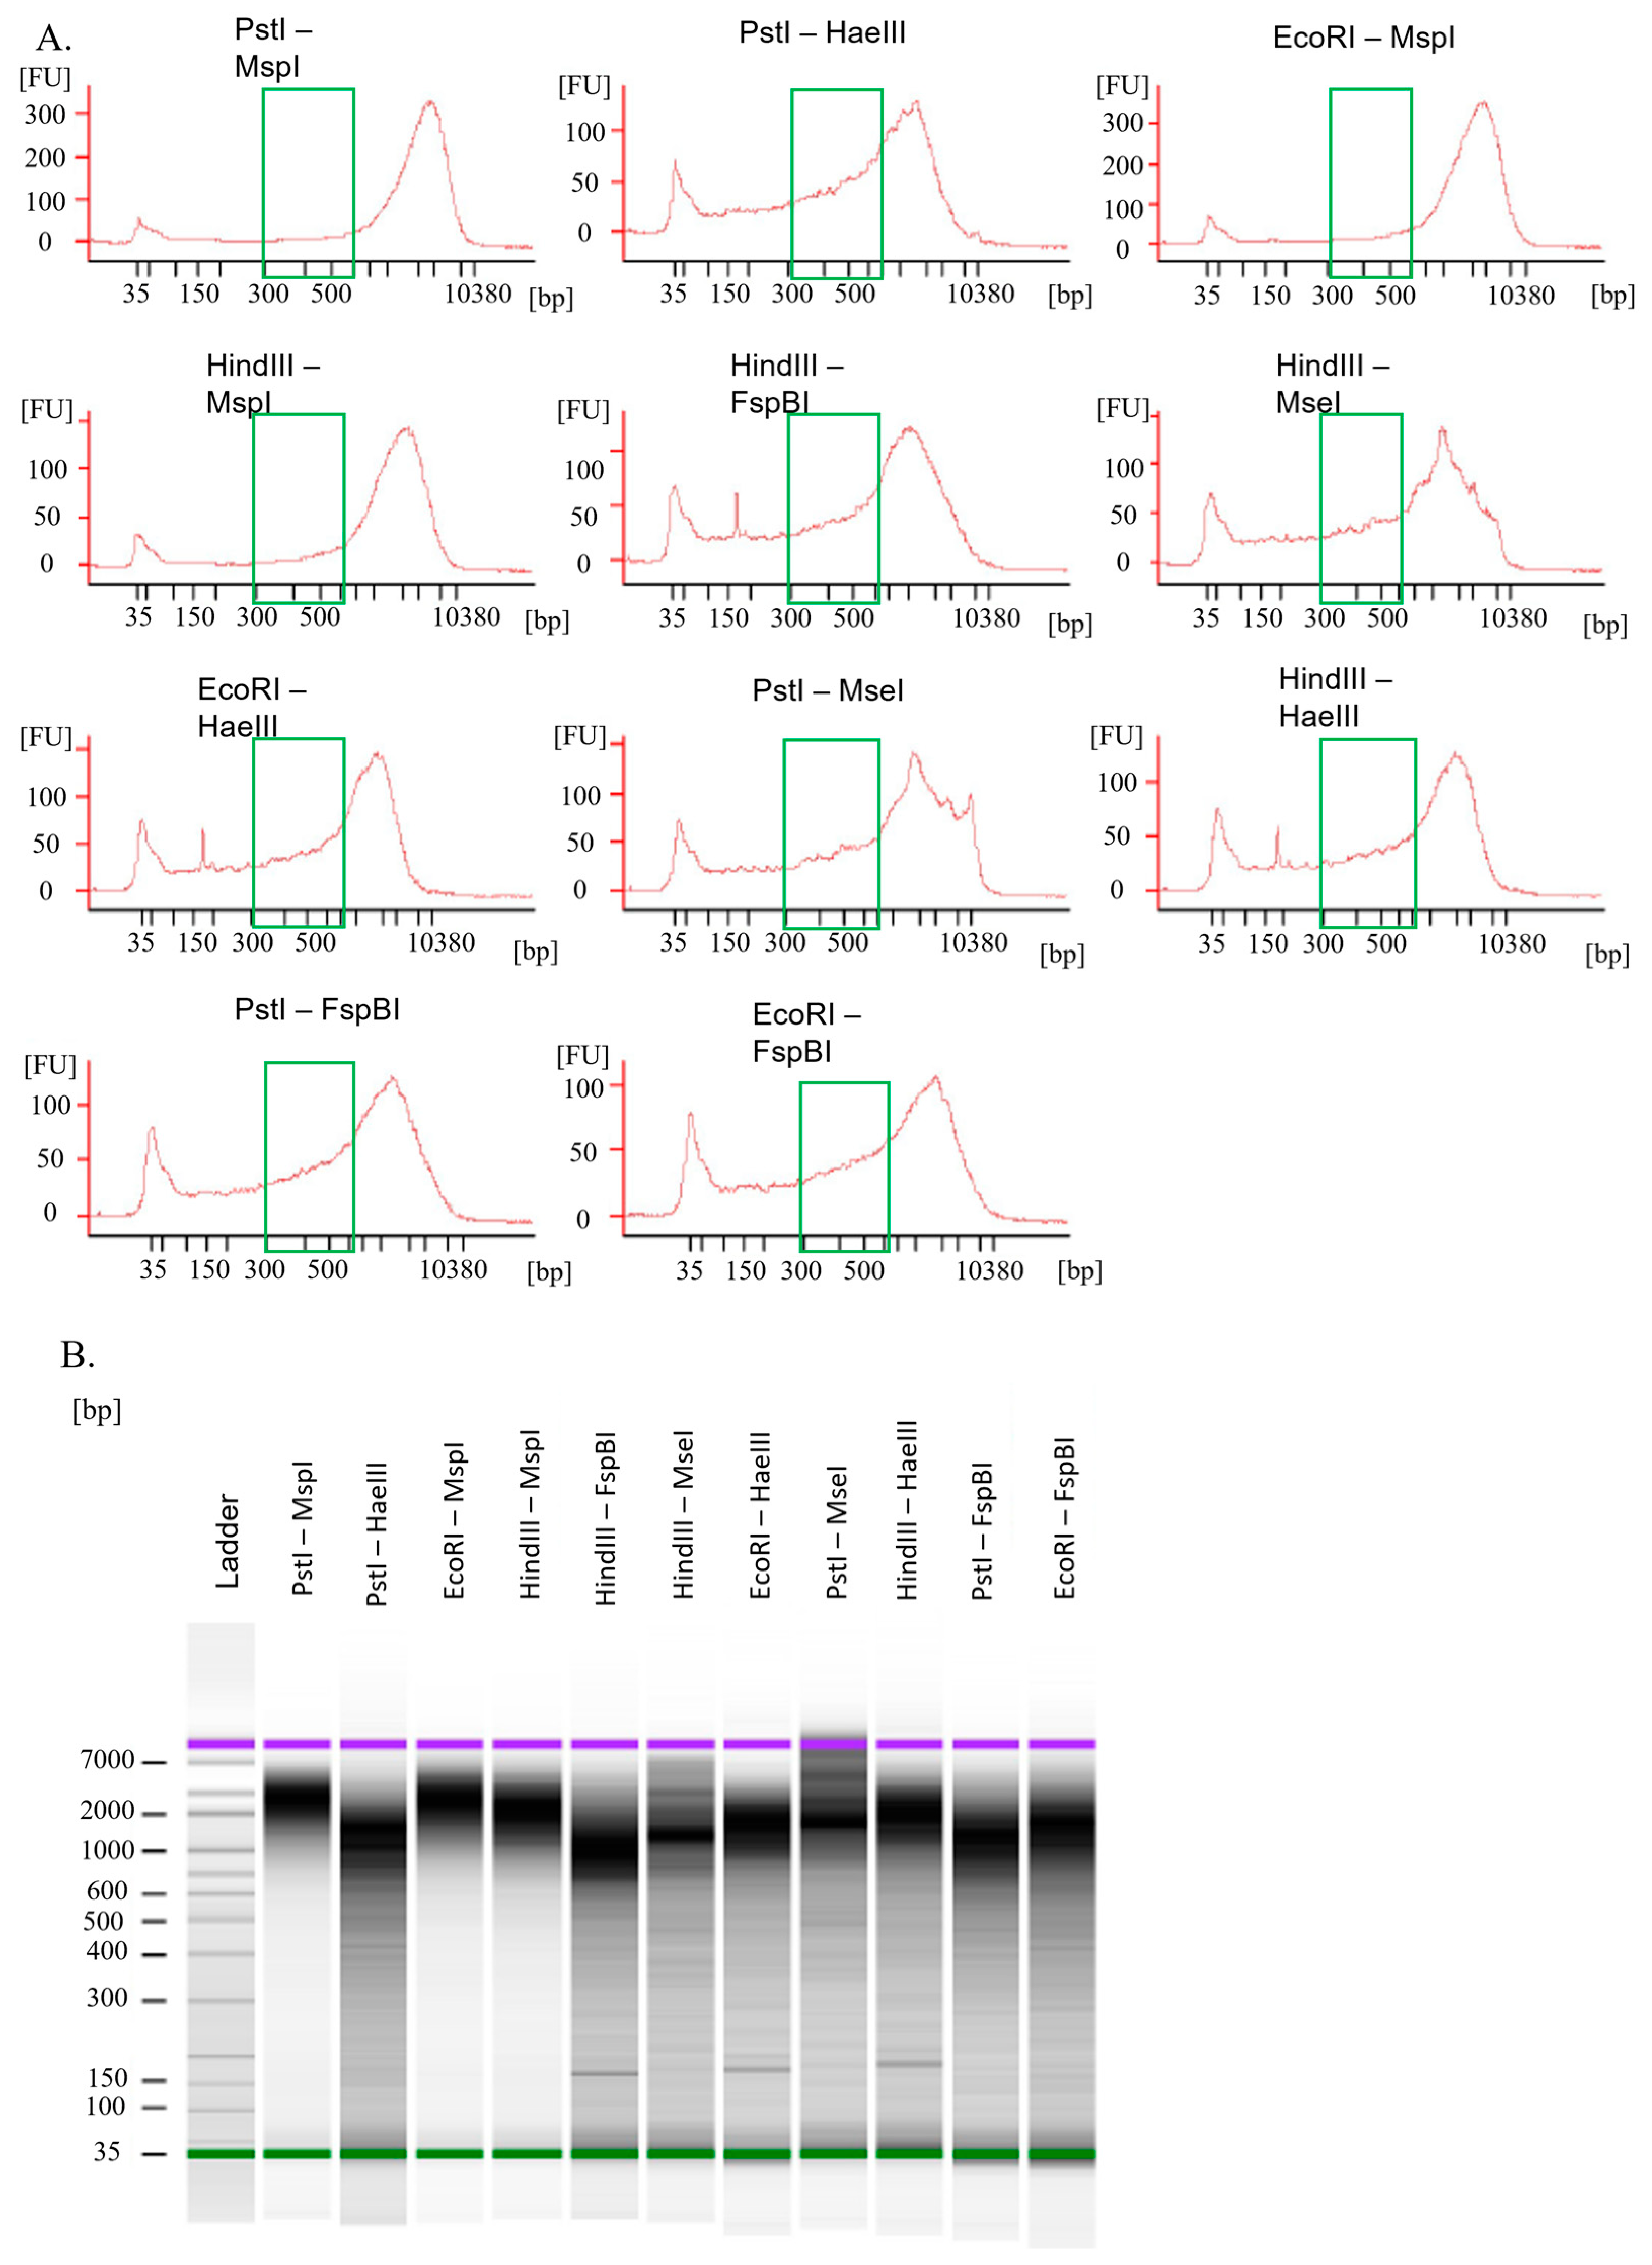
2.3. Evaluation of Restriction Enzymes Efficiency
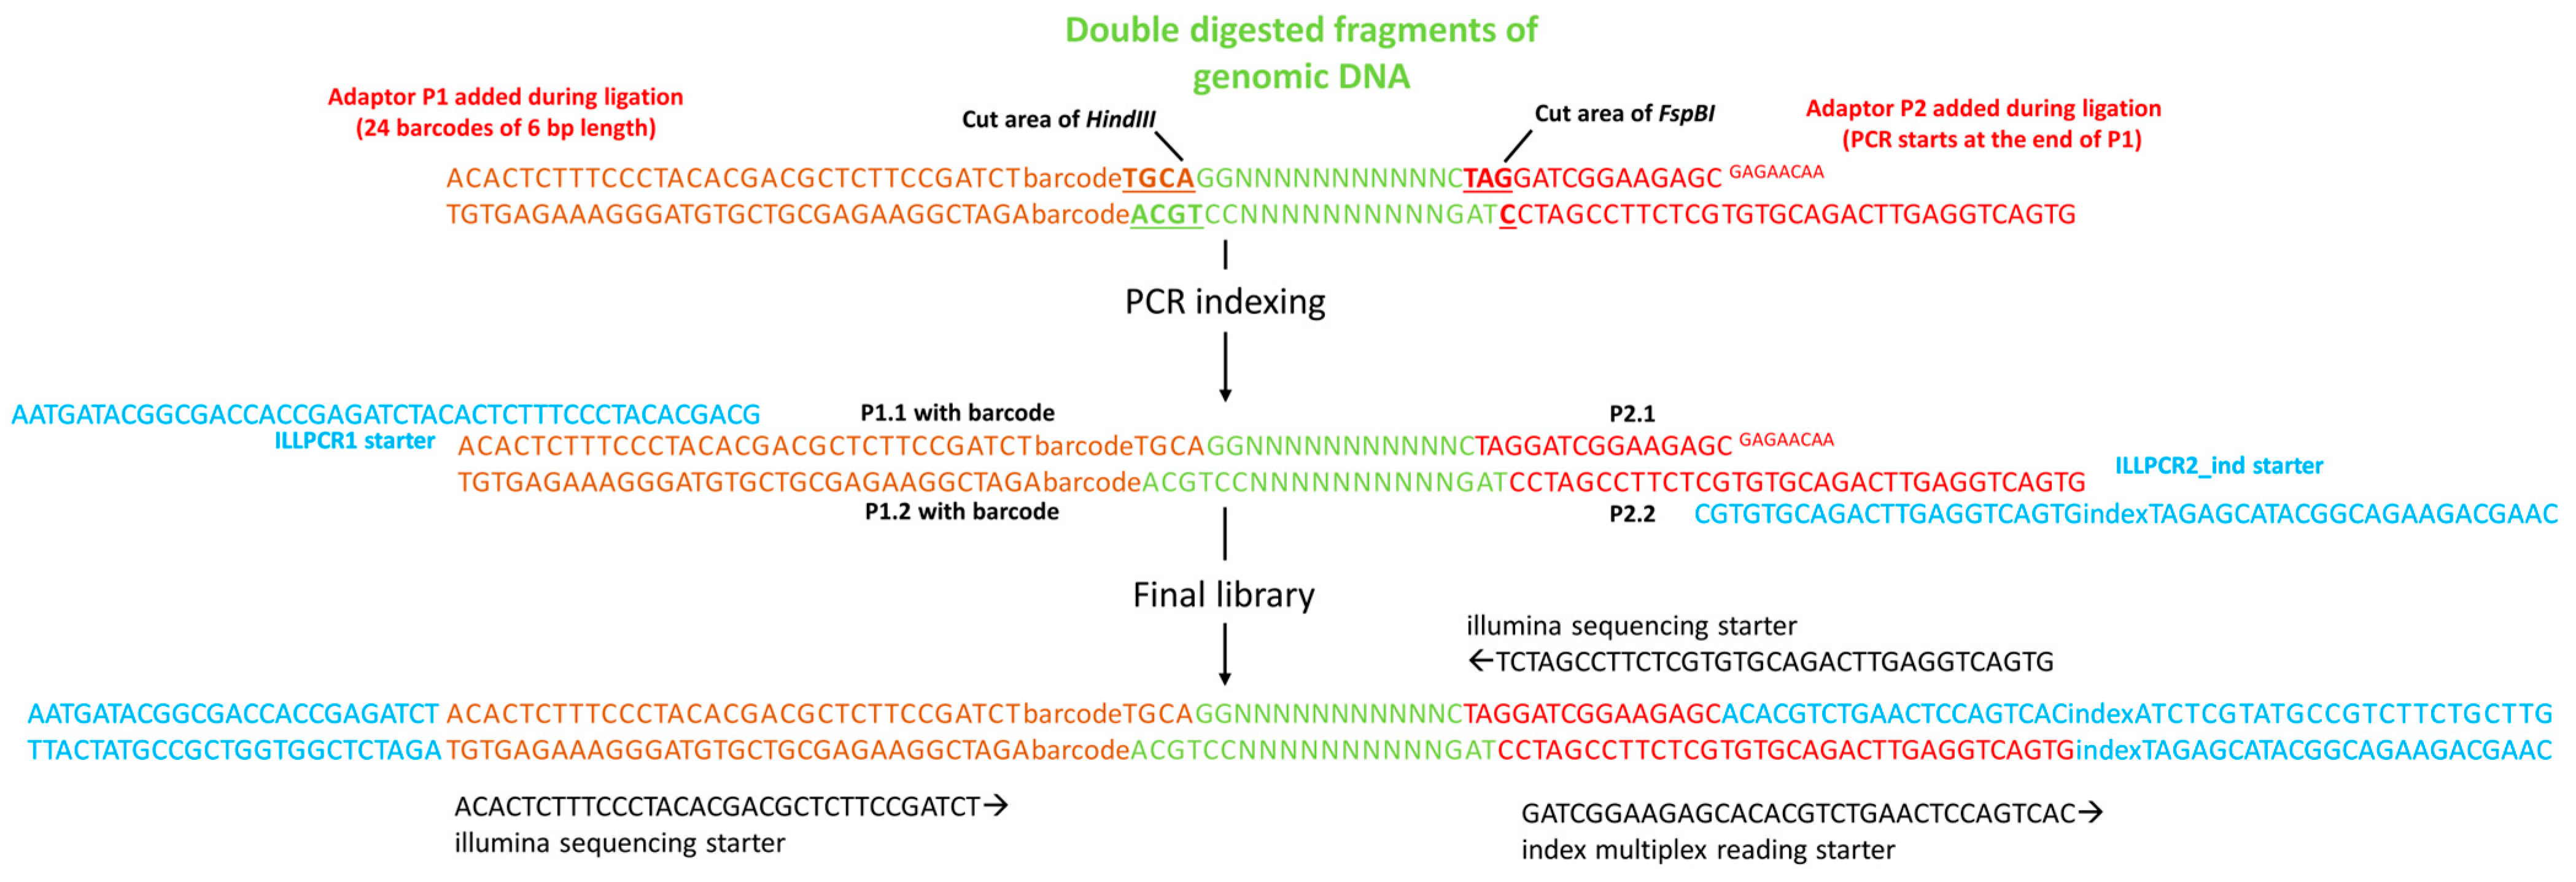
2.4. Preparation of Adaptors
2.5. Library Construction and Sequencing
2.6. Bioinformatic Analysis
3. Results
3.1. Efficacy of Restriction Enzymes
3.1.1. Maize
3.1.2. Barley
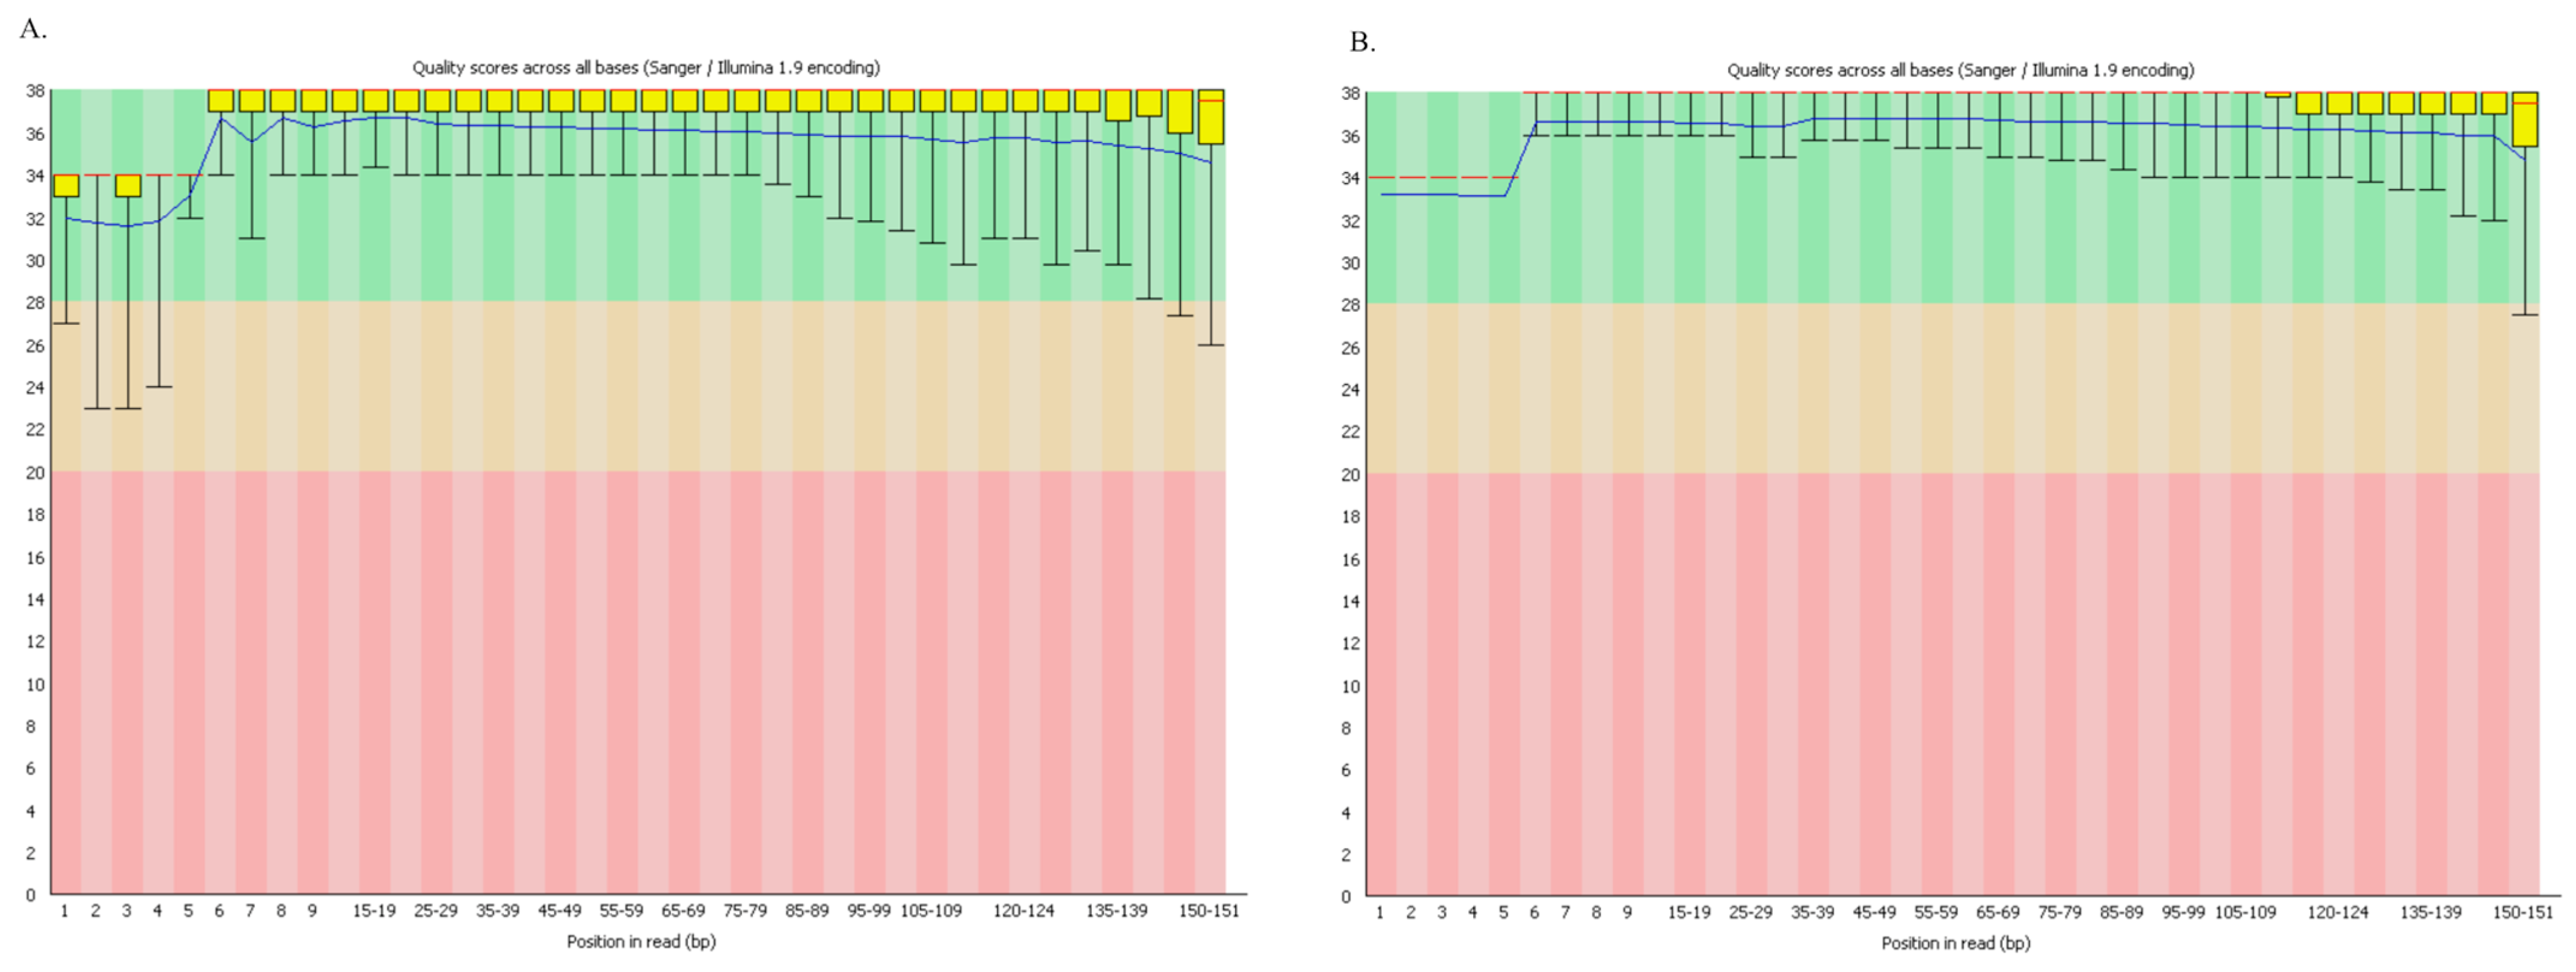
3.2. NGS Sequencing
4. Discussion
5. Conclusions
Supplementary Materials
Author Contributions
Funding
Data Availability Statement
Acknowledgments
Conflicts of Interest
References
- Watson, J.D.; Crick, F.H. Molecular structure of nucleic acids: A structure for deoxyribose nucleic acid. Nature 1953, 171, 737–738. [Google Scholar] [CrossRef] [PubMed]
- Choquet, M. Customize and get the most out of your reduced-representation sequencing experiment with the new simulation software RADinitio. Mol. Ecol. Resour. 2021, 21, 351–354. [Google Scholar] [CrossRef] [PubMed]
- Bybee, S.M.; Bracken-Grissom, H.; Haynes, B.D.; Hermansen, R.A.; Byers, R.L.; Clement, M.J.; Udall, J.A.; Wilcox, E.R.; Crandall, K.A. Targeted amplicon sequencing (TAS): A scalable next-gen approach to multilocus, multitaxa phylogenetics. Genome Biol. Evol. 2011, 3, 1312–1323. [Google Scholar] [CrossRef] [PubMed]
- Elshire, R.J.; Glaubitz, J.C.; Sun, Q.; Poland, J.A.; Kawamoto, K.; Buckler, E.S.; Mitchell, S.E. A robust, simple genotyping-by-sequencing (GBS) approach for high diversity species. PLoS ONE 2011, 6, e19379. [Google Scholar] [CrossRef] [PubMed]
- Myllykangas, S.; Natsoulis, G.; Bell, J.M.; Ji, H.P. Targeted sequencing library preparation by genomic DNA circularization. BMC Biotechnol. 2011, 11, 122. [Google Scholar] [CrossRef] [PubMed]
- Pourkheirandish, M.; Golicz, A.A.; Bhalla, P.L.; Singh, M.B. Global role of crop genomics in the face of climate change. Front. Plant Sci. 2020, 11, 922. [Google Scholar] [CrossRef]
- Henry, R.J. Progress in plant genome sequencing. Appl. Biosci. 2022, 1, 113–128. [Google Scholar] [CrossRef]
- Jiang, Z.; Wang, H.; Michal, J.J.; Zhou, X.; Liu, B.; Woods, L.C.S.; Fuchs, R.A. Genome wide sampling sequencing for SNP genotyping: Methods, challenges and future development. Int. J. Biol. Sci. 2016, 12, 100. [Google Scholar] [CrossRef]
- Peterson, B.K.; Weber, J.N.; Kay, E.H.; Fisher, H.S.; Hoekstra, H.E. Double digest RADseq: An inexpensive method for de novo SNP discovery and genotyping in model and non-model species. PLoS ONE 2012, 7, e37135. [Google Scholar] [CrossRef]
- Timm, H.; Weigand, H.; Weiss, M.; Leese, F.; Rahmann, S. DDRAGE: A data set generator to evaluate ddRADseq analysis software. Mol. Ecol. Resour. 2018, 18, 681–690. [Google Scholar] [CrossRef]
- Aguirre, N.C.; Filippi, C.V.; Zaina, G.; Rivas, J.G.; Acuña, C.V.; Villalba, P.V.; García, M.N.; González, S.; Rivarola, M.; Martínez, M.C. Optimizing ddRADseq in non-model species: A case study in Eucalyptus dunnii maiden. Agronomy 2019, 9, 484. [Google Scholar] [CrossRef]
- Wright, B.R.; Farquharson, K.A.; McLennan, E.A.; Belov, K.; Hogg, C.J.; Grueber, C.E. A demonstration of conservation genomics for threatened species management. Mol. Ecol. Resour. 2020, 20, 1526–1541. [Google Scholar] [CrossRef] [PubMed]
- Chafin, T.K.; Martin, B.T.; Mussmann, S.M.; Douglas, M.R.; Douglas, M.E. FRAGMATIC: In silico locus prediction and its utility in optimizing ddRADseq projects. Conserv. Genet. Resour. 2018, 10, 325–328. [Google Scholar] [CrossRef]
- Cumer, T.; Pouchon, C.; Boyer, F.; Yannic, G.; Rioux, D.; Bonin, A.; Capblancq, T. Double-digest RAD-sequencing: Do pre- and post-sequencing protocol parameters impact biological results? Mol. Genet. Genom. 2021, 296, 457–471. [Google Scholar] [CrossRef] [PubMed]
- Shortt, J.A.; Card, D.C.; Schield, D.R.; Liu, Y.; Zhong, B.; Castoe, T.A.; Carlton, E.J.; Pollock, D.D. Whole genome amplification and reduced-representation genome sequencing of Schistosoma japonicum miracidia. PLoS Neglected Trop. Dis. 2017, 11, e0005292. [Google Scholar] [CrossRef] [PubMed]
- Adamo, M.; Blandino, M.; Capo, L.; Ravetto Enri, S.; Fusconi, A.; Lonati, M.; Mucciarelli, M. A ddRADseq Survey of the Genetic Diversity of Rye (Secale cereale L.) Landraces from the Western Alps Reveals the Progressive Reduction of the Local Gene Pool. Plants 2021, 10, 2415. [Google Scholar] [CrossRef]
- Gilman, I.S.; Tank, D.C. Species tree estimation using ddRADseq data from historical specimens confirms the monophyly of highly disjunct species of Chloropyron (Orobanchaceae). Syst. Bot. 2018, 43, 701–708. [Google Scholar] [CrossRef]
- Zhang, Y.M.; Vitone, T.R.; Storer, C.G.; Payton, A.C.; Dunn, R.R.; Hulcr, J.; McDaniel, S.F.; Lucky, A. From pavement to population genomics: Characterizing a long-established non-native ant in North America through citizen science and ddRADseq. Front. Ecol. Evol. 2019, 7, 453. [Google Scholar] [CrossRef]
- Ivanov, V.; Marusik, Y.; Pétillon, J.; Mutanen, M. Relevance of ddRADseq method for species and population delimitation of closely related and widely distributed wolf spiders (Araneae, Lycosidae). Sci. Rep. 2021, 11, 2177. [Google Scholar] [CrossRef]
- Nazareno, A.G.; Bemmels, J.B.; Dick, C.W.; Lohmann, L.G. Minimum sample sizes for population genomics: An empirical study from an Amazonian plant species. Mol. Ecol. Resour. 2017, 17, 1136–1147. [Google Scholar] [CrossRef]
- O’Connell, K.A.; Oaks, J.R.; Hamidy, A.; Kurniawan, N.; Smith, E.N.; Fujita, M.K. Congruent demographic responses to Pleistocene geological processes in Sumatran parachuting frogs: A comparison of target-capture and ddRADseq for population genomic analyses. bioRxiv 2019, 843664. [Google Scholar] [CrossRef]
- Marconi, G.; Capomaccio, S.; Comino, C.; Acquadro, A.; Portis, E.; Porceddu, A.; Albertini, E. Methylation content sensitive enzyme ddRAD (MCSeEd): A reference-free, whole genome profiling system to address cytosine/adenine methylation changes. Sci. Rep. 2019, 9, 14864. [Google Scholar] [CrossRef] [PubMed]
- Dimond, J.L.; Roberts, S.B. Convergence of DNA methylation profiles in a novel environment in the reef coral Porites astreoides. bioRxiv 2019, 747840. [Google Scholar] [CrossRef]
- Czembor, E.; Waśkiewicz, A.; Piechota, U.; Puchta, M.; Czembor, J.H.; Stȩpień, Ł. Differences in ear rot resistance and Fusarium verticillioides-produced fumonisin contamination between Polish currently and historically used maize inbred lines. Front. Microbiol. 2019, 10, 449. [Google Scholar] [CrossRef] [PubMed]
- Murray, M.; Thompson, W. Rapid isolation of high molecular weight plant DNA. Nucleic Acids Res. 1980, 8, 4321–4326. [Google Scholar] [CrossRef] [PubMed]
- Brown, J.; Pirrung, M.; McCue, L.A. FQC Dashboard: Integrates FastQC results into a web-based, interactive, and extensible FASTQ quality control tool. Bioinformatics 2017, 33, 3137–3139. [Google Scholar] [CrossRef]
- Lajmi, A.; Glinka, F.; Privman, E. Optimising ddRAD sequencing for population genomic studies with ddgRADer. bioRxiv 2022. [Google Scholar] [CrossRef]
- Durbin, R.M. An integrated map of genetic variation from 1092 human genomes. Nature 2012, 491, 56. [Google Scholar]
- Yu, H.; You, X.; Li, J.; Liu, H.; Meng, Z.; Xiao, L.; Zhang, H.; Lin, H.-R.; Zhang, Y.; Shi, Q. Genome-wide mapping of growth-related quantitative trait loci in orange-spotted grouper (Epinephelus coioides) using double digest restriction-site associated DNA sequencing (ddRADseq). Int. J. Mol. Sci. 2016, 17, 501. [Google Scholar] [CrossRef]
- Ulaszewski, B.; Meger, J.; Burczyk, J. Comparative analysis of SNP discovery and genotyping in Fagus sylvatica L. and Quercus robur L. using RADseq, GBS, and ddRAD methods. Forests 2021, 12, 222. [Google Scholar] [CrossRef]
- Catchen, J.; Hohenlohe, P.A.; Bassham, S.; Amores, A.; Cresko, W.A. Stacks: An analysis tool set for population genomics. Mol. Ecol. 2013, 22, 3124–3140. [Google Scholar] [CrossRef] [PubMed]
- Tan, G.; Opitz, L.; Schlapbach, R.; Rehrauer, H. Long fragments achieve lower base quality in Illumina paired-end sequencing. Sci. Rep. 2019, 9, 2856. [Google Scholar] [CrossRef] [PubMed]
- Yang, G.-Q.; Chen, Y.-M.; Wang, J.-P.; Guo, C.; Zhao, L.; Wang, X.-Y.; Guo, Y.; Li, L.; Li, D.-Z.; Guo, Z.-H. Development of a universal and simplified ddRAD library preparation approach for SNP discovery and genotyping in angiosperm plants. Plant Methods 2016, 12, 39. [Google Scholar] [CrossRef]
- Shirasawa, K.; Hirakawa, H.; Isobe, S. Analytical workflow of double-digest restriction site-associated DNA sequencing based on empirical and in silico optimization in tomato. DNA Res. 2016, 23, 145–153. [Google Scholar] [CrossRef] [PubMed]
- Aballay, M.M.; Aguirre, N.C.; Filippi, C.V.; Valentini, G.H.; Sánchez, G. Fine-tuning the performance of ddRAD-seq in the peach genome. Sci. Rep. 2021, 11, 6298. [Google Scholar] [CrossRef] [PubMed]
- Srii, V.S.; Nethra, N.; Umarani, K.; Lohithaswa, H.; Shadakshari, Y.; Prasad, S.R. SNP genotyping of maize (Zea mays) hybrids and parental inbred lines for genetic purity testing using double digest restriction site-associated DNA sequencing. Seed Sci. Technol. 2021, 49, 193–206. [Google Scholar] [CrossRef]
- Milner, S.G.; Jost, M.; Taketa, S.; Mazón, E.R.; Himmelbach, A.; Oppermann, M.; Weise, S.; Knüpffer, H.; Basterrechea, M.; König, P. Genebank genomics highlights the diversity of a global barley collection. Nat. Genet. 2019, 51, 319–326. [Google Scholar] [CrossRef]
- Liu, H.; Bayer, M.; Druka, A.; Russell, J.R.; Hackett, C.A.; Poland, J.; Ramsay, L.; Hedley, P.E.; Waugh, R. An evaluation of genotyping by sequencing (GBS) to map the Breviaristatum-e (ari-e) locus in cultivated barley. BMC Genom. 2014, 15, 104. [Google Scholar] [CrossRef]
- Pootakham, W.; Sonthirod, C.; Naktang, C.; Jomchai, N.; Sangsrakru, D.; Tangphatsornruang, S. Effects of methylation-sensitive enzymes on the enrichment of genic SNPs and the degree of genome complexity reduction in a two-enzyme genotyping-by-sequencing (GBS) approach: A case study in oil palm (Elaeis guineensis). Mol. Breed. 2016, 36, 154. [Google Scholar] [CrossRef]
- De Donato, M.; Peters, S.O.; Mitchell, S.E.; Hussain, T.; Imumorin, I.G. Genotyping-by-sequencing (GBS): A novel, efficient and cost-effective genotyping method for cattle using next-generation sequencing. PLoS ONE 2013, 8, e62137. [Google Scholar] [CrossRef]
- Lepais, O.; Weir, J.T. Sim RAD: An R package for simulation-based prediction of the number of loci expected in RAD seq and similar genotyping by sequencing approaches. Mol. Ecol. Resour. 2014, 14, 1314–1321. [Google Scholar] [CrossRef] [PubMed]
- Verdu, C.F.; Guichoux, E.; Quevauvillers, S.; De Thier, O.; Laizet, Y.H.; Delcamp, A.; Gévaudant, F.; Monty, A.; Porté, A.J.; Lejeune, P. Dealing with paralogy in RAD seq data: In silico detection and single nucleotide polymorphism validation in Robinia pseudoacacia L. Ecol. Evol. 2016, 6, 7323–7333. [Google Scholar] [CrossRef] [PubMed]
- Vendrami, D.L.; Forcada, J.; Hoffman, J.I. Experimental validation of in silico predicted RAD locus frequencies using genomic resources and short read data from a model marine mammal. BMC Genom. 2019, 20, 72. [Google Scholar] [CrossRef] [PubMed]
- Eaton, D.A.; Ree, R.H. Inferring phylogeny and introgression using RADseq data: An example from flowering plants (Pedicularis: Orobanchaceae). Syst. Biol. 2013, 62, 689–706. [Google Scholar] [CrossRef]
- Lambert, S.M.; Streicher, J.W.; Fisher-Reid, M.C.; Mendez de la Cruz, F.R.; Martínez-Méndez, N.; García-Vázquez, U.O.; Nieto Montes de Oca, A.; Wiens, J.J. Inferring introgression using RADseq and DFOIL: Power and pitfalls revealed in a case study of spiny lizards (Sceloporus). Mol. Ecol. Resour. 2019, 19, 818–837. [Google Scholar] [CrossRef]
- Zhou, S.; Wei, F.; Nguyen, J.; Bechner, M.; Potamousis, K.; Goldstein, S.; Pape, L.; Mehan, M.R.; Churas, C.; Pasternak, S. A single molecule scaffold for the maize genome. PLoS Genet. 2009, 5, e1000711. [Google Scholar] [CrossRef]
- López, A.; Carreras, C.; Pascual, M.; Pegueroles, C. Evaluating restriction enzyme selection for reduced representation sequencing in conservation genomics. Mol. Ecol. Resour. 2023. Online ahead of print. [Google Scholar] [CrossRef]
- Robinson, D.; Walsh, P.R.; Bonventre, J.A. Restriction endonucleases. In Molecular Biology Problem Solver: A Laboratory Guide; Wiley-Liss, Inc.: Hoboken, NJ, USA, 2001; pp. 225–266. [Google Scholar]
- Graham, C.F.; Glenn, T.C.; McArthur, A.G.; Boreham, D.R.; Kieran, T.; Lance, S.; Manzon, R.G.; Martino, J.A.; Pierson, T.; Rogers, S.M. Impacts of degraded DNA on restriction enzyme associated DNA sequencing (RADS eq). Mol. Ecol. Resour. 2015, 15, 1304–1315. [Google Scholar] [CrossRef]
- Piffanelli, P.; Droc, G.; Mieulet, D.; Lanau, N.; Bès, M.; Bourgeois, E.; Rouvière, C.; Gavory, F.; Cruaud, C.; Ghesquière, A. Large-scale characterization of Tos17 insertion sites in a rice T-DNA mutant library. Plant Mol. Biol. 2007, 65, 587–601. [Google Scholar] [CrossRef]
- Arnold, B.; Corbett-Detig, R.B.; Hartl, D.; Bomblies, K. RAD seq underestimates diversity and introduces genealogical biases due to nonrandom haplotype sampling. Mol. Ecol. 2013, 22, 3179–3190. [Google Scholar] [CrossRef]
- Nguyen, T.K.; Yu, J.; Choi, H.-W.; In, B.-C.; Lim, J.-H. Optimization of genotyping-by-sequencing (GBS) in chrysanthemums: Selecting proper restriction enzymes for GBS library construction. Hortic. Sci. Technol. 2018, 36, 108–114. [Google Scholar] [CrossRef]


| Zea mays Inbred Lines | Hordeum vulgare Accessions |
|---|---|
| 104N | 40004 |
| 11IDT | 40068 |
| 21IDT | 40073 |
| 23UN | 40215 |
| 24S/I | 40552 |
| 30IDT * | 40554 |
| 32SSS | 41265 |
| 39L | 41268 * |
| 43F | 41269 |
| 44S/I | 41274 |
| 45SSS | 41279 |
| 49L | 41282 |
| 4F | 41283 |
| 54D | 41284 |
| 58F | 41365 |
| 67D | 41430 |
| 96F | 41434 |
| 41435 | |
| 41525 | |
| 41526 | |
| 41527 | |
| 41528 | |
| 41529 | |
| 41530 |
| Enzyme I (Rare Cutter) | Enzyme II (Common Cutter) | ||
|---|---|---|---|
| Enzyme | Cut Site | Enzyme | Cut Site1 |
| EcoRI * | 5′…G|AATTC…3′ 3′…CTTAA|G…5′ | HaeIII *** | 5′…GG|CC…3′ 3′…CC|GG…5′ |
| HindIII | 5′…A|AGCTT…3′ 3′…TTCGA|A…5′ | FspBI | 5′…C|TAG…3′ 3′…GAT|C…5′ |
| PstI | 5′…CTGCA|G…3′ 3′…G|ACGTC…5′ | MseI | 5′…T|TAA…3′ 3′…AAT|T…5′ |
| MspI ** | 5′…C|CGG…3′ 3′…GGC|C…5′ | ||
| P1 Adaptor | P2 Adaptor | ||
|---|---|---|---|
| Ingredient | Volume (µL) | Ingredient | Volume (µL) |
| P1.1 (100 µM) | 10 | P2.1 (100 µM) | 10 |
| P1.2 (100 µM) | 10 | P2.2 (100 µM) | 10 |
| water | 80 | water | 80 |
| final volume | 100 | final volume | 100 |
| Ingredient | Volume (µL) |
|---|---|
| Cut Smart Buffer (10×) | 1 |
| T4 DNA Ligase (400 U/µL) | 0.5 |
| 10 mM ATP | 3 |
| 10 mM P2 adaptor | 1 |
| water | 3.5 |
| final volume | 9 |
| Enzymes Combination | In Vitro | In Silico | ||
|---|---|---|---|---|
| Concentration (pg/µL) | Molarity (pmol/L) | Percentage of Useful Fragments (%) | Number of Fragments | |
| PstI—MspI | 0 | 0 | 0 | 160,965 |
| PstI—HaeIII | 8998 | 17,158 | 25.80 | 144,142 |
| EcoRI—MspI | 1615 | 6770 | 6.83 | 166,259 |
| HindIII—MspI | 2269 | 8094 | 14.75 | 263,417 |
| HindIII—FspBI | 48,290 | 124,398 | 46.02 | 270,679 |
| HindIII—MseI | 21,941 | 92,976 | 20.38 | 214,230 |
| EcoRI—HaeIII | 22,388 | 95,413 | 20.78 | 175,882 |
| PstI—MseI | 457 | 1998 | 20.51 | 195,383 |
| HindIII—HaeIII | 10,662 | 45,698 | 17.32 | 222,274 |
| PstI—FspBI | 42,471 | 101,132 | 39.20 | 208,475 |
| EcoRI—FspBI | 20,920 | 91,359 | 27.50 | 207,162 |
| Enzymes Combination | In Vitro | In Silico | ||
|---|---|---|---|---|
| Concentration (pg/µL) | Molarity (pmol/L) | Percentage of Useful Fragments (%) | Number of Fragments | |
| PstI—MspI | 6658 | 30,134 | 24.93 | 250,144 |
| HindIII—FspBI | 6644 | 25,115 | 23.50 | 645,928 |
| EcoRI—MspI | 804 | 2583 | 1.92 | 312,531 |
| HindIII—MspI | 2667 | 9313 | 11.14 | 566,198 |
| PstI—HaeIII | 4230 | 17,709 | 10.08 | 453,778 |
| HindIII—MseI | 8694 | 37,430 | 19.62 | 744,406 |
| EcoRI—HaeIII | 8107 | 33,563 | 17.85 | 553,525 |
| PstI—MseI | 7427 | 32,204 | 14.85 | 524,379 |
| HindIII—HaeIII | 1780 | 7030 | 12.36 | 712,117 |
| PstI—FspBI | 4869 | 21,357 | 22.01 | 288,032 |
| EcoRI—FspBI | 10,202 | 43,327 | 21.13 | 321,946 |
Disclaimer/Publisher’s Note: The statements, opinions and data contained in all publications are solely those of the individual author(s) and contributor(s) and not of MDPI and/or the editor(s). MDPI and/or the editor(s) disclaim responsibility for any injury to people or property resulting from any ideas, methods, instructions or products referred to in the content. |
© 2023 by the authors. Licensee MDPI, Basel, Switzerland. This article is an open access article distributed under the terms and conditions of the Creative Commons Attribution (CC BY) license (https://creativecommons.org/licenses/by/4.0/).
Share and Cite
Puchta-Jasińska, M.; Bolc, P.; Piechota, U.; Boczkowska, M. Optimized In Vitro Restriction Digestion Protocol for Preparing Maize and Barley ddRAD-Seq Libraries. Agronomy 2023, 13, 2956. https://doi.org/10.3390/agronomy13122956
Puchta-Jasińska M, Bolc P, Piechota U, Boczkowska M. Optimized In Vitro Restriction Digestion Protocol for Preparing Maize and Barley ddRAD-Seq Libraries. Agronomy. 2023; 13(12):2956. https://doi.org/10.3390/agronomy13122956
Chicago/Turabian StylePuchta-Jasińska, Marta, Paulina Bolc, Urszula Piechota, and Maja Boczkowska. 2023. "Optimized In Vitro Restriction Digestion Protocol for Preparing Maize and Barley ddRAD-Seq Libraries" Agronomy 13, no. 12: 2956. https://doi.org/10.3390/agronomy13122956
APA StylePuchta-Jasińska, M., Bolc, P., Piechota, U., & Boczkowska, M. (2023). Optimized In Vitro Restriction Digestion Protocol for Preparing Maize and Barley ddRAD-Seq Libraries. Agronomy, 13(12), 2956. https://doi.org/10.3390/agronomy13122956