Article

Effects of Nitrogen Fertilizer on Nitrospira- and Nitrobacter-like Nitrite-Oxidizing Bacterial Microbial Communities under Mulched Fertigation System in Semi-Arid Area of Northeast China

1
Key Laboratory of Soil Resource Sustainable Utilization for Jilin Province Commodity Grain Bases, College of Resource and Environmental Science, Jilin Agricultural University, Changchun 130118, China
2
Institute of Agricultural Environment and Resources Research, Jilin Academy of Agricultural Sciences, Changchun 130033, China
*
Author to whom correspondence should be addressed.
These authors contributed equally to this work.
Agronomy 2023, 13(12), 2909; https://doi.org/10.3390/agronomy13122909
Submission received: 17 October 2023 / Revised: 21 November 2023 / Accepted: 25 November 2023 / Published: 27 November 2023
(This article belongs to the Section Soil and Plant Nutrition)

Abstract

:
The accumulation of nitrite is frequently overlooked, despite the fact that nitrification is the most essential phase of the entire nitrogen (N) cycle and that nitrifying bacteria play a significant role in nitrification. At present, the effects of different N application rates on soil nitrite-oxidizing bacteria (NOB) abundance, community composition, diversity, and its main influencing factors are still unclear. In this study, five N fertilizer application rates under film mulching and a drip irrigation system were studied in the semi-arid area of Northeast China. The treatments were 0 kg ha−1 (N0), 90 kg ha−1 (N1), 150 kg ha−1 (N2), 210 kg ha−1 (N3), and 270 kg ha−1 (N4). Fluorescent quantitative PCR and Illumina Miseq sequencing were used to analyze the abundance and community structure of NOB under different amounts of N application. The results showed that the increase in amounts of N application was strongly accompanied by an increase in the content of soil organic matter (SOM), total nitrogen (TN), nitrate nitrogen (NO3-N), and ammonium nitrogen (NH4+-N), while the pH significantly reduced with an increase in N fertilization. N fertilization significantly increased soil nitrite oxidoreductase (NXR) activity, soil nitrification potential (PNR), and soil nitrite oxidation potential (PNO). A high N application rate significantly heightened the abundance of Nitrospira- and Nitrobacter-like NOB. N fertilizer considerably raised the Shannon index of Nitrospira-like NOB. The N application amount was the key factor affecting the community structure of Nitrospira-like NOB, and available nitrogen (AN) had the dominant influence on the community structure of Nitrospira-like NOB. N fertilizer can cause soil acidification, which affects NOB abundance and diversity. Nitrospira-like NOB may promote nitrite oxidation in different N application rates under a mulched fertigation system. The findings offered a crucial scientific foundation for further investigation into how nitrite-oxidizing bacteria respond to N fertilizer management strategies in farmland soil under film mulching drip irrigation in Northeast China.

1. Introduction

China’s third most significant crop, maize, is a key component of the country’s agricultural growth. One of the key strategies used to raise maize production is fertilization [1]. Pasley et al. found that, for crop production, nitrogen (N) fertilizer application is more important than other major essential nutrients [2]. N fertilization can boost crop quality, productivity, and the rate at which plants absorb CO2. It can also strengthen crops’ resilience to environmental stressors, including scarce water supplies and saline-alkaline soil conditions [3]. The biogeochemical cycle of N has been greatly impacted by human activity, to the point that just 125 million tons of reactive N are used in natural processes, and the remaining 179 million tons mainly come from N fertilizers [4]. Moreover, 20% of the world’s population depends on cultivated land for their livelihoods [5], while the per capita arable land in China is approximately 0.08 ha, far below the world average level of 0.22 ha [6]. In the past 70 years, the average grain yield has increased from 1.09 t ha−1 to 6.51 t ha−1. The input of chemical N fertilizer is the main factor for the continuous increase of grain production, thus alleviating food security problems in China [7]. However, excessive application of N fertilizers causes soil eutrophication and acidification. Soil N buildup enhances pathogens and suppresses antagonistic bacteria [8]. Acidified soil directly affects soil ecosystems and microbial diversity, resulting in the frequent occurrence of soil-borne diseases that have devastating effects on plant growth and health.
The ability of soil to supply N is determined by its N cycle, the primary component of which is nitrification. It is the only biological activity that adds inorganically oxidized and reorganized N into nature, which is essential for preserving the global N balance. Nitrification has a significant effect on how N is used in agricultural ecosystems and how the biological ecology of the soil is kept stable [9]. According to conventional theory, ammonia (NH4+) is oxidized to nitrite (NO2) by both ammonia-oxidizing archaea (AOA) and ammonia-oxidizing bacteria (AOB), whereas nitrite is then converted to nitrate (NO3) by nitrite-oxidizing bacteria (NOB) [10,11]. However, most previous studies focused only on the effects of nitrification on the abundance and community structure of AOA, AOB, and complete ammonia oxidation (comammox) and the response of nitrifiers to environmental factors [12,13]. Since the first step of nitrification is usually rate-limiting [14], nitrous acid salt accumulation is often overlooked, and nitrite oxidation is more likely to be inhibited than ammonia oxidation [15]. Studies have proven that soil with high ammonium concentration inhibits the activity of soil nitrite oxidoreductase through ammonium, which is easy to accumulate nitrite and causes danger to the soil environment [16]. Suppressing NOB activity by operational techniques during complete nitrification is an integral aspect for developing successful nitritation, which is one of the primary explanations for this growing interest [17,18]. Therefore, it is necessary to study the abundance and community structure of NOB under different N application rates.
Sustaining excellent soil quality and a healthy atmosphere is necessary for researching the sustained productivity of black soil. Converting the rich microbiological original data under conservation tillage into an understanding of the functions of soil that are essential to agricultural ecosystems is a beneficial process. This offers a potent instrument for judicious fertilization and can also enhance forecasts regarding the impact of management methods on the make-up and function of soil microbial communities (“Who lives there?” and “What are they doing?”). Soil microorganisms play a major role in agricultural ecosystem health and productivity. Applying chemical fertilizers sensibly is crucial for both resource preservation and all-around agricultural improvement, especially when it comes to N fertilizers. At present, less research has been conducted on the abundance and community structure of NOB compared to typical nitrifying bacteria, which have been the subject of numerous studies under different fertilization regimes [19].
Nitrite oxidoreductase (NXR), the essential enzyme for NO2 oxidation, is present in NOB. The genes nxrA and nxrB, which encode the alpha and beta subunits, respectively, are found in its genome [20]. Recently, there has been widespread usage of the nxrA and nxrB genes, which were initially investigated by Poly et al. [21] and Pester et al. [22], respectively, as phylogenetic and functional markers for nitrite-oxidizing members of the Nitrobacter and Nitrospira communities [23]. The most varied and prevalent NOB in the ecological environment are those of the genera Nitrobacter and Nitrospira, which are members of the phyla Proteobacteria and Nitrospirae, respectively [24]. Long-term fertilization in acid forest soils led to fast changes in the community structure of Nitrobacter-like NOB and increased their abundance, while having no effect on Nitrospira-like NOB [25]. Nitrospira may be the primary cause of nitrite oxidation in surface agricultural soils [26,27], which suggests that, in the soil of rapeseed–rice rotation, Nitrospira may be more sensitive than Nitrobacter. Furthermore, Nitrospira was considerably impacted by soil pH, moisture, and NH4+, but Nitrobacter was not.
Therefore, this study used real-time quantitative PCR to analyze the abundance of the Nitrospira- and Nitrobacter-like NOB under different N application rates with film mulching drip irrigation. Illumina Miseq sequencing technology was performed to investigate the community structure of Nitrospira-like NOB. Structural equation modeling (SEM) was used to elucidate the interaction between soil chemical characteristics and biological characteristics of NOB under different N application rates, revealing the impact of different N application rates on the NOB community. We hypothesized that (1) N fertilization may have an impact on the abundance and diversity of NOB; (2) Nitrospira-like NOB are the most important nitrite oxidation potential (PNO) predictor; and (3) N fertilizer can cause soil acidification, which negatively affects the NOB community. This will be of great significance for evaluating the ecological impact of different types of fertilization management and for maintaining the stability of agricultural ecosystems.

2. Materials and Methods

2.1. Experimental Design

The experiment location was situated at 45°26′ N and 125°88′ E in Minle Village, Ningjiang District, Songyuan City, Jilin Province (Figure S1). The region experiences a continental monsoon climate that is mid-temperate, with most of region’s yearly precipitation falling between May and September. There are approximately 2867 h of average annual sunshine, 135 to 140 days without frost, and an average annual temperature of 5.6 °C. Maize was sown in May and harvested in October. The field experiment with chernozem soil was started in 2017. Maize variety Xiangyu 998 (Hongxiang Agriculture Company, Changchun, Jilin Province, China) was used in the test, and planting density was 70,000 plants per hectare. Each plot included three replicates placed in random blocks over a 40 m2 (10 m × 4 m) area (Figure S2). The plot used a large monopoly two-way cultivation mode, narrow row spacing was 40 cm, wide row was 80 cm, drip irrigation was placed in the middle of the narrow line when sowing, the inner diameter of the drip drill was 16 mm (Hongtaiweiye Water-saving Irrigation Equipment Company, Jinan, Shandong Province, China), and the distance from the head of the drop was 30 cm. White transparent plastic film (Wanchen Plastic Technology Company, Linqi, Shandong Province, China) was used to cover the maize and drip irrigation, and then artificial covering film was used after fertilizer sowing, with one being film a monopoly. When fertilizing according to the fertilizer requirement of the experiment, the fertilizer could be filled with water and mixed, so that it completely dissolved, before fertilization. The first dripped clean water 30 min, then fertilizing valve drip fertilizers were opened, and after fertilization, it continued to drip clear water for 30 min. Field management practices, such as fertilization method, planting density, and fertilizer dosage, remained the same once the experiment started.
Five levels of N fertilizer application were set, N0, N1, N2, N3, and N4, in which N was applied at a rate of 0, 90, 150, 210, and 270 kg ha−1, respectively. Moreover, 90 kg P2O5 ha−1 and 90 kg K2O ha−1 were applied under each treatment. The N fertilizer was applied at five different stages (Table S1). Additionally, 30% N and 50% P2O5 and K2O were used as the base fertilizer. The base fertilizer was applied before sowing, and the top dressing was applied with the integrated drip irrigation technology of water and fertilizer.

2.2. Sample Collection

The soil was sampled from the 0–20 cm deep layer on 21 October 2021. To create a composite soil sample, five randomly selected locations from each repeated plot were combined evenly. A total of 15 soil samples were gathered, and they were delivered to the lab in an ice box. Before passing the soil samples through a 2 mm screen, they were cleared of any debris, including stones and tree roots. To assess the activity of soil enzymes, NH4+-N, and NO3-N, fresh soil was employed. For the purpose of extracting DNA, some soil samples were placed in a −80 °C freezer. For the investigation of soil chemical parameters, other soil samples were air-dried at ambient temperature.

2.3. Assessment of Soil Chemical Properties and Soil Nitrite Oxidoreductase Activity

The K2CrO7 oxidation–external heating method was used to assess soil organic matter (SOM) [28]. Using the PHS-25 pH meter (Raici Corporation, Shanghai, China) to measure soil pH (water-to-soil ratio of 2.5:1) [29], the Kjeldahl method was used to test soil total N (TN) [30], and the alkaline solution diffusion method was used to measure soil accessible N (AN) [31]. Using a 2 M KCL solution, the NH4+-N and NO3-N were extracted and subsequently quantified using a continuous flow analytical apparatus (AutoAnalyzer3, Bran+Luebbe, Norderstedt, Germany) [32]. Samples of soil (2 g) were dissolved using an ultrasonic extraction method in 5 mL of cell lysis solution (50 mmol L−1 Tris HCl (pH 7.5), 300 mmol L−1 sodium chloride, and 90 mmol L−2 ethylenediaminetetraacetic acid disodium salt) [33]. A 50 mmol L Tris HCl and 5 mmol L MgCl buffer solution (pH 7.8) was used to reduce the extraction volume to 25 mL. The supernatant from the centrifugation of the extract at 12,000 rpm for 20 min was utilized to measure the enzyme activity. The NXR ELISA kit from Saint-Bio Company (Huzhou, Zhejiang Province, China) was used to measure nitrite oxidoreductase (NXR) activity in accordance with the manufacturer’s instructions.

2.4. Determination of Soil Nitrite Oxidation Potential (PNO)

A total of 30 mL of sodium nitrite solution (containing 15 mg of NO2-N) was added to fresh soil samples of 3 g, and the flask was left in a water bath shaker (HH-US-A1, Xinchunlan Scientific Instrument Company, Changzhou, Jiangsu, China ) for about 150 revolutions per minute for 30 h at constant temperature. Between constant temperature cultures, 1.5 mL of the suspension was taken at 0, 9, 24, and 30 h and centrifuged at 500 rpm for 3 min. The supernatant was filtered (0.2 mm holes) and stored at −20 °C for the analysis of NO2 [34]. NO2 was measured at 520 nm using a spectrophotometer (Uvikon 800, Leeds, UK), and it was calculated that the NO3-N content increased linearly with time.

2.5. Soil DNA Extraction and Quantification of Nitrospira- and Nitrobacter-like NOB Abundance

When 0.5 g of fresh soil was weighed, all of soil DNA was extracted using the MP Biomedicals, Irvine, CA, USA FastDNA® SPIN Kit for Soil. A Thermo Scientific, Wilmington, DE, USA, NanoDrop 2000 UV-Vis spectrophotometer was used to measure DNA concentration, and 1% agarose gel electrophoresis was used to measure DNA quality. The primer sequences of the nxrB gene PCR of soil Nitrospira-like NOB were: nxrB169-F (5′-ATACATGTGGTGGAACA-3′) and nxrB169-R (5′-TACATGTGGTGGAACA-3′) [22]. The primer sequences of the nxrA gene of Nitrobacter-like NOB were: F1norA (5′-CAGACCGACGTGTGCGAAAG-3′) and R2norA (5′-TCCACAAGGAACGGAAGGTC-3′) [35]. The PCR amplification system (50 μL) consisted of: 1 μL of nxrB169-F (10 μM), 1 μL of nxrB169-R (10 μM), 1 μL of SYBR® Premix Ex Taq™ II (TliRNaseH Plus), ROX plus, 25 μL of 2 × TaqMasterMix buffer, and sterile ddH2O added to a final volume of 50 μL. The PCR amplification conditions were as follows: initial denaturation at 94 °C for 300 s; denaturation at 55 °C for 30 s, annealing at 2 °C for 30 s for 30 cycles; and a final extension at 72 °C for 600 s. Three repetitions of each sample were made, and NOB with known copy numbers were used to create the standard curve.

2.6. High-Throughput Sequencing and Data Analysis Method for nxrB Gene of Nitrospira-like NOB

The extracted DNA from each sample was used for PCR amplification with the primers 169-F/169-R, which target the nxrB gene. To discriminate between various samples, 8 bp barcode sequences were inserted to the 5′ ends of the upstream and downstream primers. The PCR amplification system (25 μL) consisted of the following: 1 μL of Forward Primer (5 μM), 1 μL of Reverse Primer (5 μM), 12.5 μL of 2 × Taq Plus Master Mix, 3 μL of BSA (2 ng/μL), 2 μL of DNA, and sterile ddH2O added to a final volume of 25 μL. The PCR amplification conditions were as follows: initial denaturation at 95 °C for 300 s; denaturation at 55 °C for 45 s; annealing at 72 °C for 50 s, for 30 cycles; and a final extension at 72 °C for 300 s. The PCR products were detected by 1% agarose gel electrophoresis to amplify the target band size and were purified by the Agencourt AMPure XP Nucleic Acid Purification Kit. At Aoweisen Gene Technology Co., Ltd., (Beijing, China) the PCR results were used to create a sequencing library for microbial diversity. The gene sequence analysis was processed by QIIME (V.1.8.0) software, and the data were filtered and spliced by Pear software (V.0.9.6). Uncertain bases, primer mismatches, and sequences with scores below 20 were eliminated. During splicing, the minimum overlap was 10 bp, and the mismatch rate was 0.1. Vsearch Denovo software (V.2.7.1) was used to remove short sequences and chimeric sequences. The UPARSE algorithm of Vsearch software was used to perform OTU (Operational Taxonomic Units) clustering on high-quality sequences, with a similarity level at 97%. In order to ensure that the coverage of all samples was quite high, the data size of all samples was normalized to 25,223 sequences. Using the Blast algorithm, the taxonomic identity of each phylotype was determined through the GenBank non-redundant nucleotide database (nt). The gene sequences obtained in this study were submitted to NCBI and were assigned the accession number SRP455972.

2.7. Statistical Method and Data Analysis

One-way ANOVA and Pearson correlation analysis were used to examine significant differences in soil physicochemical characteristics, enzyme activities, abundance of nitrifying microorganisms, and soil PNR using SPSS (version 23.0). RDA was performed with the Canoco (V.5.0) program. Heatmaps were made with R (version 3.4.2) using the “pheatmap” and “ggplot2” tools. Sequence alignment was conducted using Mafft’s phylogenetic tree analysis, and tree building was performed using Fasttree. Python provided a visual representation of the basic genera’s abundance and evolutionary connection. The Bray–Curtis method in the R program (version 3.4.2) was used to perform the Wayne analysis, principal component analysis (PCoA), and analysis of similarities (ANOSIM). Amos (23rd edition) developed a structural equation model chi-square test (p > 0.05) and demonstrated the direct and indirect influences between soil chemical characteristics and soil NOB communities using the chi-square ratio of degrees of freedom (CMIN/DF < 3) and fitness index (CFI > 0.9).

3. Results

3.1. Soil Chemical Properties

Soil chemistry (i.e., SOM, TN, NO3-N, and NH4+-N content) changed dramatically with the increasing N delivery rate (Table 1). SOM in the N4 treatment was 1.33 times higher than in the N0 soil. The TN content increased by 0.05–0.6 g kg−1 in treatments with high N input (N3, N4) as opposed to low N (N0, N1, N2). In contrast to the low rates of N application (N0, N1, N2), N4 significantly increased soil AN content by 12.9–57.66 mg kg−1. Compared with N0, the contents of NH4+-N in N3 and N4 increased by 0.41 and 0.44 mg kg−1, respectively, and the contents of NO3-N in N3 and N4 increased by 7.29 and 6.49 mg kg−1, respectively, while the pH value decreased significantly with increased N fertilizer application (Table 1). In summary, N fertilization can increase soil nutrient content but decreases soil pH.

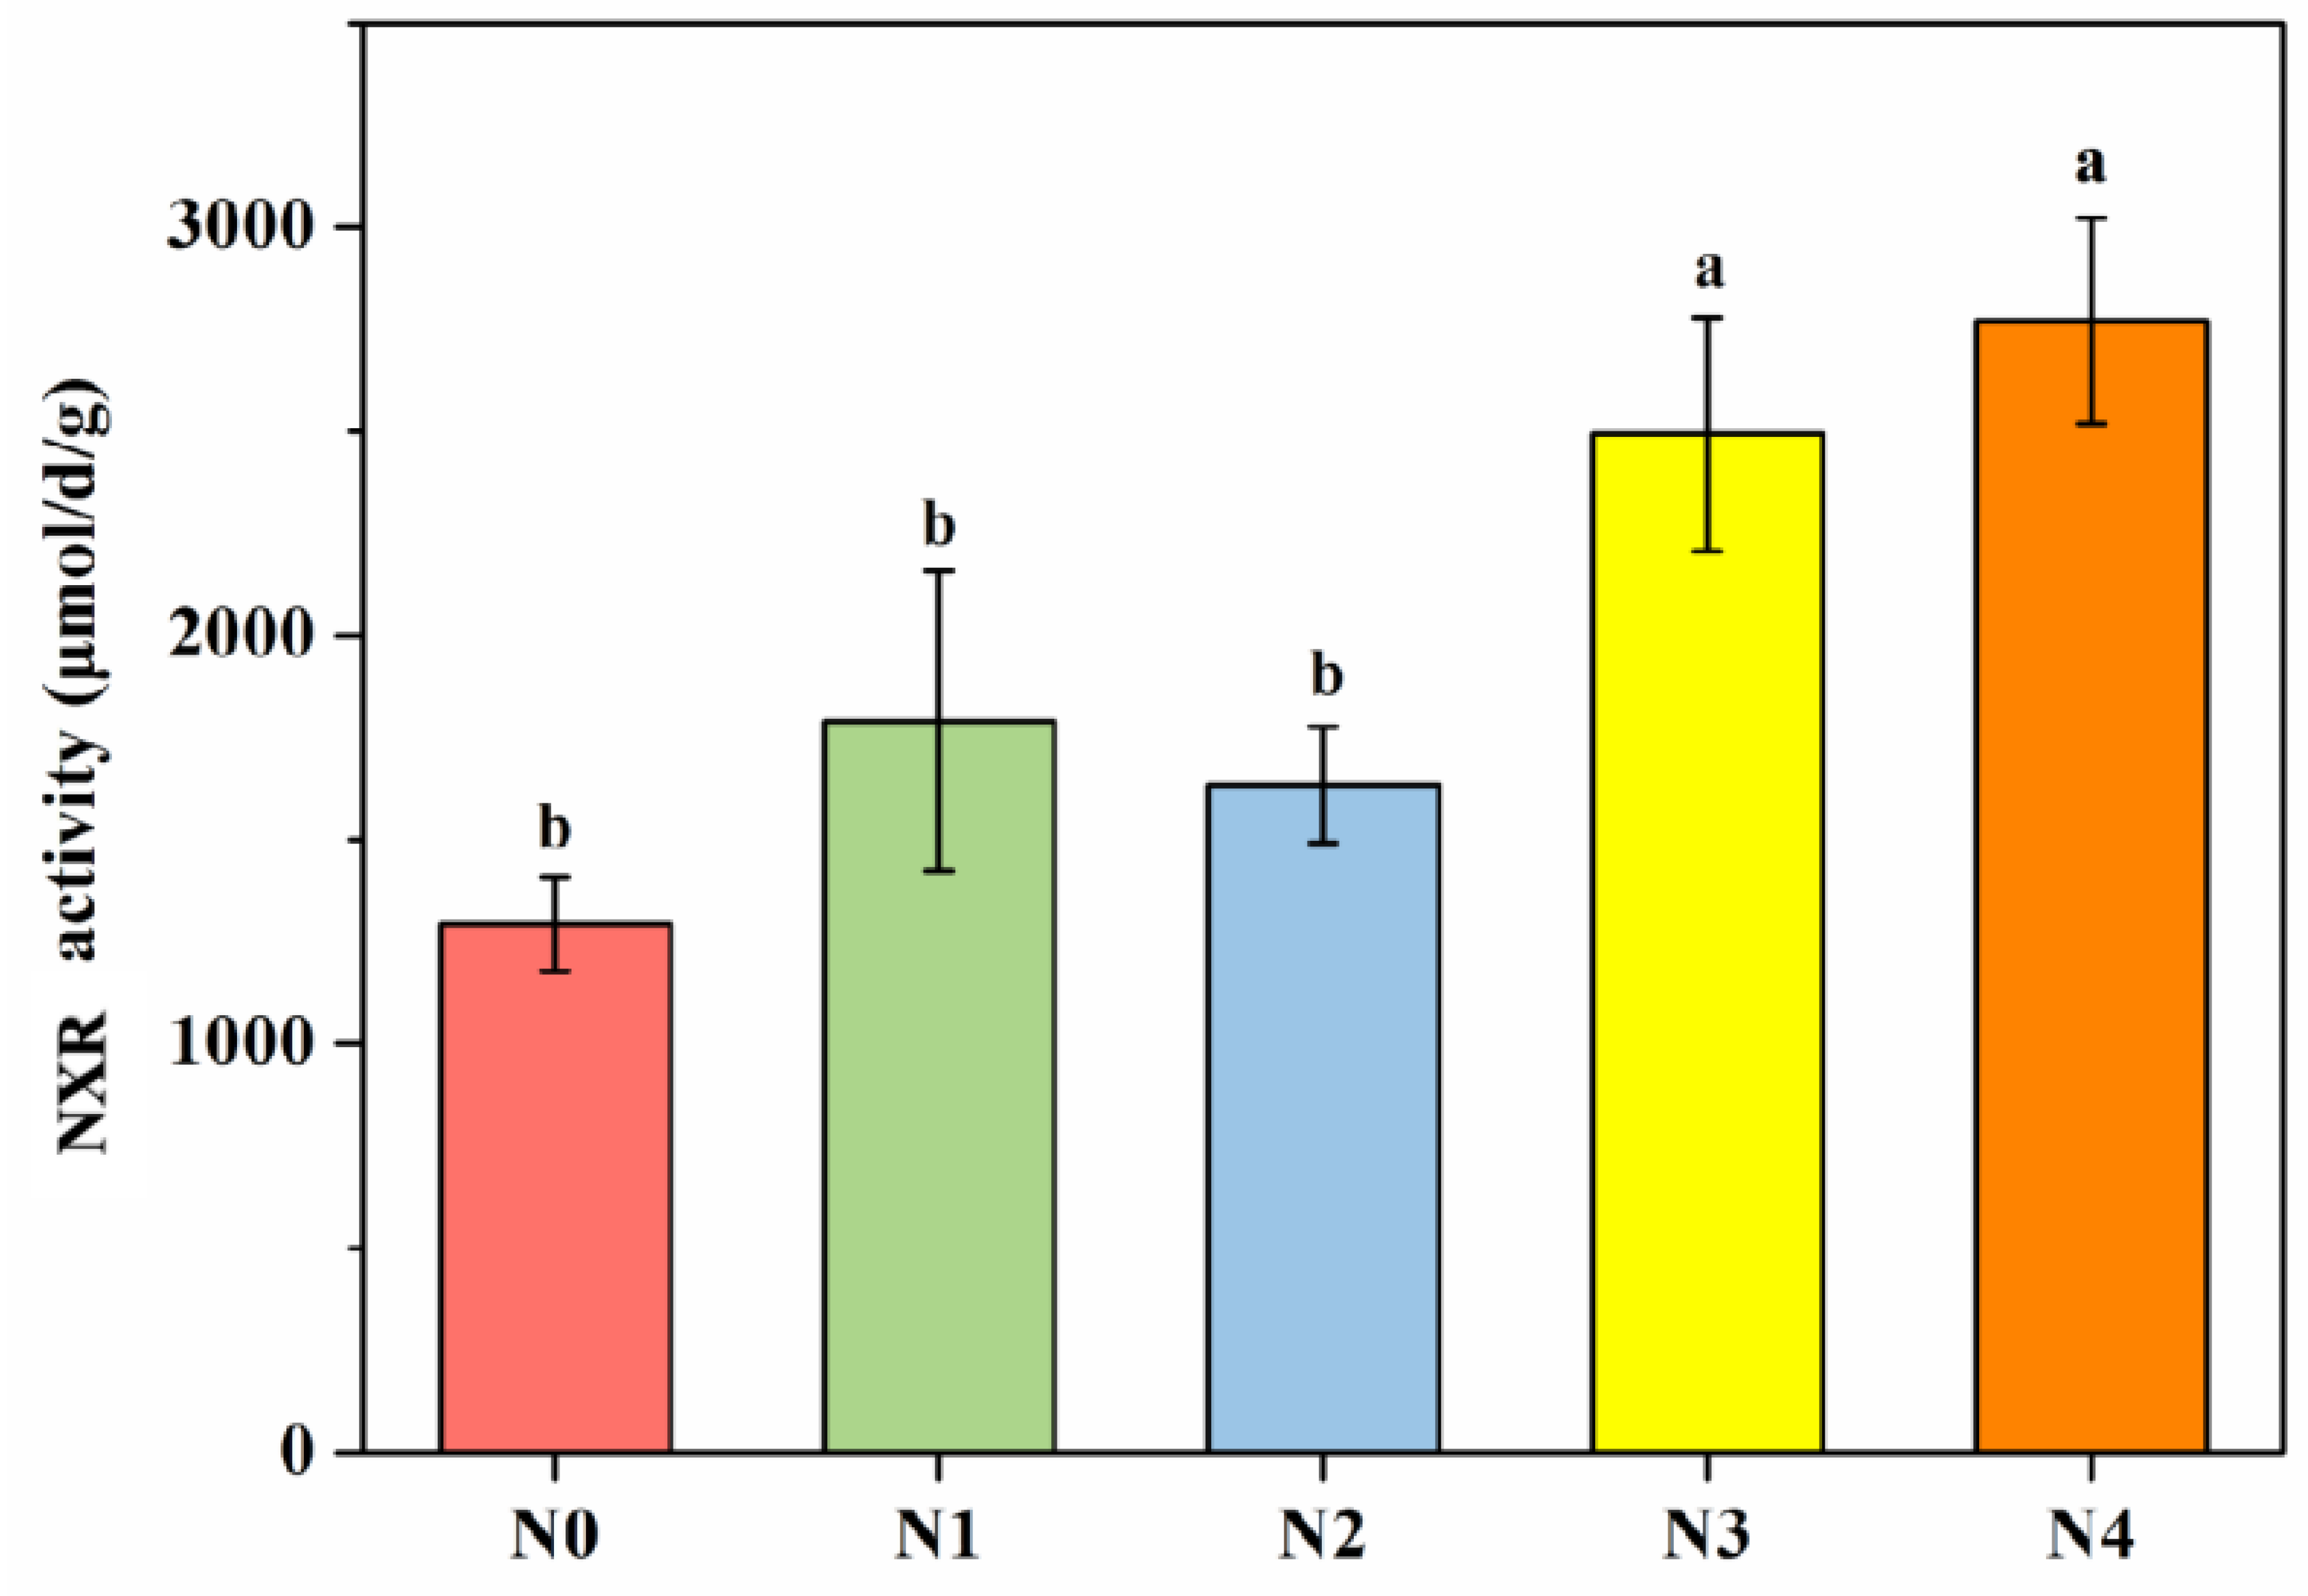
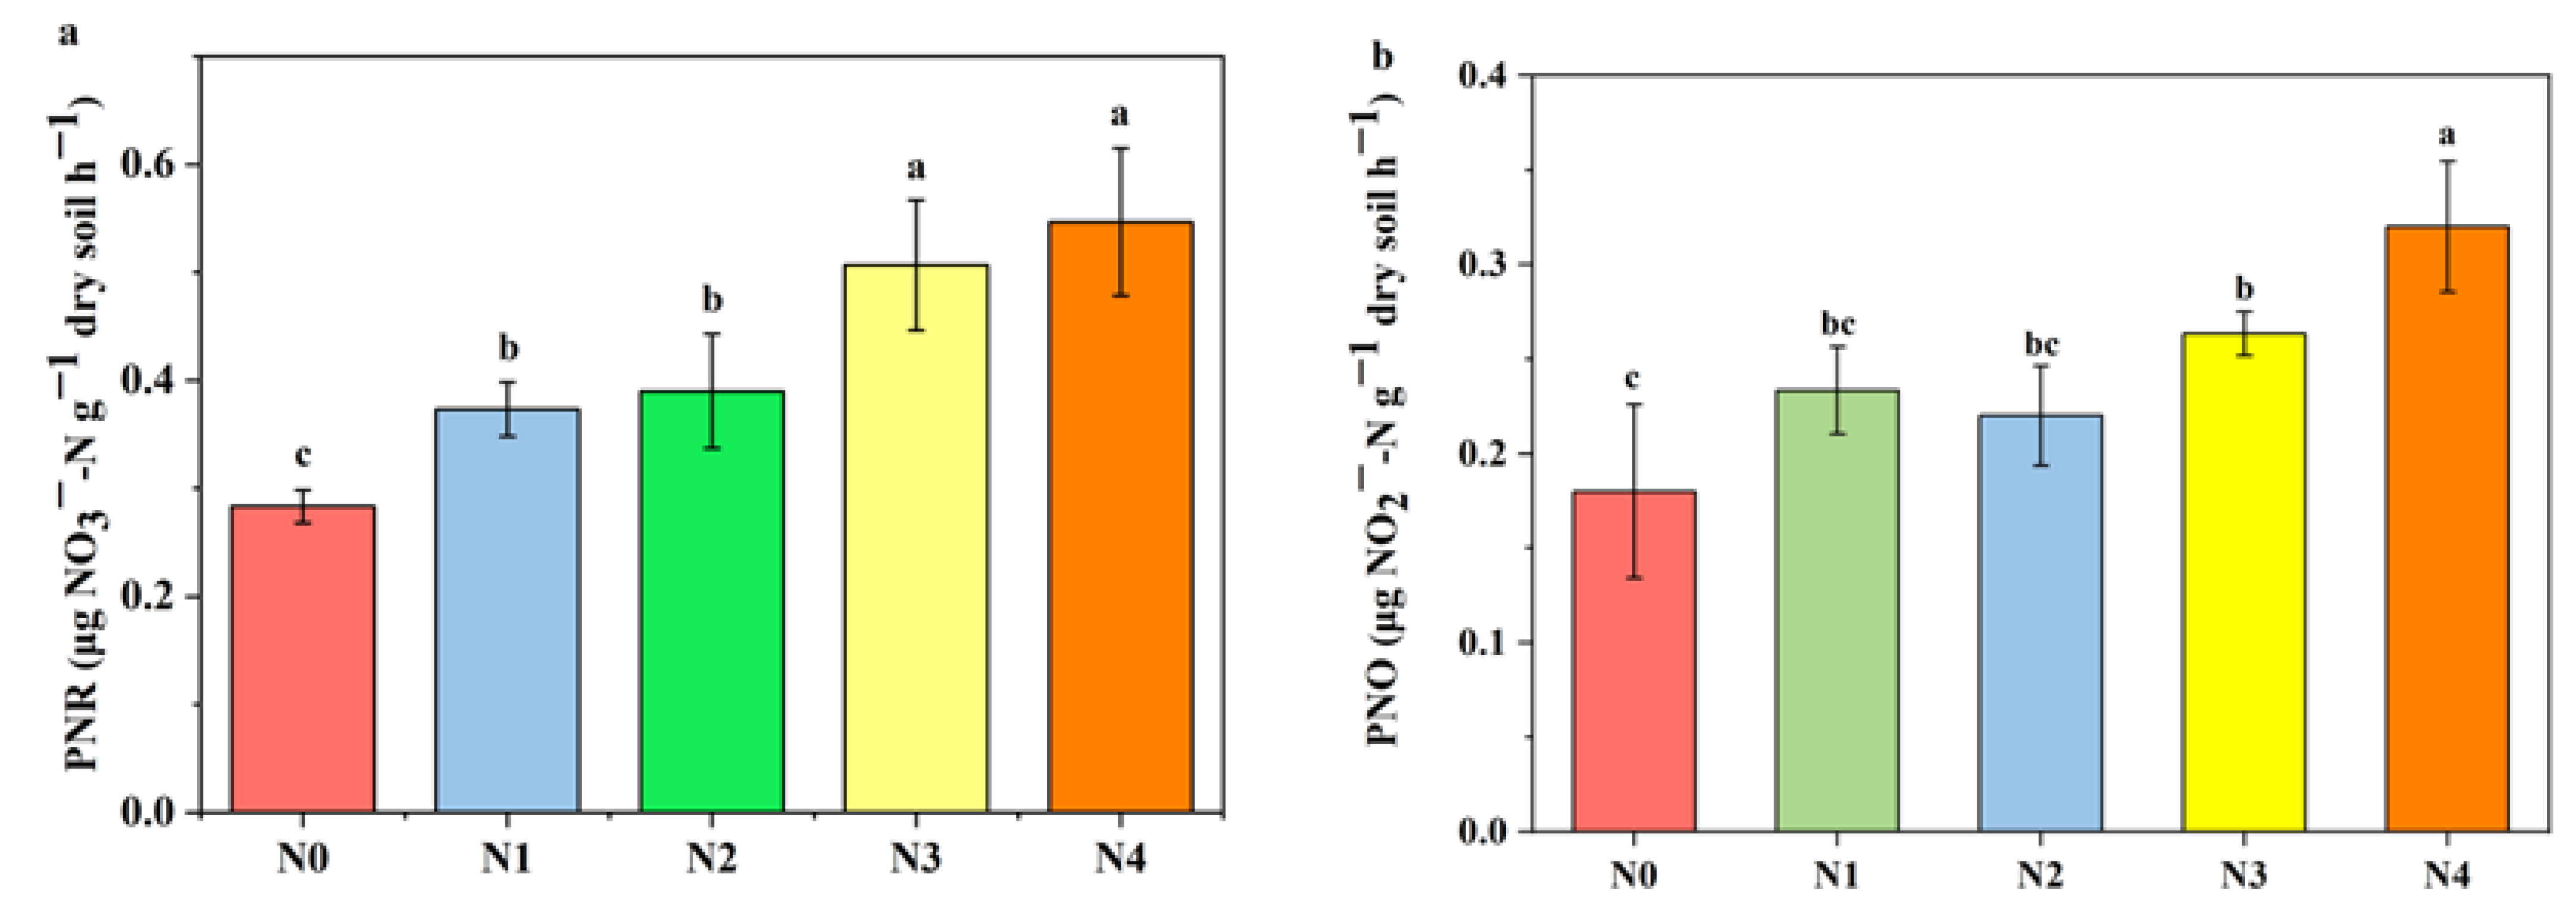
3.2. Soil NXR Activity and PNO

The high N application rates (N3, N4) considerably enhanced the activity of NXR in comparison to the low N application rates (N1, N2) (Figure 1). Compared with N0, the activities of NXR in N3 and N4 were 1.93 times and 1.95 times higher, while those of N1 and N2 were 1.62 times and 1.63 times higher, respectively. In conclusion, N fertilization increased soil NXR activity. NXR and SOM, AN, TN, NH4+-N, and NO3-N were significantly positively correlated (Table S2). High N application rates (N3, N4) significantly increased soil PNR (Figure 2a) compared to low N application rates (N0, N1, N2). The greatest value of PNO in N4 was 0.32 μg NO2-N g−1 dry soil h−1 (Figure 2b). Soil PNR was significantly positively correlated with pH, TN, AN, NO3-N, and NH4+-N, while soil PNO was significantly positively correlated with SOM, TN, AN, NO3-N, and NH4+-N (Figure S3).

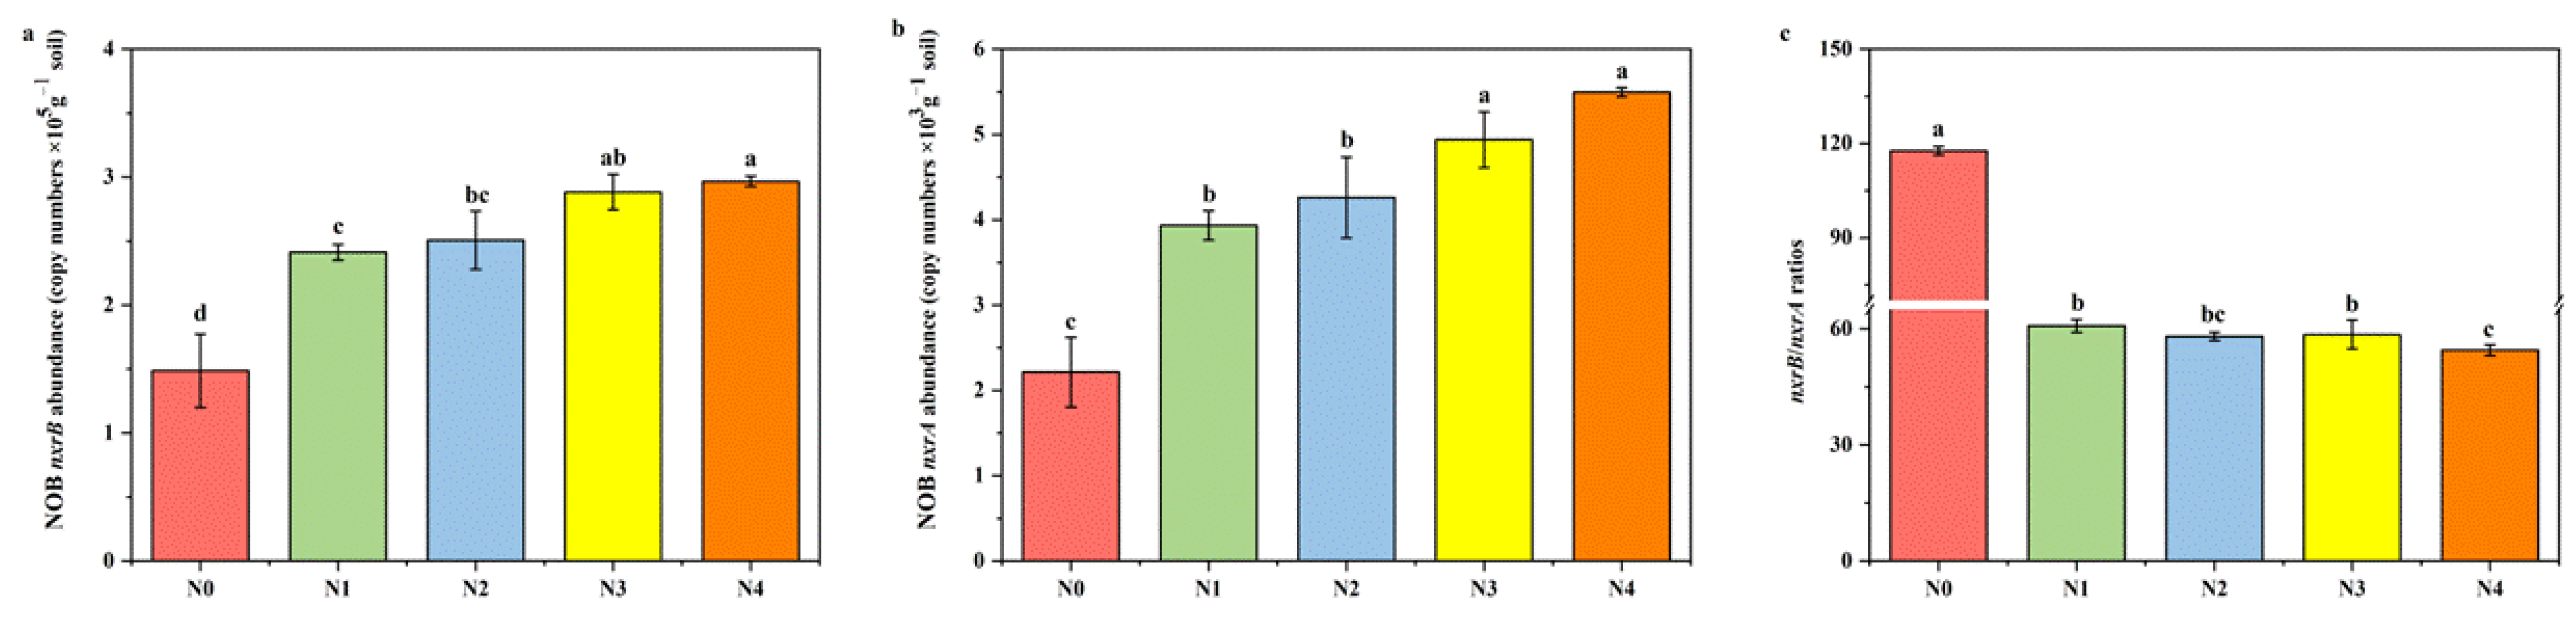
3.3. Abundance of Soil Nitrospira- and Nitrobacter-like NOB

The abundance of Nitrospira- and Nitrobacter-like NOB can be increased by applying N fertilizer in comparison to N0 (Figure 3). In contrast to low N content (N0, N1, N2), N4 significantly increased the abundance of Nitrospira-like NOB, and N3 and N4 significantly increased the abundance of Nitrobacter-like NOB (Figure 3). The abundance of Nitrospira-like NOB was significantly higher than that of Nitrobacter-like NOB. The ratio of nxrB/nxrA gene copy numbers ranged from 54.47 to 117.66, with the highest value in N0, followed by N1, N2, N3, and N4, indicating that fertilization had a significant negative effect on nxrB/nxrA gene copy numbers. The correlation analysis between Nitrospira- and Nitrobacter-like NOB abundance, PNO, and soil chemical properties under the different N application rates showed that the soil Nitrospira- and Nitrobacter-like NOB abundances were significantly positively correlated with SOM, AN, TN, NO3-N, NH4+-N, and PN (Figure S3). However, the ratio of nxrB/nxrA gene copy numbers was significantly negatively correlated with SOM, AN, TN, NO3-N, NH4+-N, AN, and PNO (Figure S3).

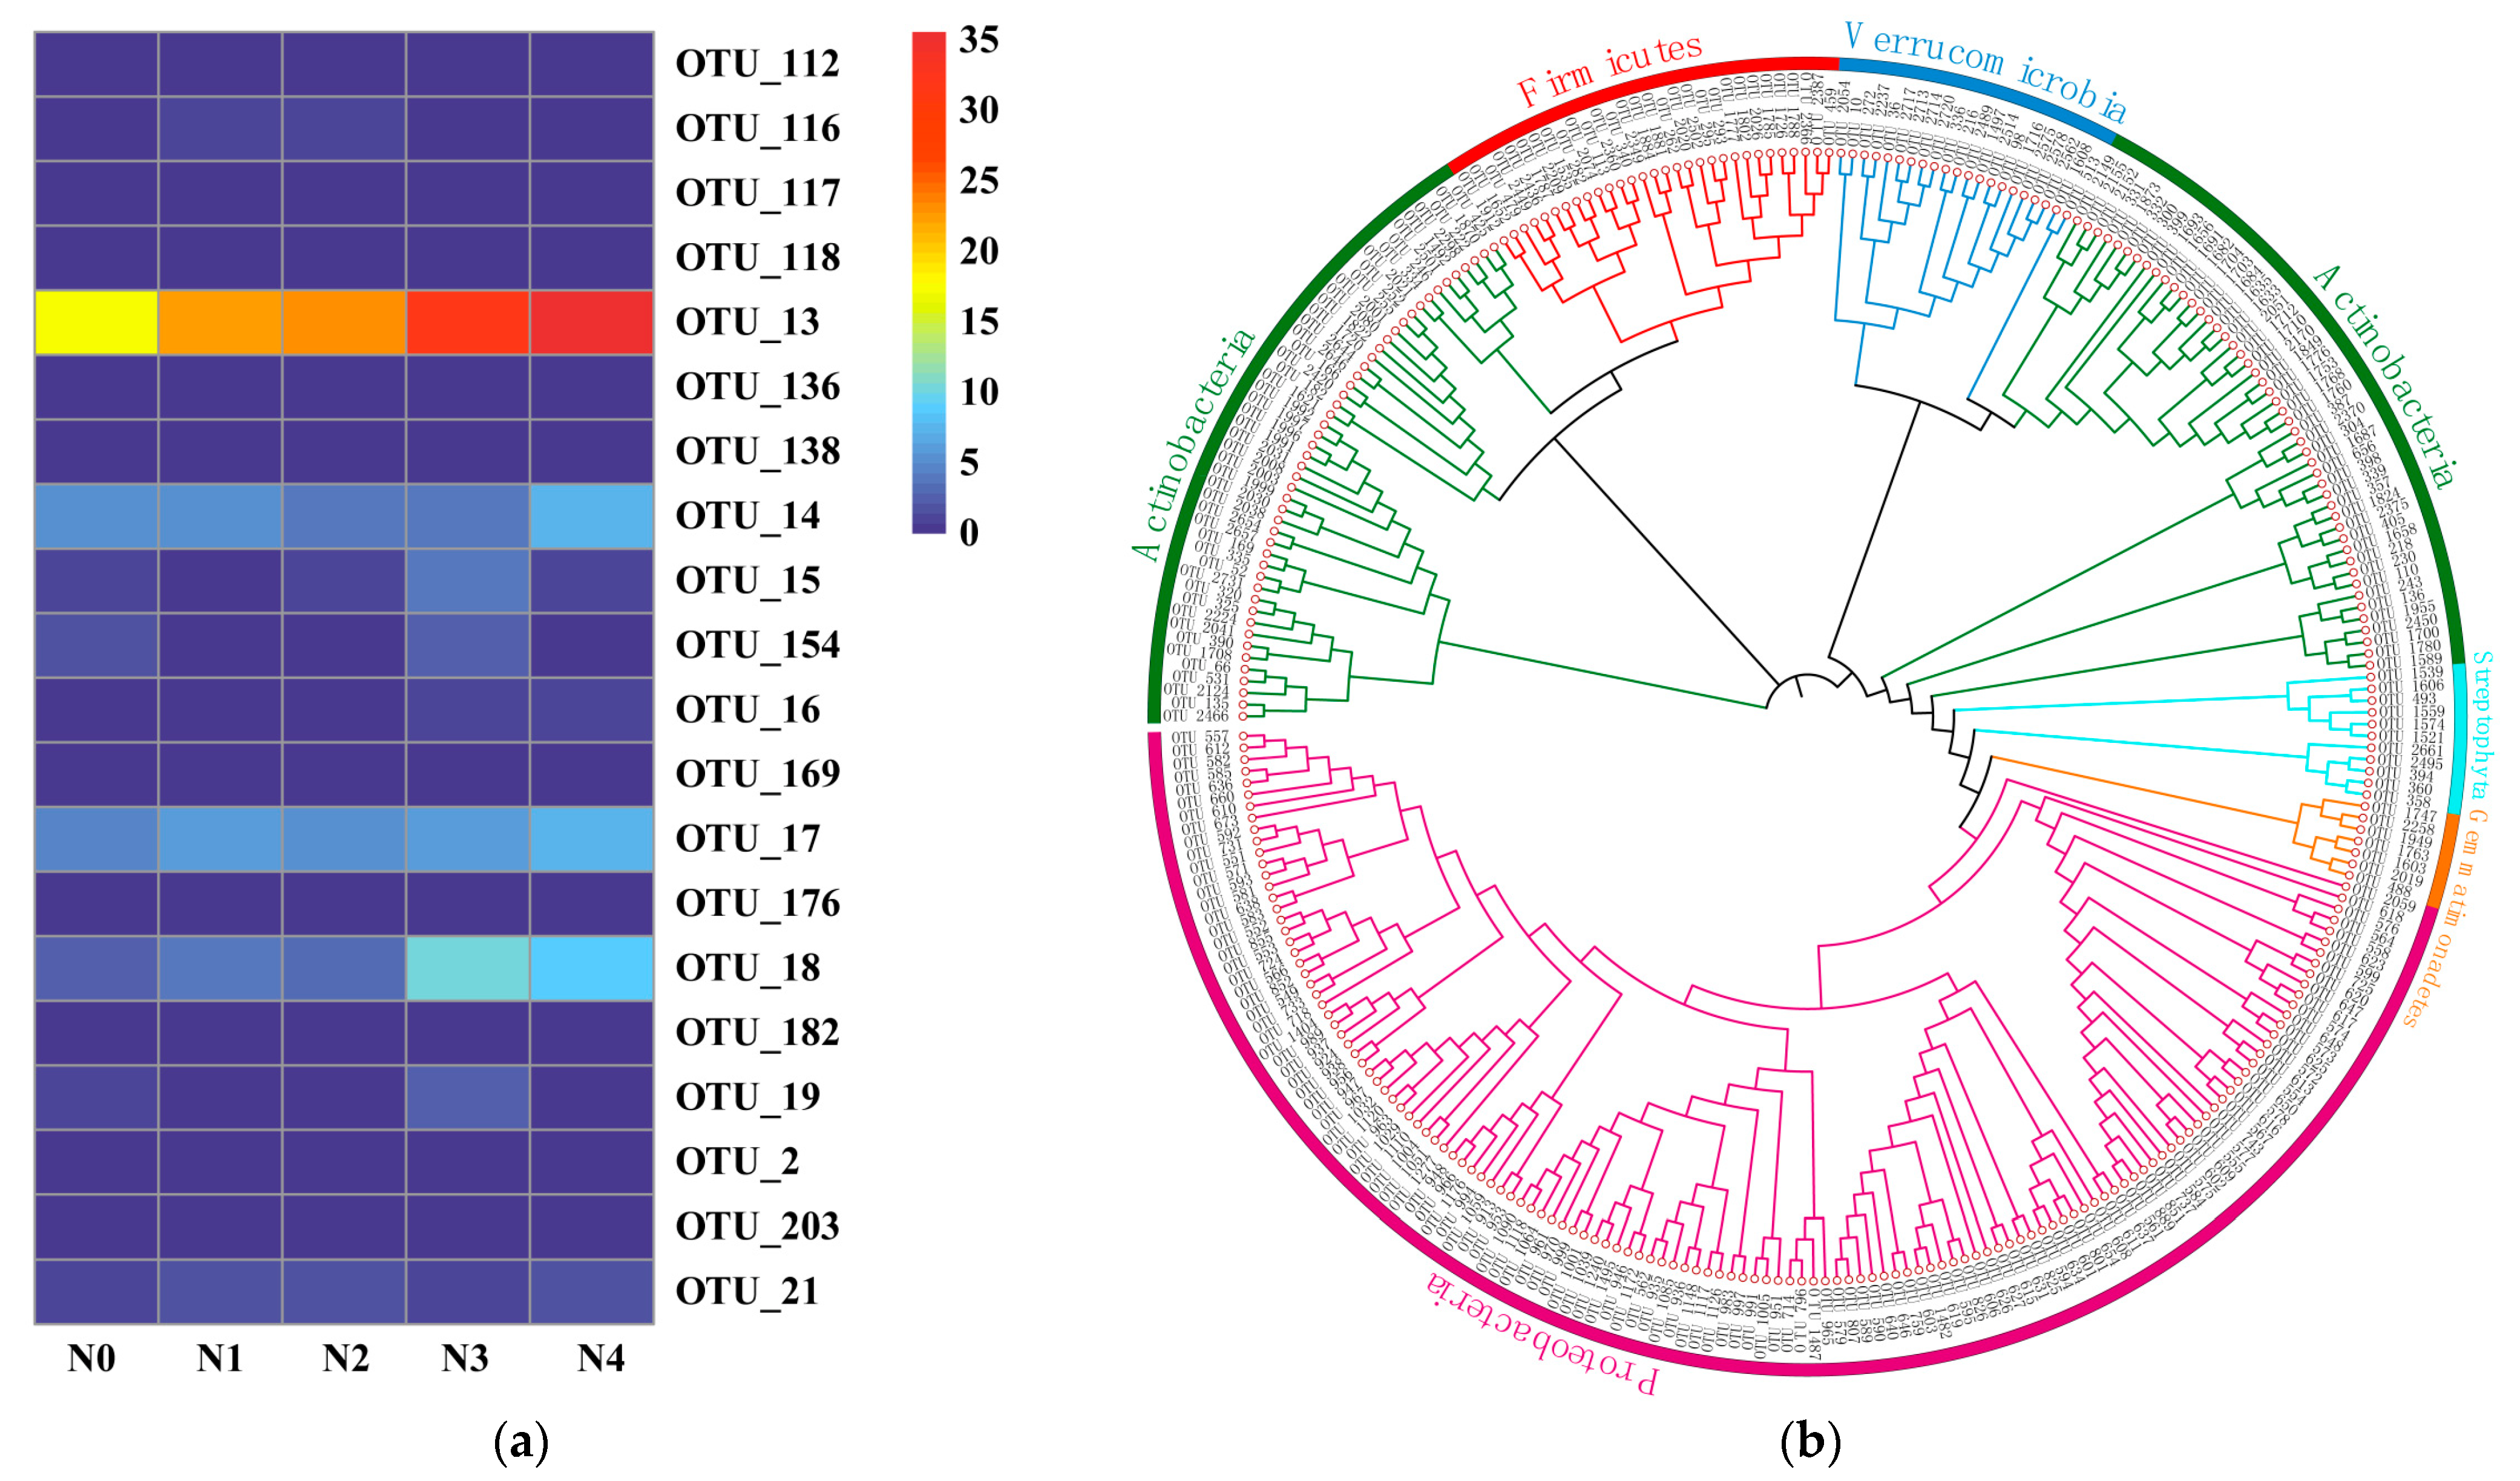
3.4. Compositions of Soil Nitrospira-like NOB Taxa

All samples of the NOB nxrB gene sequenced with Illumina MiSeq yielded 343,050 optimum sequences, with 25,406–157,473 high-quality sequences per sample (Table S3). The phylogenetic tree displayed that the main phyla of Nitrospira-like NOB were Proteobacteria and Actinobacteria (Figure 4b). Venn analysis showed that there were 274 OTUs in the different N application rate treatments (N0, N1, N2, N3, N4), and the 20 OTUs with the highest relative abundance came from the Nitrospira-like NOB community. Under the various N application rates for NOB, OTU13 was the predominant bacteria (Figure 4a), and its relative abundance was 16.06–38.70%, respectively. In contrast to N0, N3 and N4 greatly enhanced the relative abundance of OTU13 (CP011801.1), for which BLAST analysis once more indicated that OTU13 (CP011801.1) may represent Nitrospira moscoviensis (Table S4).

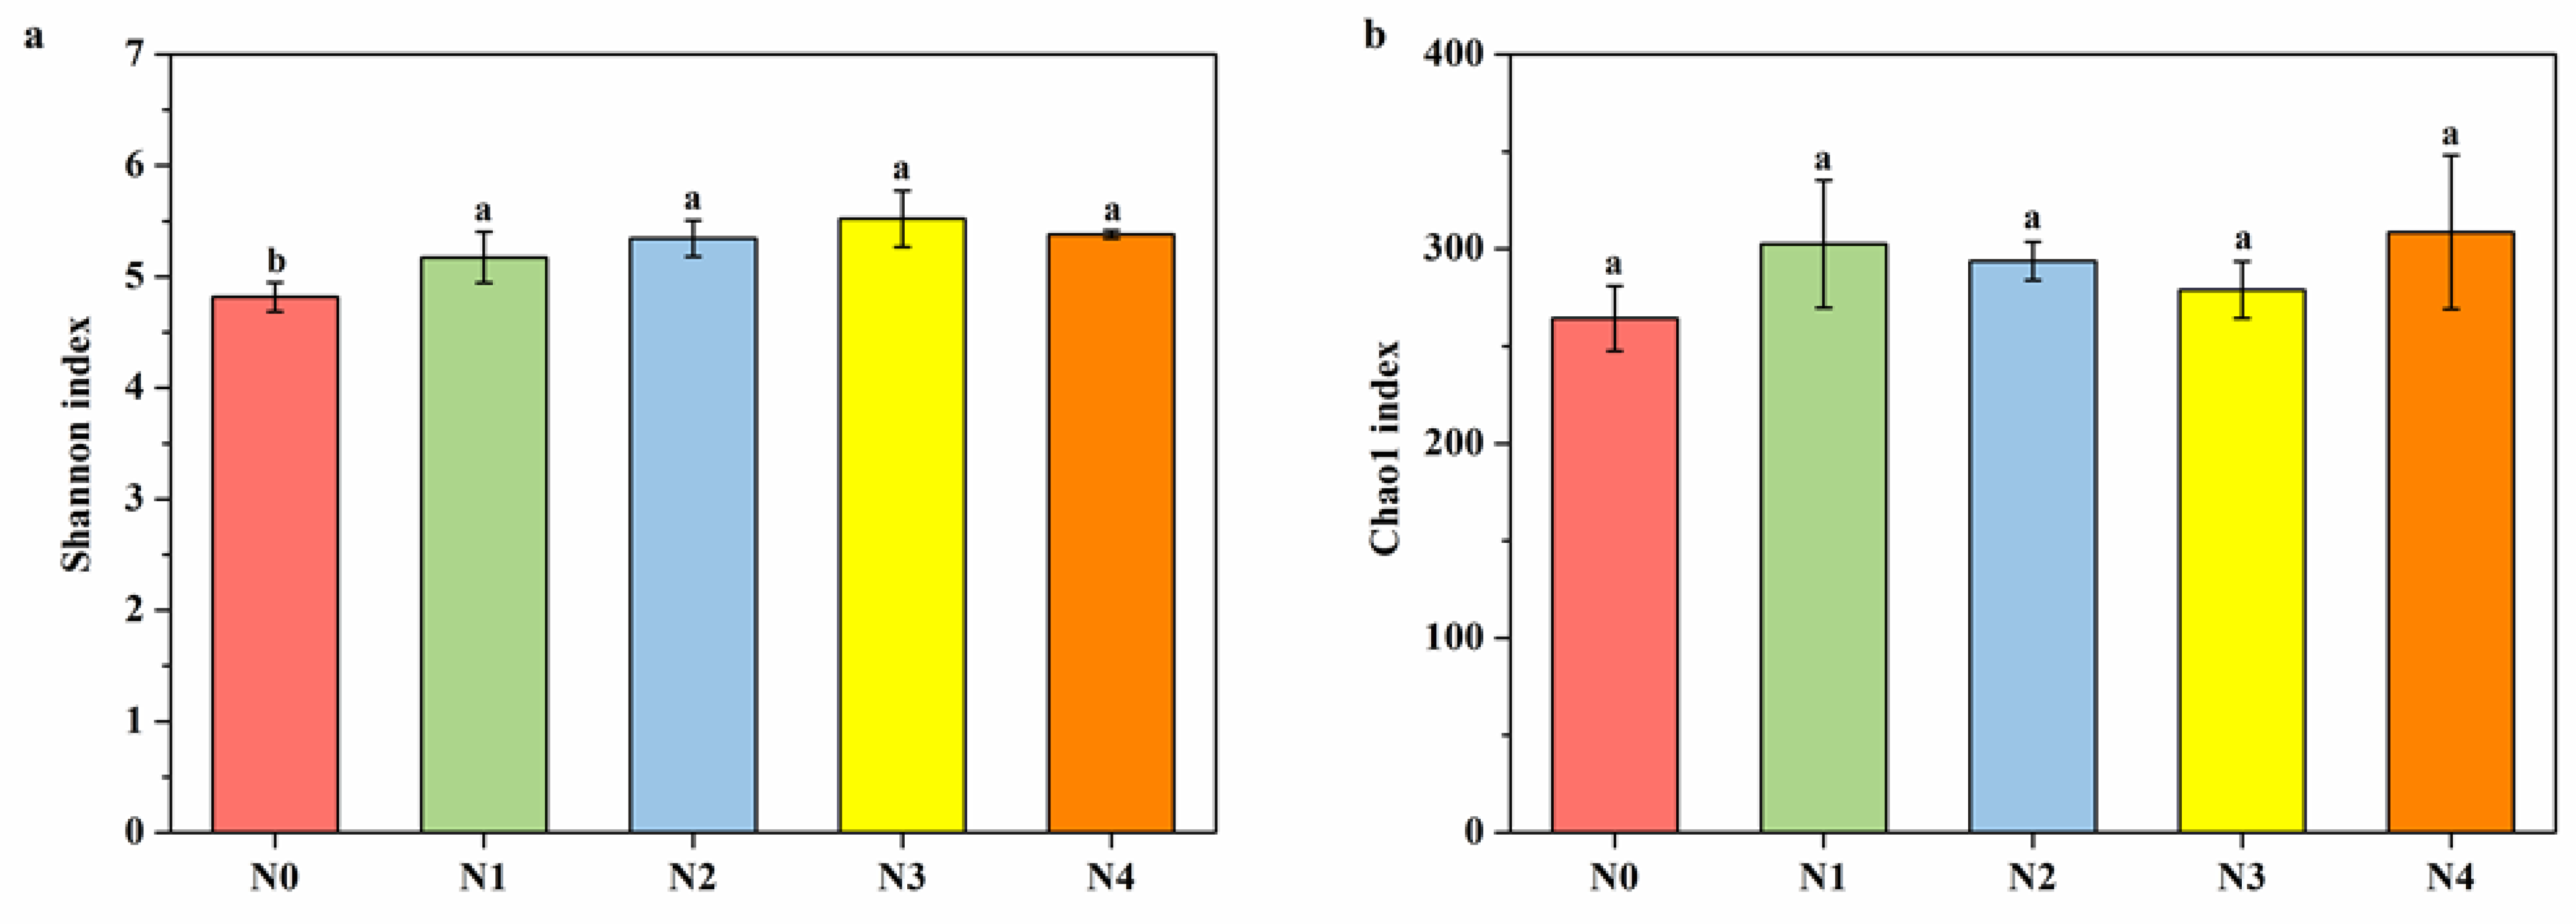
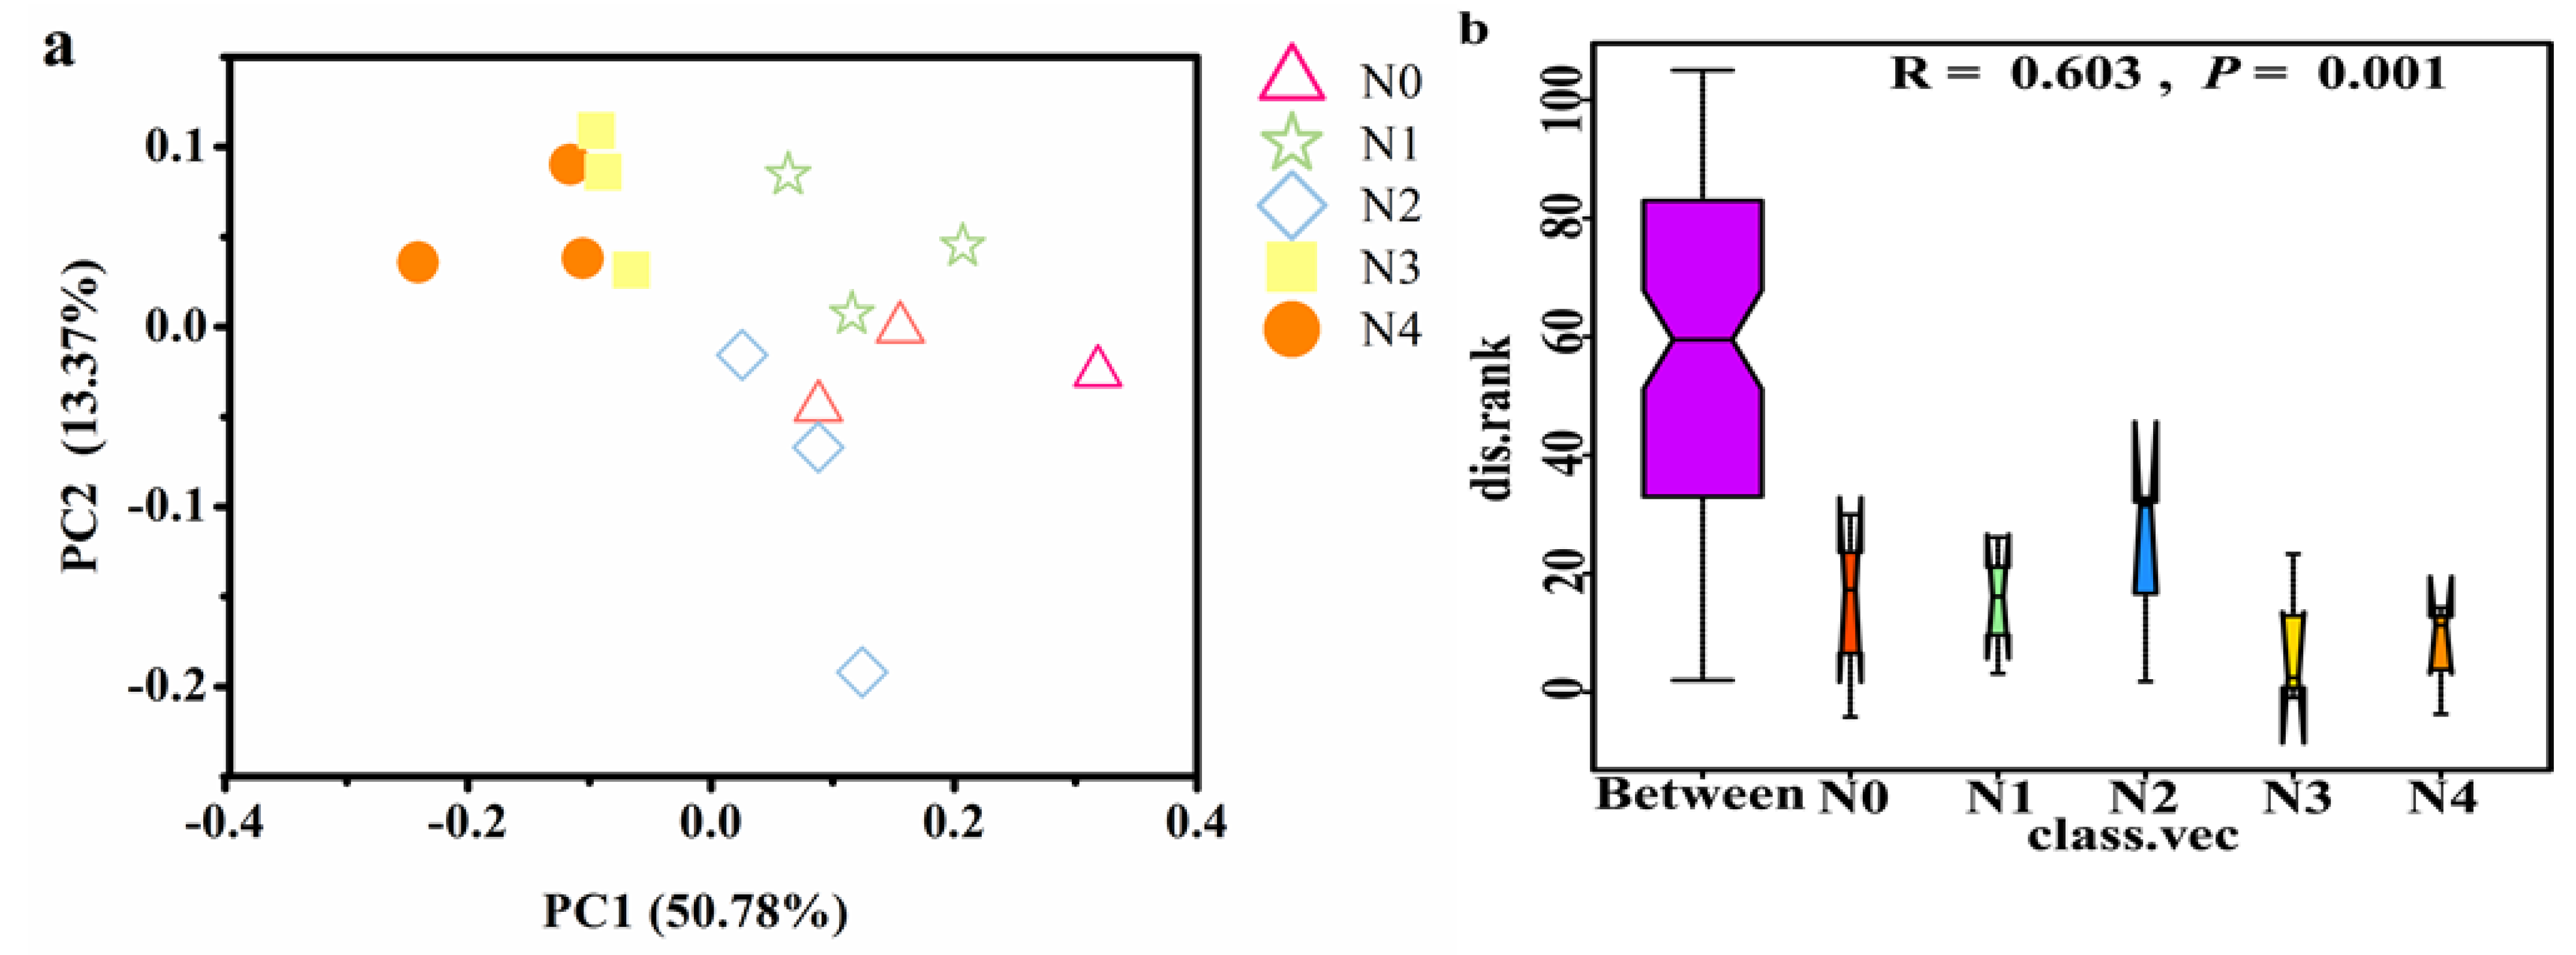
3.5. Diversities of Soil Nitrospira-like NOB

In contrast to N0, N1, N2, N3, and N4 considerably heightened the Shannon diversity of Nitrospira-like NOB, while the Chao1 of Nitrospira-like NOB was not significant (Figure 5). The results based on the Bray–Curtis PCoA of Nitrospira-like NOB under different N application rates showed that Nitrospira-like NOB were significantly divided into two clusters of high-N soil and low-N soil (Figure 6a). The interpretation rate of the first axis of the principal component analysis graph was 38.63%, and the interpretation rate of the second axis was 19.36%. The community structure of Nitrospira-like NOB had a significant distance between low N (N0, N1, N2) and high N application rates (N3, N4), indicating that the community structure of Nitrospira-like NOB has obvious differences under different N application rates (Figure 6a,b).

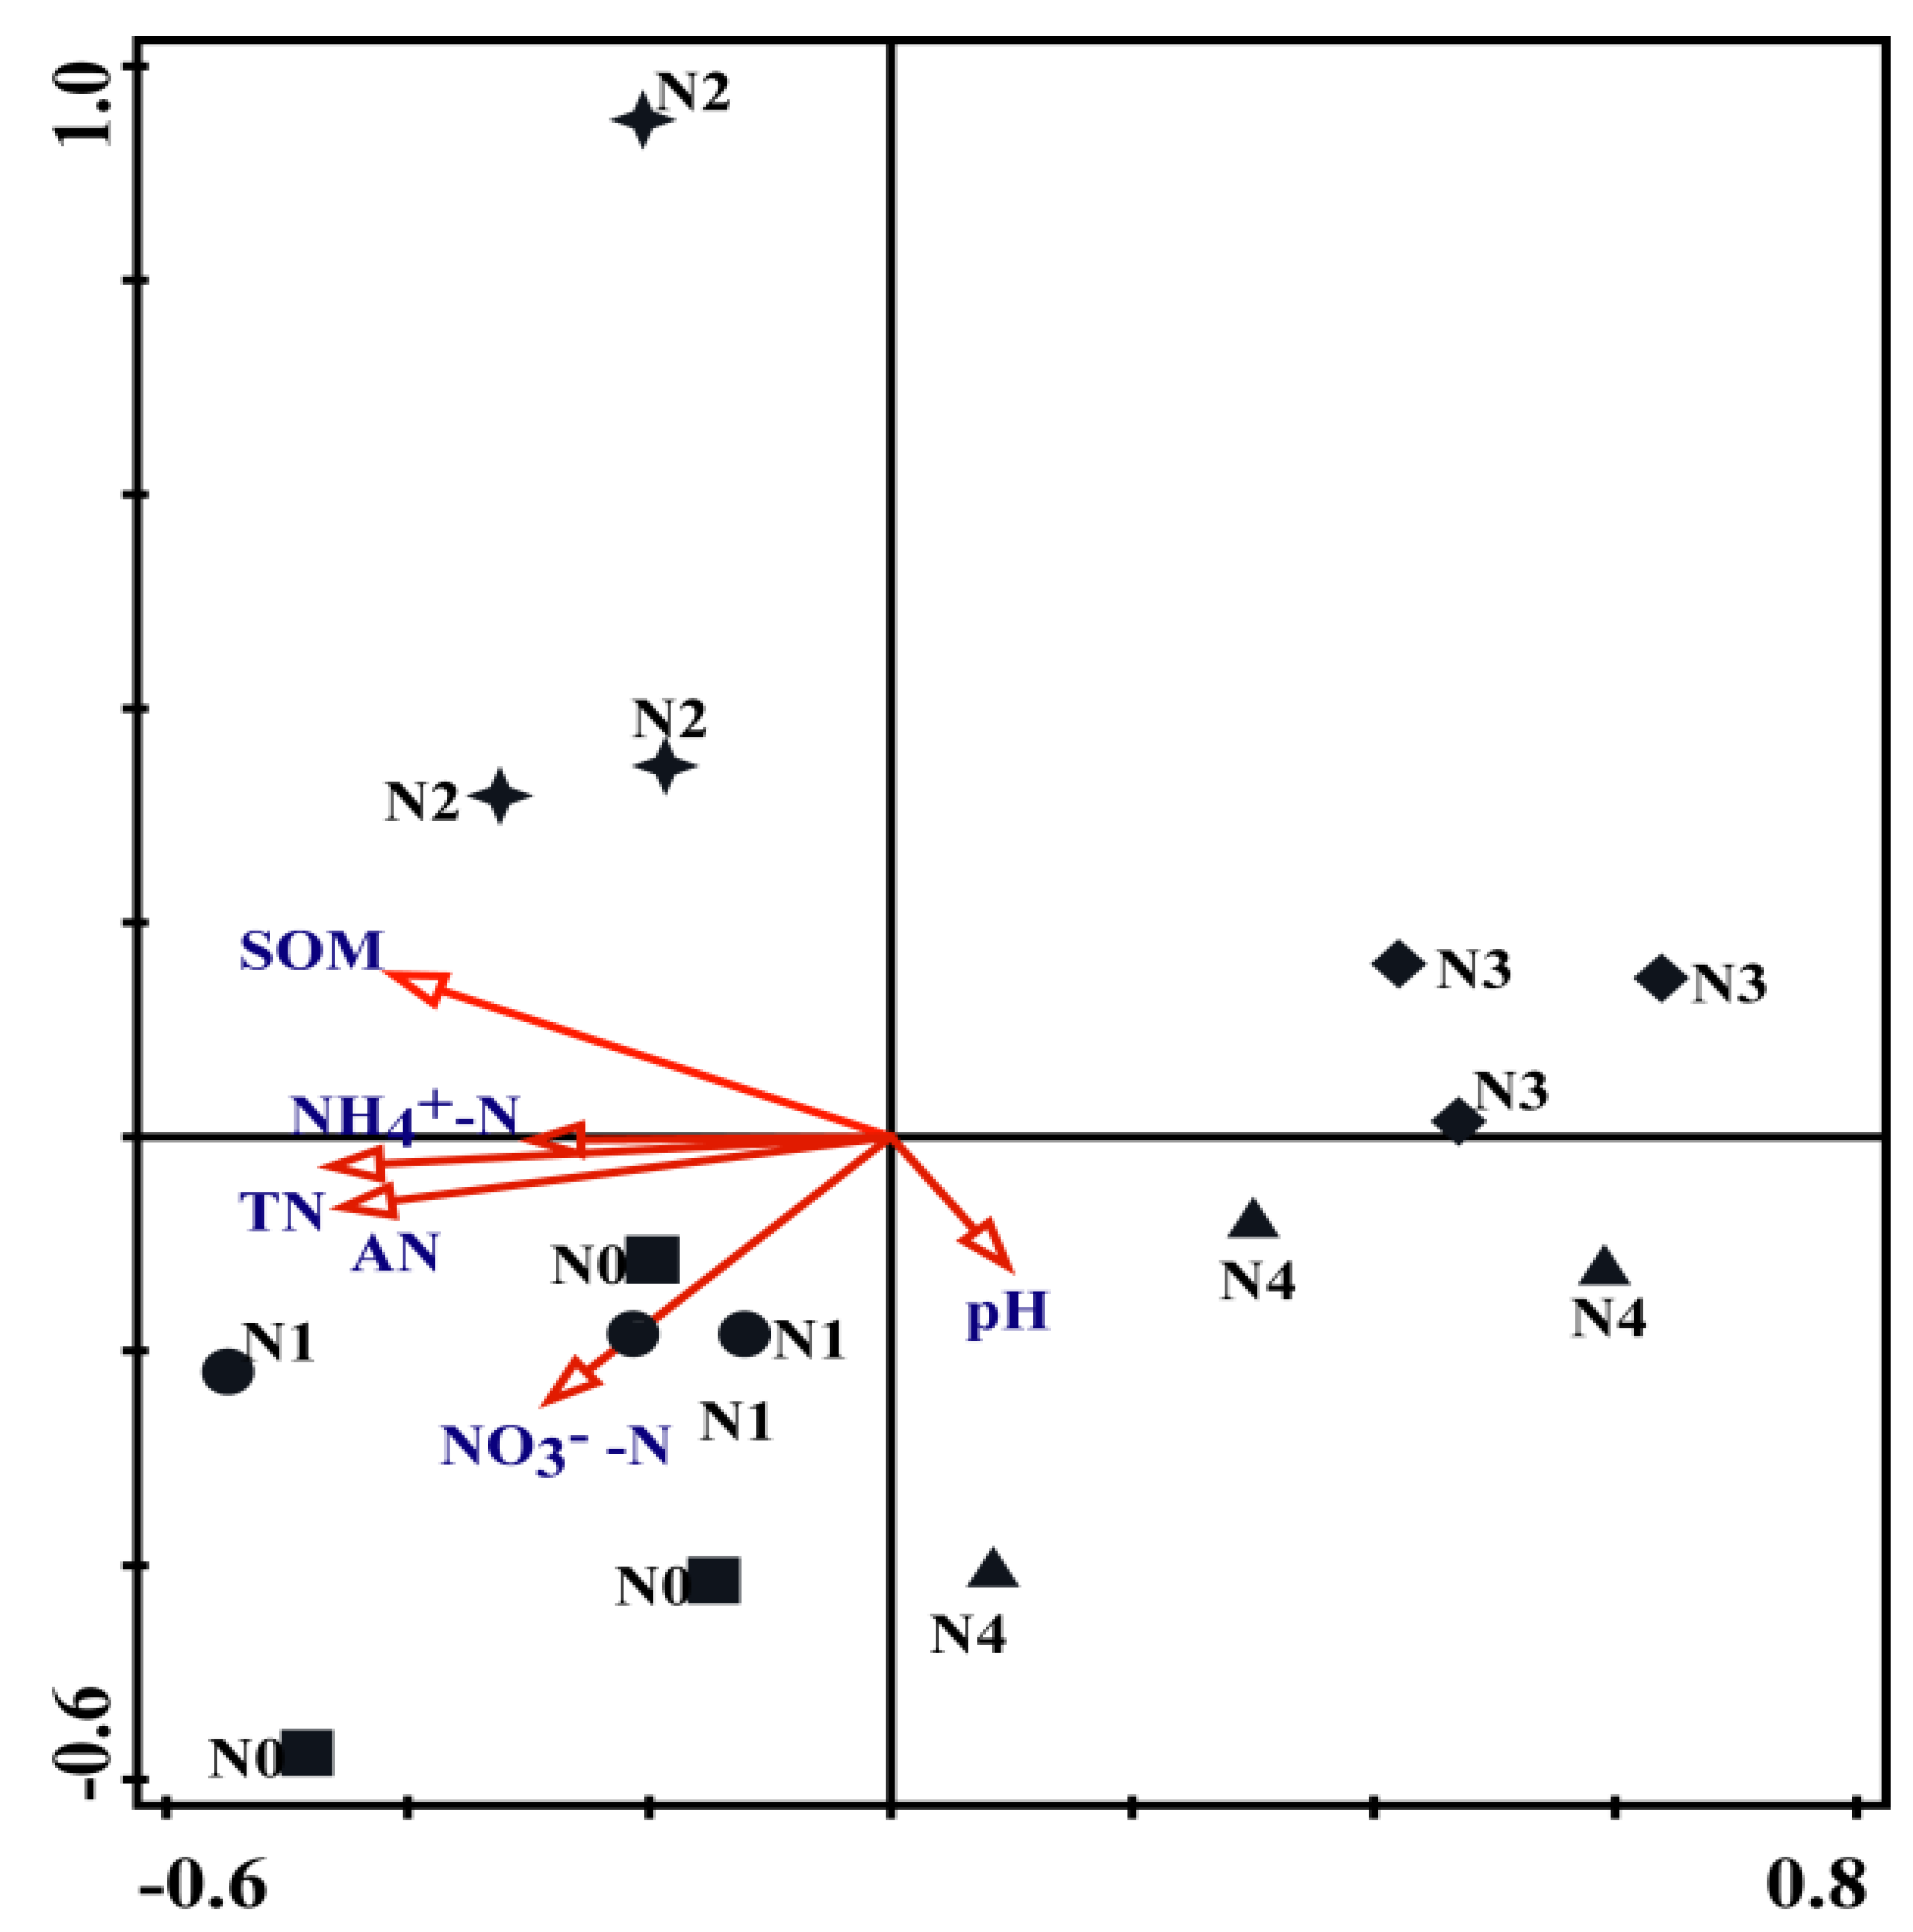
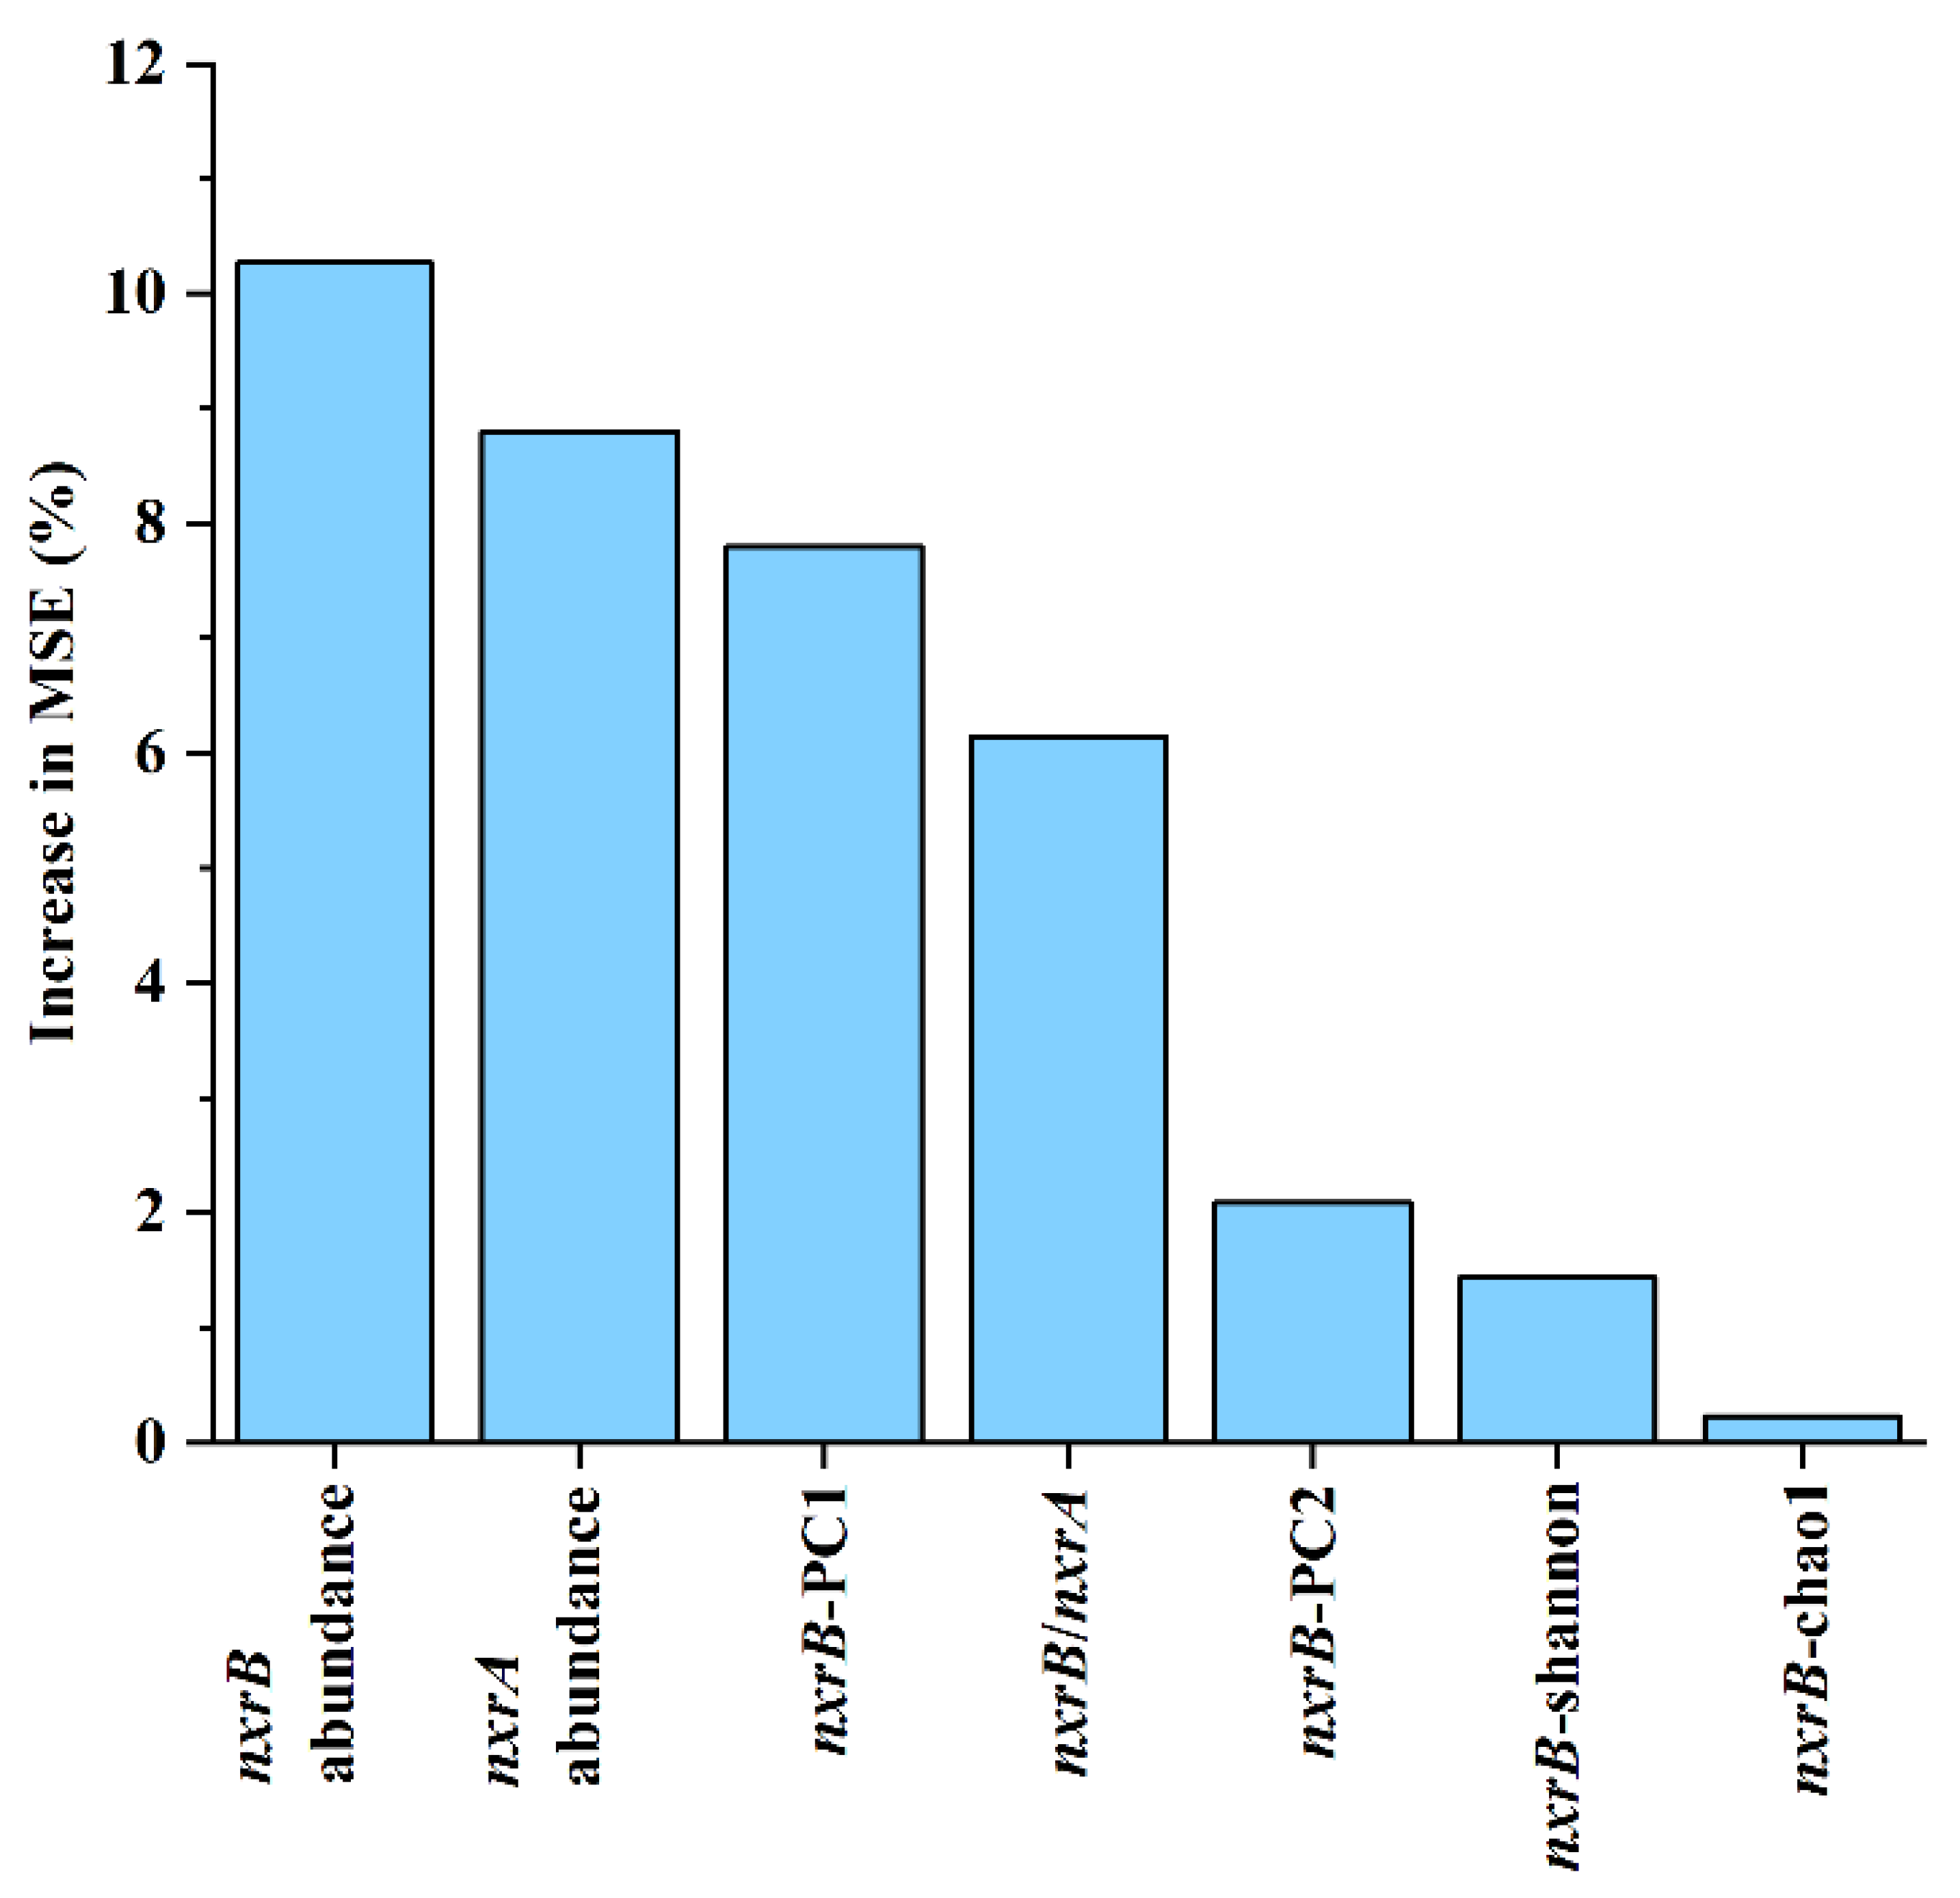
3.6. Drivering Factors of Changes in Soil Nitrospira-like NOB Community

An RDA study revealed that AN was the primary cause of the shift of the Nitrospira-like NOB community structure (p < 0.05) (Figure 7, Table 2), and SOM, TN, NO3-N, NH4+-N, AN, and pH were positively correlated with N0, N1, N2, N3, and N4 (Figure 7). The contribution of Nitrospira- and Nitrobacter-like NOB abundance and microbial features (alpha, beta diversity) to PNO using the random forest analysis suggested that Nitrospira-like NOB abundance (10.26%) had the largest incremental in MSE compared to other components, indicating that Nitrospira-like NOB abundance was a major driving factor for PNO (Figure 8). The SEM was constructed to reveal the direct and indirect effects of soil nutrient content and soil enzyme activity on the biological traits of soil Nitrospira-like NOB under different N application rates (Figure 9). The SEM fully fitted the data (c2/df = 2.15, = 0.14, CFI = 0.99, c2/df = 0.01, = 0.91, CFI = 1.00), and the SEM explained 43.9% of the soil Nitrospira-like NOB community structural changes. AN (λ = 1.71, p < 0.01) had the biggest influence on the structure of Nitrospira-like NOB communities. TN (λ = 0.38), NO3-N (λ = 0.58), NH4+-N (λ = 0.027), and AN (λ = 1.71) had a direct impact on the Nitrospira-like NOB community structure. In addition, NH4+-N, NO3-N, and SOM indirectly affected the community structure of soil Nitrospira-like NOB through soil enzymes.

4. Discussion

4.1. Variations in N Application Rates’ Impact on the Chemical Properties of Soil and Enzyme Activity

SOM is a key indicator of soil health, and it has important functions used to affect and evaluate soil fertility, maize productivity, and soil environment. The findings of this study showed that N fertilization significantly increases SOM, and Singh et al. [37] also showed that N fertilization can increase SOM. N fertilization may affect SOM in two major ways. First, compared with the soil without N fertilization, by encouraging plant development and raising the amount of litter and root biomass in the soil, N fertilizer may raise the content of SOM [38]. Second, N fertilizer can help to replace the SOM lost to the microbial modification or degradation of organic carbon, as well as the litter (leaves, straw, and manure) existing in the soil. This can improve the SOM content and increase carbon fixation in this era of intensive planting systems [39,40,41,42,43,44].
Our research also showed that adding N soil lowered the pH of the soil. Additionally, Zhang et al. [45] demonstrated how N treatment might cause soil acidity. The nitrification reaction of ammonium is the primary source of soil acidity following N application. This is because two hydrogen atoms are released for every mole of ammonium ion that is nitrated. Following N fertilization with urea, there was a rise in nitrate content and a reduction in soil pH [46]. Continuous use of ammoniated fertilizers can acidify the soil, especially with high urea applications [47]. However, when NO3 is leached or N is not taken up by plants, its nitrification process can cause soil acidification. The increase of NO3 and the decrease of NH4+ after N fertilization can also lead to soil acidification [48].
NXR is the key enzyme in nitrification and is mainly involved in the second step of nitrification, converting NO2 into NO3 for plant growth and utilization. In contrast to N0, N3 and N4 considerably elevated the activity of NXR. The results of Chen et al. [49] also revealed that the application of N fertilizer can increase the activity of soil enzymes, and the application of N fertilizer increased the yield of crops and crop residues. The increase of crop residues improves soil fertility, as the activity of soil enzymes directly affects soil nutrients by promoting the decomposition and release of nutrients in litter, thereby increasing the nutrient content in the soil.

4.2. Effects of Different N Application Rates on Soil Nitrospira- and Nitrobacter-like NOB Abundance

Our results showed that the abundance of Nitrospira-like NOB was significantly higher than that of Nitrobacter-like NOB. According to the research of Han et al. [27], the nxrB gene was dominant in soil samples because Nitrospira-like NOB had a greater abundance than Nitrobacter-like NOB. In natural systems with extremely low NO2 concentrations, Nitrospira typically have a dominant role [23,50]. Following N fertilization, the abundance of Nitrospira- and Nitrobacter-like NOB was much higher than that of N0, and the abundance of NOB was significantly higher at high N application rates than at low N fertilizer application rates. This suggested that N input may be a key factor in the abundance of Nitrospira- and Nitrobacter-like NOB. The abundance of Nitrospira increased significantly by changing pH with the addition of lime to an acidic agriculture soil in Oregon [51]. Zhou et al. [52] also showed that the abundance of NOB was higher in high-N soils, which was consistent with the results of this study. This is an indication that NOB prefer fertile soil, and N application can increase SOM and improve soil fertility, thereby increasing the abundance of NOB. We found that PNO was strongly positively correlated with the abundance of Nitrospira- and Nitrobacter-like NOB. Attard et al. also reported that the abundance of Nitrobacter NOB was positively correlated with PNO [35]. Since pH influences not only the growth rate of NOB but also the availability of substrate to NOB, it has a significant impact on the NO2 oxidation process. The impact of pH on NOB activity has been the subject of previous research [53]. Nitrospira-like NOB were sensitive to soil pH change [54]. De Boer and Kowalchuk showed that lower soil pH affected the activity of ammonia oxidizers because the ionization of ammonium increased as the pH decreased, thereby reducing the availability of ammonia [55]. However, there was no significantly negative correlation between PNO and soil pH. At the same time, PNO was significantly correlated with soil SOM, TN, AN, NO3-N, and NH4+-N. These results showed that N fertilizer caused soil acidification, which affected NOB abundance.
According to our research, Nitrospira was significantly more abundant in N3 and N4 than it was in N0, suggesting that high N content creates favorable conditions for methylcyclobacteria. N4 considerably raised the relative abundance of Nitrospira in comparison to N0. Zhong et al. [56] discovered that the application of N contributed to the relative abundance of Nitrospira, a finding that aligned with the findings of this investigation. Nitrospira can enhance the plant absorption of N and the N cycle [57]. In summary, the higher the N fertilizer application rate, the richer the nitrifying microorganisms, the stronger the nitrification effect, and the more favorable the process by which plants absorb N.

4.3. Relationship between Environmental Factors and Nitrospira-like NOB Community Structure

Compared with N0, the amount of N application (N1, N2, N3, N4) considerably elevated the diversity of Nitrospira-like NOB. Han et al. indicated that the α-diversity of Nitrospira-like NOB community changed significantly under different fertilization treatments [27]. NOB are not only completely oligotrophic, but they can also grow through trophic or mixed trophic metabolism [25]. As such, the additional N can provide more metabolic substrates for NOB and increase the diversity of NOB. This study showed that the community structure of Nitrospira-like NOB was affected by the amount of N application, which concurred with Liu et al.’s [58] conclusions, which also showed that the community structure of NOB was related to the addition of inorganic N. Han et al. [59] revealed that TN was the important environmental factor that regulated the Nitrospira-like NOB community structure under various fertilization regimes. Freitag et al. manifested that the community structure of Nitrospira-like NOB under fertilizer management was more diverse than those without fertilizer management [60]. The community structure of Nitrospira-like NOB was affected by NO3-N and NH4+-N, which can provide more substrate for NOB utilization. Different subtypes of NOB responded differently to inorganic N. For example, Nitrospira responded most positively to NH4+-N, while other lineages had the most obvious impact on NO3-N. RDA analysis and the SEM study showed that AN had the biggest influence on the NOB community structure, as similarly reported by Liu et al. [58]. Inorganic N can meet the needs of different nitrite species and metabolisms, thereby increasing the diversity of soil NOB. The random forest analysis indicated that Nitrospira-like NOB abundance was the most important factor affecting PNO. The Nitrospira-like NOB community may be the driving factor for the regulation of nitrite oxidation processes in different N application rates under a mulched fertigation system. Han et al. [27] and Attard et al. [35] also considered that Nitrospira-like NOB, rather than Nitrobacter-like NOB, play a major role in low activity soils. Ouyang and Norton [9] also showed that Nitrospira was reported as the dominant NOB (>99.7%) in an agriculture site in Utah, USA. Our results suggest that Nitrospira-like NOB were the key functional players of NOB communities under N fertilizer addition in the mulched drip irrigation system and that the variation in PNO was attributed to the Nitrospira-like NOB community.

5. Conclusions

The contents of soil nutrients (SOM, TN, NO3-N, and NH4+-N) rose significantly with an increase in N fertilizer addition among 0–270 kg ha−1; however, the pH decreased significantly. High rates of N application greatly raised PNR, PNO, and NXR activity in the soil. N fertilization significantly increased the abundance of Nitrospira- and Nitrobacter-like NOB. Nitrospira moscoviensis was the dominant bacterium of Nitrospira-like NOB, and its relative abundance was significantly higher in the soil with high N fertilization than in the soil without N fertilization. The community structure of Nitrospira-like NOB was mainly affected by the amounts of N fertilizer addition. TN, NO3-N, NH4+-N, and AN had a direct impact on the community structure of Nitrospira-like NOB, and AN had the greatest impact on the community structure of Nitrospira-like NOB. Nitrospira-like NOB played a major role in the variation of PNO in different N application rates under a mulched fertigation system. In conclusion, N fertilizer can cause soil acidification, which affects NOB abundance and community structure. We recommend 210 kg ha−1 of N fertilizer as the optimal application rate for spring maize cropping under film drip irrigation in Northeast China. This study presents a theoretical framework for the process and adjustments in the NOB community caused by various N fertilizer management practices in cropland under film drip irrigation in Northeast China.

Supplementary Materials

The following supporting information can be downloaded at: https://www.mdpi.com/article/10.3390/agronomy13122909/s1, Table S1. Drip fertigation methods. Table S2. The correlation analysis among soil properties and soil enzymes under different N application rates. Table S3. Illumina MiSeq sequenced NOB data (at 97% sequence similarity) based on the nxrB gene. Table S4. The BLAST of NOB at NCBI. Figure S1. The map of experiment site. Figure S2. The plot experiment design. Figure S3. The correlation analysis among soil PNR, PNO, nitrification microbial abundance and soil properties under N application rates. SOM, soil organic matter; TN, total nitrogen; AN, available nitrogen; NH4+-N, ammonium nitrogen; NO3-N, nitrate nitrogen; PNR, potential nitrification rate. PNO, potential nitrite oxidation.

Author Contributions

Conceptualization, H.L.; Methodology, M.W. and B.S.; Software, Q.L. and Y.Q.; Data curation, X.F. and C.L.; Writing—original draft, Y.Y.; Writing—review & editing, J.Z.; Funding acquisition, H.L. All authors have read and agreed to the published version of the manuscript.

Funding

This study was funded by the Jilin Province Science and Technology Development Program (Grant numbers 20220203022SF, 20220101176JC, 20210101028JC).

Data Availability Statement

The gene sequences obtained in this study were submitted to NCBI and were assigned the accession number SRP455972.

Conflicts of Interest

The authors declare that the research was conducted in the absence of any commercial or financial relationships that could be construed as a potential conflict of interest.

References

  1. Vesco, L.G.; Santos, D.F.C.C.; Bruno, S.E.S.D. Interactive effects of increased plant density, cultivars and N rates in environments with different cotton yield recovery potential. Ind. Crops Prod. 2022, 176, 176. [Google Scholar] [CrossRef]
  2. Pasley, H.R.; Cairns, J.E.; Camberato, J.J.; Vyn, T.J. Nitrogen fertilizer rate increases plant uptake and soil availability of essential nutrients in continuous maize production in Kenya and Zimbabwe. Nutr. Cycl. Agroecosyst. 2019, 115, 373–389. [Google Scholar] [CrossRef] [PubMed]
  3. Ronga, D.; Pentangelo, A.; Parisi, M. Optimizing N fertilization to improve yield, technological and nutritional quality of tomato grown in high fertility soil conditions. Plants 2020, 9, 575. [Google Scholar] [CrossRef] [PubMed]
  4. Babita, A.; Roshni, G.F.A.C. Nitrous oxide emission in altered nitrogen cycle and implications for climate change. Environ. Pollut. 2022, 314, 120272. [Google Scholar] [CrossRef]
  5. Cao, M.; Zhu, Y.; Lv, G. Spatial distribution of global cultivated land and its variation between 2000 and 2010, from both agro-eecological and geopolitical perspectives. Sustainability 2019, 11, 1242. [Google Scholar] [CrossRef]
  6. Yan, D.H.; Wu, S.H.; Tang, Y.S. Arable land and water footprints for food consumption in China: From the perspective of urban and rural dietary change. Sci. Total Environ. 2022, 838, 155749. [Google Scholar] [CrossRef] [PubMed]
  7. He, R.; Shao, C.; Shi, R. Development trend and driving factors of aagricultural chemical fertilizer efficiency in China. Sustainability 2020, 12, 4607. [Google Scholar] [CrossRef]
  8. Wei, W.; Yang, M.; Liu, Y.; Huang, H.; Ye, C.; Zheng, J.; Guo, C.; Hao, M.; He, X.; Zhu, S. Fertilizer N application rate impacts plant-soil feedback in a sanqi production system. Sci. Total Environ. 2018, 633, 796–807. [Google Scholar] [CrossRef]
  9. Norton, J.; Ouyang, Y. Controls and adaptive management of nitrification in agricultural soils. Front. Microbiol. 2019, 10, 1931. [Google Scholar] [CrossRef]
  10. Shitu, A.; Zhu, S.; Qi, W. Performance of novel sponge biocarrier in MBBR treating recirculating aquaculture systems wastewater: Microbial community and kinetic study. J. Environ. Manag. 2020, 275, 111264. [Google Scholar] [CrossRef]
  11. Bohsale, R.R.; Almomani, F. Optimizing nutrient removal of moving bed biofilm reactor process using response surface methodology. Bioresour. Technol. 2020, 305, 123059. [Google Scholar] [CrossRef]
  12. Mehrani, M.J.; Lu, X.; Kowal, P. Incorporation of the complete ammonia oxidation (comammox) process for modeling nitrification in suspended growth wastewater treatment systems. J. Environ. Manag. 2021, 297, 113223. [Google Scholar] [CrossRef] [PubMed]
  13. Miao, Y.Y.; Zhang, L.; Yu, D.S.; Zhang, J.H.; Zhang, W.K.; Ma, G.C.; Zhao, X.C.; Peng, Y.Z. Application of intermittent aeration in nitrogen removal process: Development, advantages and mechanisms. Chem. Eng. 2021, 10, 1016. [Google Scholar] [CrossRef]
  14. Nicol, G.W.; Leininger, S.; Schleper, C.; Prosser, J.I. The influence of soil pH on the diversity, abundance and transcriptional activity of ammonia oxidizing archaea and bacteria. Environ. Microbiol. 2008, 10, 2966–2978. [Google Scholar] [CrossRef] [PubMed]
  15. Taylor, A.E.; Myrold, D.D.; Bottomley, P.J. Temperature affects the kinetics of nitrite oxidation and nitrification coupling in four agricultural soils. Soil Biol. Biochem. 2019, 136, 107523. [Google Scholar] [CrossRef]
  16. Gelfand, I.; Yakir, D. Influence of nitrite accumulation in association with seasonal patterns and mineralization of soil nitrogen in a semi-arid pine forest. Soil Biol. Biochem. 2008, 40, 415–424. [Google Scholar] [CrossRef]
  17. Noriega-Hevia, G.; Mateo, o.; Maciá, A.; Lardín, C.; Pastor, L.; Serralta, J.; Bouzas, A. Experimental sulphide inhibition calibration method in nitrification processes: A case-study. J. Environ. Manag. 2020, 274, 111191. [Google Scholar] [CrossRef]
  18. Wu, J.; Kong, Z.; Luo, Z.B.; Qin, Y.; Rong, C.; Wang, T.J.; Hanaoka, T.; Sakemi, S.; Ito, M.; Kobayashi, S.; et al. A successful start-up of an anaerobic membrane bioreactor (AnMBR) coupled mainstream partial nitritation-anammox (PN/A) system: A pilot-scale study on insitu NOB elimination, AnAOB growth kinetics, and mainstream treatment performance. Water Res. 2021, 207, 117783. [Google Scholar] [CrossRef]
  19. Wang, J.; Zhang, L.; Lu, Q. Ammonia oxidizer abundance in paddy soil profile with different fertilizer regimes. Appl. Soil Ecol. 2014, 84, 38–44. [Google Scholar] [CrossRef]
  20. Spieck, E.; Bock, E. The lithoautotrophic nitrite oxidizing bacteria. Bergey’s Man. Syst. Bacteriol. 2005, 2, 149–153. [Google Scholar] [CrossRef]
  21. Poly, F.; Wertz, S.; Brothier, E.; Degrange, V. First exploration of Nitrobacter diversity in soils by a PCR cloning-sequencing approach targeting functional gene nxrA. FEMS Microbiol. Ecol. 2008, 63, 132–140. [Google Scholar] [CrossRef] [PubMed]
  22. Pester, M.; Maixner, F.; Berry, D.; Rattei, T.; Koch, H.; Lucker, S. NxrB encoding the beta subunit of nitrite oxidoreductase as functional and phylogenetic marker for nitrite-oxidizing Nitrospira. Environ. Microbiol. 2014, 16, 3055–3071. [Google Scholar] [CrossRef] [PubMed]
  23. Li, X.; Wan, W.; Zheng, L. Community assembly mechanisms and co-occurrence patterns of nitrite-oxidizing bacteria communities in saline soils. Sci. Total Environ. 2021, 772, 145472. [Google Scholar] [CrossRef] [PubMed]
  24. Xia, Y.; Wen, X.; Zhang, B. Diversity and assembly patterns of activated sludge microbial communities: A review. Biotechnol. Adv. 2018, 36, 1038. [Google Scholar] [CrossRef] [PubMed]
  25. Wertz, S.; Leigh, A.K.; Grayston, S.J. Effects of long-term fertilization of forest soils on potential nitrification and on the abundance and community structure of ammonia oxidizers and nitrite oxidizers. FEMS Microbiol. Ecol. 2012, 79, 142–154. [Google Scholar] [CrossRef] [PubMed]
  26. Ke, X.; Angel, R.; Lu, Y.; Conrad, R. Niche differentiation of ammonia oxidizers and nitrite oxidizers in rice paddy soil. Environ. Microbiol. 2013, 15, 2275–2292. [Google Scholar] [CrossRef] [PubMed]
  27. Han, S.; Luo, X.; Liao, H.; Nie, H.; Chen, W.; Huang, Q. Nitrospira are more sensitive than Nitrobacter to land management in acid, fertilized soils of a rapeseed-rice rotation field trial. Sci. Total Environ. 2017, 599–600, 135–144. [Google Scholar] [CrossRef]
  28. Yeomans, J.C.; Bremner, J.M. A rapid and precise method for routine determination of organic carbon in soil. Commun. Soil Sci. Plant Anal. 1988, 19, 1467–1476. [Google Scholar] [CrossRef]
  29. Takamoto, A.; Takahashi, T.; Togami, K. Estimation models from soil pH with a solid-to-liquid ratio of 1,2.5 to pH measured by other methods using soils in Japan. Soil Sci. Plant Nutr. 2023, 69, 190–198. [Google Scholar] [CrossRef]
  30. Michatowski, T.; Tadeusz, A.G. The Titration in the Kjeldahl Method of Nitrogen Determination: “Base or Acid as Titrant?”. J. Chem. Educ. 2013, 90, 191–197. [Google Scholar] [CrossRef]
  31. Lu, R. Soil and Agro-Chemical Analytical Methods; China Agricultural Science and Technology Press: Beijing, China, 1999. [Google Scholar]
  32. Jaynes, D.B.; Colvin, T.S.; Karlen, D.L. Nitrate loss in subsurface drainage as affected by nitrogen fertilizer rate. Environ. Qual. 2001, 30, 1305–1314. [Google Scholar] [CrossRef] [PubMed]
  33. Porteous, L.A.; Armstrong, J.L.; Seidler, R.J.; Watrud, L.S. An effective method to extractDNA from environmental—Samples for polymerase chain-reaction amplification andDNA fingerprint analysis. Curr. Microbiol. 1994, 29, 301–307. [Google Scholar] [CrossRef] [PubMed]
  34. Wertz, S.; Degrange, V.; Prosser, J.I. Decline of soil microbial diversity does not influence the resistance and resilience of key soil microbial functional groups following a model disturbance. Environ. Microbiol. 2007, 9, 2211–2219. [Google Scholar] [CrossRef] [PubMed]
  35. Attard, E.; Poly, F.; Commeaux, C.; Laurent, F.; Terada, A.; Smets, B.F. Shifts between Nitrospira- and Nitrobacter-like nitrite oxidizers underlie the response of soil potential nitrite oxidation to changes in tillage practices. Environ. Microbiol. 2010, 12, 315–326. [Google Scholar] [CrossRef] [PubMed]
  36. Feng, X.W.; Wang, M.; Li, Q.; Qin, Y.B.; Sun, B.; Tan, P.; Liu, H.; Li, C.L.; Zhang, J.J. Comammox dominate soil nitrification under different N fertilization regimes in semi-arid areas of Northeast China. Appl. Soil Ecol. 2024, 193, 105119. [Google Scholar]
  37. Singh, B.K.; Bardgett, R.D.; Smith, P.; Reay, D.S. Reay Microorganisms and climate change: Terrestrial feedbacks and mitigation options. Nat. Rev. Microbiol. 2010, 8, 779–790. [Google Scholar] [CrossRef] [PubMed]
  38. Mary, B.; Recous, S.; Darwis, D.; Robin, D. Interactions between decomposition of plant residues and nitrogen cycling in soil. Plant Soil 1996, 181, 71–82. [Google Scholar] [CrossRef]
  39. Cong, R.; Xu, M.; Wang, X.; Zhang, W.; Yang, X.; Wang, H.B. An analysis of soil carbon dynamics in long-term soil fertility trials in China. Nutr. Cycl. Agroecosystems 2012, 93, 201–213. [Google Scholar] [CrossRef]
  40. Ghimire, R.; Lamichhane, S.; Acharya, B.S. Tillage, crop residue, and nutrient management effects on soil organic carbon in rice-based cropping systems: A review. J. Integr. Agric. 2017, 16, 1–15. [Google Scholar] [CrossRef]
  41. Gong, W.; Yan, X.; Wang, J.; Hu, t.; Gong, Y. Long-term manure and fertilizer effects on soil organic matter fractions and microbes under a wheat–maize cropping system in northern China. Geoderma 2009, 149, 318–324. [Google Scholar] [CrossRef]
  42. Manna, M.C.; Swarup, A.; Wanjari, R.H.; Mishra, B.; Shahi, D.K. Long-term fertilization, manure and liming effects on soil organic matter and crop yields. Soil Tillage Res. 2007, 94, 397–409. [Google Scholar] [CrossRef]
  43. Purakayastha, T.J.; Rudrappa, L.; Singh, D.; Swarup, A.; Bhadraray, S. Long-term impact of fertilizers on soil organic carbon pools and sequestration rates in maize–wheat–cowpea cropping system. Geoderma 2008, 144, 370–378. [Google Scholar] [CrossRef]
  44. Tian, J.; Lou, Y.; Gao, Y.; Fang, H.; Liu, S. Response of soil organic matter fractions and composition of microbial community to long-term organic and mineral fertilization. Biol. Fertil. Soils 2017, 53, 523–532. [Google Scholar] [CrossRef]
  45. Zhang, Y.; Ye, C.; Su, Y.; Peng, W.; Lu, R.; Liu, Y. Soil acidification caused by excessive application of nitrogen fertilizer aggravates soil-borne diseases: Evidence from literature review and field trials. Agric. Ecosyst. Environ. 2022, 340, 108–116. [Google Scholar] [CrossRef]
  46. Bolan, N.S.; Hedley, M.J. Role of carbon, nitrogen, and sulfur cycles in soil acidification. In Handbook of Soil Acidity; CRC Press: Boca Raton, FL, USA, 2003; pp. 43–70. [Google Scholar] [CrossRef]
  47. Dal Molin, S.J.; Ernani, P.R.; Gerber, J.M. Soil acidification and nitrogen release following application of nitrogen fertilizers. Commun. Soil Sci. Plant Anal. 2020, 51, 2551–2558. [Google Scholar] [CrossRef]
  48. Schroder, J.L.; Zhang, H.; Girma, K.; Raun, W.R.; Penn, C.J. Soil acidification from long-term use of nitrogen fertilizers on winter wheat. Soil Sci. Soc. Am. J. 2011, 75, 957–964. [Google Scholar] [CrossRef]
  49. Chen, Y.; Liu, J.; Liu, S. Effect of long-term mineral fertilizer application on soil enzyme activities and bacterial community composition. Plant Soil Environ. 2018, 64, 571–577. [Google Scholar] [CrossRef]
  50. Wu, Z.; Gao, J.; Cui, Y. Metagenomics insights into the selective inhibition of NOB and comammox by phenacetin: Transcriptional activity, nitrogen metabolism and mechanistic understanding. Sci. Total Environ. 2022, 803, 150068. [Google Scholar] [CrossRef] [PubMed]
  51. Yin, C.; Schlatter, D.C.; Kroese, D.R. Impacts of lime application on soil bacterial microbiome in dryland wheat soil in the Pacific Northwest. Appl. Soil Ecol. 2021, 168, 104113. [Google Scholar] [CrossRef]
  52. Zhou, X.; Fornara, D.; Wasson, E.A.; Wang, D.; Ren, G.; Christie, P.; Jia, Z. Effects of 44 years of chronic nitrogen fertilization on the soil nitrifying community of permanent grassland. Soil Biol. Biochem. 2015, 91, 76–83. [Google Scholar] [CrossRef]
  53. Le, T.T.H.; Fettig, J.; Meon, G. Kinetics and simulation of nitrification at various pH values of a polluted river in the tropics. Ecohydrol. Hydrobiol. 2019, 19, 54–65. [Google Scholar] [CrossRef]
  54. Daebeler, A.; Kitzinger, K.; Koch, H. Exploring the upper pH limits of nitrite oxidation: Diversity, ecophysiology, and adaptive traits of haloalkalitolerant Nitrospira. ISME J. 2020, 14, 2967–2979. [Google Scholar] [CrossRef] [PubMed]
  55. De Boer, W.; Kowalchuk, G.A. Nitrification in acid soils: Micro-organisms and mechanisms. Soil Biol. Biochem. 2001, 33, 853–866. [Google Scholar] [CrossRef]
  56. Zhong, W.; Bian, B.; Gao, N. Nitrogen fertilization induced changes in ammonia oxidation are attributable mostly to bacteria rather than archaea in greenhouse-based high N input vegetable soil. Soil Biol. Biochem. 2016, 93, 150–159. [Google Scholar] [CrossRef]
  57. Zheng, M.; Wang, M.; Zhao, Z.; Zhou, N.; He, S.; Liu, S.; Wang, J.; Wang, X. Transcriptional activity and diversity of comammox bacteria as a previously overlooked ammonia oxidizing prokaryote in full-scale wastewater treatment plants. Sci. Total Environ. 2019, 656, 717–722. [Google Scholar] [CrossRef] [PubMed]
  58. Liu, X.; Zhang, Y.; Ren, X.; Shen, C.; Wang, F.; Wu, D. Influences of nitrogen forms on abundances and community structures of ammonia and nitrite oxidizers in a slightly alkaline upland soil. Arch. Agron. Soil Sci. 2021, 67, 152–165. [Google Scholar] [CrossRef]
  59. Han, S.; Li, X.; Luo, X.; Wen, S.; Chen, W.; Huang, Q. Nitrite-oxidizing bacteria community composition and diversity are influenced by fertilizer regimes, but are independent of the soil aggregate in acidic subtropical red soil. Front. Microbiol. 2018, 9, 885. [Google Scholar] [CrossRef] [PubMed]
  60. Freitag, T.E.; Chang, L.; Clegg, C.D.; Prosser, J.I. Influence of inorganic nitrogen management regime on the diversity of nitrite-oxidizing bacteria in agricultural grassland soils. Appl. Environ. Microbiol. 2005, 71, 8323–8334. [Google Scholar] [CrossRef]
Figure 1. Soil NXR activities under different N application rates. Bars indicate SD, different letters indicate significant differences among samples (p < 0.05, ANOVA). NXR, nitrite oxidoreductase; N0, N1, N2, N3, and N4 represent N fertilizer being used at levels of 0, 90, 150, 210, and 270 kg ha−1, respectively.
Agronomy 13 02909 g001
Figure 2. The soil PNR (a) [36] and PNO (b) under different N application rates. Bars indicate SD, different letters indicate significant differences among samples (p < 0.05, ANOVA). PNR, potential nitrification rate; PNO, potential nitrite oxidation; N0, N1, N2, N3, and N4 represent N fertilizer being used at a level of 0, 90, 150, 210, and 270 kg ha−1, respectively.
Agronomy 13 02909 g002
Figure 3. NOB abundance under different N application rates. (a) Nitrospira-like NOB abundance; (b) Nitrobacter-like NOB abundance; (c) ratios of nxrB/nxrA copy numbers. Bars indicate SD, different letters indicate significant differences among samples (p < 0.05, ANOVA). N0, N1, N2, N3, and N4 represent N fertilizer being used at levels of 0, 90, 150, 210, and 270 kg ha−1, respectively.
Agronomy 13 02909 g003
Figure 4. The relative abundance of dominant OTUs (a) and phylogenetic tree (b) of the NOB community under different N gradients. N0, N1, N2, N3, and N4 represent N fertilizer being used at levels of 0, 90, 150, 210, and 270 kg ha−1, respectively.
Agronomy 13 02909 g004
Figure 5. NOB diversity index (a) for Shannon index, (b) for Chao1 index) under different N application rates. Bars indicate SD, and different letters indicate significant differences among samples (p < 0.05, ANOVA). N0, N1, N2, N3, and N4 represent N fertilizer being used at levels of 0, 90, 150, 210, and 270 kg ha−1, respectively.
Agronomy 13 02909 g005
Figure 6. Principal coordinate analysis (PCoA) (a) and analysis of similarities (ANOSIM) (b) of the NOB community based on OTU. N0, N1, N2, N3, and N4 represent N fertilizer being used at levels of 0, 90, 150, 210, and 270 kg ha−1, respectively.
Agronomy 13 02909 g006
Figure 7. Redundancy analysis (RDA) between soil nutrients and the NOB community under different N application rates. SOM, soil organic matter; TN, total nitrogen; AN, available nitrogen; NH4+-N, ammonium nitrogen; NO3-N, nitrate nitrogen. N0, N1, N2, N3, and N4 represent N fertilizer being used at levels of 0, 90, 150, 210, and 270 kg ha−1, respectively.
Agronomy 13 02909 g007
Figure 8. Random forest analysis under different N application rates. The horizontal axis represents NOB abundance; α diversity (Shannon, Chao1 Index) and β diversity (PC1, PC2) were predictive factors for PNO. IncMSE%, increase in mean squared error. N0, N1, N2, N3, and N4 represent N fertilizer being used at levels of 0, 90, 150, 210, and 270 kg ha−1, respectively.
Agronomy 13 02909 g008
Figure 9. The structural equation model (SEM) between the soil nutrients, NOB community, and NXR. The arrow width is proportional to the strength of the path coefficients. Solid red arrows indicate a positive correlation, while blue dotted arrows indicate a negative relationship. * and *** indicate p < 0.05 and p < 0.001, respectively. SOM, soil organic matter; TN, total nitrogen; AN, available nitrogen; NH4+-N, ammonium nitrogen; NO3-N, nitrate nitrogen.
Agronomy 13 02909 g009
Table 1. Soil properties under different N application rates.
pHSOM
(g kg−1)
TN
(g kg−1)
AN
(mg kg−1)
NH4+-N
(mg kg−1)
NO3-N
(mg kg−1)
N06.89 ± 0.09 a17.6 ± 1.85 c1.11 ± 0.01 d105.64 ± 0.92 d0.33 ± 0.07 b2.74 ± 0.22 d
N16.79 ± 0.26 ab21.23 ± 2.15 b1.42 ± 0.02 c127.32 ± 4.48 c0.59 ± 0.09 a3.54 ± 0.99 d
N26.64 ± 0.11 a23.38 ± 0.33 ab1.53 ± 0.06 b150.4 ± 7.88 b0.7 ± 0.15 a5.97 ± 0.43 c
N36.62 ± 0.31 ab23.82 ± 0.55 a1.58 ± 0.02 b153.83 ± 1.18 b0.74 ± 0.03 a7.96 ± 1.47 b
N46.45 ± 0.29 b23.42 ± 1.25 ab1.71 ± 0.05 a163.3 ± 11.47 a0.77 ± 0.13 a10.03 ± 1.58 a
Values are means ± SD, different letters indicate significant differences among treatments (p < 0.05, ANOVA). SOM, soil organic matter; TN, total nitrogen; AN, available nitrogen; NH4+-N, ammonium nitrogen; NO3-N, nitrate nitrogen. N0, N1, N2, N3, and N4 represent N fertilizer being used at a level of 0, 90, 150, 210, and 270 kg ha−1, respectively.
Table 2. Explanation rate and contribution rate of soil properties for the NOB community.
Explains %Contribution %Pseudo-Fp
AN15.631.62.40.014
NH4+-N9.318.71.50.21
NO3-N7.815.81.20.28
pH6.312.710.37
TN5.611.40.80.404
SOM4.99.80.70.47
SOM, soil organic matter; TN, total nitrogen; AN, available nitrogen; NH4+-N, ammonium nitrogen; NO3-N, nitrate nitrogen.
Disclaimer/Publisher’s Note: The statements, opinions and data contained in all publications are solely those of the individual author(s) and contributor(s) and not of MDPI and/or the editor(s). MDPI and/or the editor(s) disclaim responsibility for any injury to people or property resulting from any ideas, methods, instructions or products referred to in the content.

