Article

Identification of Promising Three-Way Hybrids of Pearl Millet for Drought-Prone Environments of North-Western India

by
Kuldeep Kandarkar
1,2,*,
Viswanathan Palaniappan
1,
Phool Chand Gupta
3,
Ravikesavan Rajasekaran
1,
Jeyakumar Prabhakaran
4,
Nakkeeran Sevugapperumal
5 and
Shashi Kumar Gupta
2,*
1
Center for Plant Breeding and Genetics, Tamil Nadu Agricultural University, Coimbatore 641003, Tamil Nadu, India
2
International Crops Research Institute for the Semi-Arid Tropics (ICRISAT), Patancheru 502324, Telangana, India
3
Agricultural Research Station, Swami Keshwanand Rajasthan Agriculture University, Bikaner 334006, Rajasthan, India
4
Department of Crop Physiology, Tamil Nadu Agricultural University, Coimbatore 641003, Tamil Nadu, India
5
Department of Plant Pathology, Tamil Nadu Agricultural University, Coimbatore 641003, Tamil Nadu, India
*
Authors to whom correspondence should be addressed.
Agronomy 2023, 13(11), 2813; https://doi.org/10.3390/agronomy13112813
Submission received: 10 September 2023 / Revised: 30 October 2023 / Accepted: 2 November 2023 / Published: 14 November 2023
(This article belongs to the Section Crop Breeding and Genetics)

Abstract

:
Stable, drought-tolerant, and high-yielding dual-purpose hybrids are needed for cultivation in the drought-prone areas of India. Working towards this, this study was conducted to assess the associations between grain yield and its component traits and the relationships among genotypes to select the most promising hybrids based on multiple traits. In the present investigation, thirty newly developed three-way hybrids (TWHs), along with four popular commercial single-cross hybrids and two open pollinated varieties (OPVs) were evaluated at three sites in the drought-prone ecology of India during the rainy season of 2021–2022. A principal component analysis (PCA) revealed that the first three component axes (PC) were significant, with eigenvalues more than one, and together contributed to 74.10% of the total variance. A hierarchical cluster analysis based on the Euclidean distance between hybrids suggested the existence of three clusters. Cluster III (C-III) had hybrids with maximum grain yield, dry fodder yield, and important component traits such as panicle harvest index and grain harvest index that are required for adaptation to drought-prone environments. A genotype by yield × trait (GYT) biplot and a superiority index (SI) were generated to identify the best hybrids with high grain yield and other component traits. These results were used to identify TWHs, namely TH-114, TH-138, TH-49, TH-67, and TH-79, with more than 30% standard heterosis and stable performance coupled with better drought-adaptive traits.

1. Introduction

Pearl millet (Pennisetum glacum (L.) R. Br., syn Cenchrus americanus (L.) Marrone) is a climate-resilient C4 crop that can withstand harsh agro-climatic conditions in the arid and semi-arid regions of Asia and Africa. It ranks as the sixth most important cereal crop globally, after rice, wheat, maize, barley, and sorghum [1,2]. It provides a nutritive staple food grain for human consumption and forage for livestock. It is cultivated on about 31.2 million hectares in different agro-ecologies by over 90 million farmers [1,3]. In India, it is the fourth most important cereal crop, after rice, wheat, and maize, and is grown over an area of 6.93 million hectares (mha) with a production of 8.6 million tonnes (mt), with an average productivity of 1243 kg/hectare, accounting for two-thirds of national millet production. It is grown in dryer areas of India, mainly in states such as Rajasthan, Maharashtra, Gujarat, Uttar Pradesh, and Haryana [2].
The arid zone of pearl millet cultivation in north-western India includes drought-prone areas from parts of the state, such as Rajasthan, Haryana, and Gujarat, that receive less than 400 mm of annual rainfall [4]. Pearl millet is cultivated in areas with limited rainfall, where other cereals, such as sorghum or maize, face challenges due to water scarcity; therefore, in such areas, enhancing drought tolerance is an important area of research in pearl millet improvement program [5]. Low and erratic rainfall, with an uneven distribution in this drought-prone region, leads to varying levels of moisture stress, timing, intensity, and duration at different stages of the crop cycle. The grain productivity level in this arid ecology is 35% lower than the average productivity in India [4,6].
The differential response of crops to varied intensity and timings of drought during particular crop growth phases is key to understand the breeding activities of this ecology. Unpredictable and scanty rainfall patterns in this ecology lead to major constraints in crop productivity and create challenges while breeding for this ecology [7]. The occurrence of drought during the seedling stage is prevalent in such ecosystems and leads to seedling mortality, resulting in poor crop stands and, consequently, reduced grain and fodder yields [8,9,10,11]. However, moisture stress during the vegetative phase is the most commonly encountered challenge and significantly affects the phenological development of crops [12,13], tillering [14], and flowering [15,16]. However, the flowering and post-flowering stages of crops are the most sensitive to drought stress, which has a substantial impact on both grain and fodder production due to a reduction in the number of panicles per plant, fertility of florets per panicle, and grain size [6,10,12,15,16,17]. Thus, breeding programs in this region primarily concentrate on developing drought-tolerant cultivars to address mid-season and terminal drought stress in pearl millet [18].
Farmers in this area prefer dual-purpose hybrids with higher grain yield and an optimum dry fodder yield. The use of landraces/OPVs (open-pollinated varieties) for cultivation in this driest track [19] and the cultivation of popular hybrids, such as HHB-67-improved [20], show the potential of improved cultivars and hybrids under such harsh climatic conditions. The development of stable and high-yielding pearl millet hybrids according to consumer preferences is one of the main objectives of pearl millet hybrid breeding programs for drought-prone ecology. Earlier studies on three-way cross hybrids (TWHs) in the case of maize have shown the potential utilization of this type of hybrid under drought stress conditions to achieve higher grain yield [21,22] and fodder yield [23]. In addition, using three different parents leads to increased heterozygosity, with a better buffering capacity of the TWHs, to adapt under water stress conditions. Additionally, using F1s as female parents in three-way cross hybrids helps reduce seed production costs, making it possible for seed vendors to provide seeds at more affordable prices to farmers in such marginal ecologies [24]. Considering these advantages, a novel kind of TWH was developed in pearl millet using hybrid parental lines that were selected based on their productivity characteristics and drought-adaptive traits.
Different multivariate methods were adopted in the present study to select desirable hybrids, such as PCA (principal component analysis), cluster analysis, and GYT biplot techniques. Genotypes with identical responses can be clustered together through multivariate analysis [25], guaranteeing that the variety or hybrid within a cluster performs similarly across various locations [26]. Recently, the utilization of the genotype by yield × trait (GYT) biplot to select promising breeding material has been adopted by many breeders. GYT plots are utilized for effective and comprehensive graphical representations of genotypic data with respect to the yield × trait combinations, according to the strengths and weaknesses of each genotype, which are determined using a superiority index (SI) [27]. Considering these facts, this study investigated the genetic variation among the genotypes and the trait associations and identified the most promising, high-yielding, and stable three-way hybrids (TWHs) with multiple desirable traits for the drought-prone environments of north-western India.

2. Materials and Methods

2.1. Plant Materials

The parental lines viz., A/B-lines and R-lines known for their better performance under drought-prone conditions were used in this study to produce TWHS. Three-way hybrids (TWHs) were developed by crossing sterile F1 (A1-line × B2-line) with a restorer line (R-line) at the International Crop Research Institute for Semi-arid Tropics (ICRISAT), Patancheru. The female sterile F1 hybrid was developed by crossing two different seed parental lines, which involved a male sterile female A1-line crossed with a non-isogenic maintainer B2-line. A1 and B1-lines are isogenic seed parental lines that provide seed of the A1-line when crossed. A set of 30 promising TWHs (hybrid codes ranging from TH-1 to TH-137) were selected from 152 TWHs that were evaluated in two different sets during the rainy season of 2020 (the original hybrid codes were from TH-1 to TH-152). This set of 30 hybrids was evaluated at three different drought-prone sites in north-western India with six popular checks, which included four commercial single-cross hybrids (SCH) (HHB-67-Imp coded as CK-1; MPMH-17 coded as CK-2; RHB-177 coded as CK-3; and GHB-538 coded as CK-5) and two open-pollinated varieties (OPVs) (Dhanashakti coded as CK-4 and Raj-171 coded as CK-6). The genotypes used in this study are listed in Supplementary Table S1.

2.2. Field Evaluation

This study was conducted at the research farms of Swami Keshwanand Rajasthan Agriculture University (SKRAU), Bikaner, Rajasthan; Hytech Seeds Pvt Ltd., Hyderabad, India, Malakhera-Alwar, Rajasthan and JK Seeds Pvt Ltd., Hyderabad, India, Chirkhna-Alwar, Rajasthan during the rainy season of 2021. Details regarding the agro-climatic features of these test locations are presented in Table 1 (Supplementary Figure S1).
A set of 36 genotypes (30 TWHs + 6 checks) was evaluated using an alpha lattice design with two replications at each location. Each entry was planted in a plot size of four rows of 4 m length. Inter-row spacing of 45 to 60 cm and inter-plant spacing of 10–15 cm was maintained at all the sites. A recommended package of practice was followed to raise a good crop stand at each location. Agro-morphological data for grain yield and other yield-related traits were recorded. The days to 50% flowering (DB) (days) were recorded on a plot basis, and the days were counted from the date of sowing to the date when 50% of plants in the plot showed full stigma emergence. Five random plants from the middle of the rows were tagged from each plot, and the data for plant height (PH), panicle length (PL), and panicle diameter (PD) were recorded at maturity. For PH, the length of the fully matured plant from the base of the plant to the tip of the panicle was measured in centimeters. The PL was measured in centimeters from the base of the panicle to the tip, whereas PD was measured using a Vernier caliper at the maximum thickness of the panicle in millimeters (mm). At physiological maturity, the panicles were harvested from each plot, sun-dried for 7–10 days, and then weighed to obtain the panicle yield (PY) in grams per plot. After recording the data for PY, the panicles were threshed, and grain weight was measured to record the grain yield (GY) (gm/plot). The harvested plants were also sundried for 7–10 days and then weighed to obtain the dry fodder yield (DFY) (grams per plot). The weights recorded for PY, GY, and DFY in grams per plot were then converted to kilograms per ha. The biomass/biological yield (BY) was calculated by summing the PY and DFY values for each plot. The panicle harvest index (PNHI) was calculated as the ratio of GY to PY, whereas the harvest index (HI) was calculated as the ratio of GY to BY, which was expressed as a percentage.
The weather data for each site were generated using synthesized data provided by NASA POWER [28]. Earlier reports have proven that the NASA POWER data adequately reflect the observed meteorological data [29,30]. Weather parameters such as daily precipitation, minimum and maximum temperatures, and relative humidity were collected from synthesized data records to understand rainfall patterns and temperature variations during the crop cycle.

2.3. Statistical Analysis

Data on grain yield and its component traits were subjected to a combined analysis of variance (ANOVA) to investigate the genotype (G), environment (E), and genotype × environment interaction (G × E) effects. The adjusted means were estimated using a linear mixed model, in which the effects of the environment, replication, block, and genotype factors were kept random. The single stage combined analysis of multi-environment trials was performed jointly, and the following statistical model was adopted:
Y i j k l = µ + e i + e / r i j + e / r / b i j k + g l + e g i l + ε i j k l  
where μ is the grand mean, e i is the random effect of the i th environment, e / r i j is the random effect of replication j nested within environment i , e / r / b i j k is the random effect of block k nested within replication j and environment, g l is the random effect of genotype l , e g i l is the random effect of interaction between environment i and genotype l , and ε i j k l is the random residual effect. The BLUPs (best linear unbiased predictors) were estimated for environments (E), genotypes (G), and genotype × environment (G × E) from combined analysis and calculated pairwise comparisons using the t-statistic (LSD) for significant effects at 0.05 probability levels. The variance component was computed fitting the liner model explained in Equation (1) using the “lme4” package in R-environment [31]. The heritability ( h 2 ) for the combined analysis was calculated as follows:
h 2 = σ g 2 σ g 2 + σ e g 2 e + σ e 2 r x e
where σ g 2 is the genotypic variance, σ e g 2 is the genotype × environment variance, σ e 2 is the error variance, e is the number of environments, and r is the number of replicates within the environments.
The estimated BLUP values from combined analysis were then subjected to a calculation of Pearson’s correlation coefficient to understand the association among the traits using the “psych” package in R-environment [32]. The standard heterosis for yield and component traits for all TWHs was calculated over the most popular hybrid of the target ecology HHB-67-Imp using the formulae suggested by Meredith and Bridge [33]. Stable and high performing hybrids were identified based on a plotting technique that was generated using data for mean performance and coefficient of variation of genotypes across environments, as suggested by Francis and Kannenberg [34] using GEA-R software [35]. Principal component analysis (PCA) was performed to visually assess the patterns of morphological variation among genotypes. Cluster analysis was performed to generate a dendrogram depicting genotypes into similar groups based on their agro-morphological performance. The hierarchical clustering of genotypes was performed using the Euclidean distance among genotypes. PCA and dendrogram were developed using the R-package “Factoshiny” [36].
Genotype by yield × trait (GYT) data were generated by considering trait data as a function of grain yield as per the procedure proposed by Yan and Frégeau–Reid [27]. Based on the breeding objective, the weight of each yield × trait combination was determined by multiplying or dividing the grain yield (Y). For traits such as DFY, PY, PH, PNHI, HI, PL, and PD, for which higher values were desirable, the GY*T values were estimated by multiplying with yield values for each trait (e.g., Y*DFY). Meanwhile, for traits such as days to 50% flowering (DB), where higher values are undesirable, the values were determined by dividing grain yield (Y/DB). The superiority index (SI) was calculated using standardized values for each yield–trait combination. The standardization of data was computed by adopting the formula suggested by Yan and Frégeau–Reid [27].
P i j = T i j T ¯ j S j
where P i j is the standardized value of genotype i for yield–trait combination j in the standardized table, T i j is the original value of genotype i for yield–trait combination j, T ¯ j is the mean across genotypes for yield–trait combination j, and S j is the standard deviation for yield–trait combination j. GYT biplots were generated from single-value decomposition (SVD) of the standardized GYT table based on the first two principal components (PC). The GYT biplot was generated based on yield–trait standardized GYT data (indicated by “scaling = 1” and “Centering = 2” on biplot) and yield–trait-focused singular value partitioning (indicated by “SVP = 1”). All GYT biplots were generated using the “metan” package in R-environment [37].

3. Results

3.1. Analysis of Variance and Mean Performance

The combined ANOVA across environments (Table 2) showed significant differences among the genotypes for GY, DFY, and DB. However, no significant genotype effect was observed for the other traits, while a significant location effect was observed for all traits except for PNHI and HI. High (GY, DFY, and DB) to moderate (PH, PL, and PD) heritability values were observed across most traits, indicating a considerable contribution of genetic component to phenotypic variance. A box plot was generated to visually summarize the performance of the genotypes for different traits across locations (Supplementary Figure S2). At the Bikaner location, due to water stress during the vegetative phase of the crop cycle, the genotypes experienced mid-season drought stress, resulting in lower values for GY and DFY and delayed flowering (Supplementary Figure S2a–c). The adjusted mean values (BLUP) of the tested genotypes for the nine agro-morphological traits were summarized in Supplementary Table S2.

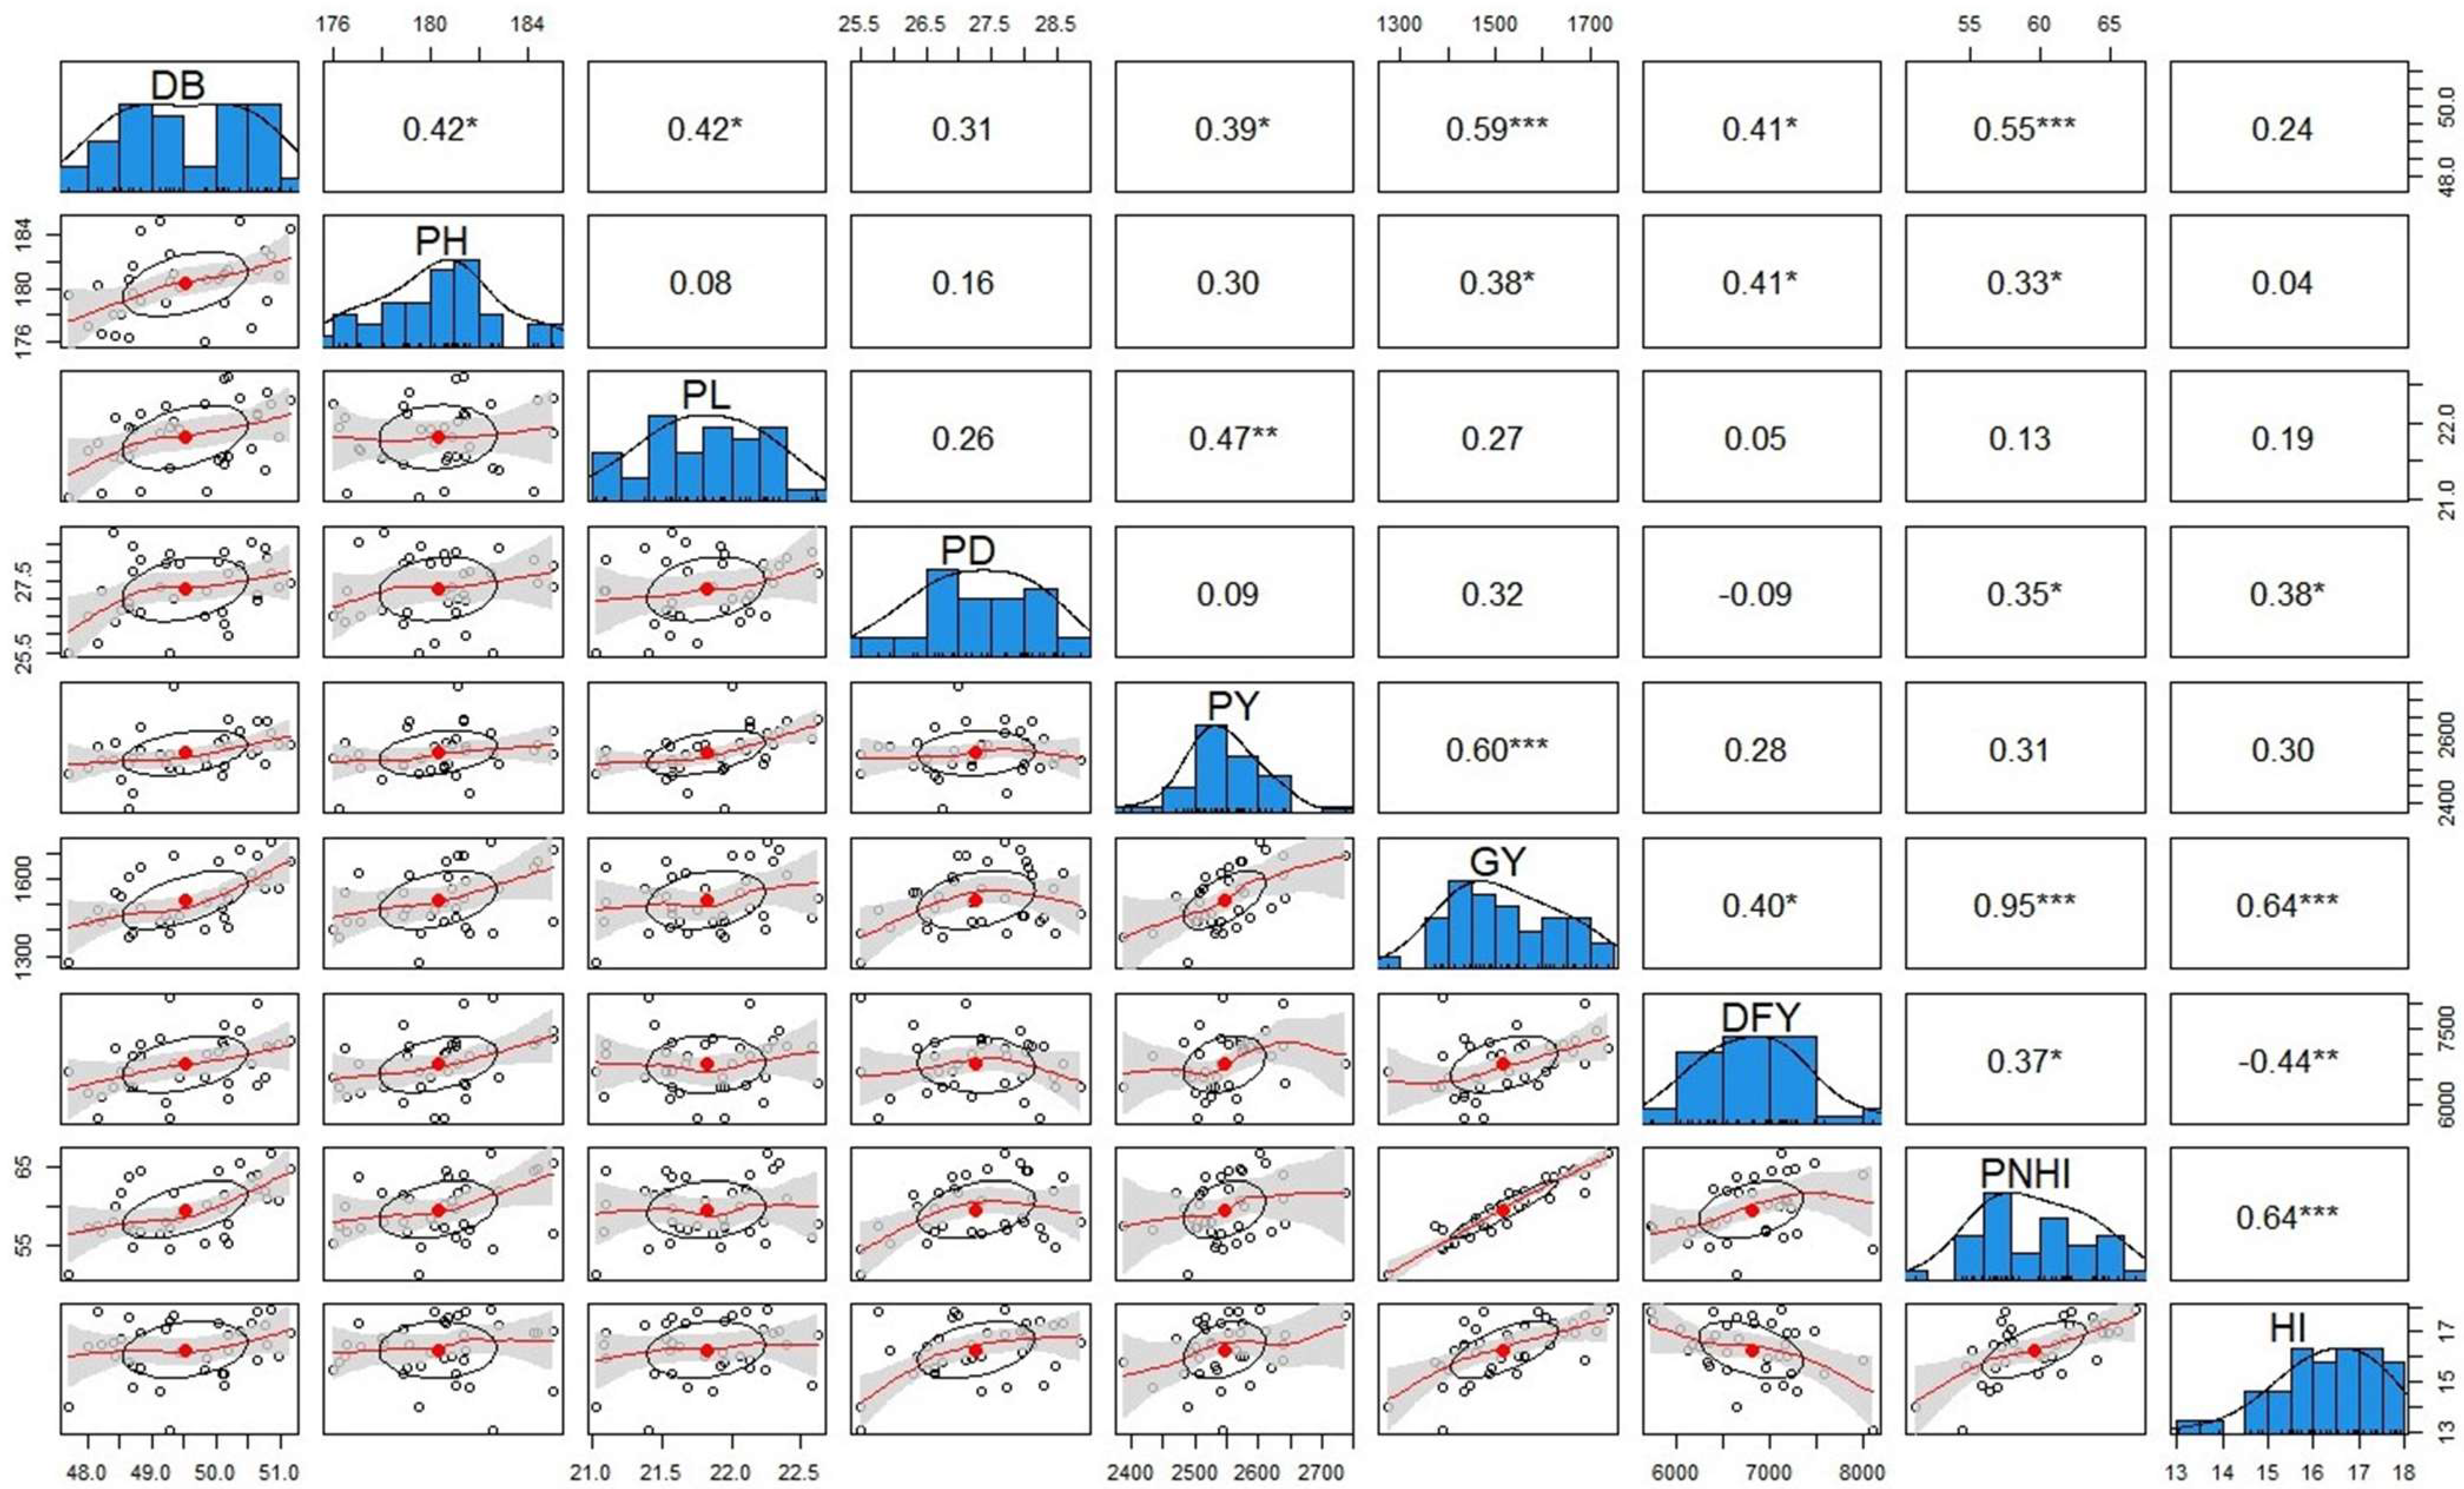
3.2. Trait Association

A highly significant and positive correlation was observed between GY and PNHI, HI, PY, DB, DFY and PH. This indicates that it is possible to select desirable hybrids for grain and fodder yields along with better drought tolerance (higher PNHI). For DFY, a significant positive correlation was observed between DB, PH, and PNHI (Figure 1). However, highly significant and negative correlations were estimated between DFY and HI. In addition, a significant positive association was observed for PH with DB and PNHI. Therefore, these significant positive associations of GY and DFY with PH and PNHI indicate that there is a possibility that the selection of taller hybrids yields higher grain and fodder yields along with enhanced drought tolerance.

3.3. Standard Heterosis

The standard heterosis for GY and eight other component traits was estimated over the most popular hybrid HHB-67-imp for all hybrid genotypes (Table 3). The magnitude of standard heterosis for GY ranged from 7.91 (TH-77) to 36.77 (TH-49), that for DFY ranged from −9.15 (TH-108) to 22.13 (TH-147), that for PH ranged from −1.99 (TH-96) to 3.09 (TH-67), and that for PNHI ranged from 6.69 (TH-147) to 30.77 (TH-49). High-yielding and early flowering hybrids with optimum dry fodder levels have special significance in the conditions of western Rajasthan [6,18]. In addition, selecting genotypes with a higher panicle harvest index (PNHI) is helpful for indirectly selecting genotypes with better drought tolerance [7]. Considering these facts, out of 30 hybrids, 13 TWHs showed significantly higher heterosis for grain yield, and 2 TWHs showed significantly higher heterosis for DFY when compared to the single-cross hybrid check HHB-67-Imp. Meanwhile, for PNHI, 23 out of 30 TWHs showed significant positive heterosis.

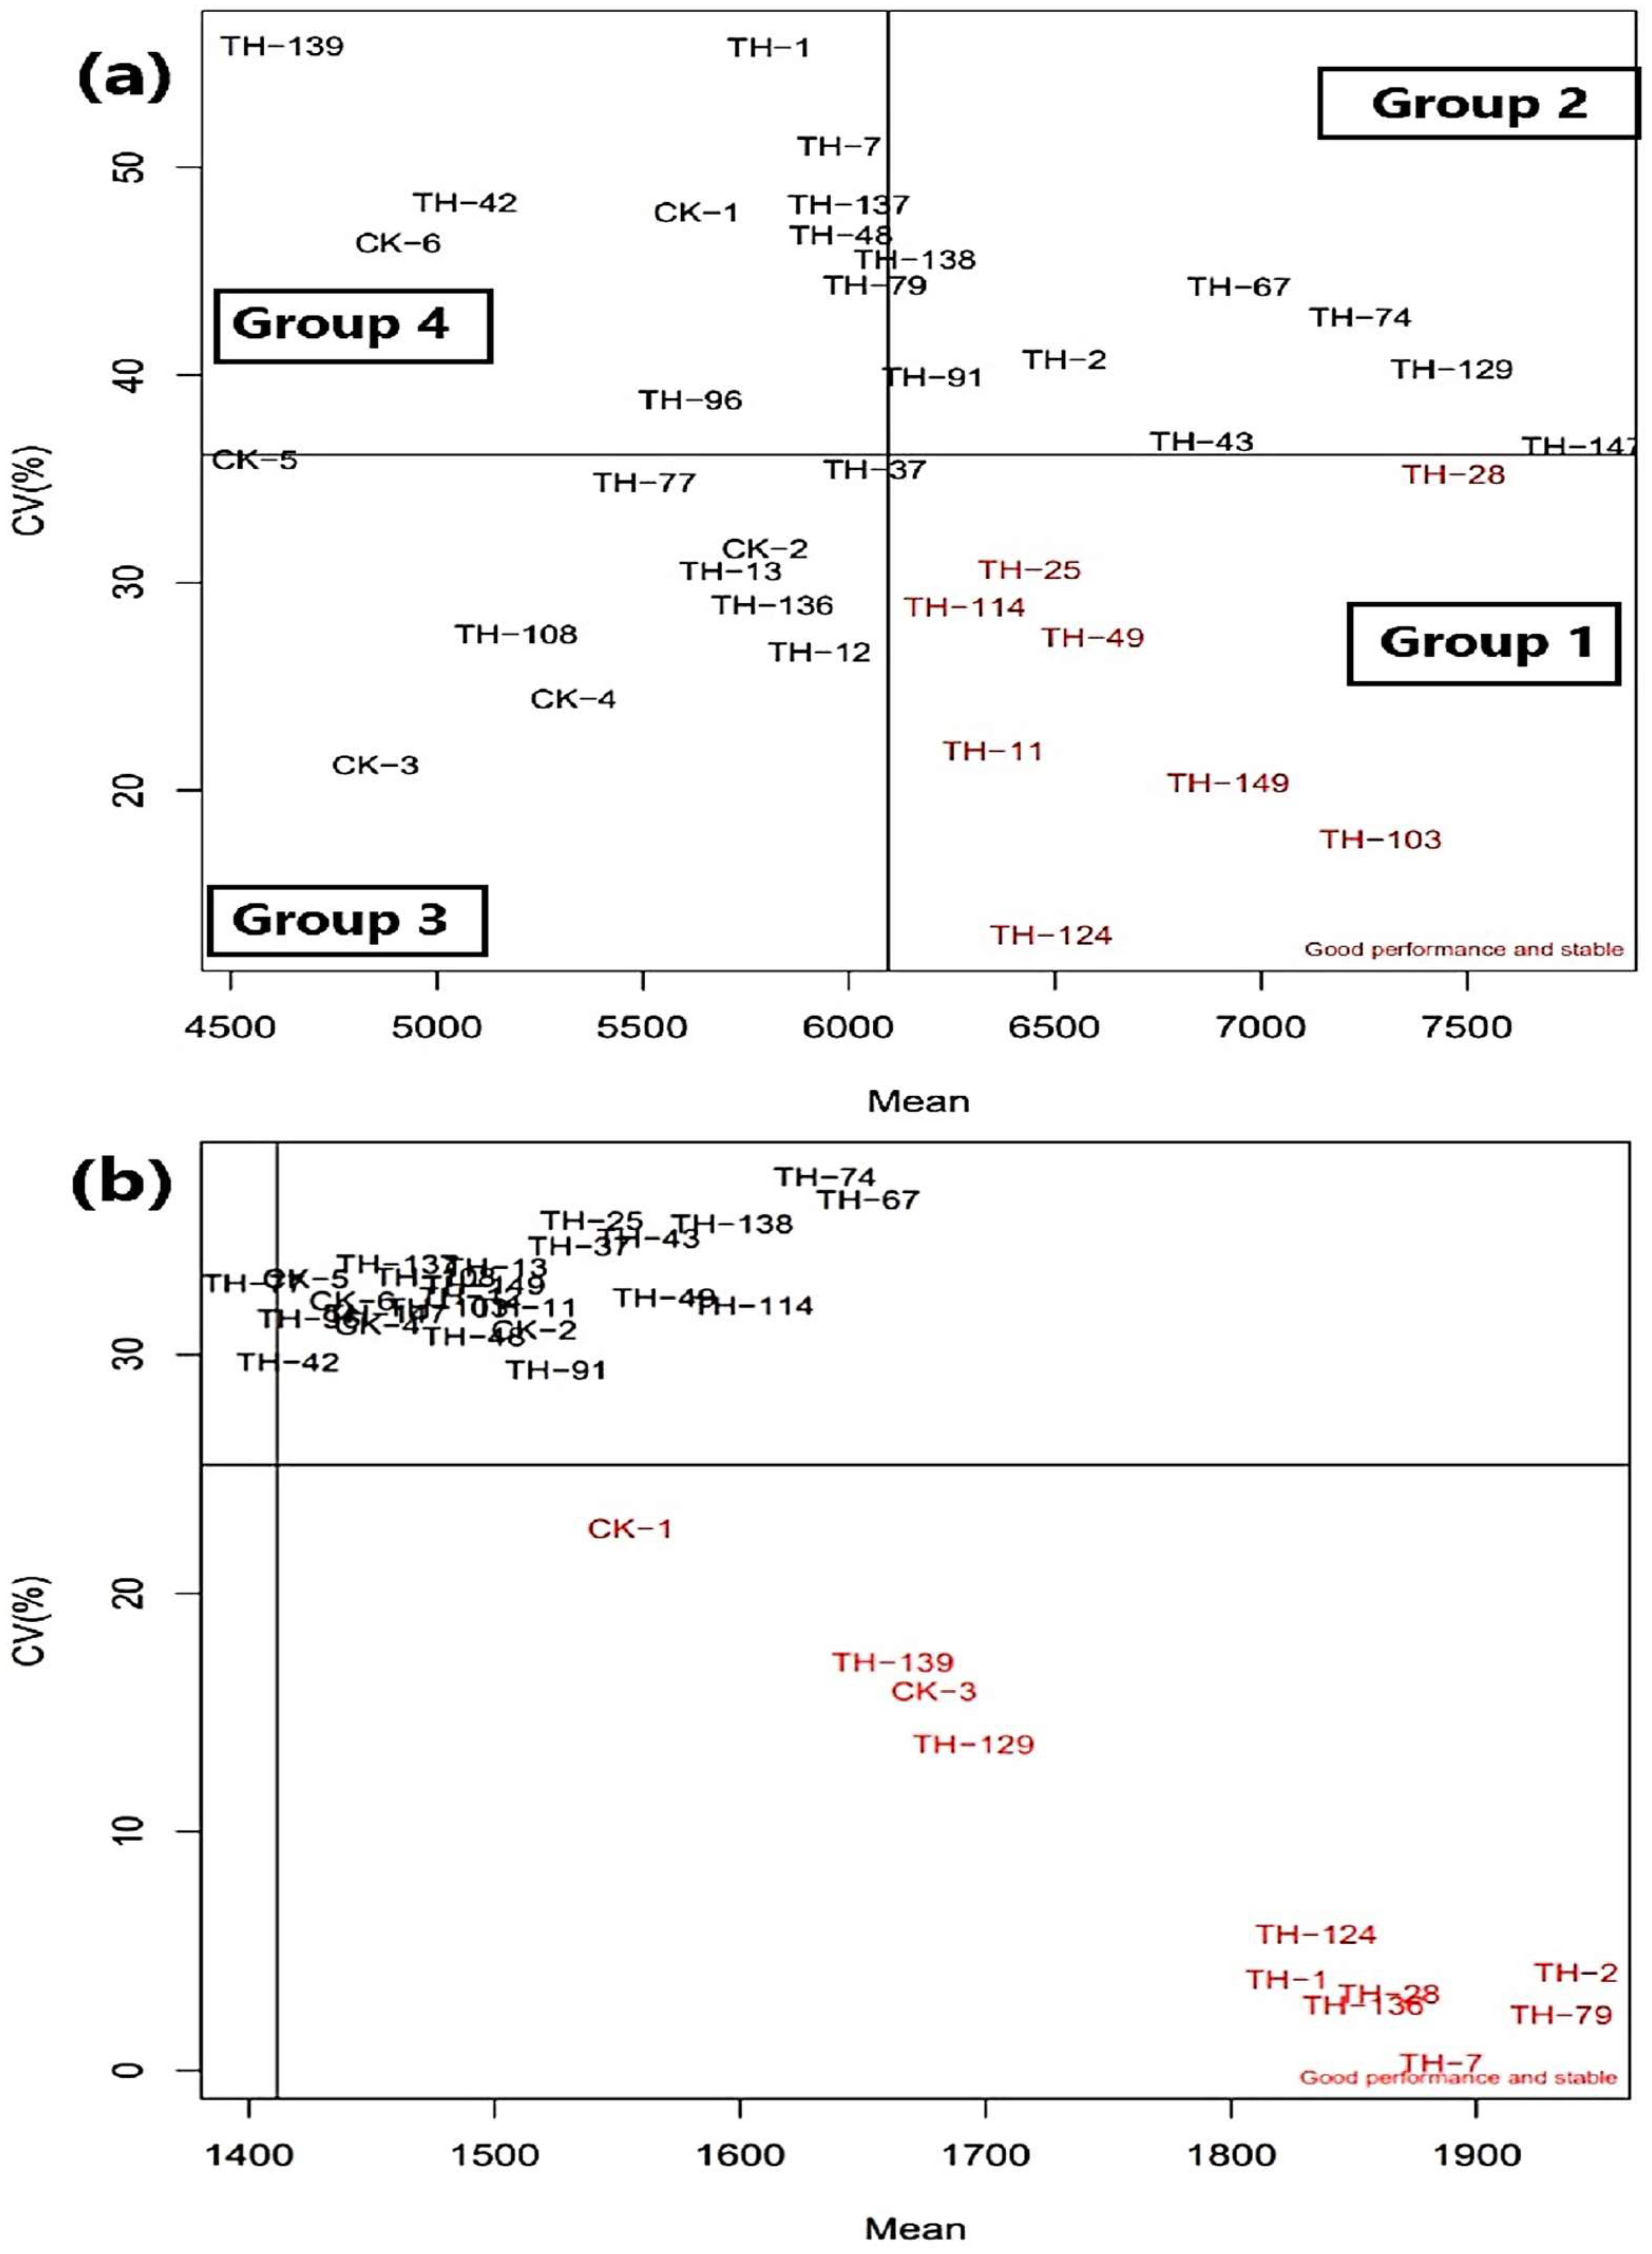
3.4. Stability Performance Visualized through CV vs. Mean Plot

A genotype with constant performance across different environments is often considered stable. The coefficient of variation (CV) was calculated and used as a biological stability parameter to assess the performance of the hybrids across environments by plotting it against the mean performance for each particular trait (Figure 2). Genotypes with a higher mean yield and stable performance, that is, lower CV values, are most favorable because of their suitability across variable environmental conditions [38].
Considering these facts, as depicted in Figure 2a, the genotypes were categorized into four groups based on their mean performance against CV, where the genotypes were plotted using the mean DFY data (X-axis) against CV (Y-axis). Group 1 included the most desirable genotypes with a high DFY and low CV, such as TH-124, TH-103, TH-149, TH-11, TH-49, TH-114, and TH-25. Group 2 possessed genotypes TH-147, TH-129, TH-74, and TH-36, which had higher DFY values than the total average and high CVs. Group 3 consisted of TH-37, CK-2 (MPMH 17), TH-136, TH-77, TH-12, and TH-13, which had relatively low mean DFY values and low CVs. Finally, in Group 4, the most undesirable genotypes with low mean values for DFY and high CVs were gathered.
Similarly, in the case of GY (Figure 2b), high-yielding well-performing stable genotypes, such as TH-7, TH-79, TH-28, TH-36, TH-138, and TH-129, along with the most popular check hybrid HHB-67-Imp (CK-1) were grouped together. In the case of DB (Supplementary Figure S3a), the genotypes from group 3 had low CV and smaller DB values; thus, genotypes such as TH-129, TH-138, TH-137, and TH-147 are more desirable due to their early maturing and consistent performance.

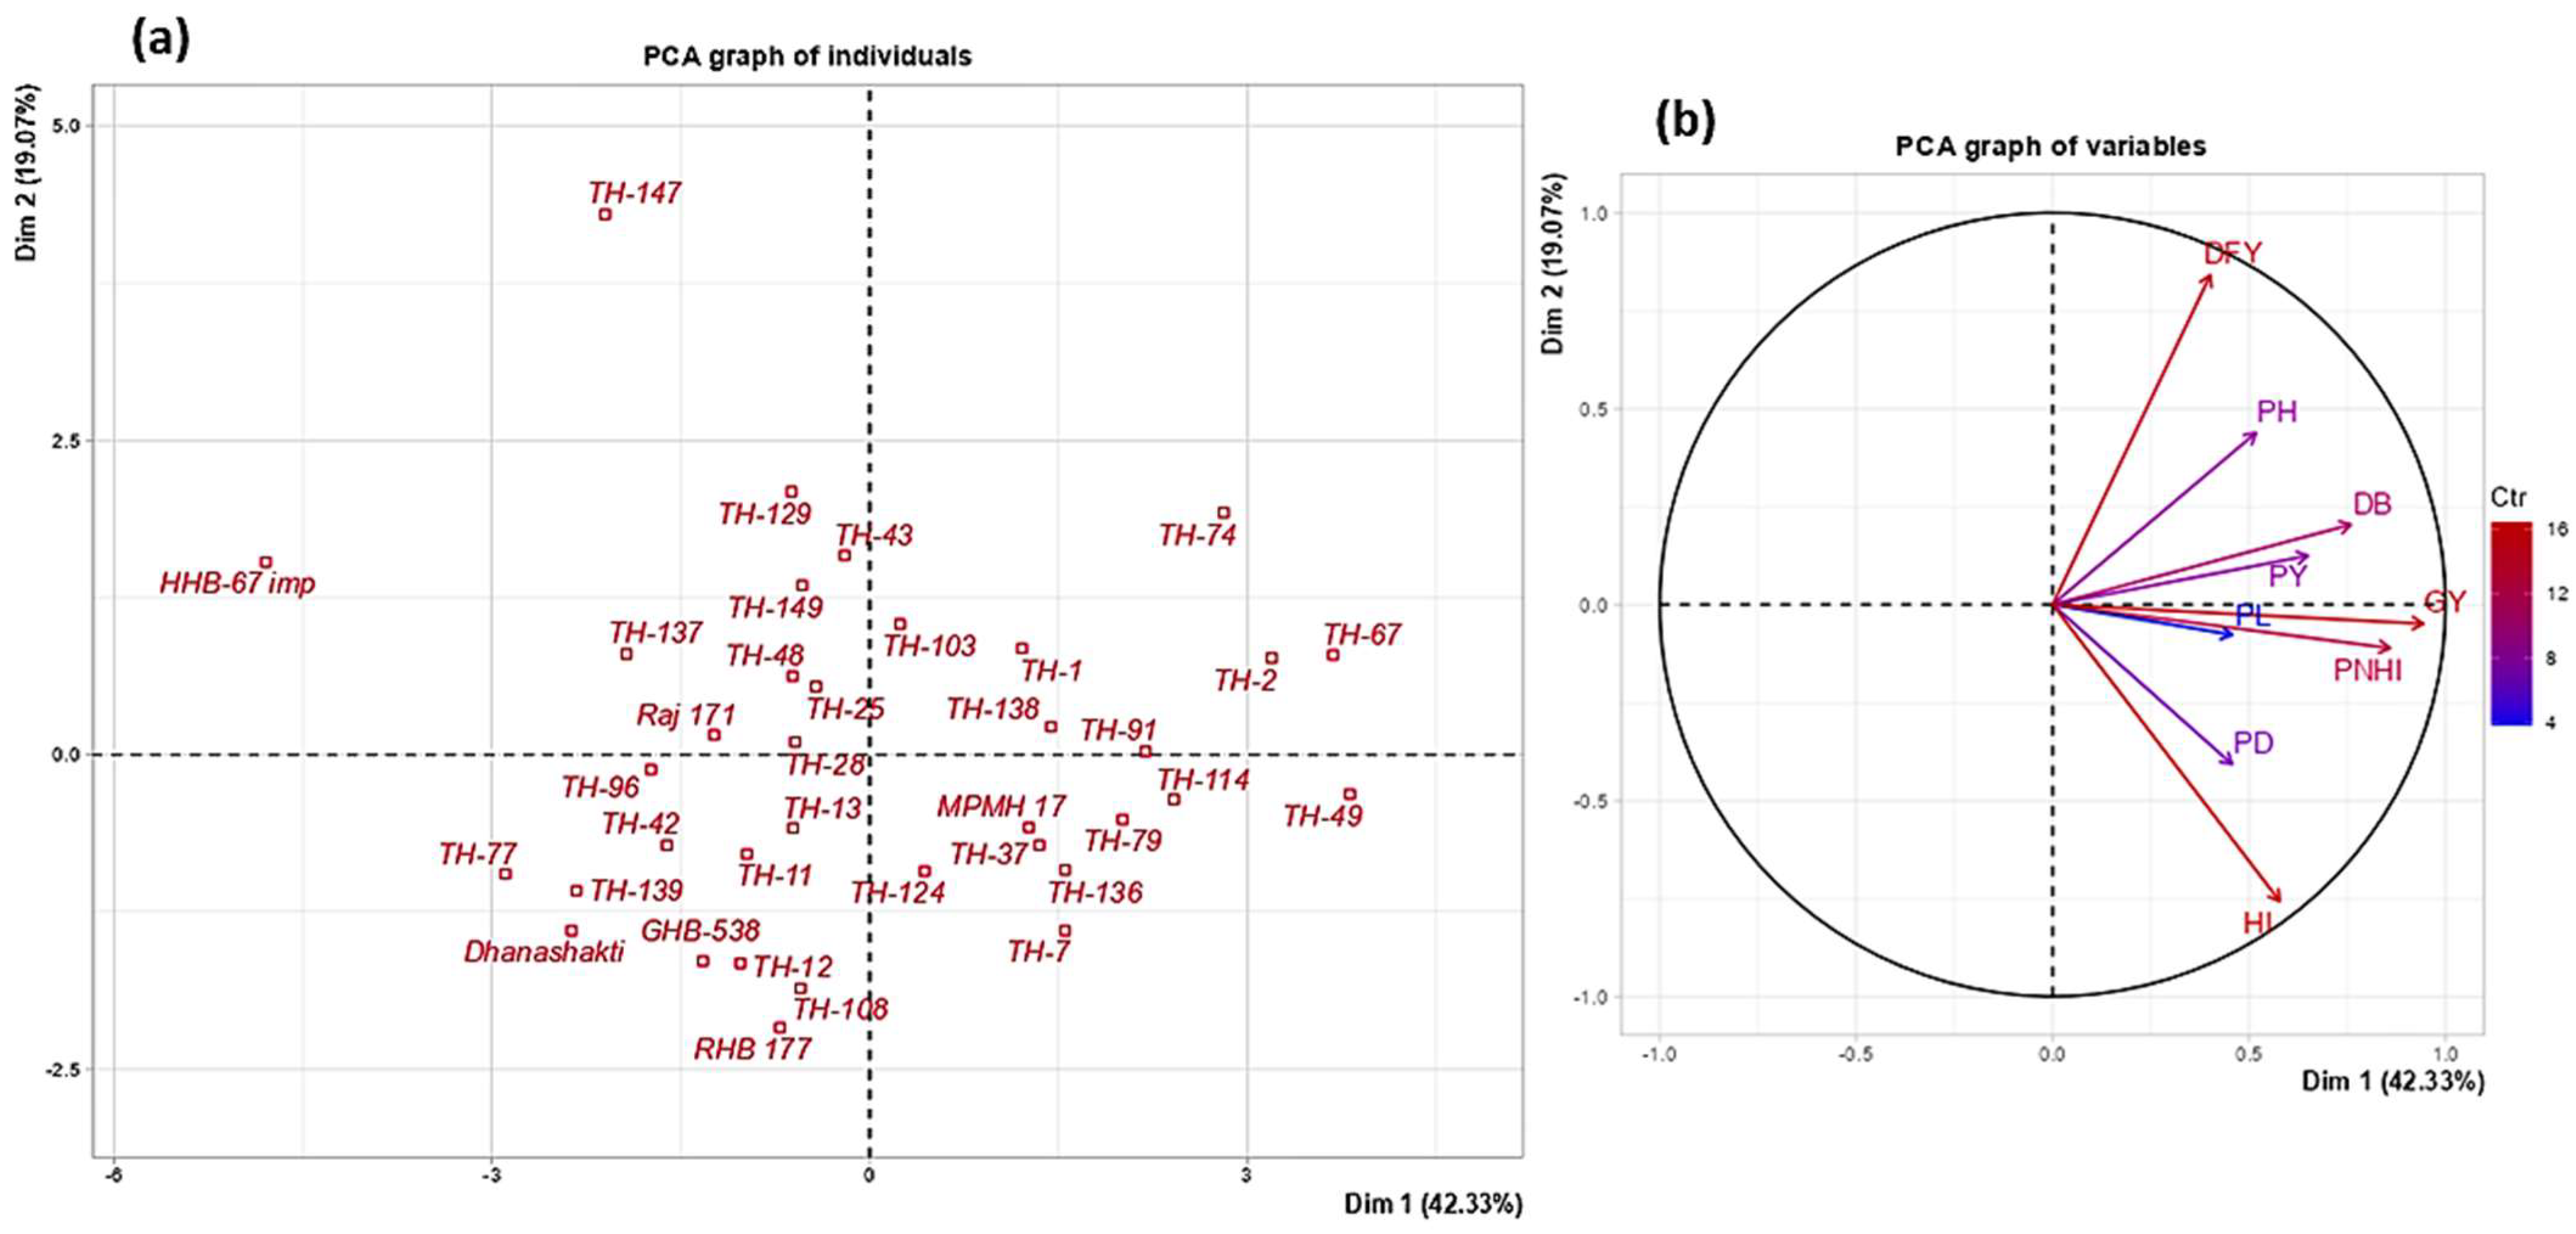
3.5. PCA and Dendrogram

A principal component analysis (PCA) was performed to reduce the number of variables into linear functions and eigenvalues. The percent variance for each principal component (PC) and cumulative variance, and the vector loadings of the different traits are presented in Table 4. The PCA revealed that the first three PCs had eigenvalues of greater than one, accounting for 74.10% of the total variability for the genotypes evaluated for the nine agro-morphological traits. Knowledge of grain yield and component traits is helpful for breeders to improve breeding efficiency via appropriate selection indices [39]. Days to 50% flowering (DB) and panicle yield (PY) contributed positively to all the three PCs. PC1 showed the highest variance (42.23%) and all traits positively contributed to PC1. GY (0.94), PNHI (0.862), DB (0.759), and PY (0.648) were the major traits related to PC1 indicating that the first component majorly differentiated high-yielding genotypes based on these traits. PC2 followed PC1 for the amount of variance (19.07%) and the majority of traits showed a negative contribution, whereas DFY (0.84) and PH (0.437) had the highest positive contribution. This indicates that PC2 differentiated genotypes for high dry fodder yield and related characteristics.
PCA biplots were generated to visually assess the pattern of variation among the genotypes (Figure 3a) and trait contributions in discriminating these genotypes (Figure 3b). The present study revealed that GY, PY, DB, PNHI, and PL contributed positively to the PC1 forming group together, as the angles between them were less than 90° (acute angle) (Figure 3b), indicating a positive association among these traits. In addition, in the case of PC2, DFY, PH, DB, and PY, positive contributions towards PC2 were found in the common group, indicating a positive correlation among these traits. The greatest distance between DFY from PD and HI (obtuse angle between vectors) indicates a negative association between these traits. This trait relationship, based on the PCA matrix data, is congruent with Pearson’s trait association studies (Figure 1).
A cluster analysis grouped genotypes based on their similarities in a dendrogram using the information from the first seven PCs. As depicted in the dendrogram (Figure 4), three clusters were formed from the 36 genotypes based on nine traits. There were seventeen, four, and fifteen genotypes in Cluster-I (C-I), Cluster-II (C-II), and Cluster-III (C-III), respectively (Table 5). The C-I cluster had hybrids with greater plant height (185.02 cm) and higher panicle length, with some of the members are early flowering hybrids, such as HHB-67 Imp. The C-II cluster had hybrids with lower PNHI and HI values. Cluster III showed superiority for grain yield (mean yield of 1550 kg/ha) and dry fodder yield (mean yield of 6834 kg/ha) compared to C-I and C-II. Also, the hybrids comprising C-III had maximum values for PNHI and HI. The length of vectors for variables in the PCA biplot (Figure 3b) and Eta squared values (Supplementary Table S3) shows that variables such as GY, HI, PNHI, and DFY contributed as a major part of the variation to grouping hybrids in different clusters. In contrast, other traits contributed relatively less to the clustering pattern.

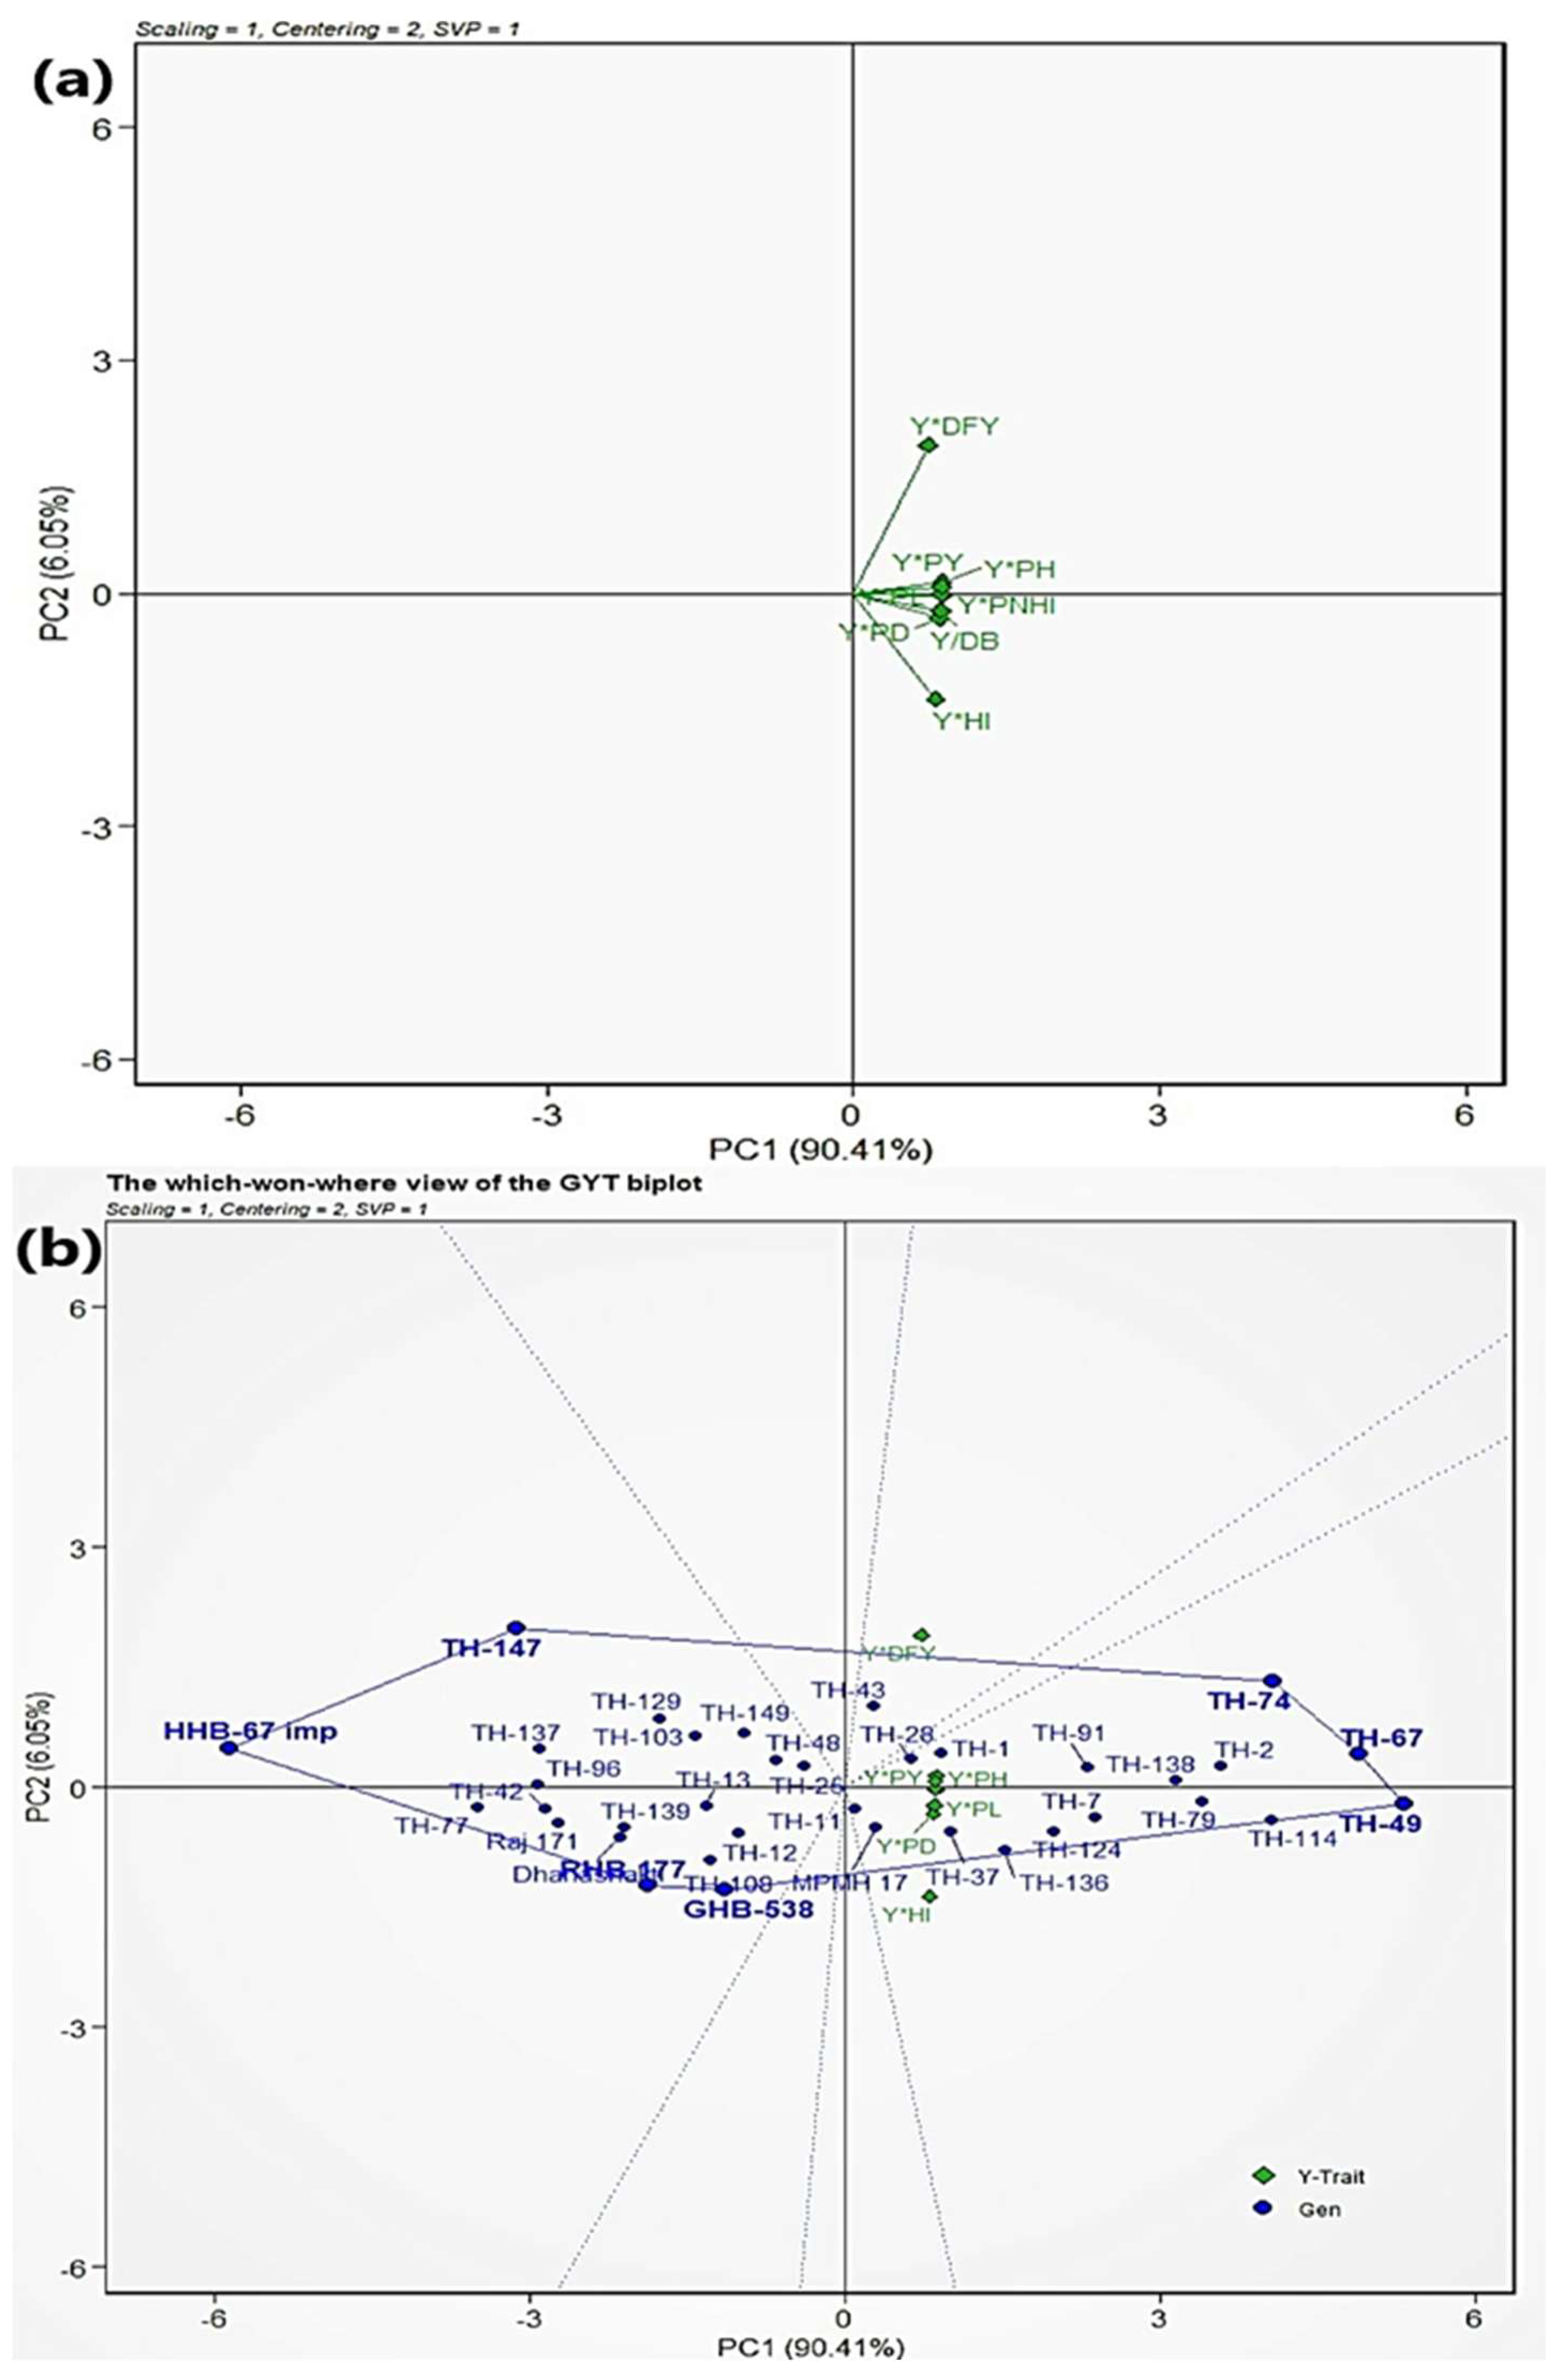
3.6. Genotype by Yield × Trait (GYT) Biplot

The GYT data table (Supplementary Table S4) was derived from the original yield and component trait data. GYT biplots (Figure 5) were generated from a standardized GY × T table (Table 6) to graphically represent the data in a 2D biplot. Together with the first two PCs, it displays 96.46% of the total variation among the yield and trait combinations. This explains the comparative advantage of GYT (Figure 5) over PCA, as PCA explains only 61.30% of the variation (Figure 3) based on the first two PCs. As depicted in Figure 5a, the tester view of the GYT biplot demonstrates associations among the different yield × trait combinations. Since yield was a component in all yield–trait combinations, a positive correlation among all yield × traits combination was observed, which can be identified as an acute angle between them, as displayed in the biplot. Exceptionally, Y*DFY and Y*HI show an obtuse angle between them, which was quite expected due to the highly significant negative correlation between the DFY and HI (Figure 1).
The polygon view or “which-won-where” view of the GYT plot as displayed in Figure 5b is helpful to visually understand the trait profiles of the tested genotypes. Connecting the genotypes with the longest vectors in all directions leads to the formation of asymmetric/irregular polygon. A line drawn for each polygon side starting from biplot origin and perpendicular to the polygon side splits the yield × trait combinations into two sectors. Each sector with polygon vertex/peaks represents the genotype with the highest values for the corresponding yield–trait combination. Thus, three-way hybrids such as TH-49, TH-67, and TH-74 had the largest values for Y/DB, Y*PH, Y*PY, Y*PL, Y*PD, Y*PNHI, and Y*HI and were the best hybrids identified for combining yield with early flowering, taller plants with better drought tolerance (because of higher PNHI), and harvest index. TH-43 was close to Y*DFY, indicating the desirability of the cultivar for yield with a combination of dry fodder yield. On the other hand, hybrids such as TH-147, HHB 67 Imp, RHB-177, and GHB-538 showed no correlation with any of these yield–trait combinations, indicating the poor performance of these hybrids compared to the newly developed TWHs.
In the average tester coordination (ATC) view of the GYT biplot, the most promising genotypes were visually ranked based on their yield × trait combinations (Figure 6). The genotypes were plotted based on genotype-focused singular value partitioning, with the objective of comparing genotypes based on their trait profiles. The line passing through the biplot origin and average trait combination is called the average tester axis (ATA) and is helpful in ranking genotypes according to their usefulness. Hybrids with balanced trait-profiles were found to be close to the ATA. In contrast, hybrids located far from the ATA in either direction tend to have apparent strength and weakness for that particular yield–trait combination. Following this principle of the GYT biplot as displayed in Figure 6, the best-ranked hybrids were TH-49 > TH-67 > TH-74 > TH-114 > TH-2 > TH-79 > TH-138. However, genotypes such as HHB 67 Imp, TH-147, TH-77, TH-137, TH-96, TH-42, and Raj 171 were placed on the far-left side of the biplot, indicating that they were the poorest performers for yield and component traits (Figure 6). These results were confirmed by the ranking of genotypes based on superiority index (SI) (Table 6).

3.7. Identification of Most Promising Three-Way Hybrids

The top 20% of the tested three-way hybrids (six hybrids) based on different selection methods were listed in Table 7. Based on all criteria, such as standard heterosis, stability parameter (mean vs. cv biplot), cluster analysis, and GYT biplot, it was observed that three-way hybrids are effective alternatives to the most popular single-cross hybrids such as HHB-67-Imp as well as those for OPV like Raj 171. Most of the hybrids were ranked as superior based on SI, and the GYT biplot showed higher standard heterosis for grain yield, reflecting the practical utility of the GYT method. In the case of the GYT biplot, high-yielding hybrids could be selected in combination with other component traits per product profile. Overall, hybrids such as TH-114, TH-138, TH-49, TH-67, and TH-79 can be considered for further evaluation to explore their commercial utility.

4. Discussion

Large parts of the north-western regions of India, having semi-arid and arid ecology, exhibit lower pearl millet productivity than other areas due to their limited and irregular rainfall patterns. Additional agro-climatic factors, such as elevated soil and air temperatures as well as poor soil fertility, significantly influence cultivar adoption, leading to reduced productivity compared to non-arid regions [6,40]. The region classified as the A1 zone (the most arid region) encompasses parts of the western Rajasthan, Haryana, and Gujarat states of India, with an annual rainfall of less than 400 mm and predominantly sandy soil [13,41]. Therefore, enhancing drought tolerance is a top priority in breeding programs to ensure high grain yields in such challenging environments [4,11]. Based on these premises, our research aimed to assess the variability among newly developed three-way hybrids and to identify promising hybrids with extensive adaptation to drought-prone Indian ecologies.
In this context, the present study was carried out during the rainy season of 2021, where thirty newly developed TWHs, along with six checks (comprising four popular single-cross hybrids and two OPVs), were evaluated at three different sites. An analysis for grain yield and associated traits was performed using a generalized linear model, and the combined ANOVA across the environments revealed significant variations among the genotypes for GY, DFY, and DB. Nevertheless, for other traits, the genotype effect was not statistically significant. A delay in DB and lower yield at the Bikaner location were observed due to the exposure of crops to mid-season water stress during the growing season. Earlier reports also showed that genotypes exposed to mid-season water stress led to some adverse effects on crop phenology such as delayed flowering, which resulted in considerable yield reductions [15,16].
Furthermore, to understand trait variability and the relationships among traits in the tested genotypes for the selection of desirable hybrids, we calculated Pearson’s correlations between grain yield and related traits. This revealed a highly positive and significant association among GY, DFY, HI, and PNHI, indicating that selection for dual-purpose hybrids for increased GY and DFY is possible. The robust positive correlation observed between GY, DFY, and PH suggests that cereals with increased height typically yield higher biomass, which in turn directly influences grain yield, as reported by Austin [42]. Similar trait associations between yield and its component traits have been reported in other studies of pearl millet [2,43].
The commercial utility of any newly developed hybrid depends on the magnitude of the standard heterosis for economic traits expressed by that particular hybrid over the best-known existing check or cultivar from the target ecology. Thus, standard heterosis values for grain yield and other component traits were computed in comparison with the widely used hybrid HHB-67-Imp across all hybrid genotypes. Most three-way hybrids exhibited positive heterosis for both yield and its related traits. The All India Coordinated Pearl Millet Improvement Project (AICMIP), the nodal body for the release of pearl millet cultivars in India, follows a specific criterion for promoting hybrids in this drought-affected ecology. The new test hybrid should show a 10% higher grain yield over the check (in most cases, it is HHB-67-Imp, as it is the most popular hybrid in this ecology) with DB equivalent or lower than HHB-67-Imp. If a hybrid exhibits a yield heterosis greater than 15% compared to HHB-67-Imp, it can still be promoted to advance trials with a relaxation of a one- or two-days delay in DB compared to HHB-67-Imp [44]. The majority of the tested TWHs in this study flowered in the range of ± 2 days compared to HHB-67-Imp. Hence, hybrids such as TH-49, TH-2, TH-67, TH-79, TH-124, TH-138, TH-124, and TH-114, which had highly significant positive heterosis for GY, PNHI, and HI and had comparable DB to HHB-67-Imp, can be considered for further evaluation.
A hybrid’s adaptability relies on its performance across various locations and/or seasons. Therefore, consistent performance across locations is important for selecting high-yielding and stable genotypes, and to facilitate this mean versus CV biplots were generated. As depicted in Figure 2, high-yielding stable genotypes such as TH-7, TH-79, TH-28, TH-36, TH-138, and TH-129 for GY and genotypes with high DFY and low CV, such as TH-124, TH-103, TH-149, TH-11, TH-49, TH-114, and TH-25 were identified. Genotypes with high yield performance and lower CV showed greater stability (Group 1) than those with greater CV. Genotypes with higher average yield and high CV (Group 2) are considered suitable to specific environments [45]. In previous studies, it was noted that the genetic heterogeneity within specific groups of genotypes, such as TWHs or OPVs, offers a population buffering mechanism that results in increased and consistent performance of cultivars in such challenging and unpredictable drought-prone environments [11,38,46,47,48,49].
However, compared to hybrid selection based on yield per se alone, selecting hybrids based on a combination of yield and other component traits is more acceptable in the case of multi-trait evaluation [50]. Therefore, in the present study, different multivariate methods were employed to identify hybrids that strike a better balance between multiple traits, thereby optimizing crop performance. This approach allows breeders to perform a comprehensive assessment, providing a more holistic view of the hybrid performance. Principal component analysis (PCA) is a statistical technique that reveals the importance and contributions of individual components to the overall variance within a dataset [51]. PCA revealed that the first three PC had eigenvalues of more than one, accounting for 74.10% of the total variability. GY, PNHI, DB and PY contributed most to the diversity captured in the first principal component (PC1), which was in the positive direction. HI (negative) and PH (positive) were prominent in the diversity captured by the second principal component (PC2). However, PL and PY contributed most to the diversity captured in the third principal component (PC3) in the positive direction. Earlier studies have reported a similar trend for PC analysis for different sets of materials in pearl millet for yield and its component traits [52,53,54]. The greatest separation between the DFY and HI vectors, characterized by an obtuse angle in the vector space, revealed a negative association between these traits. This observation, based on PCA matrix data, corroborated the findings of Pearson’s trait association studies. Such similarities between the projection of traits/variables based on biplot analysis and trait correlation suggest the utility of PCA for visually assessing variability among genotypes, as previously reported [55].
The primary objective of cluster analysis is to classify genotypes based on trait performance and complex inter-relationships to facilitate effective selection [56]. Some of the most promising hybrids such as TH-28, TH-124, TH-37, TH-67, TH-49, and TH-138, which possessed high grain and dry fodder yields with greater PNHI and HI, were found to be grouped in cluster C-III, indicating that the selection of desirable hybrids from this group is effective and helpful in promoting the best hybrids for commercial utilization.
It is essential to consider all key component traits when choosing a desirable genotype for a goal attribute such as yield, which is a complex trait. In the case of traditional selection indices, the weights of the traits are fixed. Yield is independent of the level of other traits, which may result in the selection of low-yielding genotypes because they have superior performance for other traits [57]. GYT biplots are a more meaningful and effective approach to handle breeding material in multi-trait and multi-environment selection of desirable candidate genotypes [58]. The tester view of the GYT biplot (Figure 5a) visually illustrates the relationship between grain yield and other trait combinations. A positive association among all yield × trait combinations was observed, which is one of the key features of the GYT biplots. This is helpful in reducing the traits to be evaluated during the assessment and selection of superior genotypes [59]. The relationship between different traits helps us to understand crop yield and its component traits. This facilitates the identification of traits that can be utilized in the indirect selection of superior cultivars. Moreover, traits associated with grain yield should be considered during the selection of desirable genotypes [27,60].
The polygon view of the GYT biplot (Figure 5b) displays the genotypes according to their trait profiles, which differentiate the tested genotypes based on their strengths and weaknesses. This highlights the potential utility of such biplots in understanding the overall trait-profile, particularly when selecting genotypes for grain yield, in conjunction with other traits. Earlier reports also demonstrated that the GYT biplot approach proved to be highly effective and comprehensive in visually representing genotypes and in identifying superior genotypes based on their strengths and weaknesses vis-à-vis yield and other traits [57,58,61].
The average tester coordination (ATC) view of the GYT biplot (Figure 6) and superiority ranking (SI) (Table 6) ranked genotypes based on their strengths and weaknesses for yield × trait combinations. This GYT index ensures that the selected hybrids/genotypes have a high grain yield ability. Although the GYT approach considers too much weightage for grain yield relative to other component traits, in a practical sense, it is acceptable and valuable [27] as it considers the reality of the pearl millet value chain in this ecology, where high-yielding, dual-purpose, and early maturing cultivars are the preferred choice. Several earlier published reports have shown the superiority and practical utility of the GYT index over the traditional selection index in various crops such as sunflower [59], oat [27,57], wheat [61,62] and maize [50].
In addition, the present study highlights that when compared to conventional statistical techniques such as ANOVA, mean comparison, linear correlation, and cluster analysis, the GYT biplot approach proved to be more effective in identifying promising genotypes. Based on various selection methods, including standard heterosis, stability analysis (mean vs. coefficient of variation biplot), cluster analysis, and GYT biplots, it is evident that three-way hybrids offer a compelling alternative to well-established single-cross hybrid HHB-67-Imp and OPVs such as Raj 171. Although our findings provide valuable insights, the evaluation of the hybrids under investigation was confined to a single season, which is a limitation of our study. Therefore, a thorough validation of these hybrids may require the inclusion of more multilocation and multiseason/multi-year trials for robust conclusions. Also, we must mention here that some of these hybrids when evaluated during 2022 at 11 locations in drought-prone areas of north-western India (A1 zone) as part of national cultivar release trials showed about 30–40% higher yields than the check hybrid HHB-67-Improved. Notably, TH-114, TH-138, TH-49, TH-67, and TH-79 demonstrated promising potential for further assessment, exploring their suitability for commercial production. With an average increase of 30% in grain productivity compared to HHB-67-Imp, these three-way hybrids present a robust case for adoption in arid and semi-arid regions. Furthermore, this significant gain in grain yield is accompanied by enhanced stover yield and improved drought tolerance, enhancing their appeal and potential in these regions. In addition, the potential advantages of sterile F1 in three-way hybrids seed production are helpful for minimizing the cost of seed production. This also provides an opportunity to effectively utilize some of the promising late-maturing inbred lines to develop promising three-way hybrids [63].

5. Conclusions

In the present study, we evaluated thirty newly developed three-way hybrids in drought-prone areas of India with the objective to identify hybrids with wide adaptation. We performed PCA, cluster analysis, and GYT biplot techniques to assess the genetic variation in yield and related traits. The results indicate that the tested three-way hybrids outperformed the popular check hybrid HHB-67-Imp in terms of grain and fodder yields. Notably, a group of highly promising three-way hybrids, including TH-114, TH-138, TH-49, TH-67, and TH-79, consistently outperformed the widely used single-cross check hybrids in terms of both grain and fodder yield. This underscores their potential to enhance the grain yield under such challenging conditions. These hybrids exhibited substantial standard heterosis (averaging 30%) and maintained stable performance, making them promising choices for farmers in drought-prone regions of India. The findings of this study provide valuable insights for improving pearl millet yields under such adverse environmental conditions and are a valuable resource for future breeding efforts. Further research should include comprehensive multiseason, multilocation trials to fully validate their practical utility and adaptability.

Supplementary Materials

The following supporting information can be downloaded at: https://www.mdpi.com/article/10.3390/agronomy13112813/s1. Figure S1: Metrological characteristics of the experimental sites; Figure S2: Box plot for agro-morphological traits of 36 genotypes across the locations; Figure S3. Stability (mean yield plotted against CV) parameter for 36 genotypes across the three different locations. (a) DB: days to 50% flowering (days), (b) PH: plant height (cm). Table S1. List of Genotypes and parental details used in experimentation; Table S2. Adjusted mean values of 36 genotypes (34 hybrids and 2 OPVs) for grain yield and component traits across environments; Table S3. The relative contribution of important traits in genotype clustering pattern; Table S4. Genotype by yield*trait (GYT) data for 36 pearl millet cultivars.

Author Contributions

Conceptualization, K.K., V.P. and S.K.G.; methodology, K.K. and S.K.G.; software, K.K. and S.K.G.; validation, V.P. and S.K.G.; formal analysis, K.K.; investigation, K.K. and P.C.G.; resources, S.K.G.; data curation, K.K.; writing—original draft preparation, K.K. and S.K.G.; writing—review and editing, V.P., R.R., J.P. and N.S.; visualization, K.K.; supervision, V.P. and S.K.G.; project administration, S.K.G.; funding acquisition, S.K.G. All authors have read and agreed to the published version of the manuscript.

Funding

This research was financially supported by the ICRISAT-Pearl Millet Hybrid Parents Research Consortium (PMHPRC) and Sehgal Foundation, USA and UGC-NFOBC National Fellowship to Kuldeep Kandarkar for carrying out a doctoral study at ICRISAT.

Data Availability Statement

The authors state that all data generated or analyzed during this study are included in this article. The full data used to support the findings of this study are available from the corresponding author upon request.

Acknowledgments

This research was carried out as part of PhD thesis by Kuldeep Kandarkar a student at Tamil Nadu Agricultural University, Coimbatore, Tamil Nadu.

Conflicts of Interest

The authors declare no conflict of interest. The funders had no role in the study design; collection, analyses, or interpretation of data; writing of the manuscript; or decision to publish the results.

References

  1. Jukanti, A.K.; Gowda, C.L.L.; Rai, K.N.; Manga, V.K.; Bhatt, R.K. Crops That Feed the World 11. Pearl Millet (Pennisetum glaucum L.): An Important Source of Food Security, Nutrition and Health in the Arid and Semi-Arid Tropics. Food Secur. 2016, 8, 307–329. [Google Scholar] [CrossRef]
  2. Sanjana Reddy, P.; Satyavathi, C.T.; Khandelwal, V.; Patil, H.T.; Gupta, P.C.; Sharma, L.D.; Mungra, K.D.; Singh, S.P.; Narasimhulu, R.; Bhadarge, H.H.; et al. Performance and Stability of Pearl Millet Varieties for Grain Yield and Micronutrients in Arid and Semi-Arid Regions of India. Front. Plant Sci. 2021, 12, 670201. [Google Scholar] [CrossRef] [PubMed]
  3. Mohammed, R.; Gangashetty, P.I.; Karimoune, L.; Ba, N.M. Genetic Variation and Diversity of Pearl Millet [Pennisetum glaucum (L.)] Genotypes Assessed for Millet Head Miner, Heliocheilus Albipunctella Resistance, in West Africa. Euphytica 2020, 216, 158. [Google Scholar] [CrossRef]
  4. Yadav, O.P.; Rai, K.N.; Khairwal, I.S.; Rajpurohit, B.S.; Mahala, R.S. Breeding Pearl Millet for Arid Zone of North-Western India: Constraints, Opportunities and Approaches; All India Coordinated Pearl Millet Improvement Project (AICPMIP-ICAR): Jodhpur, India, 2011.
  5. Yadav, O.P.; Rai, K.N. Genetic Improvement of Pearl Millet in India. Agric. Res. 2013, 2, 275–292. [Google Scholar] [CrossRef]
  6. Yadav, O.P.; Singh, D.V.; Vadez, V.; Gupta, S.K.; Rajpurohit, B.S.; Shekhawat, P.S. Improving Pearl Millet for Drought Tolerance- Retrospect and Prospects. Indian J. Genet. Plant Breed. 2017, 77, 464–474. [Google Scholar] [CrossRef]
  7. Vadez, V.; Hash, T.; Bidinger, F.R.; Kholova, J., II. 1.5 Phenotyping Pearl Millet for Adaptation to Drought. Front. Physiol. 2012, 3, 1–12. [Google Scholar] [CrossRef]
  8. Carberry, P.S.; Campbell, L.C.; Bidinger, F.R. The growth and development of pearl millet as affected by plant population. Field Crop. Res. 1985, 11, 193–205. [Google Scholar] [CrossRef]
  9. Howarth, C.J.; Rattunde, E.W.; Bidinger, F.R.; Harris, D. Seedling Survival of Abiotic Stress: Sorghum and Pearl Millet. In Proceedings of the International Conference on Genetic Enhancement of Sorghum and Pearl Millet, Lubbock, TX, USA, 22–27 September 1996; ICAR: New Delhi, India, 1996; pp. 379–399. [Google Scholar]
  10. Yadav, O.P.; Rajpurohit, G.R.; Kumar, A. Prospects of Enhancing Pearl Millet (Pennisetum Glaucum)Productivity under Drought Environments of North-Western India through Hybrids. Indian J. Genet. Plant Breed. 2012, 72, 25–30. [Google Scholar]
  11. Lahiri, A.N.; Kumar, V. Studies on Plant Water Relationship III. Further Studies on the Drought Mediated Alterations in the Performance of Bulrush Millet. Proc. Natl. Acad. Sci. India B 1996, 32, 116–129. [Google Scholar]
  12. Kholová, J.; Hash, C.T.; Kakkera, A.; Koová, M.; Vadez, V. Constitutive Water-Conserving Mechanisms Are Correlated with the Terminal Drought Tolerance of Pearl Millet [Pennisetum glaucum (L.) R. Br.]. J. Exp. Bot. 2010, 61, 369–377. [Google Scholar] [CrossRef]
  13. Medina, S.; Gupta, S.K.; Vadez, V. Transpiration Response and Growth in Pearl Millet Parental Lines and Hybrids Bred for Contrasting Rainfall Environments. Front. Plant Sci. 2017, 8, 1846. [Google Scholar] [CrossRef] [PubMed]
  14. Van Oosterom, E.J.; Weltzien, E.; Yadav, O.P.; Bidinger, F.R. Grain Yield Components of Pearl Millet under Optimum Conditions Can Be Used to Identify Germplasm with Adaptation to Arid Zones. Field Crop. Res. 2006, 96, 407–421. [Google Scholar] [CrossRef]
  15. Bidinger, F.R.; Mahalakshmi, V.; Rao, G.D.P. Assessment of Drought Resistance in Pearl Millet [Pennisetum americanum (L.) Leeke). I Factors Affecting Yields under Stress. Aust. J. Agric. Res. 1987, 38, 37–48. [Google Scholar] [CrossRef]
  16. Mahalakshmi, V.; Bidinger, F.R.; Raju, D.S. Effect of Timing of Water Deficit on Pearl Millet (Pennisetum americanum). Field Crop. Res. 1987, 15, 327–339. [Google Scholar] [CrossRef]
  17. Fussel, L.K.; Bidinger, F.R.; Bieler, P. Crop Physiology and Breeding for Drought Tolerance: Research and Development. Field Crop. Res. 1991, 27, 183–199. [Google Scholar] [CrossRef]
  18. Srivastava, R.K.; Yadav, O.P.; Kaliamoorthy, S.; Gupta, S.K.; Serba, D.D.; Choudhary, S.; Govindaraj, M.; Kholová, J.; Murugesan, T.; Satyavathi, C.T.; et al. Breeding Drought-Tolerant Pearl Millet Using Conventional and Genomic Approaches: Achievements and Prospects. Front. Plant Sci. 2022, 13, 781524. [Google Scholar] [CrossRef]
  19. Rai, K.N.; Gupta, S.K.; Govindaraj, M.; Yadav, H.P. Indian Farming; Indian Council of Agricultural Research (ICAR): New Delhi, Indaia, 2015; pp. 19–22. [Google Scholar]
  20. Tom Hash, C.; Sharma, A.; Kolesnikova-Allen, M.A.; Singh, S.D.; Bhasker Raj, A.G.; Ratnaji Rao, M.N.V.; Nijhawan, D.C.; Beniwal, C.R.; Sagar, P.; Yadav, H.P.; et al. Teamwork Delivers Biotechnology Products to Indian Small-Holder Crop-Livestock Producers: Pearl Millet Hybrid “HHB 67 Improved” Enters Seed Delivery Pipeline. SAT eJ. 2006, 2. Available online: http://oar.icrisat.org/id/eprint/2738 (accessed on 25 June 2023).
  21. Izge, A.U.; Dugje, I.Y. Performance of Drought Tolerant Three-Way and Top Cross Maize Hybrids in Sudan Savanna of North Eastern Nigeria. J. Plant Breed. Crop Sci. 2011, 3, 269–275. [Google Scholar]
  22. Meseka, S.; Menkir, A.; Bossey, B.; Mengesha, W. Performance Assessment of Drought Tolerant Maize Hybrids under Combined Drought and Heat Stress. Agronomy 2018, 8, 274. [Google Scholar] [CrossRef]
  23. Amole, T.; Adekeye, A.; Bakare, B.; Meseka, S.; Mengesha, W.; Menkir, A. Assessing the Fodder Potentials of Drought-Tolerant Maize (Zea mays L.) Hybrids in West Africa. Int. J. Agron. 2022, 2022, 1348711. [Google Scholar] [CrossRef]
  24. Syngenta Foundation. Affordable, Accessible, Asian (“AAA”) Drought-Tolerant Maize Overview of a Collaborative Program. between CIMMYT and Syngenta, Supported and Coordinated by Syngenta Foundation for Sustainable Agriculture; Syngenta Foundation: Basel, Switzerland, 2021. [Google Scholar]
  25. Hohls, T. Analysis of Genotype-Environment Interactions. S Afr. J. Sci. 1995, 91, 121–124. [Google Scholar]
  26. Kandel, M.; Ghimire, S.K.; Ojha, B.R.; Shrestha, J. Cluster Analysis among the Maize Inbred Lines (Zea mays L.) under Heat Stress Condition. Int. J. Glob. Sci. Res. 2018, 5. [Google Scholar] [CrossRef]
  27. Yan, W.; Frégeau-Reid, J. Genotype by Yield∗Trait (GYT) Biplot: A Novel Approach for Genotype Selection Based on Multiple Traits. Sci. Rep. 2018, 8, 8242. [Google Scholar] [CrossRef]
  28. Sparks, A. Nasapower: A NASA POWER Global Meteorology, Surface Solar Energy and Climatology Data Client for R. J. Open Source Softw. 2018, 3, 1035. [Google Scholar] [CrossRef]
  29. Hajjarpoor, A.; Vadez, V.; Soltani, A.; Gaur, P.; Whitbread, A.; Suresh Babu, D.; Gumma, M.K.; Diancoumba, M.; Kholová, J. Characterization of the Main Chickpea Cropping Systems in India Using a Yield Gap Analysis Approach. Field Crop. Res. 2018, 223, 93–104. [Google Scholar] [CrossRef]
  30. Ronanki, S.; Pavlík, J.; Masner, J.; Jarolímek, J.; Stočes, M.; Subhash, D.; Talwar, H.S.; Tonapi, V.A.; Srikanth, M.; Baddam, R.; et al. An APSIM-Powered Framework for Post-Rainy Sorghum-System Design in India. Field Crop. Res. 2022, 277, 108422. [Google Scholar] [CrossRef]
  31. Bates, D.; Mächler, M.; Bolker, B.M.; Walker, S.C. Fitting Linear Mixed-Effects Models Using Lme4. J. Stat. Softw. 2015, 67, 1–48. [Google Scholar] [CrossRef]
  32. Revelle, W. Package “Psych” Procedures for Psychological, Psychometric, and Personality Research; R Package Version 2.3.9; Northwestern University: Evanston, IL, USA, 2023; p. 469. Available online: https://CRAN.R-project.org/package=psych (accessed on 25 June 2023).
  33. Meredith, W.R.; Bridge, R.R. Heterosis and Gene Action in Cotton, Gossypium hirsutum L. Crop Sci. 1972, 12, 304–310. [Google Scholar] [CrossRef]
  34. Francis, T.R.; Kannenberg, L.W. Yield Stability Studies in Short-Season Maize. I. A Descriptive Method for Grouping Genotypes. Can. J. Plant Sci. 1978, 58, 1029–1034. [Google Scholar] [CrossRef]
  35. Pacheco, A.; Vargas, M.; Alvarado, G.; Rodríguez, F.; Crossa, J.; Burgueño, J. GEA-R (Genotype × Environment Analysis with R for Windows), Version 4.1. CIMMYT Research Data & Software Repository Network, V16. 2015. Available online: https://hdl.handle.net/11529/10203 (accessed on 25 June 2023).
  36. Vaissie, P.; Monge, A.; Husson, F. FactoShiny: Perform Factorial Analysis from ’FactoMineR’ with a Shiny. R Package Version 2.4. 2021. Available online: https://cran.r-project.org/web/packages/Factoshiny/Factoshiny.pdf (accessed on 25 June 2023).
  37. Olivoto, T.; Lúcio, A.D.C. Metan: An R Package for Multi-Environment Trial Analysis. Methods Ecol. Evol. 2020, 11, 783–789. [Google Scholar] [CrossRef]
  38. Allard, R.W.; Bradshaw, A.D. Implications of Genotype-Environmental Interactions in Applied Plant Breeding. Crop Sci. 1964, 4, 503–508. [Google Scholar] [CrossRef]
  39. Badu-Apraku, B.; Talabi, A.O.; Ifie, B.E.; Chabi, Y.C.; Obeng-Antwi, K.; Haruna, A.; Asiedu, R. Gains in Grain Yield of Extra-Early Maize during Three Breeding Periods under Drought and Rainfed Conditions. Crop Sci. 2018, 58, 2399–2412. [Google Scholar] [CrossRef] [PubMed]
  40. Khairwal, I.S.; Yadav, O.P. Pearl Millet (Pennisetum glacum) Improvement in India-Retrospect and Prospects. Indian. J. Agric. Sci. 2005, 75, 183–191. [Google Scholar]
  41. Gupta, S.K.; Rathore, A.; Yadav, O.P.; Rai, K.N.; Khairwal, I.S.; Rajpurohit, B.S.; Das, R.R. Identifying Mega-Environments and Essential Test Locations for Pearl Millet Cultivar Selection in India. Crop Sci. 2013, 53, 2444–2453. [Google Scholar] [CrossRef]
  42. Austin, R.B.; Ford, M.A.; Morgan, C.L.; Yeoman, D. Old and Modern Wheat Cultivars Compared on the Broadbalk Wheat Experiment. Eur. J. Agron. 1993, 2, 141–147. [Google Scholar] [CrossRef]
  43. Yadav, O.; Rai, K.; Yadav, H.; Rajpurohit, B.; Gupta, S.; Rathore, A.; Karjagi, C. Assessment of Diversity in Commercial Hybrids of Pearl Millet in India. Indian. J. Plant Genet. Resour. 2016, 29, 130. [Google Scholar] [CrossRef]
  44. All India Coordinated Research Project on Pearl Millet (Indian Council of Agricultural Research). In 52nd Annual Group Meeting of All India Coordinated Research Project on Pearl Millet; Indian Council of Agricultural Research: Mandor, India, 2017.
  45. Changizi, M.; Choukan, R.; Heravan, E.M.; Bihamta, M.R.; Darvish, F. Evaluation of Genotype × Environment Interaction and Stability of Corn Hybrids and Relationship among Univariate Parametric Methods. Can. J. Plant Sci. 2014, 94, 1255–1267. [Google Scholar] [CrossRef]
  46. Bradshaw, A.D. Evolutionary significance of phenotypic plasticity in plants. Adv. Genet. 1965, 13, 115–155. [Google Scholar]
  47. Schnell, F.W.; Becker, H.C. Yield and Yield Stability in a Balanced System of Widely Differing Population Structures in Zea mays L. Plant Breed. 1986, 97, 30–38. [Google Scholar] [CrossRef]
  48. Haussmann, B.I.G.; Obilana, A.B.; Ayiecho, P.O.; Blum, A.; Schipprack, W.; Geiger, H.H. Yield and Yield Stability of Four Population Types of Grain Sorghum in a Semi-Arid Area of Kenya. Crop Sci. 2000, 40, 319–329. [Google Scholar] [CrossRef]
  49. Fayeun, L.; Sesay, S. Evaluation of Drought Tolerant Top Cross and Three-Way Cross Maize Hybrids for Grain Yield and Related Traits in Three Agro-Ecological Zones of Southwest Nigeria. Not. Sci. Biol. 2019, 11, 414–421. [Google Scholar] [CrossRef]
  50. Singamsetti, A.; Shahi, J.P.; Zaidi, P.H.; Seetharam, K. Study on Applicability of Genotype × Yield × Trait (GYT) Biplots over Genotype × Trait (GT) Biplots in Selection of Maize Hybrids across Soil Moisture Regimes. Indian. J. Agric. Res. 2022, 56, 1–7. [Google Scholar] [CrossRef]
  51. Sanni, K.A.; Fawole, I.; Ogunbayo, S.A.; Tia, D.D.; Somado, E.A.; Futakuchi, K.; Sié, M.; Nwilene, F.E.; Guei, R.G. Multivariate Analysis of Diversity of Landrace Rice Germplasm. Crop Sci. 2012, 52, 494–504. [Google Scholar] [CrossRef]
  52. Chaudhary, S.; Sagar, P.; Hooda, B.K.; Arya, R.K. Multivariate Analysis of Pearl Millet Data to Delineate Genetic Variation. Forage Res. 2015, 40, 201–208. [Google Scholar]
  53. Gupta, D.; Khandelwal, V. Principal Component Analysis for Yield and Its Attributing Characters of Pearl Millet (Pennisetum glaucum [L.] R.Br.). Ann. Plant Soil. Res. 2022, 24, 408–414. [Google Scholar] [CrossRef]
  54. Shashibhushan, D.; Sameer Kumar, C.V.; Kondi, R.K.R. Principal Component Analysis for Yield and Yield Related Traits in Pearl Millet Cultivars. Ecol. Environ. Conserv. 2022, 28, S104–S107. [Google Scholar] [CrossRef]
  55. Pujar, M.; Govindaraj, M.; Gangaprasad, S.; Kanatti, A.; Shivade, H. Genetic Variation and Diversity for Grain Iron, Zinc, Protein and Agronomic Traits in Advanced Breeding Lines of Pearl Millet [Pennisetum Glaucum (L.) R. Br.] for Biofortification Breeding. Genet. Resour. Crop Evol. 2020, 67, 2009–2022. [Google Scholar] [CrossRef]
  56. Bista, P.; Thapa, S.; Rawal, S.; Dhakal, D.; Joshi, D. Agro-Morphological Characterization and Estimation of Genetic Parameters of Spring Maize Hybrids in the Inner Plains of Far-West Nepal. Int. J. Agron. 2022, 2022, 4806266. [Google Scholar] [CrossRef]
  57. Gholizadeh, A.; Ghaffari, M. Genotype by Yield* Trait (GYT) Biplot Analysis: A Novel Approach for Phenotyping Sunflower Single Cross Hybrids Based on Multiple Traits. Food Sci. Nutr. 2023, 11, 5928–5937. [Google Scholar] [CrossRef]
  58. Yan, W.; Tinker, N.A. Biplot Analysis of Multi-Environment Trial Data: Principles and Applications. Can. J. Plant Sci. 2006, 86, 623–645. [Google Scholar] [CrossRef]
  59. Kendal, E. Comparing Durum Wheat Cultivars by Genotype × Yield × Trait and Genotype × Trait Biplot Method. Chil. J. Agric. Res. 2019, 79, 512–522. [Google Scholar] [CrossRef]
  60. Yan, W.; Fregeau-Reid, J.; Mountain, N.; Kobler, J. Genotype and Management Evaluation Based on Genotype by Yield*Trait (GYT) Analysis. Crop Breed. Genet. Genom. 2019, 1, e190002. [Google Scholar] [CrossRef]
  61. Sofi, P.A.; Saba, I.; Ara, A.; Rehman, K. Comparative Efficiency of GY*T Approach Over GT Approach in Genotypic Selection in Multiple Trait Evaluations: Case Study of Common Bean (Phaseolus Vulgaris) Grown Under Temperate Himalayan Conditions. Agric. Res. 2022, 11, 373–381. [Google Scholar] [CrossRef]
  62. Mohammadi, R. Genotype by Yield*trait Biplot for Genotype Evaluation and Trait Profiles in Durum Wheat. Cereal Res. Commun. 2019, 47, 541–551. [Google Scholar] [CrossRef]
  63. Rai, K.N.; Chandra, S.; Rao, A.S. Potential Advantages of Male-Sterile F1 Hybrids for Use as Seed Parents of Three-Way Hybrids in Pearl Millet. Field Crop Res. 2000, 68, 173–181. [Google Scholar] [CrossRef]
Figure 1. Pearson’s correlation coefficient matrix between measured agro-morphological traits of the 36 genotypes. DB: days to 50% flowering (days), GY: grain yield (kg/ha), DFY: dry fodder yield (kg/ha), PH: plant height (cm), PL: panicle length (cm), PD: panicle diameter (mm), PY: panicle yield (kg/ha), PNHI: panicle harvest index (%), and HI: harvest index (%). * p < 0.05, ** p < 0.01, *** p < 0.001.
Agronomy 13 02813 g001
Figure 2. Stability (mean yield plotted against CV) parameter for 36 genotypes across the three different locations. (a) DFY: dry fodder yield (kg/ha), (b) GY: grain yield (kg/ha).
Agronomy 13 02813 g002
Figure 3. Principal component analysis biplot for first two components (a) for individuals (genotypes) and (b) projection of nine quantitative characters. GY: grain yield (kg/ha), DFY: dry fodder yield (kg/ha), DB: days to 50% flowering (days), PH: plant height (cm), PD: panicle diameter (mm), PL: panicle length (cm), PY: panicle yield (kg/ha), PNHI: panicle harvest index (%), and HI: harvest index.
Agronomy 13 02813 g003
Figure 4. A dendrogram illustrates the hierarchical clustering pattern of 36 genotypes, based on the Euclidean distance. Different colored boxes distinguish distinct clusters and their respective members. Positioned in the top right section is a bar plot demonstrating the inertia gains resulting from hierarchical clustering applied to PCA results. Solid and empty bars within this plot delineate the cluster tree cut levels.
Agronomy 13 02813 g004
Figure 5. The genotype by yield*trait (GYT) biplot. (a) The tester vector view shows the associations among the different yield–trait combinations. Each green color vector shows the discrimination power of the yield × trait combination (the longer the vector the more discrimination power that yield × trait combination has). (b) The which-won-where polygon biplot highlights outstanding genotype for particular yield*trait profile. The green vector symbolizes the yield × trait combination, with genotypes represented by the blue color. Dotted lines intersect the origin, dividing the polygon into distinct sectors. At each sector’s vertex, the bold genotype (for each sector) indicated genotype with the highest values for the respective yield–trait combinations. Y: grain yield, DFY: dry fodder yield, DB: days to 50% flowering, PH: plant height, PD: panicle diameter, PL: panicle length, PY: panicle yield, PNHI: panicle harvest index, and HI: harvest index. Green color = yield × trait combination and blue color = genotypes.
Agronomy 13 02813 g005
Figure 6. The average tester coordination view of the GYT biplot to rank the genotype based on the overall superiority. The green arrowhead line that passes through the origin (ATA) indicates superior performance of a genotype and the blue dotted lines extending from the green arrowhead lines illustrating the balanced trait-profiles of the genotypes (the shorter the dotted line the higher the balanced trait-profiles of the genotype).
Agronomy 13 02813 g006
Table 1. Geographic and meteorological specifications of experimental sites during the crop season.
LocationLatitudeLongitudeElevationAverage Temperature (°C)Average Relative Humidity (%)Rainfall (mm)
MaximumMinimum
SKRAU, Bikaner, Rajasthan28°09′ N73°35′ E23037.3527.0649.74142.67
Hytech Seeds Pvt. Ltd.,
Malakhera-Alwar, Rajasthan
27°38′ N76°62′ E25335.0523.879.98399
JK Seeds Pvt. Ltd.,
Chirkhna-Alwar, Rajasthan
27°67′ N76°69′ E25332.1624.7681.84519.66
Table 2. Estimates of variance components and heritability for grain yield and component traits.
SourceDBGYDFYPHPLPDPYPNHIHI
(Days)(kg/ha)(kg/ha)(cm)(cm)(mm)(kg/ha)(%)(%)
Location (σ2ε)8.96 **224,934.9 *4,151,695.74 *196.29 *3.14 **12.5 ***1,361,283.2 *17.670.50
Genotype (σ2G)1.57 **22,862.1 **365,319.84 *15.830.480.6023,238.445.120.00
Genotype × Location (σ2G × E)1.9 ***8198.6188,211.4617.970.641.15 *104,670.19 *29.810.68
Residual1.9264,296.881,207,954.43110.813.153.52103,208.9158.878.63
Heritability (h2)0.620.630.610.390.390.380.230.140.00
Grand mean49.521513.176082.94180.3521.8125.212532.153.9613.81
Coefficient of variation (CV) %2.8016.7618.075.848.147.4412.6914.2221.28
LSD2.27287.471211.2914.501.552.26397.606.122.17
* p < 0.05, ** p < 0.01, *** p < 0.001. LSD: least significant difference, DB: days to 50% flowering, GY: grain yield, DFY: dry fodder yield, PH: plant height, PL: panicle length, PD: panicle diameter, PY: panicle yield, PNHI: panicle harvest index, HI: grain harvest index.
Table 3. Standard heterosis over hybrid check HHB-67-Improved for grain yield and component traits across environments.
GenotypeGYDFYPHPLPDPYPNHIHI
TH-122.90 *8.170.763.717.203.3418.93 *15.02
TH-232.93 *9.522.726.067.553.3726.86 *21.60 *
TH-727.57 *2.83−1.393.0912.112.1624.87 *24.28 *
TH-1120.180.50−0.842.384.65−0.6720.99 *19.96 *
TH-1215.34−4.30−0.802.5713.171.5113.63 *18.56 *
TH-1314.68−1.440.274.319.660.3114.33 *15.79
TH-2518.825.220.600.316.630.8117.86 *14.23
TH-2821.677.14−1.724.963.413.6517.39 *14.58
TH-3722.88 *−1.351.821.6811.451.0721.58 *23.74 *
TH-4321.3014.20−0.372.033.160.8420.29 *9.71
TH-4817.104.74−0.265.234.395.4011.1011.61
TH-4933.77 *7.321.655.868.604.5930.77 *28.33 *
TH-6734.69 *12.563.096.269.484.9728.31 *21.90 *
TH-7432.84 *20.64 *1.035.296.326.1325.16 *13.84
TH-7930.74 *5.750.602.379.833.5326.28 *24.35 *
TH-9128.81 *7.82−0.256.5510.266.0919.54 *18.13 *
TH-9610.07−1.54−1.995.813.991.848.0810.76
TH-10814.65−9.15−0.375.759.741.1813.31 *22.40 *
TH-12426.17 *0.060.642.565.441.1924.69 *25.71 *
TH-12912.789.883.063.997.202.1610.404.64
TH-13831.36 *8.152.640.3310.012.5826.11 *21.32 *
TH-13624.91 *−3.771.065.145.622.6021.74 *27.50 *
TH-13912.61−5.85−1.322.884.040.5611.9917.43 *
TH-1479.1322.13 *1.691.760.002.286.69-6.51
TH-14916.808.890.832.604.48−0.2417.08 *9.77
TH-428.99−4.350.054.2311.591.767.1012.00
TH-11432.71 *2.730.914.695.7910.0120.63 *26.73 *
TH-10313.707.700.847.3910.884.029.306.56
TH-777.91−4.52−1.814.404.92−4.0012.41 *12.86
TH-1379.094.961.173.158.78−2.2311.585.91
HHB-67-Imp
MPMH 1717.52−3.441.047.588.606.1712.91 *20.87 *
RHB 17712.67−13.640.564.3710.710.7011.8924.81 *
Dhanashakti12.66−7.15−1.640.246.671.5510.9418.31 *
GHB-53815.99−13.750.373.451.053.1912.40 *27.65 *
Raj 17111.18−7.651.082.551.763.137.8116.69 *
* p < 0.05, GY: grain yield (kg/ha), DFY: dry fodder yield (kg/ha), PH: plant height (cm), PL: panicle length (cm), PD: panicle diameter (mm), PY: panicle yield (kg/ha), PNHI: panicle harvest index (%), HI: harvest index (%).
Table 4. Eigenvalues with percent variations accounting for the first seven principal components and eigenvector loadings of traits on the first three principal components.
ComponentsPC-IPC-IIPC-IIIPC-IVPC-VPC-VIPC-VII
Eigenvalue3.801.721.150.890.650.470.32
Variance (%) explained by each axis42.2319.0712.809.837.265.223.55
Cumulative % of variance42.2361.3074.1083.9391.1996.4199.96
Parameters (Trait)Dim.1Dim.2Dim.3
Days to 50% flowering (DB)0.7590.2030.149
Plant height (PH)0.5180.437−0.126
Panicle length (PL)0.453−0.0780.811
Panicle diameter (PD)0.456−0.4090.066
Panicle yield (PY)0.6480.1240.424
Grain yield (GY)0.94−0.047−0.228
Dry fodder yield (DFY)0.4040.84−0.132
Panicle harvest index (PNHI)0.862−0.113−0.423
Grain harvest index (HI)0.577−0.758−0.151
Table 5. Cluster means values for nine agro-morphological traits in 36 genotypes.
Number of GenotypesDBGYDFYPHPLPDPYPNHIHIMember Genotypes
Cluster-I (C-I)1749.581491.456801.21180.0821.8827.202537.3058.7515.99TH-1, TH-2, TH-43, TH-48, TH-25, TH-79, TH-96, TH-108, TH-129, TH-74, TH-136, TH-139, TH-42, TH-103, TH-77, HHB-67-Imp and RHB 177
Cluster-II (C-II)449.191504.796642.45180.5821.6926.842550.8658.9516.36TH-11, TH-114, TH-137 and Raj 171
Cluster-III (C-III)1549.531550.316834.48180.5221.7827.442555.3160.716.57TH-7, TH-12, TH-13, TH-49, TH-28, TH-37, TH-67, TH-138, TH-91, TH-124, TH-147, TH-149, MPMH 17, Dhanashakti and GHB-538
Overall Mean49.511517.466797.43180.3221.8227.262546.3159.6016.28
DB: days to 50% flowering (days), GY: grain yield (kg/ha), DFY: dry fodder yield (kg/ha), PH: plant height (cm), PL: panicle length (cm), PD: panicle diameter (mm), PY: panicle yield (kg/ha), PNHI: panicle harvest index (%), HI: harvest index (%).
Table 6. Standardized genotype by yield by trait (GYT) data and superiority index for the 36 genotypes.
GENY*DFYY*PNHIY/DBY*PHY*PLY*PDY*HIY*PYSI
TH-491.502.071.791.972.061.821.991.8415.02
TH-671.791.751.701.951.891.721.361.6913.85
TH-742.331.411.371.471.571.180.641.6511.62
TH-1140.851.081.791.441.481.111.582.1011.42
TH-21.301.410.991.521.501.161.091.1710.14
TH-790.971.351.311.200.981.391.271.159.60
TH-1381.071.241.541.330.581.270.950.928.90
TH-70.531.040.730.610.751.331.040.716.74
TH-910.870.630.560.681.111.060.561.086.55
TH-1240.230.931.180.730.540.461.050.475.60
TH-136−0.150.660.360.650.730.371.080.524.22
TH-37−0.080.520.070.540.100.810.680.172.80
TH-10.640.340.020.400.350.350.090.412.61
TH-280.480.170.66−0.040.37−0.17−0.020.341.80
TH-430.990.330.060.10−0.01−0.22−0.370.000.87
MPMH 17−0.42−0.23−0.130.120.500.220.290.440.78
TH-11−0.110.300.43−0.08−0.08−0.170.25−0.260.28
TH-250.150.02−0.17−0.04−0.46−0.09−0.22−0.23−1.04
TH-480.00−0.51−0.07−0.32−0.07−0.48−0.500.10−1.84
TH-1490.28−0.16−0.50−0.22−0.40−0.50−0.64−0.51−2.64
TH-12−0.76−0.46−0.17−0.57−0.550.25−0.17−0.46−2.88
GHB-538−1.40−0.49−0.01−0.36−0.38−0.910.46−0.23−3.32
TH-108−1.14−0.52−0.51−0.59−0.26−0.170.03−0.56−3.70
TH-13−0.59−0.45−0.57−0.51−0.42−0.17−0.39−0.65−3.75
TH-103−0.01−0.82−0.90−0.54−0.18−0.14−1.03−0.36−3.98
TH-1290.08−0.80−0.72−0.38−0.65−0.59−1.20−0.63−4.90
RHB 177−1.56−0.72−0.79−0.68−0.62−0.260.05−0.79−5.37
TH-139−1.02−0.72−0.40−0.91−0.79−0.92−0.42−0.80−5.98
Dhanashakti−1.11−0.78−0.47−0.94−1.08−0.66−0.36−0.70−6.09
Raj 171−1.23−1.05−1.24−0.78−0.97−1.27−0.55−0.68−7.77
TH-42−1.13−1.21−1.09−1.12−1.01−0.53−0.98−1.01−8.10
TH-137−0.50−0.95−1.08−0.98−1.12−0.79−1.34−1.39−8.16
TH-96−0.88−1.10−1.28−1.24−0.73−1.16−0.99−0.91−8.27
TH-1470.66−1.23−1.24−0.92−1.26−1.62−2.09−0.95−8.66
TH-77−1.21−0.97−1.22−1.44−1.11−1.26−1.00−1.66−9.86
HHB-67-Imp−1.40−2.10−2.00−2.05−2.35−2.42−2.20−1.98−16.50
Mean00000000
St Dev11111111
GEN: genotype, Y: grain yield, DFY: dry fodder yield, PNHI: panicle harvest index, DB: days to 50% flowering, PH: plant height, PL: panicle length, PD: panicle diameter, PY: panicle yield, HI: harvest index, and SI: superiority index.
Table 7. Top 20% promising hybrids for different selection methods for grain yield across environments.
HybridStandard HeterosisStability ParameterCluster AnalysisGYT BiplotPromising for Number of Methods
TH-1 1
TH-2 3 *
TH-49 3
TH-67 3
TH-7 2
TH-74 1
TH-79 3
TH-91 1
TH-114 3
TH-124 1
TH-1384
GY: grain yield, DFY: dry fodder yield, SI: superiority index; indicates the hybrid were found promising using mentioned method. * Not considered, as DB was significantly higher than HHB-67-Imp.
Disclaimer/Publisher’s Note: The statements, opinions and data contained in all publications are solely those of the individual author(s) and contributor(s) and not of MDPI and/or the editor(s). MDPI and/or the editor(s) disclaim responsibility for any injury to people or property resulting from any ideas, methods, instructions or products referred to in the content.

