Article

Exploring the Root Morphological Traits of Diverse-Origin Cultivated Soybean

1
Laboratory of Crop Production, Department of Applied Biosciences, Kyungpook National University, Daegu 41566, Republic of Korea
2
Department of Integrative Biology, Kyungpook National University, Daegu 41566, Republic of Korea
3
Department of Food Security and Agricultural Development, Kyungpook National University, Daegu 41566, Republic of Korea
*
Author to whom correspondence should be addressed.
These authors contributed equally to this work.
Agronomy 2023, 13(10), 2666; https://doi.org/10.3390/agronomy13102666
Submission received: 27 September 2023 / Revised: 16 October 2023 / Accepted: 20 October 2023 / Published: 23 October 2023
(This article belongs to the Section Crop Breeding and Genetics)

Abstract

:
Root morphological traits (RMTs) profoundly influence plant growth, resilience to abiotic stresses, and yield in soybean (Glycine max). In a comprehensive study spanning two consecutive years (2021–2022), the RMTs were assessed in 216 soybean accessions from 34 diverse origins. The investigation involved randomized batches with plants cultivated in PVC pipes filled with horticultural soil and harvested at the V2 growth stage. All the germplasms exhibited significant differences (p < 0.001) in all measured traits, i.e., total root length (TRL), root volume (RV), average diameter (AD), number of tips (NT), number of forks (NF), and tertiary total length (TTL). Among the top 5% performers in TRL, which, interestingly, were exclusively of Korean origin, germplasm IT115491 displayed an impressive average TRL value of 1426.24 cm. Notably, germplasms from Serbia and Korea predominantly occupied the upper AD quantile, with IT156262 exhibiting the highest AD value of 0.57 mm. A correlation analysis showed strong positive associations of TRL with RV (r = 0.85), NT (r = 0.84), NF (r = 0.96), and TTL (r = 0.88), whereas it had a negative association with AD (r = −0.25). A principal component analysis (PCA) showed a cumulative 95% of the total variance in the data in the first three principal components (PCs). PC1 (eigenvalue = 4.64) accounted for a 77.00% variance, with TRL, RV, NF, NT, and TTL exhibiting the highest associated eigenvectors. K-means clustering was performed with three clusters. Cluster 2 contained accessions with higher AD values, whereas Cluster 3 comprised accessions with increased TRL, NT, NF, and TTL, which mostly originated from Korea. Our findings offer targeted insights for plant breeders to optimize specific root traits and enhance crop performance across diverse environmental conditions by strategically targeting these clusters. Additionally, the influence of cultivar origin on root traits warrants further investigation, with implications for future breeding programs.

1. Introduction

Soybean (Glycine max) is significantly important today due to its various usages, consumption as a vital nutritious food and feed, and its use in different industries [1,2]. Soybean seed is considered to be a vital source of protein [2], with levels ranging from 33% to 45% with favorable amino acids; additionally, it also contains 18–24% fat and a mere 5–8% crude fiber [3]. Adding to that, the presence of other essential nutrients for human and animal well-being, such as vitamins, mineral salts, and antioxidants are also reported [4,5]. However, even with a multitude of valuable nutrients, some studies have also reported the presence of anti-nutrients (ANFs), including phytates, tannins, trypsin inhibitors, and oligosaccharides [6]. Owing to its innumerable benefits and wide usage, soybean is cultivated as a commercial crop worldwide in over 35 countries, with Brazil, the United States, China, India, and Argentina being the highest producers [7]. While historically closely associated with Asia in terms of its cultivation and production, the present scenario of soybean output demonstrates a shift in major production hubs to the western regions, where the United States, Brazil, and Argentina have emerged as the primary soybean producers, collectively accounting for a substantial 82% share of its global production [7].
Soybean productivity is severely affected by abiotic stresses, which disturb crop physiology and overall growth, leading to significantly decreased crop yield outputs [2,3,8,9,10]. Moreover, in natural circumstances, the combined effects of multiple stressors, referred to as “multistress”, are frequently witnessed; for instance, cases of water scarcity typically coincide with elevated temperatures, intensifying the effects of drought stress [11,12,13]. Additionally, the moisture conditions in different soybean regions are gradually becoming less favorable for normal crop development and optimal pod filling [14]. Soybeans are commonly cultivated on soil with hardpans worldwide [15]. In the southeastern coastal plains of the United States, sandy soils typically have an inherent hardpan that obstructs the penetration of roots and exploration; consequently, their access to water and nutrients is restricted, negatively impacting crop yield [15,16,17]. Soil hardpans limit plant access to stored water, increasing drought vulnerability [18]. Farmers often resort to deep tillage to address soil compaction issues, which is time-consuming, energy-intensive, and environmentally unsustainable [15]. Furthermore, deep tillage has temporary benefits as the compacted layer reforms, which leave the option of having an optimum root system that would help plants in adverse growth conditions, i.e., limited water and nutrient availability in the rhizosphere [19]. Roots, a pivotal part of plants, serve the crucial functions of providing structural support and facilitating water and nutrient uptake [20]. Establishing robust root systems is crucial for soybean growth and yield output, enabling plants to effectively withstand abiotic stresses and adverse environmental conditions [21,22]. It is generally believed that root systems play a pivotal role in augmenting the efficiency of water and nutrient utilization, particularly in legume crops, including soybeans [23,24,25]. The root morphological traits (RMTs) and root system architecture (RSA) of a plant critically influence its productivity under optimal and suboptimal conditions [26,27]. Additionally, they help in comprehending plant responses to environmental cues and facilitate disease management strategies [28].
Given its utmost importance, studying a plant’s root system, referred to as the “hidden half” [29], is difficult because of its complex structure and the dynamic environment it grows in [21]. The phenotypic plasticity of roots, which allows them to adapt their morphology and physiology to environmental conditions, presents challenges for standardizing root research. This difficulty arises from the absence of cost-effective and efficient screening techniques and the challenges associated with harvesting roots without causing damage [30,31,32]. RMTs and RSA function as valuable indicators that offer insights into a plant’s nutrient status and its reactions to external stimuli [33]. Therefore, conducting a comprehensive study on RMTs and RSA is vital.
Moreover, several studies have documented the genetic variability of root traits and their correlation with water and nutrient acquisition, including in chickpea (Cicer arietinum L.) [23] and lentil (Lens culinaris L.) [34]. Despite the considerable efforts made by soybean breeders, a comprehensive research is still required to study and explore RMTs and their underlying genetics to optimize root systems and develop soybean varieties with a high tolerance to abiotic stresses and a better yield output. In this experiment, a diverse set of 216 soybean germplasms from 34 different origins were characterized for two consecutive years, 2021 and 2022. The insights obtained from this study will help plant breeders to put targeted efforts into furthering research toward developing a variety with an optimal root system and better RMTs, environmentally resilient capabilities, and ultimately a higher yield output.

2. Materials and Methods

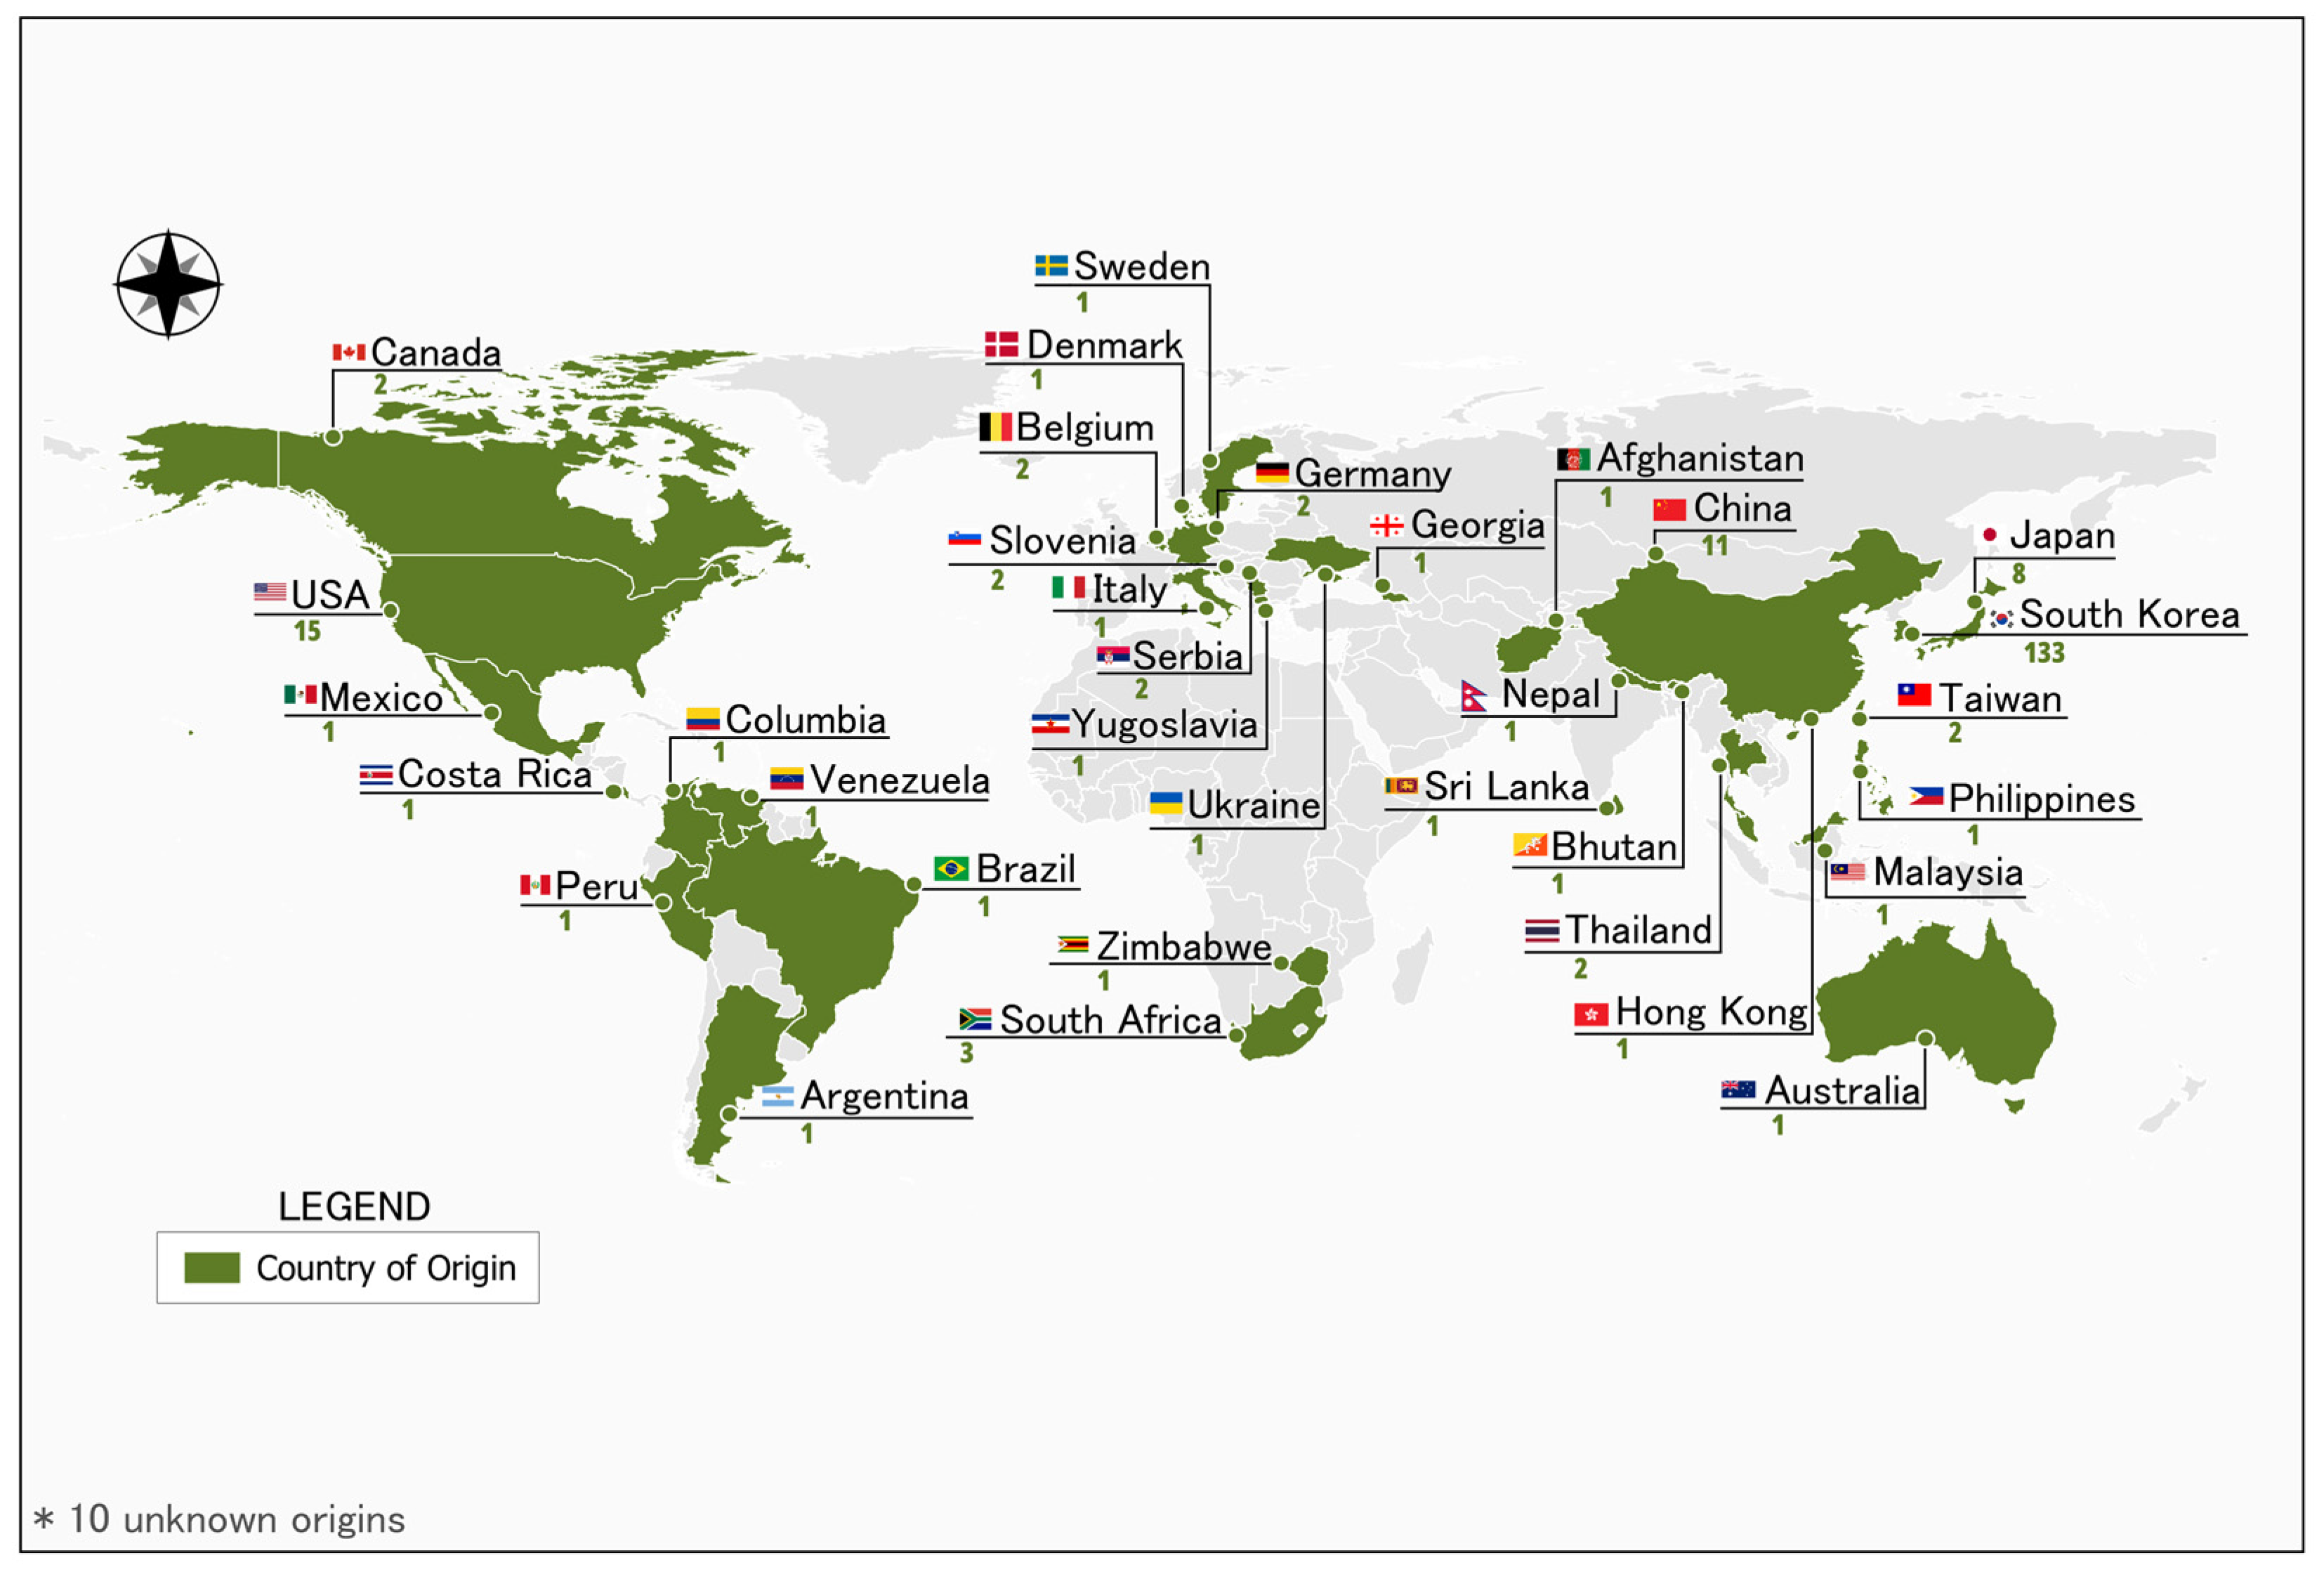
2.1. Plant Materials

In this research experiment, 216 cultivated soybean varieties were subjected to a rigorous evaluation for their RMTs in a controlled environment in a greenhouse at Kyungpook National University in Daegu, South Korea. The experiment spanned two consecutive years, 2021–2022. The accessions used in this study were sourced from the Rural Development Administration in South Korea, and had 34 diverse origins (Figure 1, Table S1).

2.2. Experimental Details

Our investigation consisted of two separate batches conducted in 2021 and 2022. It involved a comprehensive evaluation of 216 germplasms, originating from 34 diverse origins, with three replications in each batch. The experiment employed a completely randomized design to assess the variability of the root traits. Seeds were sown in polyvinyl chloride (PVC) pipes, measuring 60 cm in height and 16.5 cm in diameter, filled with horticulture soil. The pipes were covered with a non-woven cloth at the bottom and placed inside trays. For each PVC pipe, two seeds of the same variety were sown at a shallow depth of less than 2 cm in the soil, followed by the direct application of water. No treatment was conducted for the seeds, also, no fertilizer was added later on. As the plants germinated, the healthiest plants were retained, while the rest were thinned out. The plants were regularly watered using a sprinkler and harvested at the V2 growth stage, i.e., when two sets of unfolded trifoliate leaves developed.

2.3. Data Collection

To identify the diversity in RMTs, we assessed the germplasms at the vegetative V2 growth stage, corresponding to the development of 2–3 trifoliate leaves. The soil was removed during harvest. Subsequently, the plants were meticulously cut at the base to separate the shoot part from the roots. Then, the roots were carefully rinsed with tap water and placed in plastic bags containing a small amount of water to prevent the desiccation of the root samples. For a comprehensive root analysis, the roots were scanned using an Expression 12000XL scanner manufactured by Epson, Japan. Before scanning, the root samples were carefully removed from the Ziploc bags and placed on a transparent tray (25 cm × 20 cm × 2 cm) filled with clean water. This submerged setup aimed to optimize separation and minimize overlapping of the roots during scanning. The scanned root images were analyzed for their RMTs using WinRHIZO (Pro Software Version 2021a, Regent Instruments Inc., Quebec, QC, Canada).

2.4. Statistical Analysis

The experimental design employed a randomized methodology comprising four replications. For both years, an analysis of variance (ANOVA) was conducted for all traits using SAS 9.4 (SAS, Gary, NC, USA). Descriptive statistics, a correlation analysis, and k-means clustering were performed using Python version 3.11.2 in the Visual Studio environment. PCA was performed using the Sklearn package in Python.
Parameters/Variables:
x1 = Total root length (TRL), x2 = Average diameter (AD), x3 = Root volume (RV), x4 = Number of tips (NT), x5 = Number of forks (NF), and x6 = Tertiary total length (TTL)

3. Results

3.1. Variation Assessment: Descriptive Statistics, ANOVA, and Varieties Ranking

Most traits showed a bell histogram revealing a normal distribution (Table 1, Figure 2). To establish significant differences, an ANOVA was conducted. All the germplasms exhibited significant differences in all measured traits with a p-value of <0.0001 (Table 2).
The varieties were then sorted and ranked based on each trait, with the top 5% in descending order and the lowest 5% in ascending order, along with their origin (Table 3). This selection included the top and bottom 11 cultivars, resulting in a distinct set of soybean accessions. The results indicated variations in performance regarding traits, with some genotypes showing a vigorous TRL and RV but an insignificant AD (Table 3). Conversely, other genotypes displayed thicker roots but smaller root lengths and fewer branches. The TRL ranged from 415.73 cm to 1426.24 cm. The top 5% had an average TRL of 1313.11 cm, whereas the lowest 5% had an average TRL of 495.00 cm. Accessions IT115491 and IT25668, both originating from Korea, displayed the highest and lowest TRL values, respectively (Table 3). The root AD ranged from 0.39 mm to 0.57 mm. Among the top 5%, the average AD value was 0.53 mm, while the lowest 5% averaged 0.41 mm. IT156262 and IT146110 from Korea and Taiwan had the highest and the lowest AD values, respectively (Table 3). The RV ranged from 2.22 cm3 to 0.69 cm3, with the top 5% accessions averaging 2.00 cm3. Conversely, the lowest 5% exhibited an average RV of 0.82 cm3. The observation showed the highest and the lowest RV in IT115491 and IT22891, originating from Korea and UNK, respectively (Table 3). The NT ranged from 554.67 to 1824.17, with the top 5% accessions averaging 1733.94; conversely, the lowest 5% exhibited an average NT value of 594.43. The observation showed the highest and lowest NT values in IT143347 and IT161474, originating from Korea and UNK, respectively (Table 3). The NF ranged from 678.10 to 4677.80, with the top 5% accessions averaging 4045.60; conversely, the lowest-ranked 5% showed an average NF value of 11519.40. The highest and lowest NF values were observed in IT154621 and Pungsan, both from Korea (Table 3). The TTL ranged from 227.56 cm to 1189.26 cm, with the top 5% accessions averaging 1085.01 cm; conversely, the lowest 5% exhibited an average TTL value of 333.44 cm. The highest and lowest TTL values were observed in IT154621 and IT103951, both from Korea (Table 3).

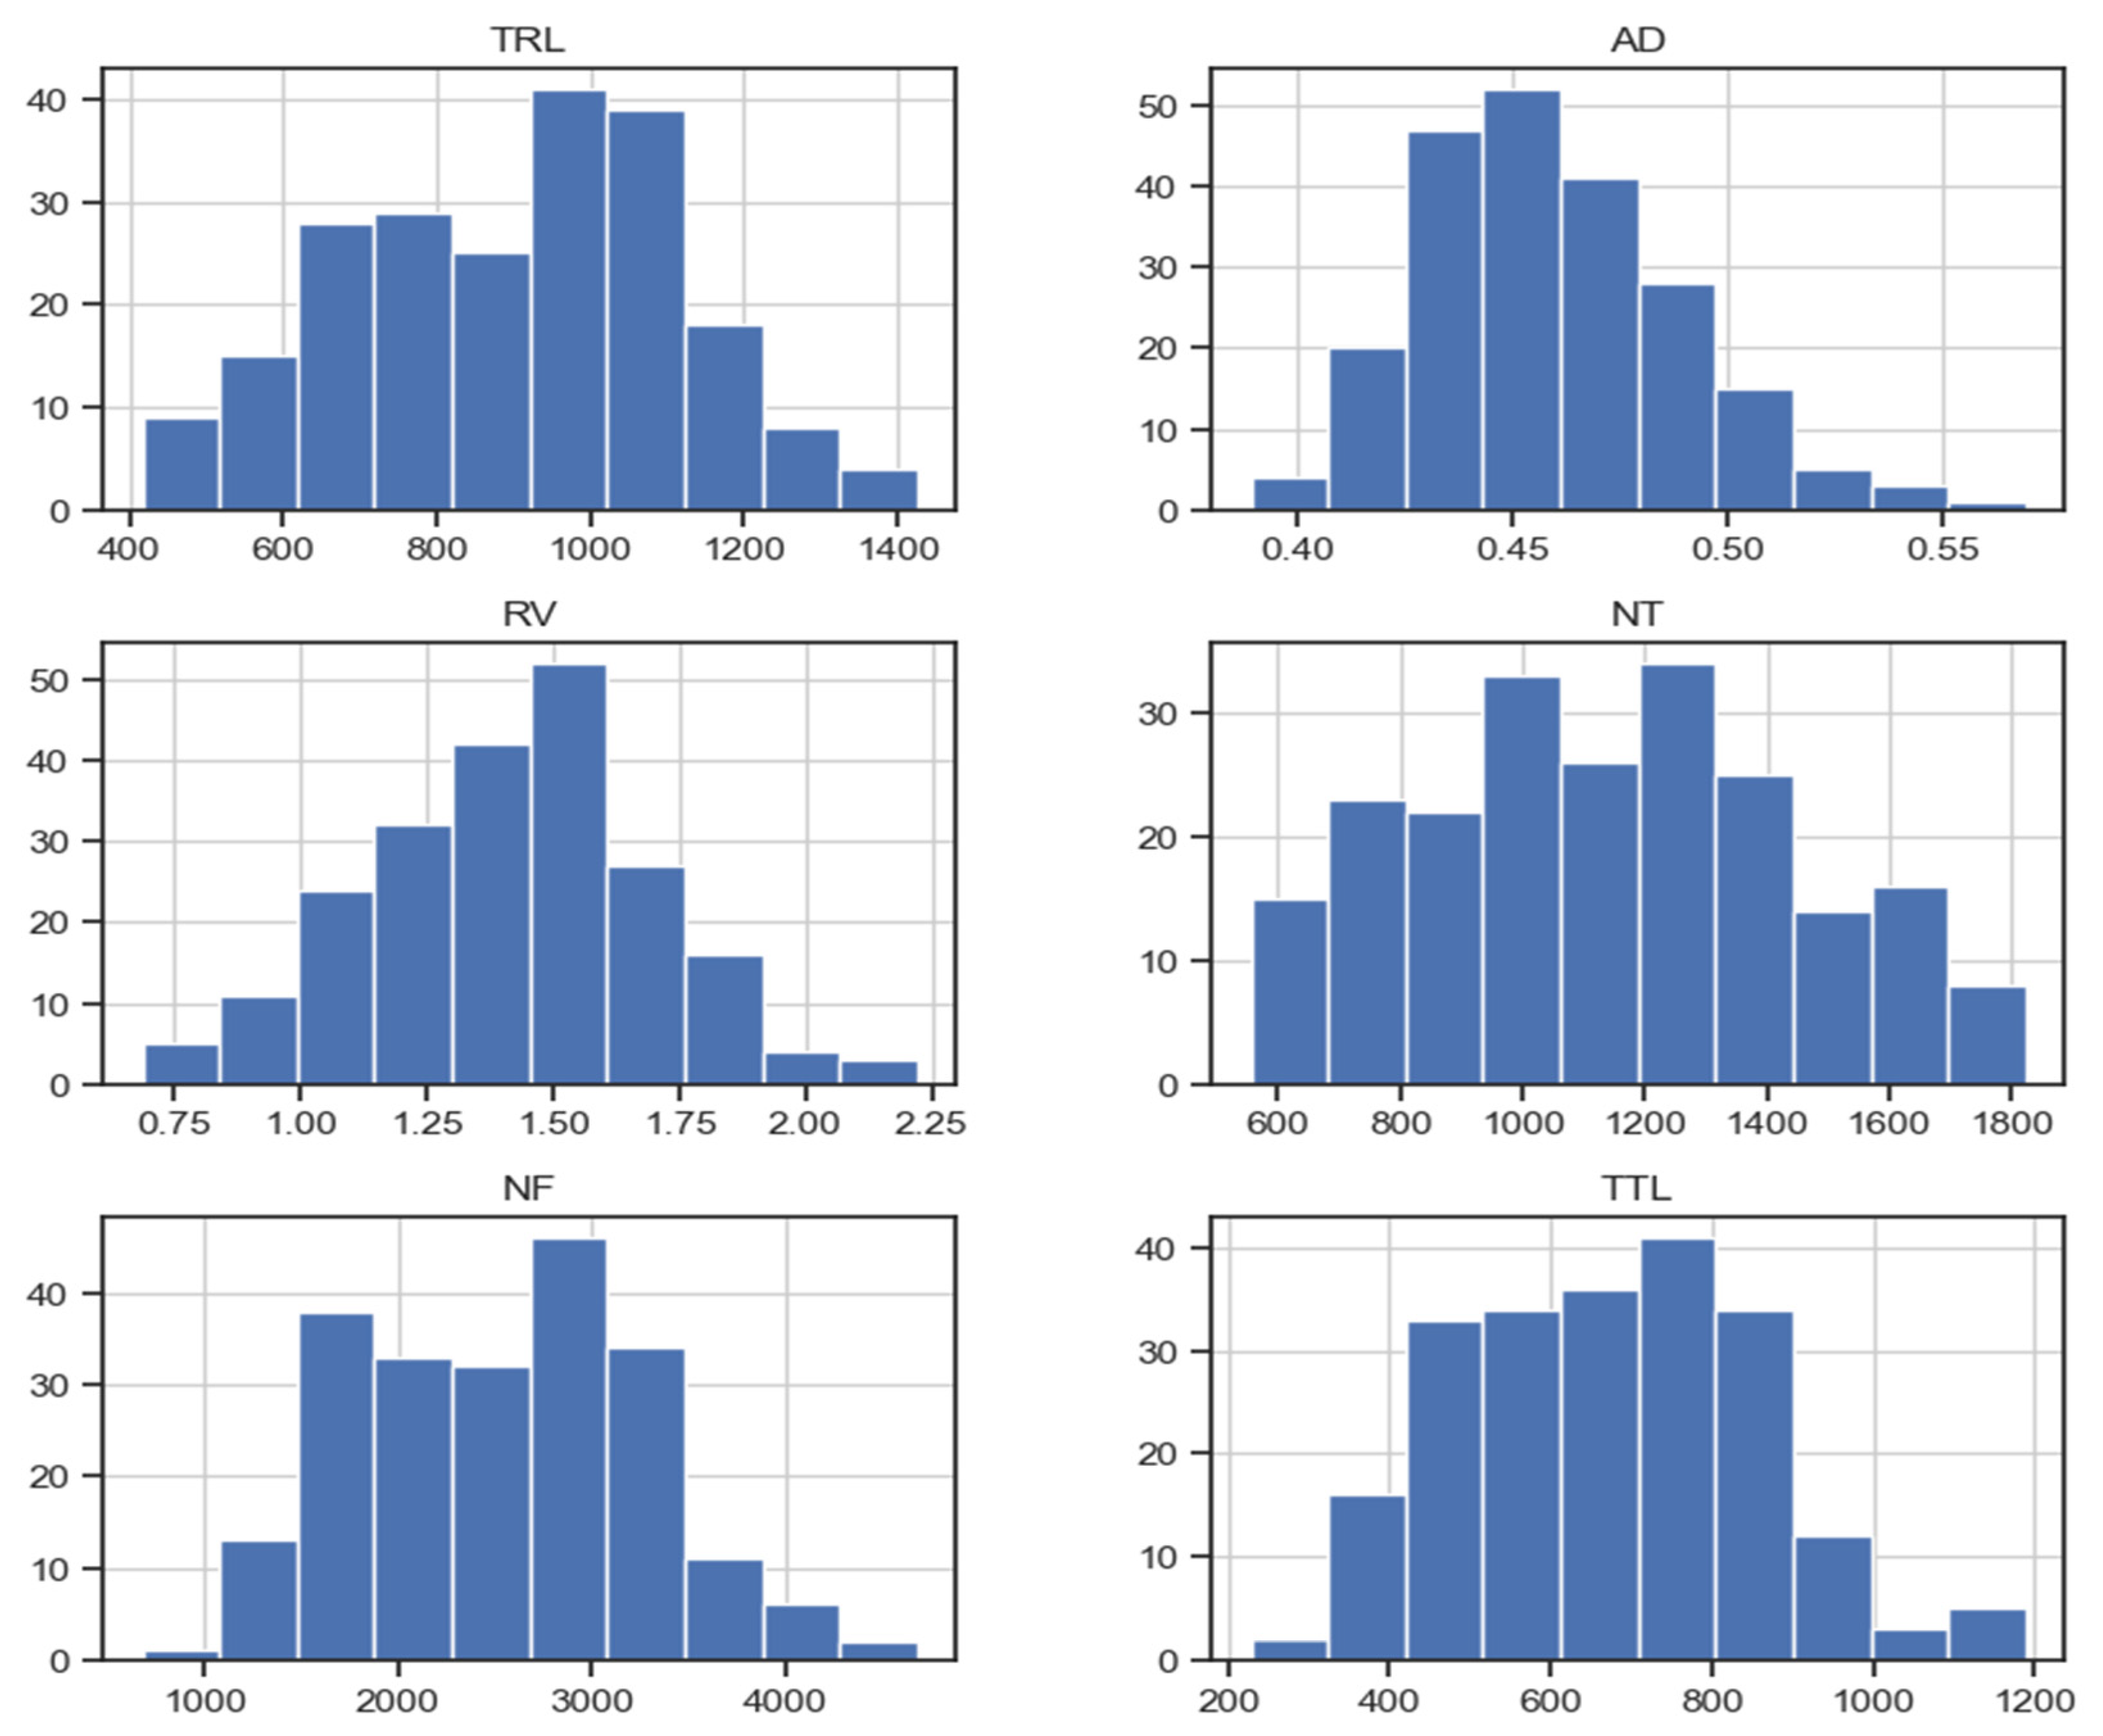
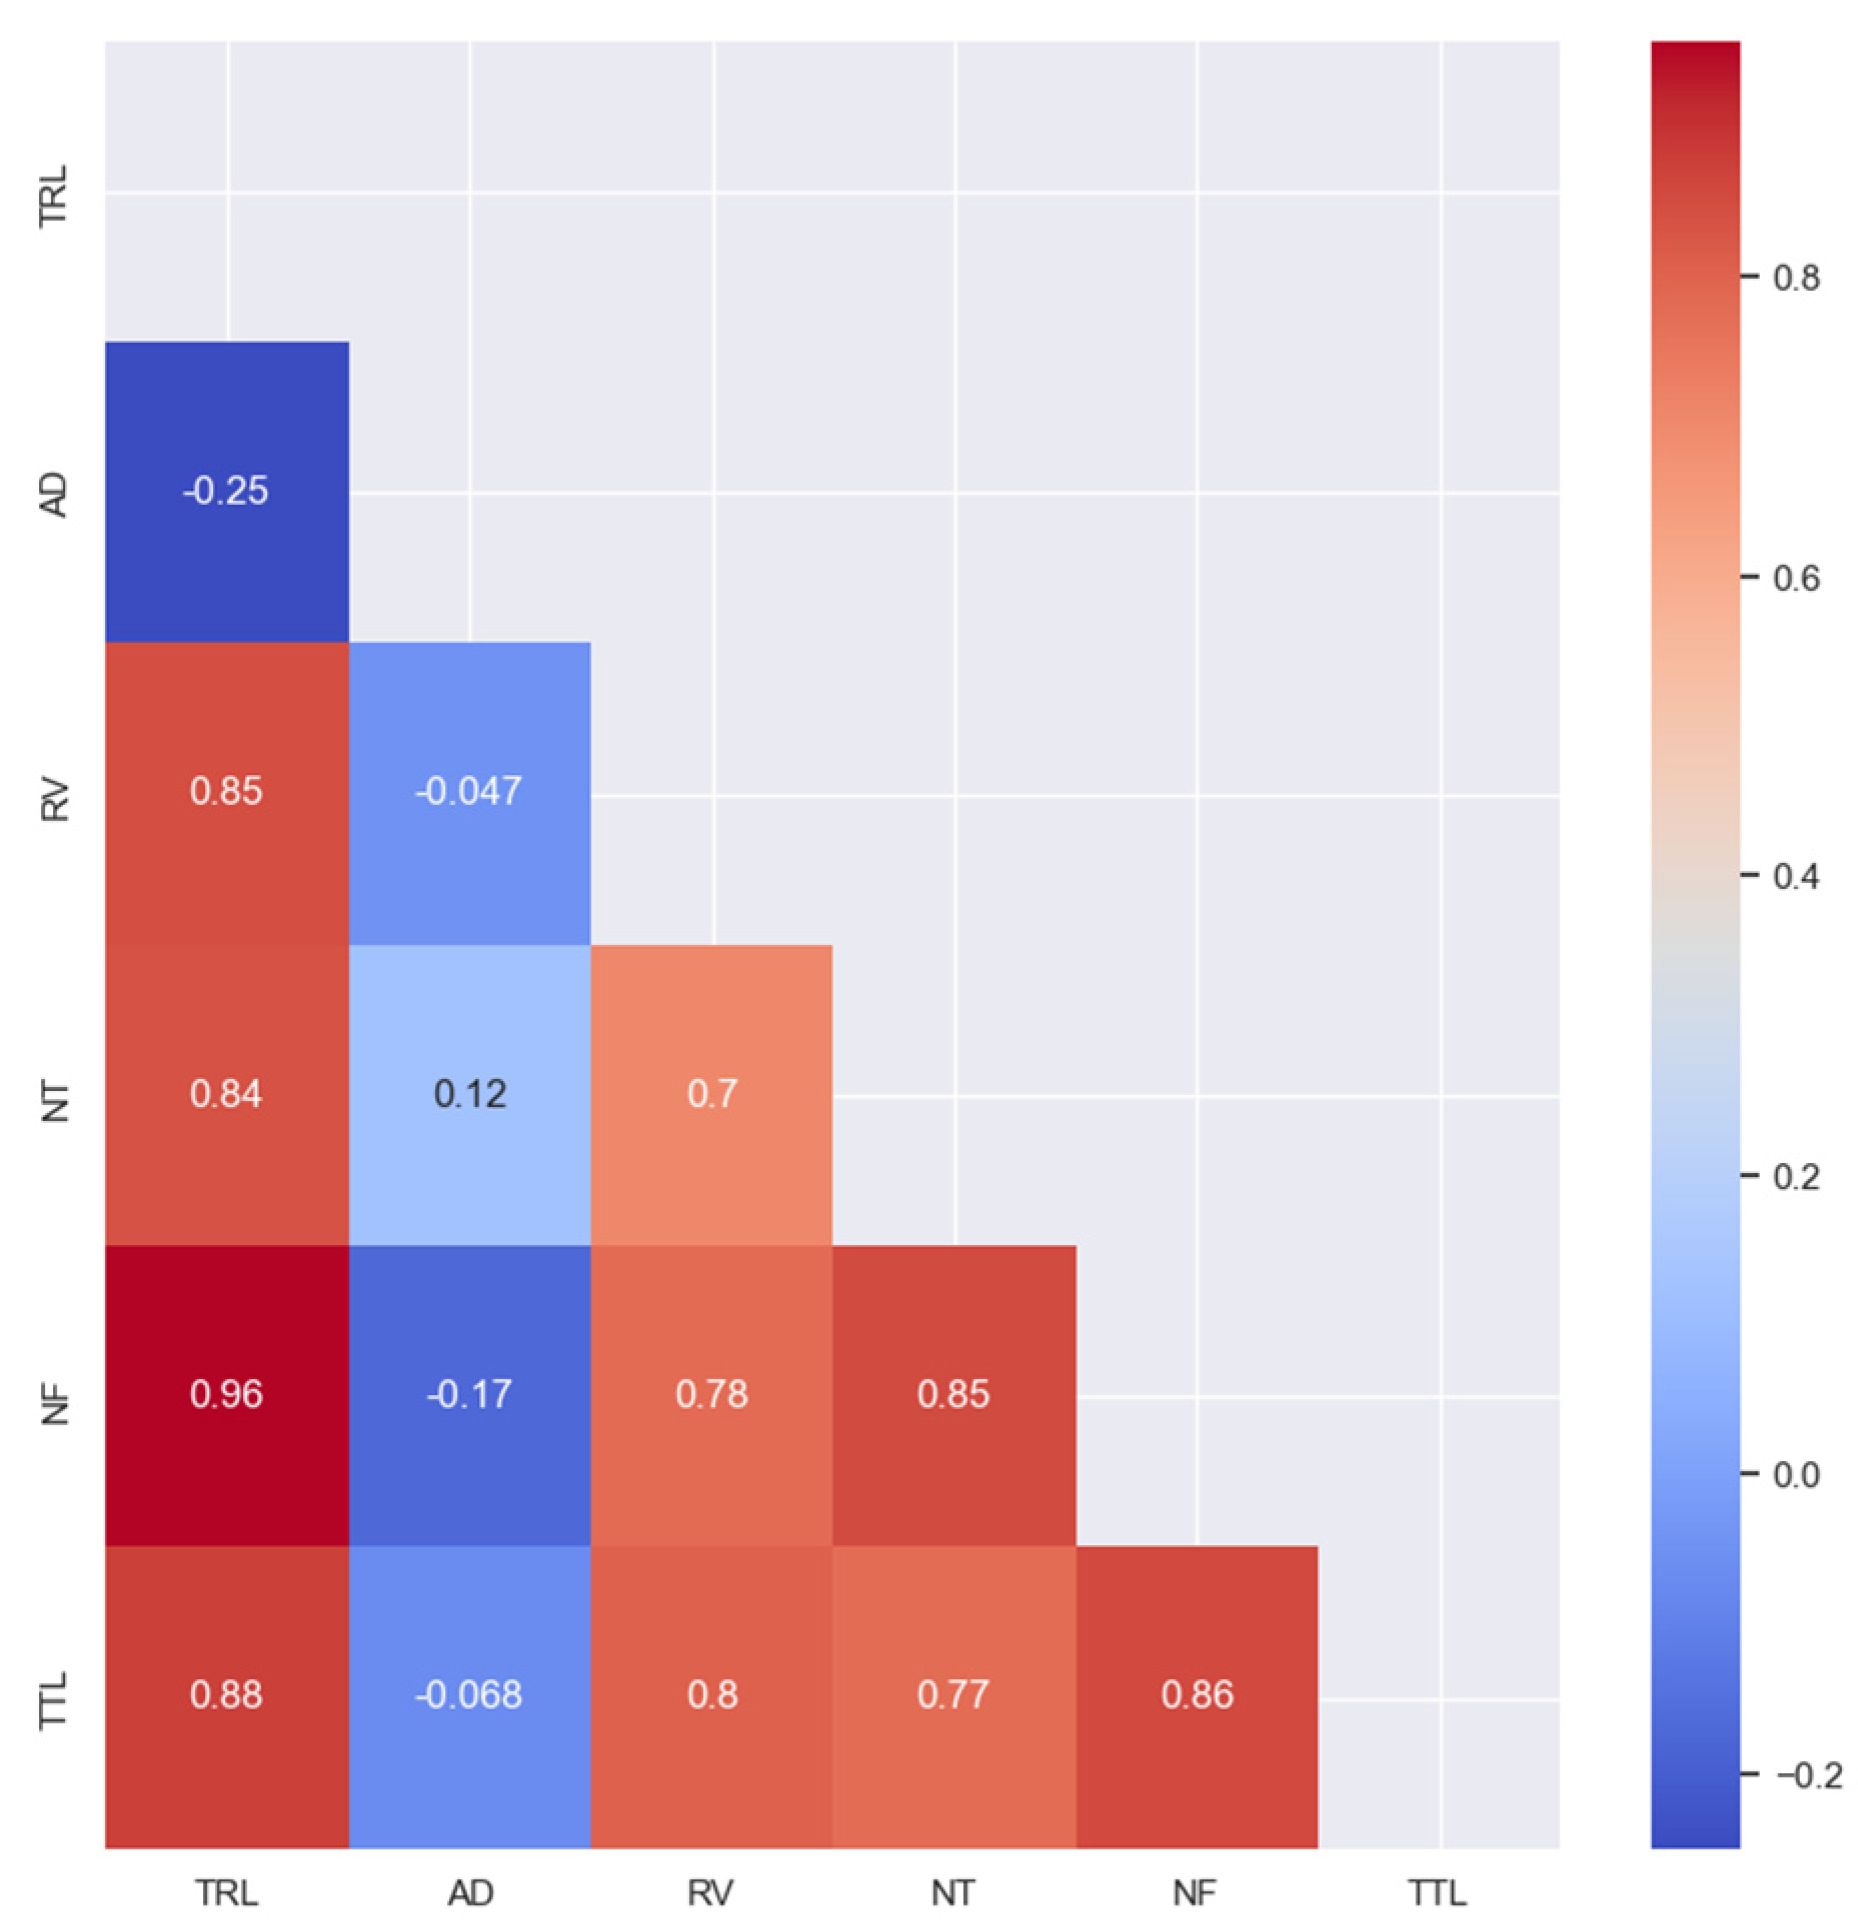
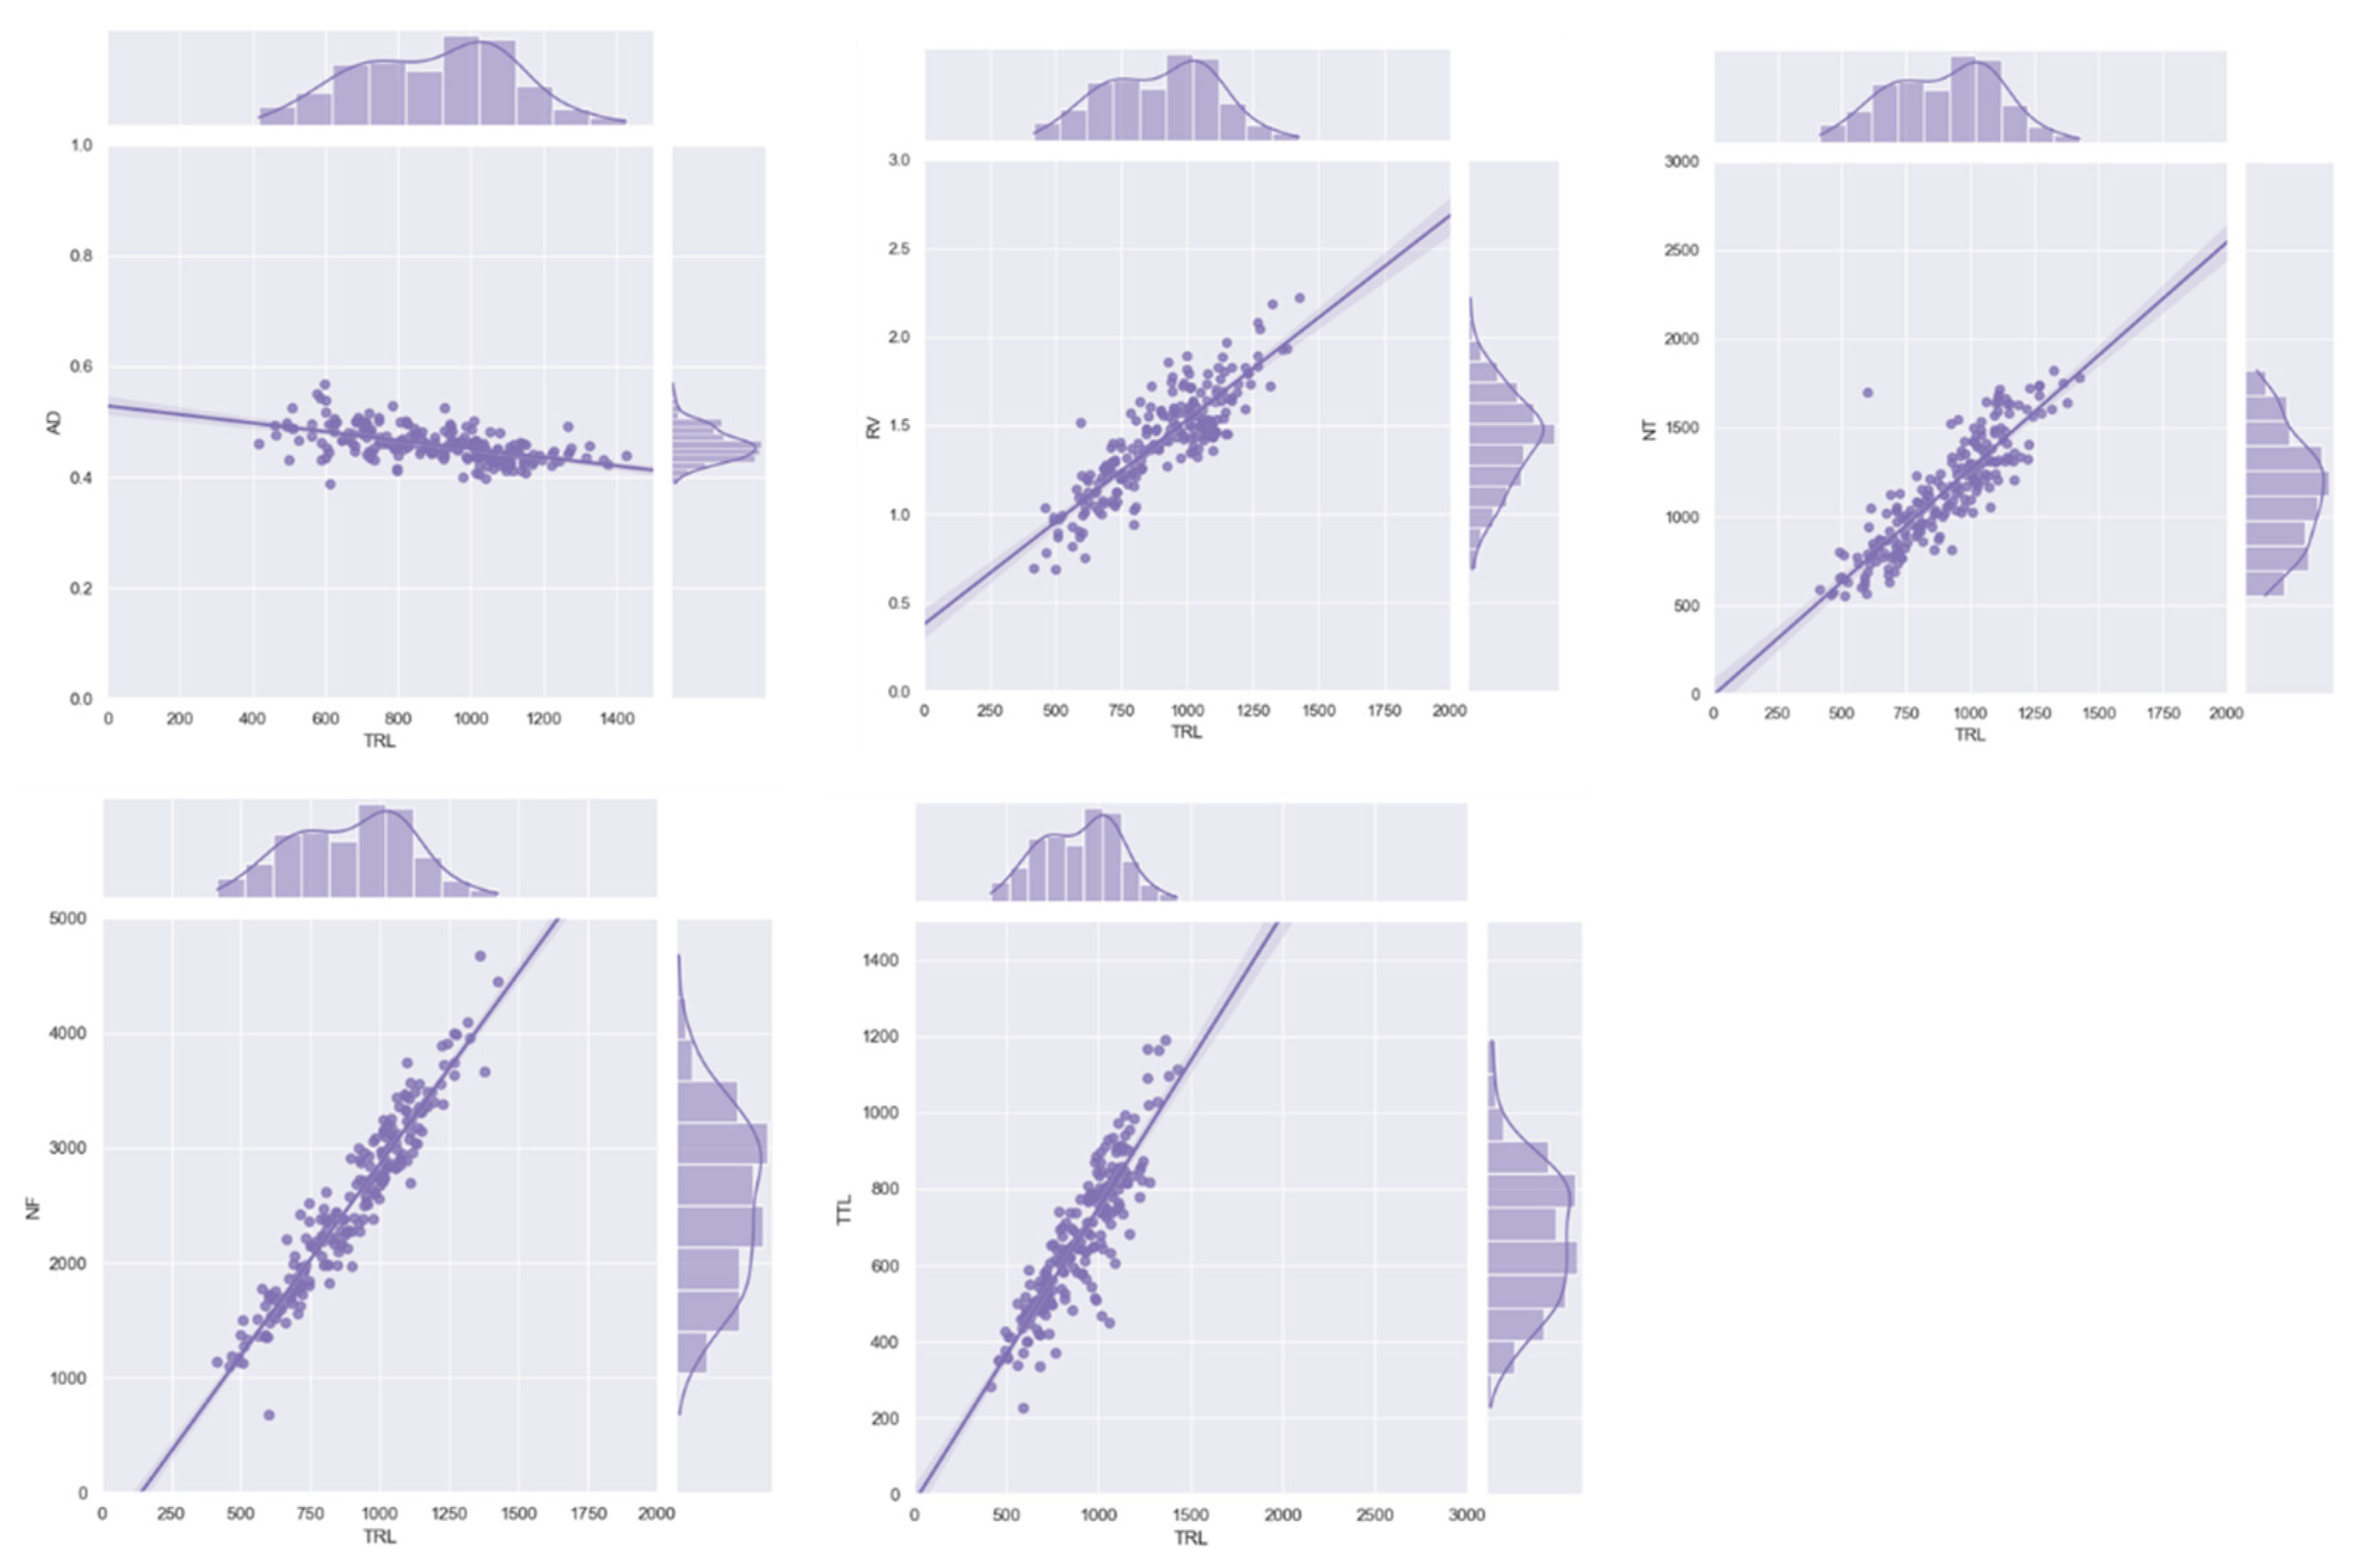
3.2. Correlation and Distribution Analysis

The results in a heatmap illustrate the outcomes of a correlation analysis conducted on the root traits: the TRL, AD, RV, NT, NF, and TTL of the 216 germplasms of 34 origins, for two consecutive years (2021–2022) (Figure 3). Different root traits showed distinctive outcomes in the correlation analysis. A noteworthy positive correlation was observed between TRL and RV (r = 0.85), NT (r = 0.84), NF (r = 0.96), and TTL (r = 0.88), whereas TRL exhibited a negative correlation with AD (r = −0.25) (Figure 3 and Figure 4). Conversely, as expected, AD exhibited an inversely proportional pattern with TRL, RV (r = −0.047), and architectural traits, i.e., NF (r = −0.17) and TTL (r = −0.068) (Figure 3 and Figure 4).
With an increase in TRL, traits NT, NF, and TTL, increased linearly. RV also formed a positively correlated linear regression with TRL, while AD exhibited a negative correlation with TRL (Figure 4).

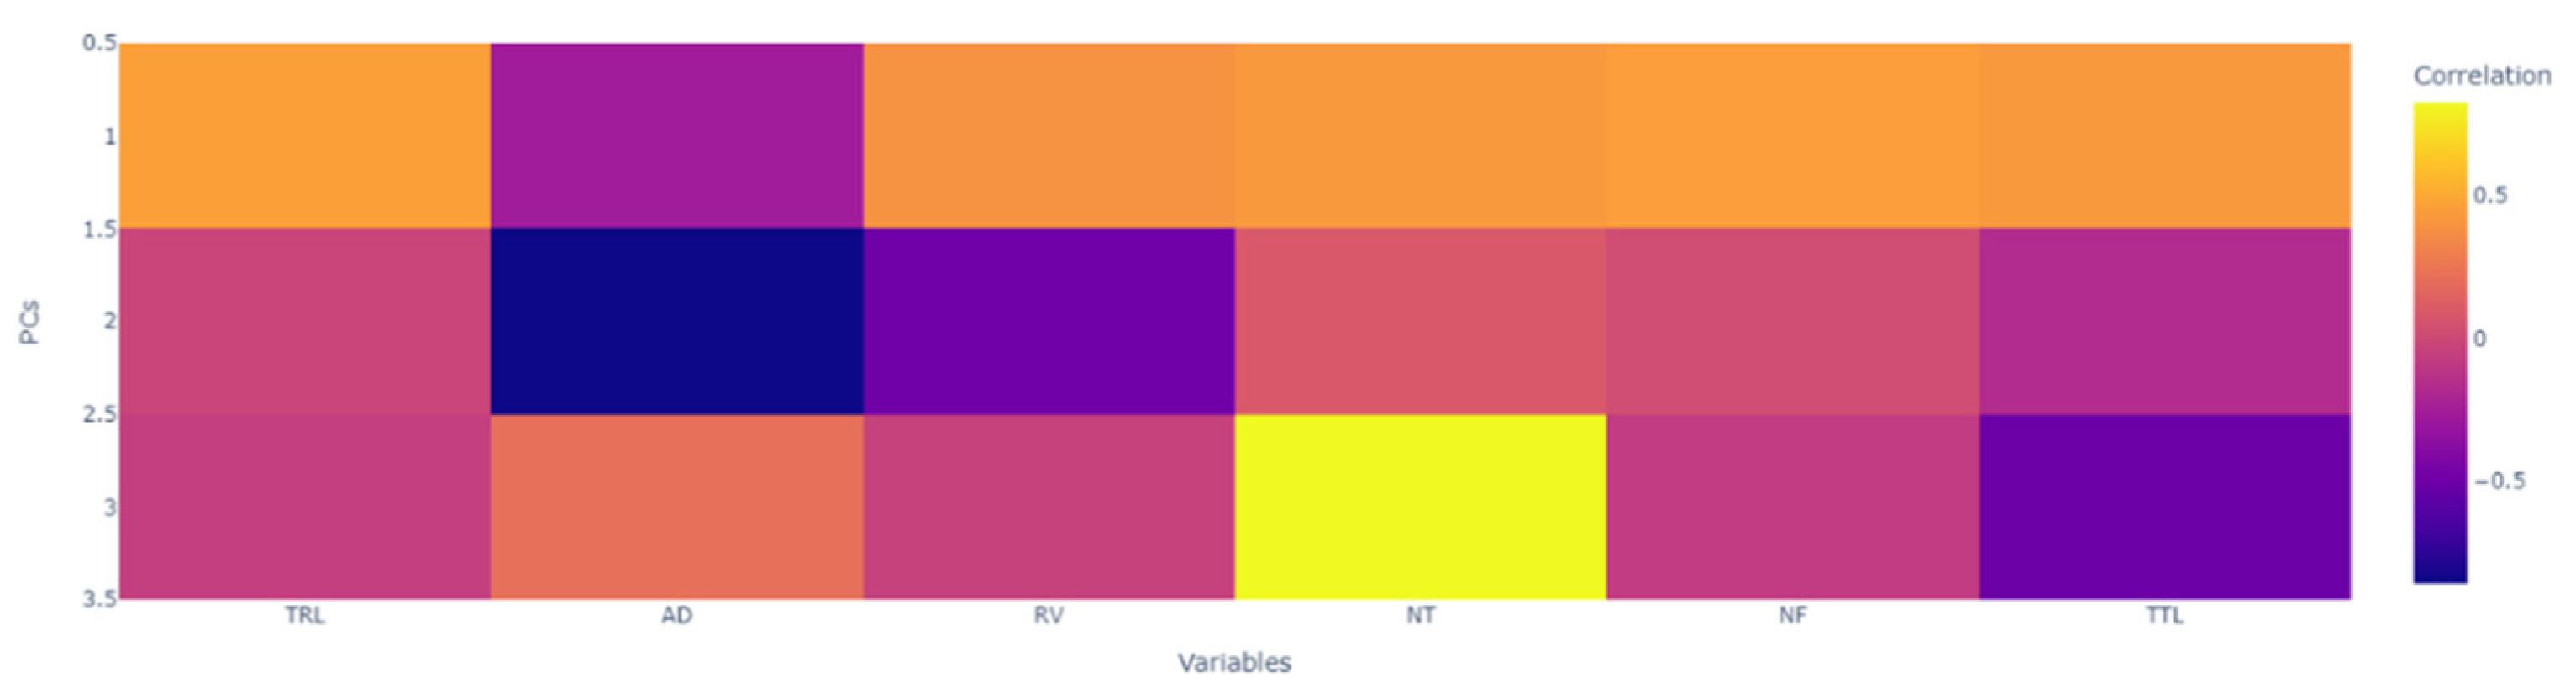
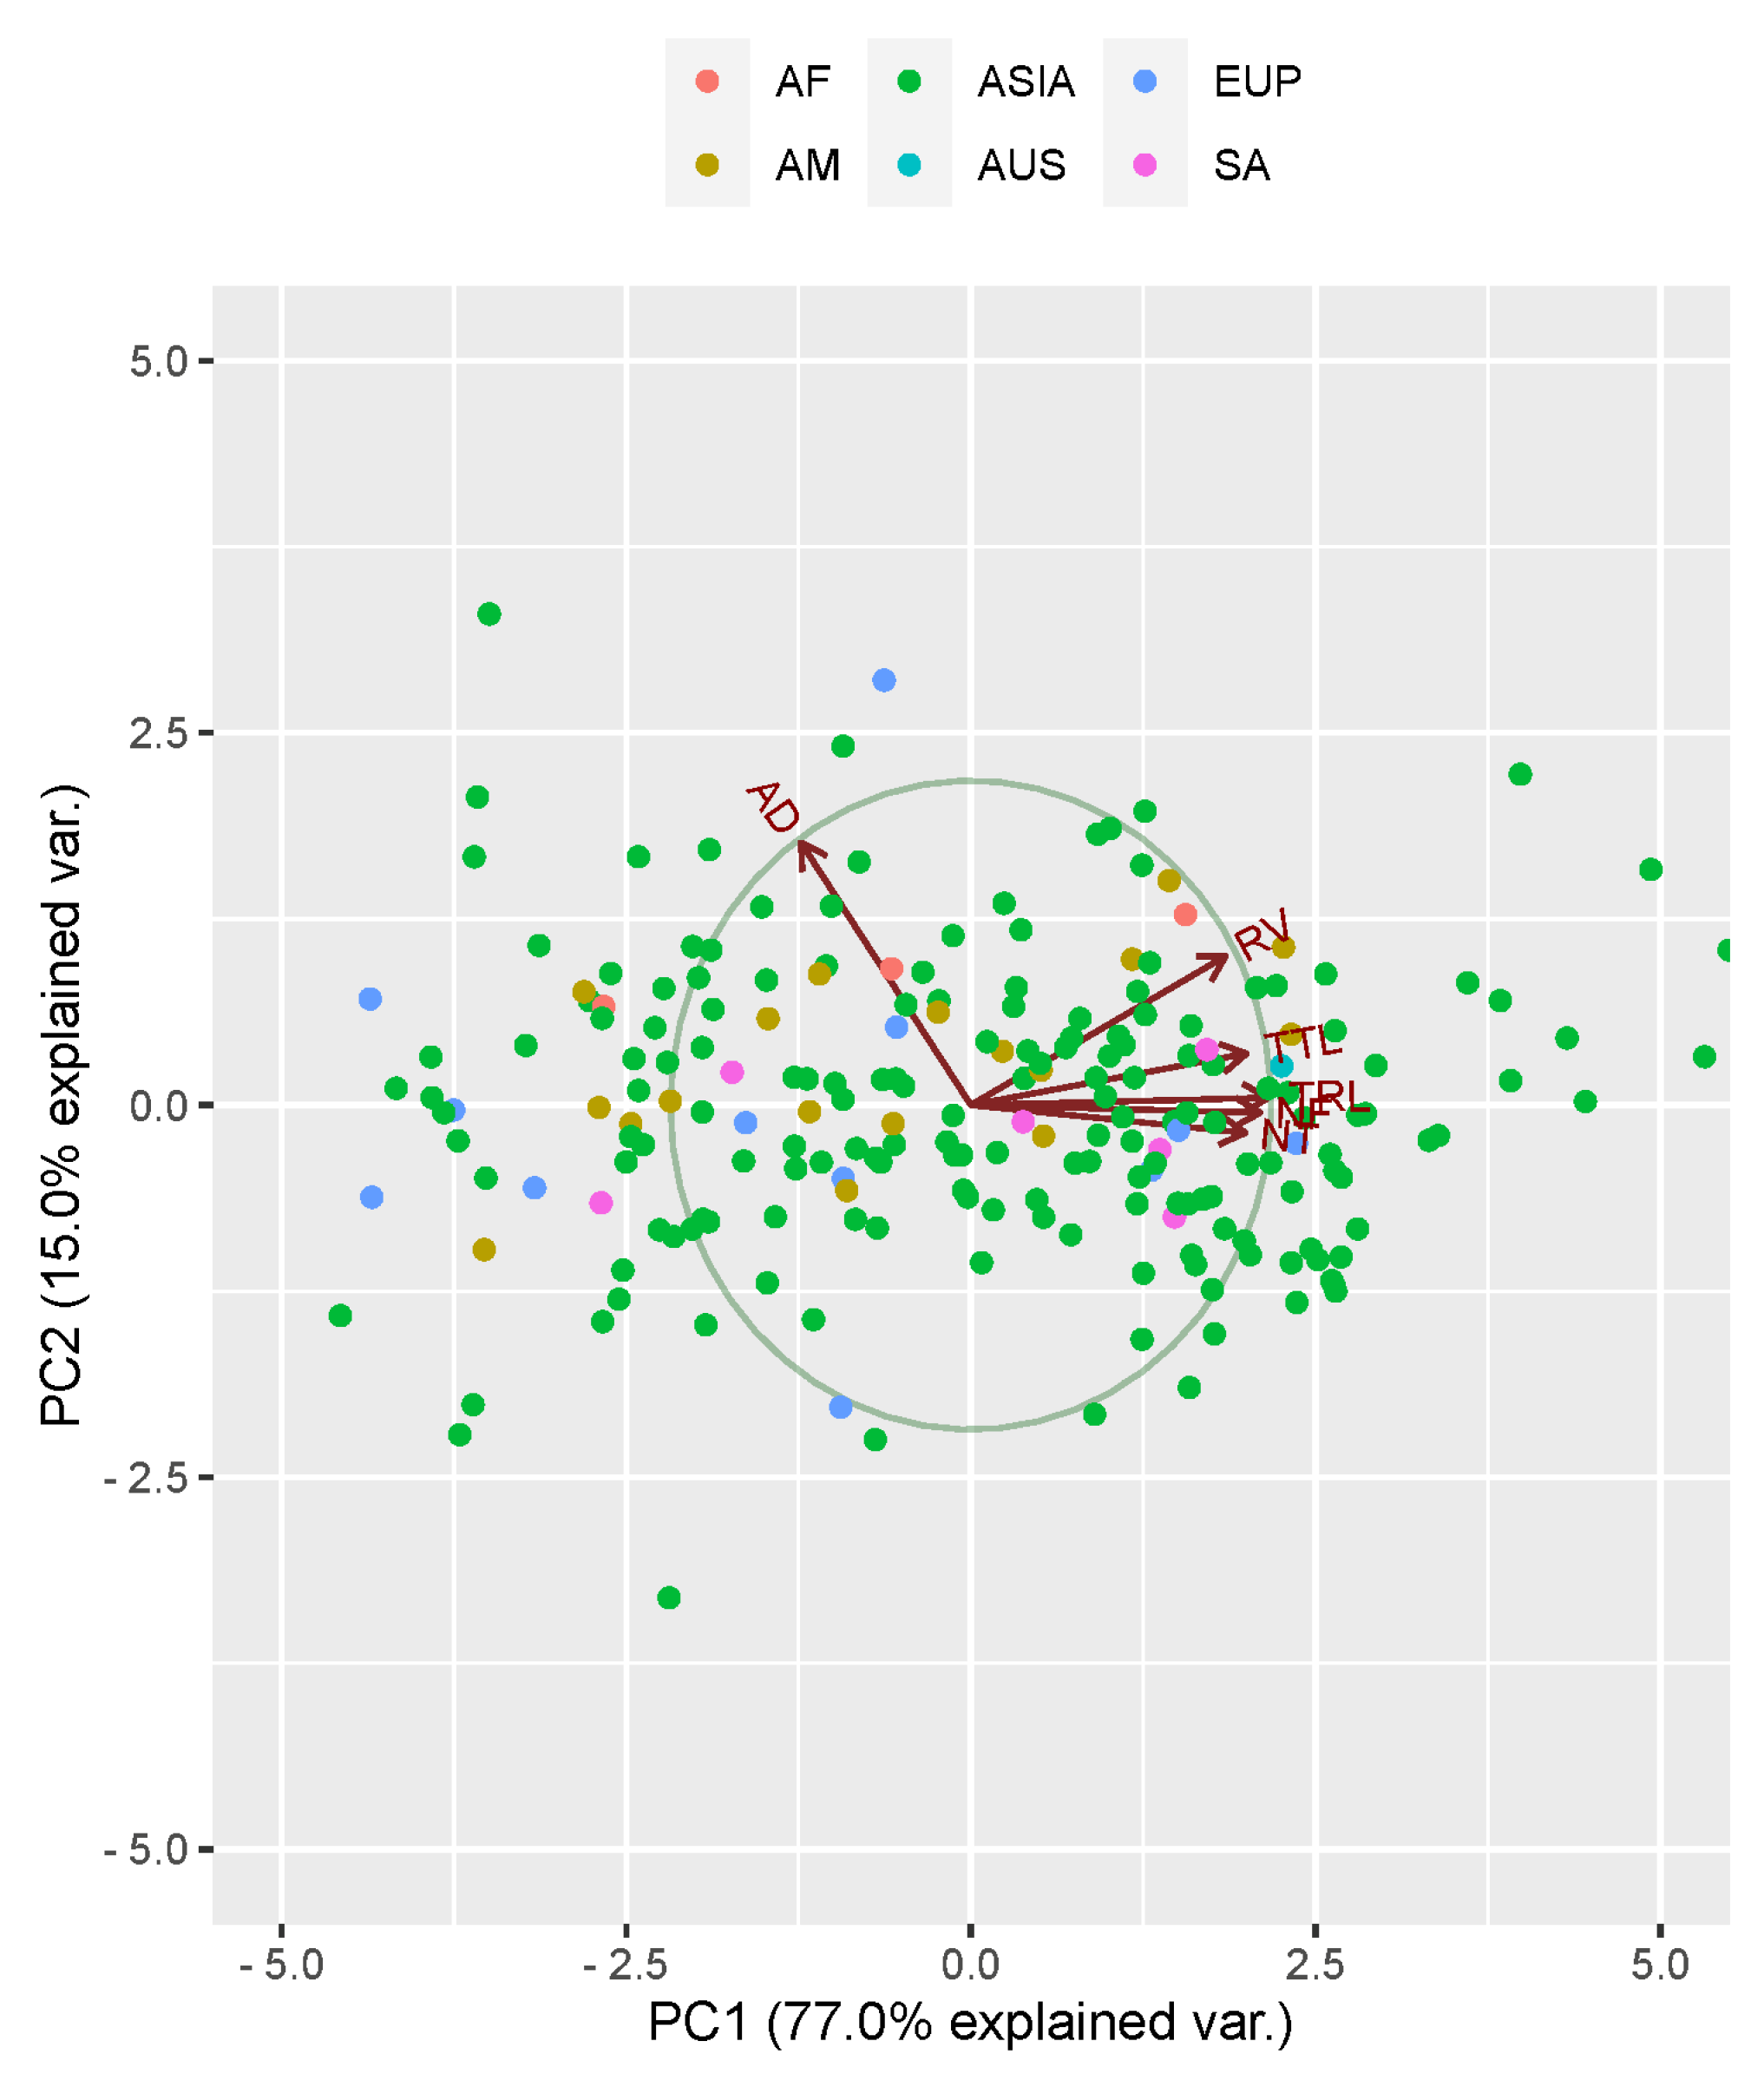
3.3. Principal Component Analysis

A PCA was performed on the dataset. The first three PCs captured the most variability in the data, accounting for a 95% variation, in which the first PC1 had most of the traits, showing an eigenvalue of 4.644—capturing 77.0% of the total variation in the data. PC2 represented an eigenvalue of 0.900, accounting for 15.0% of the variability, and PC3 had an eigenvalue of 0.206, accounting for 3.4% of the variability, while PC4 accumulated an eigenvalue of 0.107, accounting for 2.1% of the variability (Table 4).
The traits corresponding to PC1 were TRL, RV, NT, NF, and TTL, with positive eigenvectors of 0.460, 0.394, 0.425, 0.448, and 0.426, respectively, whereas the root AD showed an eigenvector value of 0.216 in PC3, respectively (Table 5). All the measured traits and accessions were plotted against two PCs (Figure 5). The angle between the direction of the traits indicates their approximate correlations. Accessions with similar traits that clustered together in the same PCs appear close to their corresponding PCs on the biplot (Figure 5).
The correlation matrix of the traits with the PCs responded similarly, where TRL, RV, NT, NF, and TTL showed strong positive correlations of 0.46, 0.39, 0.42, 0.44, and 0.42 to PC1, respectively, while AD indicated a positive correlation with PC3 of 0.21. Surprisingly, NT also showed a positive correlation (r = 0.82) with PC3 (Figure 6).

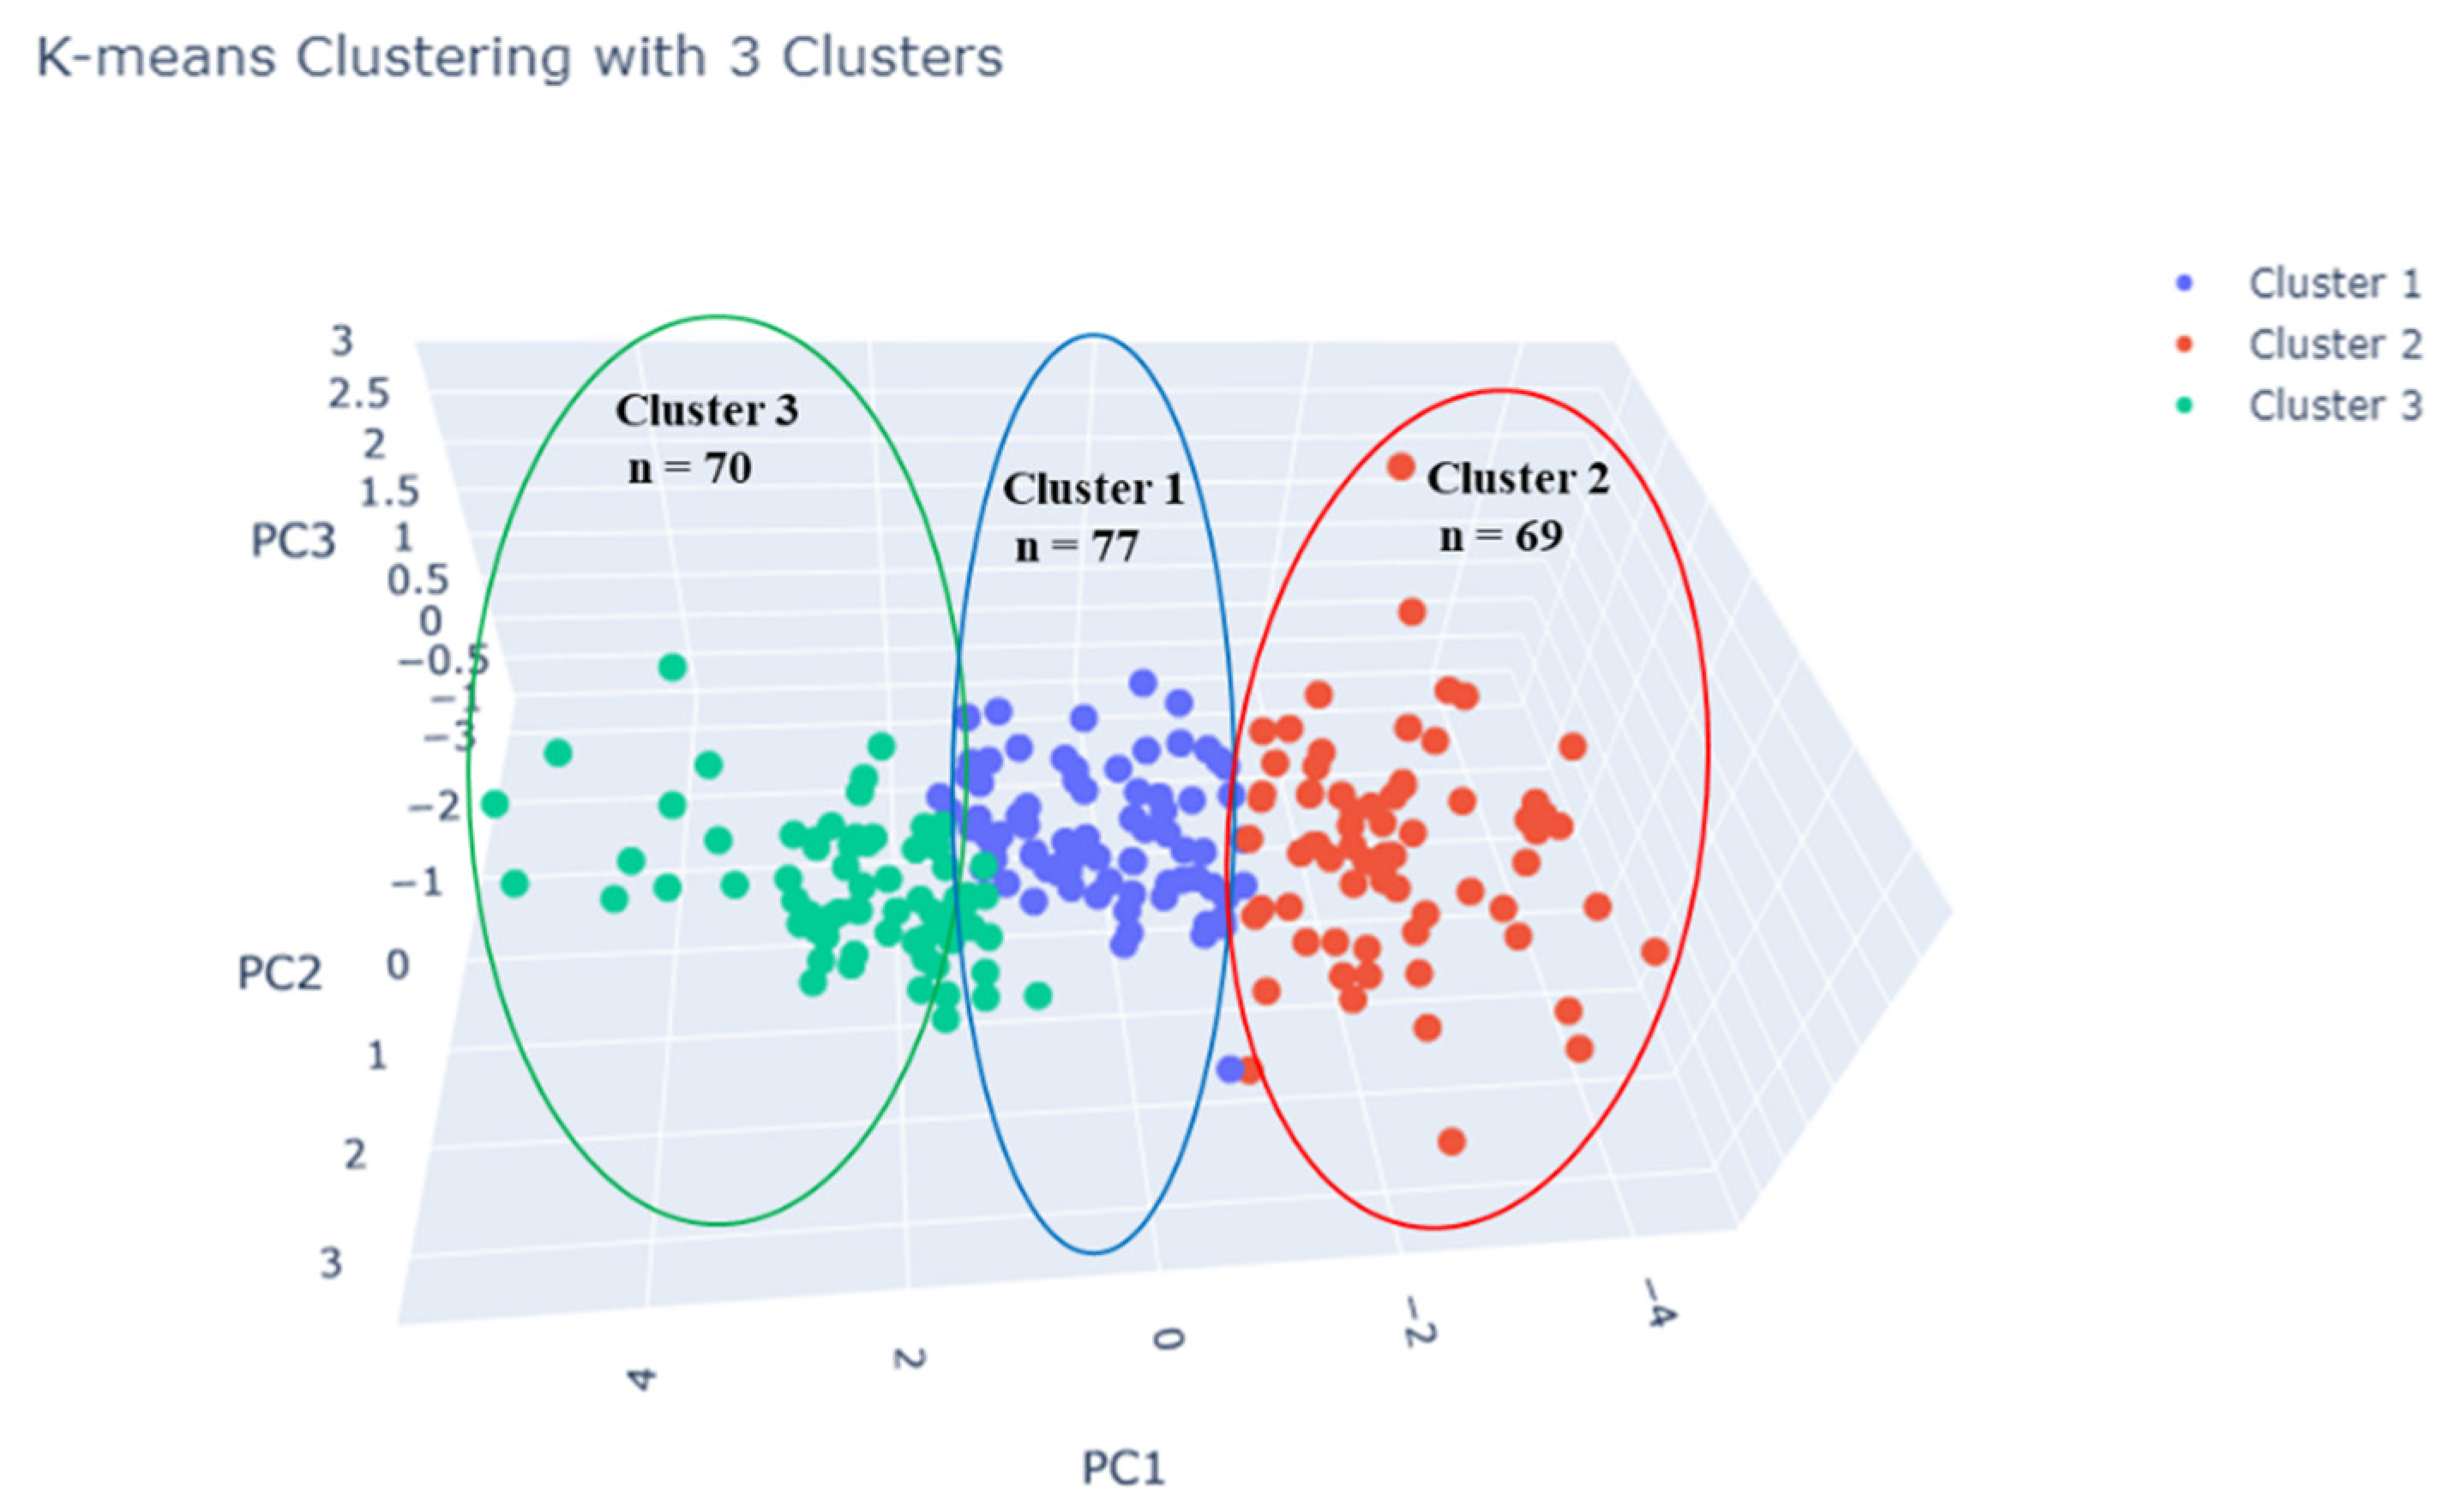
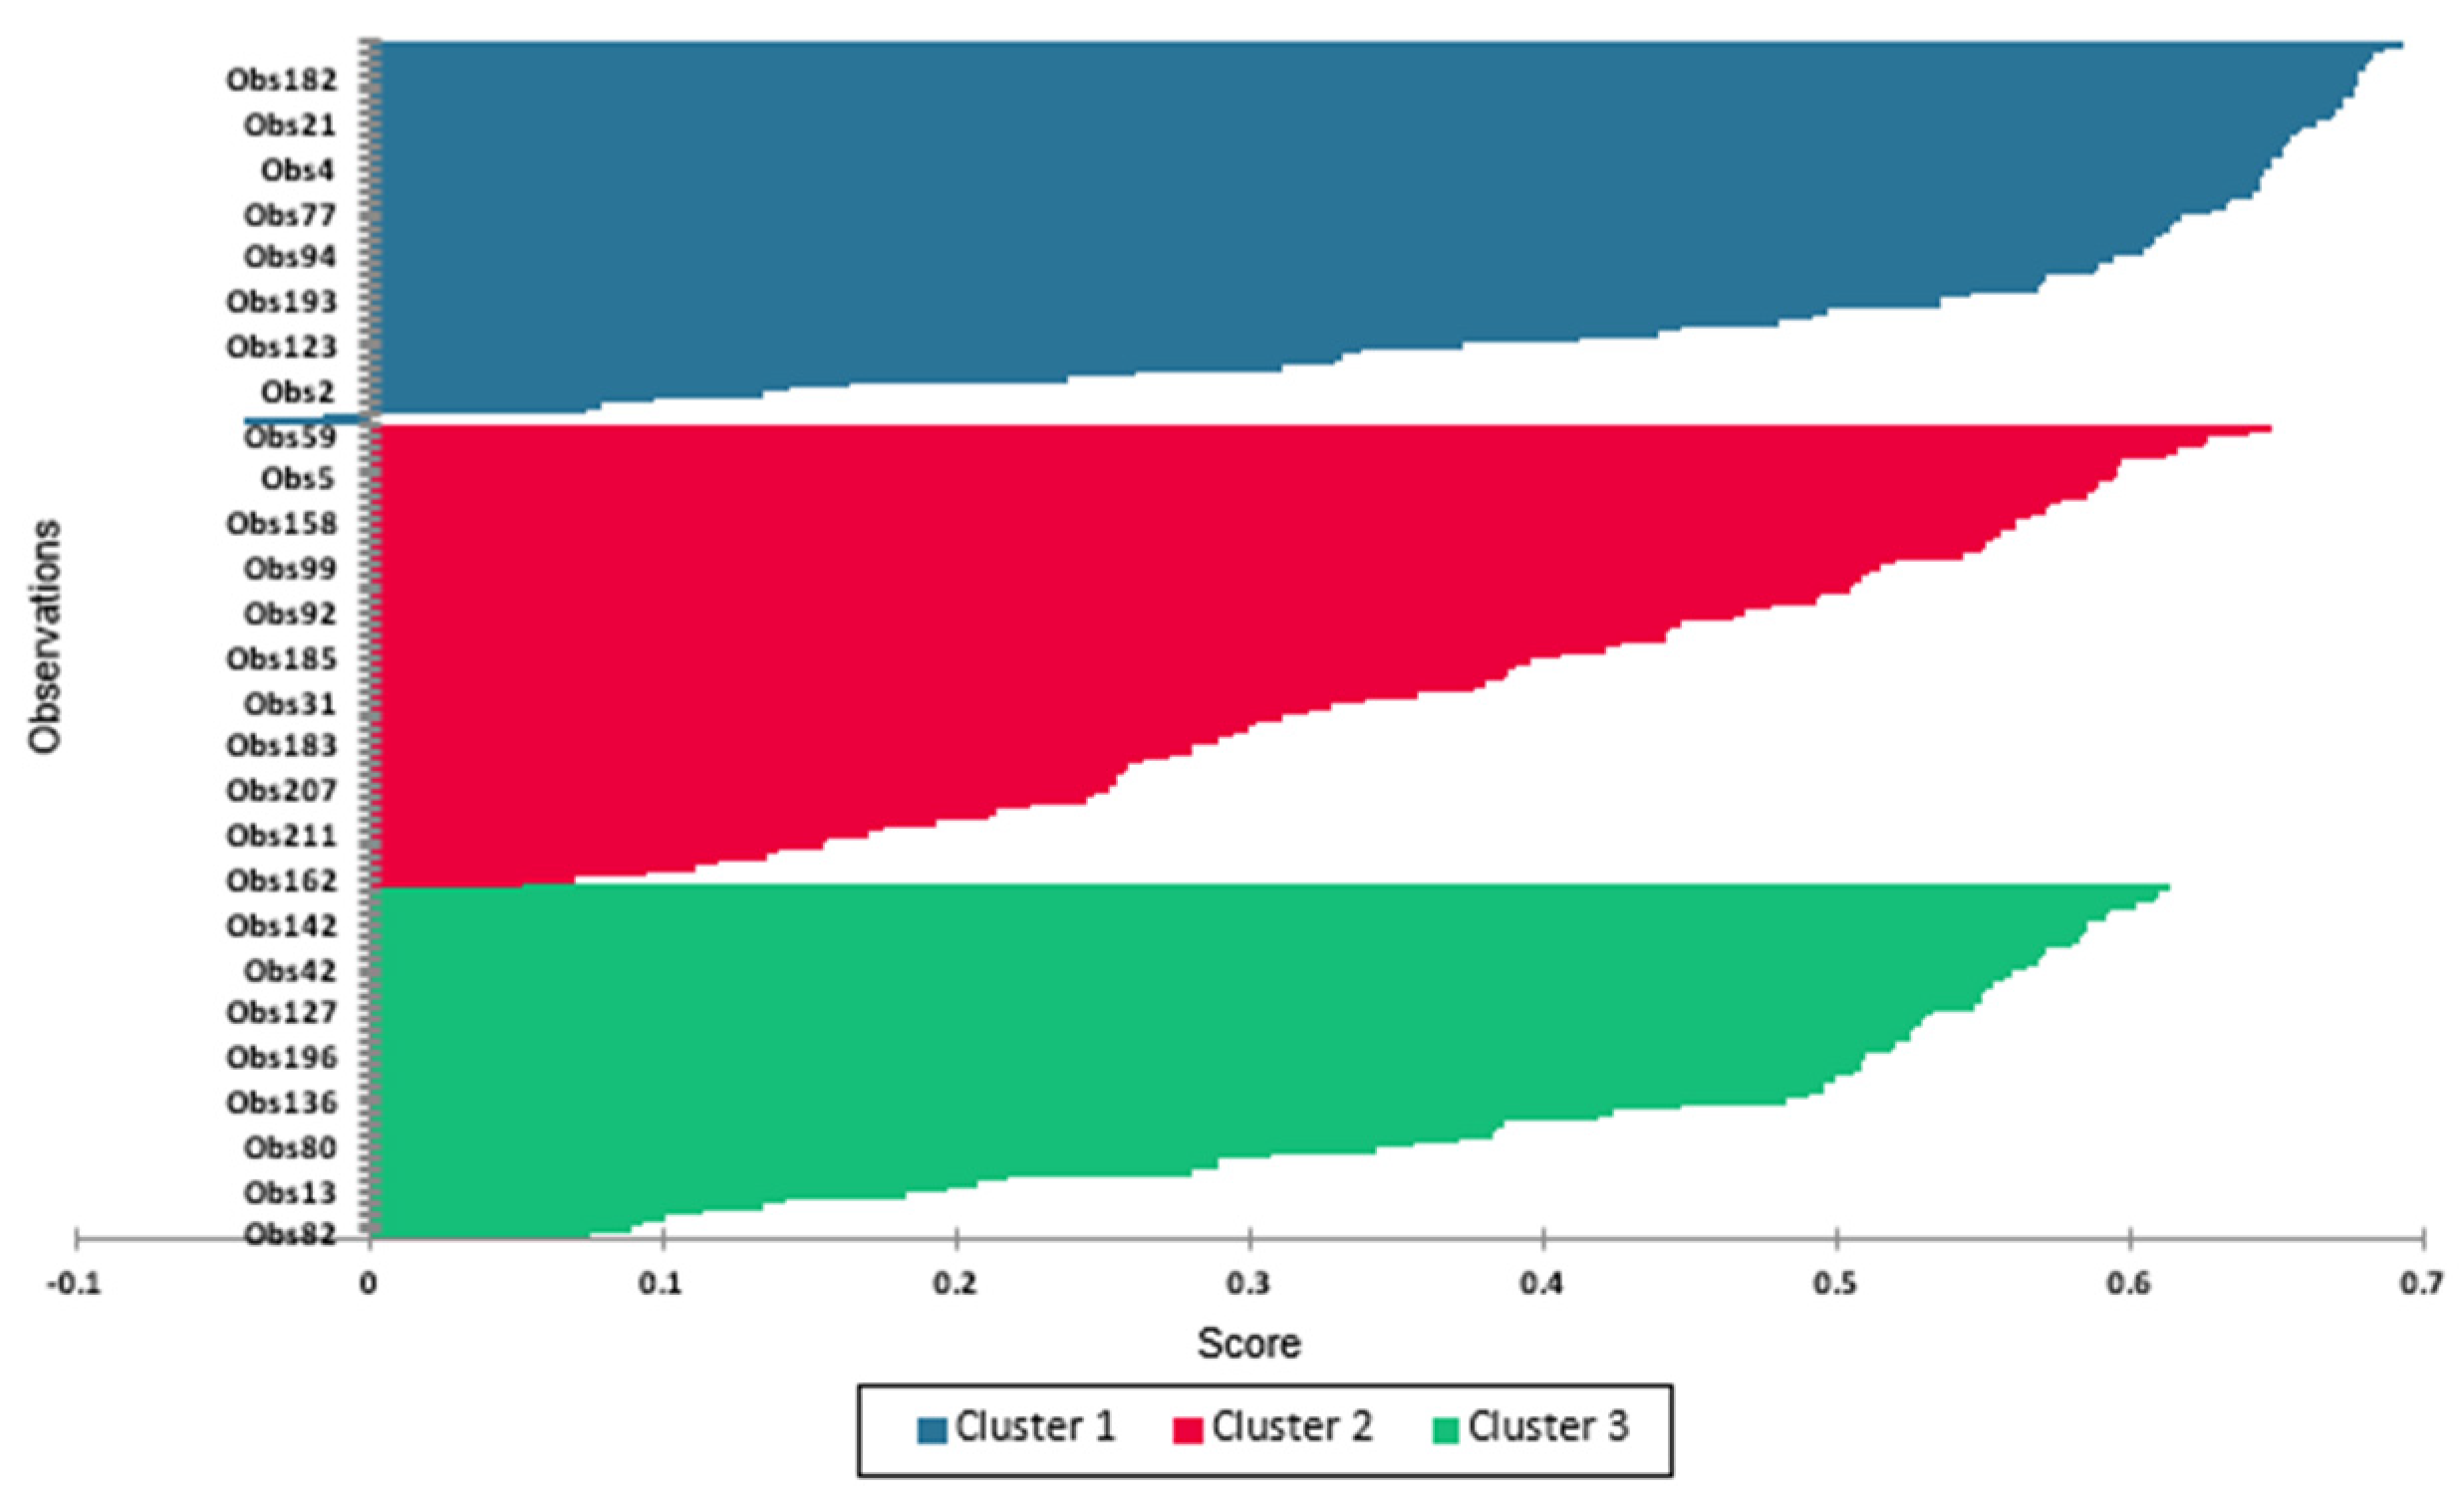
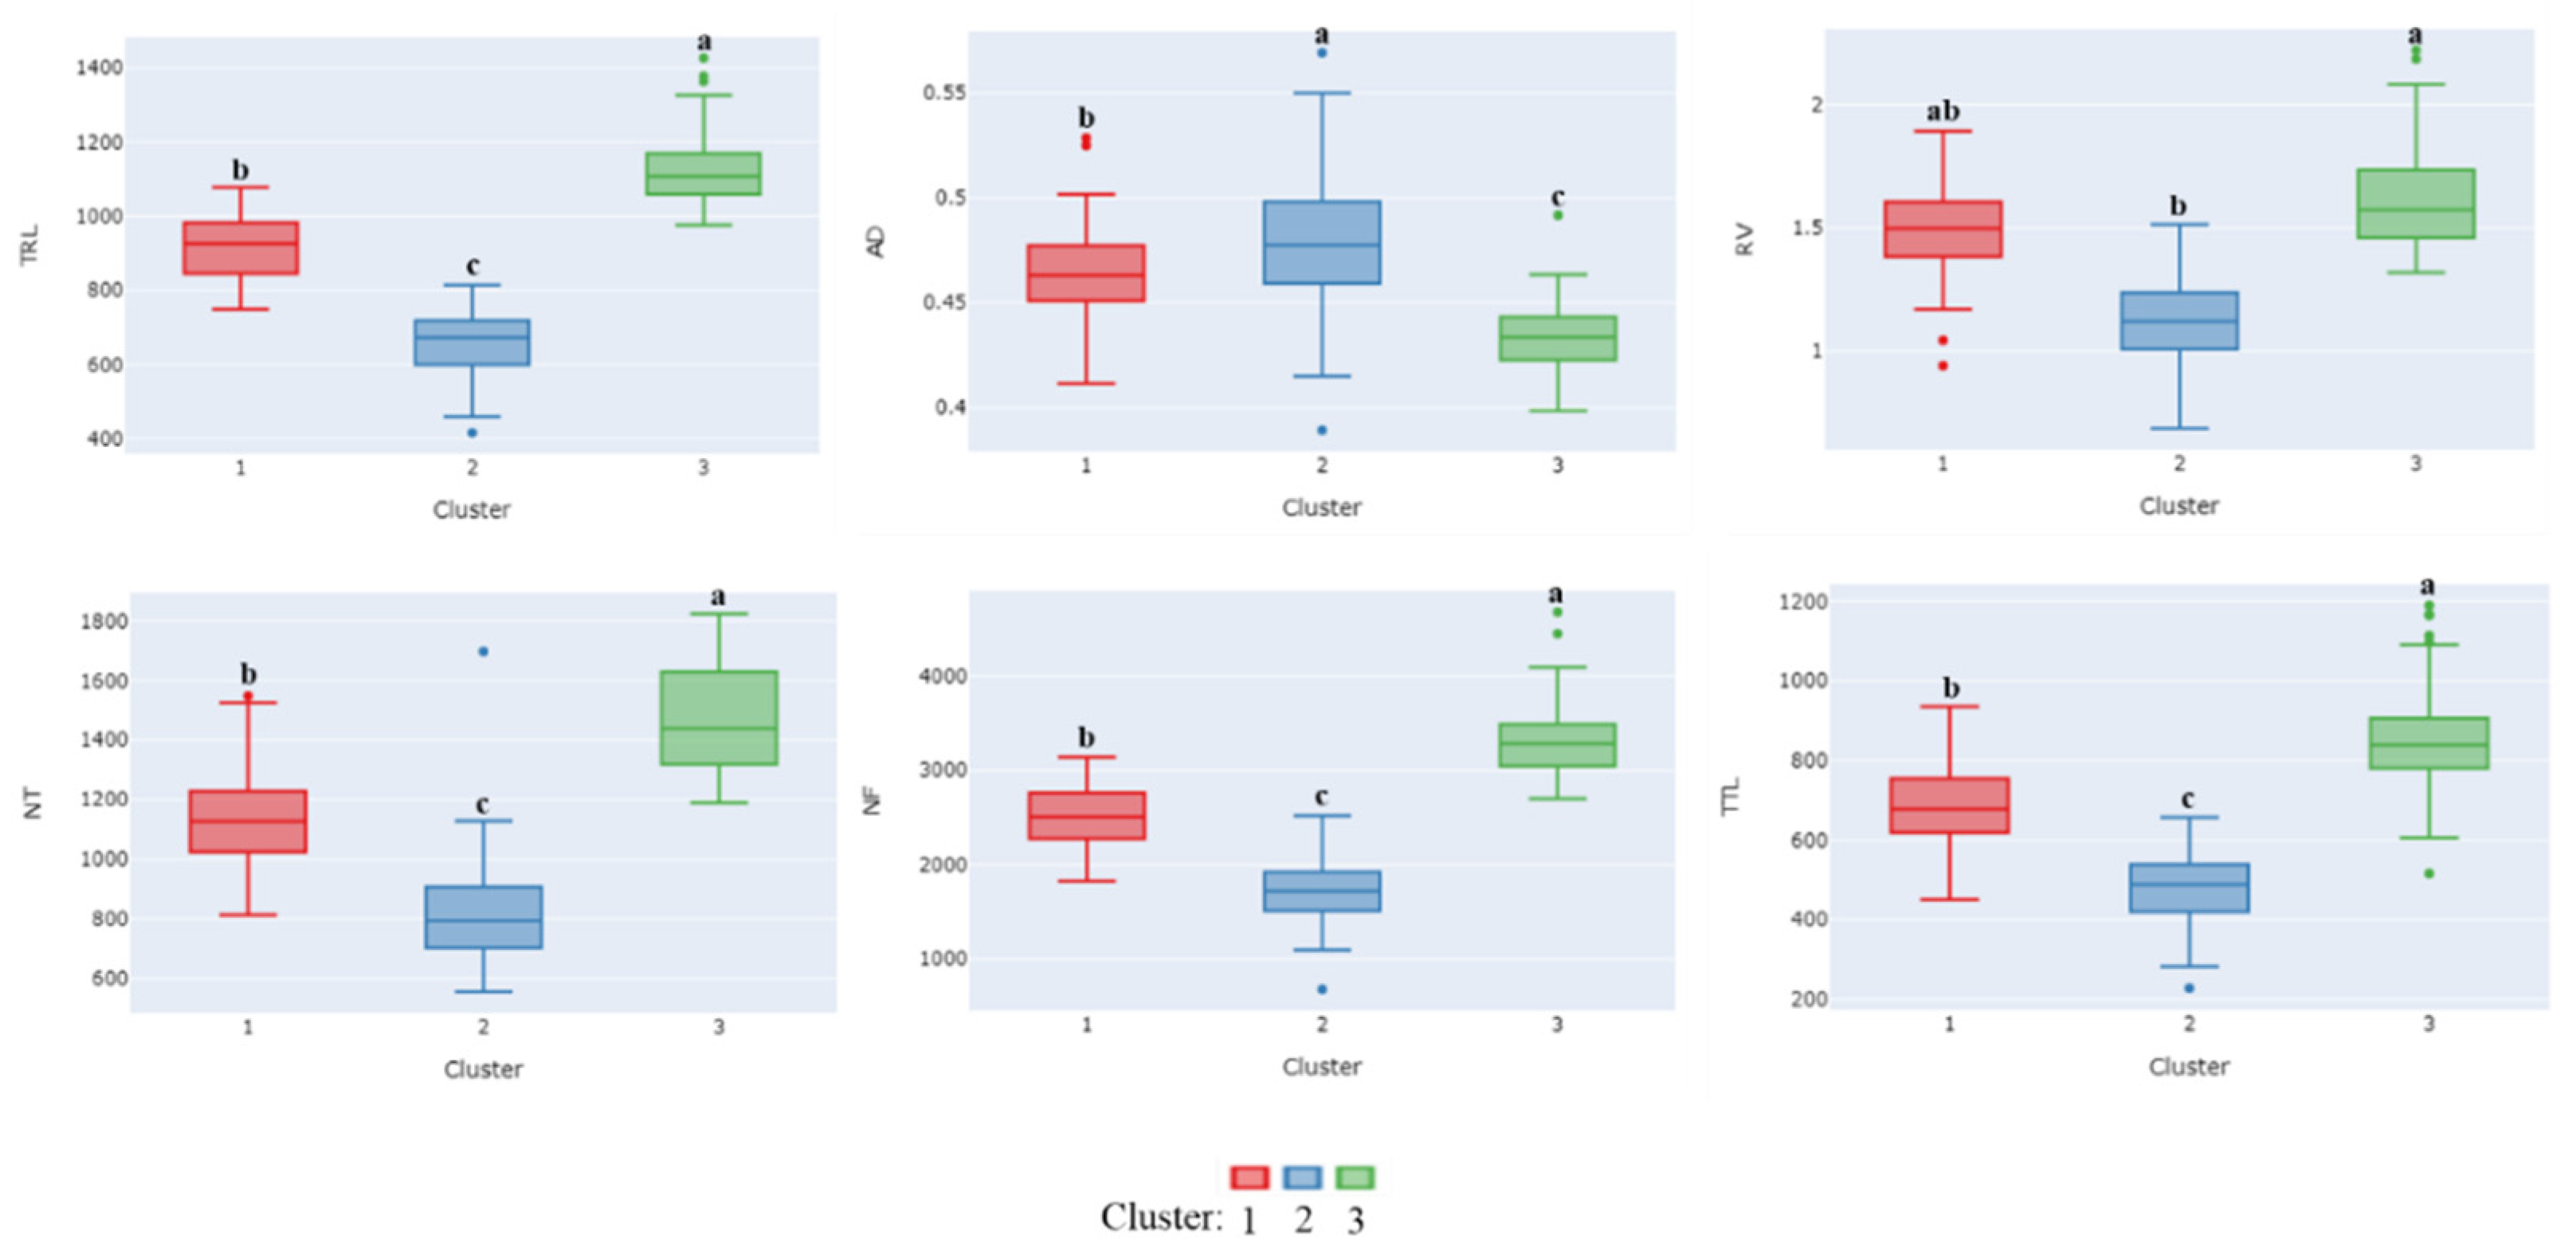
3.4. Cluster Analysis of Root Traits

A K-means clustering analysis was conducted on the dataset using three clusters. The optimum numbers of clusters were chosen using the Within-Cluster Sum of Squares (WCSS) method (Figure S1, Table S2). Accessions with similar characteristics were grouped together. The results showed a group of 77 accessions assembled together in Cluster 1, 69 in Cluster 2, and 70 in Cluster 3 (Figure 7, Table S3). The silhouette scores revealed cohesion, indicating well-defined and well-separated clusters (Figure 8). Accessions with higher AD values were grouped into Cluster 2, those with higher TRLs and related traits were assembled in Cluster 3, and those with intermediate values were grouped into Cluster 1 (Figure 9, Table S3).

4. Discussion

This study comprehensively evaluated the root traits—TRL, AD, RV, NT, NF, and TTL—in a substantial set of 216 accessions from 34 diverse geographical origins, spanning two consecutive years, 2021–2022. Our study showed a significant diversity among the traits of the studied germplasms. To explore the interrelationships between the important root traits, a correlation analysis was performed among the traits. TRL demonstrated a negative association with AD while, conversely, positive associations with RV, NT, NF, and TTL (Figure 3). This pattern of association can be attributed to the inverse relationship between root length and thickness, as reported in previous studies [35,36]. Furthermore, thinner roots typically exhibit a higher fibrous nature and a greater propensity for branching than thicker roots [37,38]. Additionally, a growth in TRL results in deeper roots, coupled with a fibrous nature, causing an increased root coverage, subsequently causing a higher root surface area and expanded RV [35,37,38]. Our results are consistent with those of previous studies, in which similar trends among root traits have been noted in different legumes, including soybeans [35,39,40]. Considering the importance of RMTs, the varieties were ranked on the basis of these traits and their geographical origins to investigate the potential regional influences on these characteristics. Interestingly, the cultivars of the top 5% in terms of TRL originated from Korea. The same was true for other essential RMTs, i.e., RV, NT, NF, and TTL, in which the top 5% cultivars predominantly originated from Korea (Table 3). The list of those with higher root ADs was shared by Serbians and a few of Korean origin. The variability in traits among different cultivars can be linked to their origins. Under water-limited conditions, the availability of water and nutrients to plants is contingent on environmental conditions, root system morphology, architectural traits, and competition; consequently, plants under such conditions tend to develop deeper root systems to access water [35,41].
A PCA was performed to discern the underlying patterns and primary components that governed the variability of the root traits. The first three PCs collectively elucidated most of the variance within the dataset. Notably, PC1 showed the most substantial influence, accounting for 77% of the total variance, with an associated eigenvalue of 4.64 (Table 4). TRL, RV, NT, NF, and TTL exhibited the highest eigenvectors in association with it (Table 5), highlighting the representation of most root traits. The pronounced prominence of PC1 suggests a notable commonality among these traits, implying potential shared environmental, genetic, or origin-related factors that warrant further investigation. Conversely, PC2 contributed an eigenvalue of 0.90, accounting for 15% of the total variability. The intermediate role of PC2 highlights its aptitude for capturing the unique patterns of variation that extend beyond the overarching trend represented by PC1. These distinctive patterns may pertain to specific root traits that deviate from the pattern captured by PC1, thereby offering valuable insights into trait interactions and adaptations, particularly pertinent to germplasm selection. There was also the presence of PC3, characterized by an eigenvalue of 0.206, representing 3.4% of the total variability. PC3 unveiled subtler variations in the RMTs that were not fully accounted for by PC1 or PC2, showing dissimilarity. Expectedly, AD correlated with PC3, exhibiting a higher eigenvector value in the direction opposite to that of TRL. This alignment confirms the earlier noted relationship between traits, specifically TRL and AD (Figure 6). Similar patterns have also been reported by studies conducted on Adzuki beans (Vigna angularis) and Sorghum (Sorghum bicolor) [35,42].
The objective of our experiment was to comprehensively characterize RMTs, study their mutual associations, and provide a targeted roadmap for an optimized breeding program focused on developing cultivars with superior RMTs. To achieve this objective, trait-based categorizations of the examined 216 accessions were employed. This approach effectively streamlined our efforts, allowing us to concentrate on clusters or groups that exhibited the desired RMTs, thus facilitating targeted and efficient breeding endeavors. The WCSS methodology was employed in combination with k-means clustering, with which the comprehensive dataset of 216 accessions was grouped into three distinct clusters. The same number of clusters was also formed in the previous studies conducted on the RMTs of adzuki bean and soybean [35,39]. In our study, a detailed analysis of the RMTs in each cluster showed significant differences in the accessions of the other clusters. Consistent with the correlation analysis and PCA findings, accessions displaying dissimilarities in RMTs, i.e., TRL or AD, were categorized into distinct clusters and vice versa (Figure 7). In our results, Cluster 2 was characterized by accessions with higher AD values. In contrast, Cluster 3 predominantly comprised accessions with more prominent root-length-related traits, i.e., TRL, NT, NF, and TTL (Figure 9, Table S3). The presence of well-separated clusters suggested a substantial phenotypic and genetic diversity in the RMTs among the germplasms. Interestingly, the germplasms originating from Korea were observed to be greater in number in Cluster 3, substantiating the significance of the origin’s role, as previously mentioned [35,41].
A longer TRL and other improved RMTs serve as positive indicators for a plant’s tolerance to abiotic stresses, overall crop growth, and yield output [36]. Improved RMTs enable plants to cover more soil layers and access more nutrient hotspots and water profiles [37,40,41,43,44,45,46,47]. Additionally, NT is a crucial trait of the plant root system, particularly due to its sensitivity to abiotic stresses and its crucial role in plant stress signaling and phytohormone level modification [48]. These distinct clusters offer targeted opportunities for breeders to improve specific root traits, address particular concerns, and optimize root systems with better and improved RMTs. By leveraging our findings, breeding programs can strategically target these clusters to enhance crop performance and adaptability across diverse environmental conditions. Furthermore, it is imperative to thoroughly investigate the influence of origin on root traits and its potential implications for future breeding programs.

5. Conclusions

This study comprehensively evaluated the root traits of 216 diverse soybean germplasms from 34 different origins. The results revealed a significant diversity among all the measured traits, and a correlation analysis demonstrated interesting associations between the different root traits. TRL exhibited positive correlations with RV, NT, NF, and TTL, whereas it had a negative correlation with AD. The top 5% varieties, based on the TRL and related architecture traits, were predominantly of Korean origin. Germplasm IT115491 had an impressive TRL value of 1426.24 cm, whereas the highest AD values were from Serbian and Korean germplasms. Notably, the highest AD was in IT156262 at 0.57 mm. A PCA provided valuable insights into the major patterns of variation among the RMTs. The first three PCs collectively captured a substantial 95% of the total variability, with PC1 accounting for 77.00% of the variance. PC1 served as a representative composite of most of the root traits under investigation, suggesting a strong underlying commonality among these traits, likely driven by shared origin or genetic factors. PC2 and PC3 showed unique patterns of variation that were not fully accounted for by PC1, offering insights into specific root traits and their interactions critical for certain germplasms. The WCSS method was used to group the accessions into three optimal clusters, followed by a k-means clustering analysis. Notably, Cluster 2 exhibited higher AD values, whereas Cluster 3 comprised accessions with more prominent root-length-related traits, in which most of the germplasms were of Korean origin. Cluster 1 occupied an intermediate position.
To conclude, our study offers valuable insights into the distinctive root system characteristics of diverse soybean germplasms, providing a foundation for advancing soybean breeding strategies aimed at improving RMTs, enhancing crop productivity, and improving adaptability, specifically needed in changing environmental conditions. These distinct clusters provide targeted opportunities for breeders to enhance specific root traits, address pertinent concerns, and optimize root systems. Furthermore, we suggest that the role of origin in shaping RMTs and RSAs should be further explored.

Supplementary Materials

The following supporting information can be downloaded at: https://www.mdpi.com/article/10.3390/agronomy13102666/s1, Figure S1: An Elbow graph using WCSS method; Table S1: List of soybean accessions used; Table S2: Cluster results; Table S3: K-means clustering results.

Author Contributions

Conceptualization, Y.K. and S.A.A.; methodology, W.K., M.S.I., A.G. and L.L.; software, W.K.; validation, Y.K.; formal analysis, W.K.; investigation, W.K., S.A.A., M.S.I., A.G. and L.L.; resources, Y.K.; data curation, W.K. and S.A.A.; writing—original draft preparation, W.K. and S.A.A.; writing—review and editing, Y.K.; visualization, W.K.; supervision, Y.K.; project administration, Y.K.; funding acquisition, Y.K. All authors have read and agreed to the published version of the manuscript.

Funding

This research was supported by biological materials Specialized Graduate Program through the Korea Environmental Industry & Technology Institute(KEITI) funded by the Ministry of Environment(MOE). This research was supported by the Korea Basic Science Institute (National Research Facilities and Equipment Center) grant funded by the Ministry of Education (2021R1A6C101A416). Whole genome analysis was done at KNU NGS center (Daegu, South Korea).

Data Availability Statement

Not applicable.

Conflicts of Interest

The authors declare no conflict of interest.

References

  1. Sun, J.; Mooney, H.; Wu, W.; Tang, H.; Tong, Y.; Xu, Z.; Huang, B.; Cheng, Y.; Yang, X.; Wei, D.; et al. Importing food damages domestic environment: Evidence from global soybean trade. Proc. Natl. Acad. Sci. USA 2018, 115, 5415–5419. [Google Scholar] [CrossRef]
  2. Staniak, M.; Szpunar-Krok, E.; Kocira, A. Responses of soybean to Selected Abiotic Stresses—Photoperiod, Temperature and Water. Agriculture 2023, 13, 146. [Google Scholar] [CrossRef]
  3. Kotecki, A.; Lewandowska, S. Studia na Uprawą Soi Zwyczajnej (Glycine max (L.) Merrill) w Południowo-Zachodniej Polsce; Wydawnictwo Uniwersytetu Przyrodniczego we Wrocławiu: Wrocław, Poland, 2020; pp. 54–79. [Google Scholar]
  4. Święcicki, W.; Chudy, M.; Żuk-Gołaszewska, K. Rośliny strączkowe w projektach badawczych Unii Europejskiej (Grain legumes in the UE framework programmes). Zesz. Probl. Postępów Nauk. Rol. 2007, 522, 55–65. [Google Scholar]
  5. Bellaloui, N.; Bruns, H.A.; Abbas, H.K.; Mengistu, A.; Fisher, D.K.; Reddy, K.N. Agricultural practices altered soybean seed protein, oil, fatty acids, sugars, and minerals in the Midsouth USA. Front. Plant Sci. 2015, 6, 31. [Google Scholar] [CrossRef] [PubMed]
  6. Adeyemo, S.M.; Onilude, A.A. Enzymatic Reduction of Anti-nutritional Factors in Fermenting Soybeans by Lactobacillus plantarum Isolates from Fermenting Cereals. Niger. Food J. 2013, 31, 84–90. [Google Scholar] [CrossRef]
  7. Anderson, E.J.; Ali, M.L.; Beavis, W.D.; Chen, P.; Clemente, T.E.; Diers, B.W.; Graef, G.L.; Grassini, P.; Hyten, D.L.; McHale, L.K.; et al. Soybean [Glycine max (L.) Merr.] breeding: History, improvement, production and future opportunities. In Advances in Plant Breeding Strategies: Legumes; Springer International Publishing: Cham, Switzerland, 2019; Volume 7, pp. 431–516. [Google Scholar]
  8. Michałek, S.; Borowski, E. Seed germination and seedling growth of the Polish soybean (Glycine max (L.) Merr.) cultivars in drought conditions. Biul. IHAR 2002, 195–202. [Google Scholar]
  9. Hou, G.; Ablett, G.R.; Pauls, K.P.; Rajcan, I. Environmental effects on fatty acid levels in soybean seed oil. J. Am. Oil. Chem. Soc. 2006, 83, 759–763. [Google Scholar] [CrossRef]
  10. Cramer, G.R.; Urano, K.; Delrot, S.; Pezzotti, M.; Shinozaki, K. Effects of abiotic stress on plants: A systems biology perspective. BMC Plant Biol. 2011, 11, 163. [Google Scholar] [CrossRef]
  11. Wang, L.; Liu, L.; Ma, Y.; Li, S.; Dong, S.; Zu, W. Transcriptome profilling analysis characterized the gene expression patterns responded to combined drought and heat stresses in soybean. Comput. Biol. Chem. 2018, 77, 413–429. [Google Scholar] [CrossRef]
  12. Jumrani, K.; Bhatia, V.S. Interactive effect of temperature and water stress on physiological and biochemical processes in soybean. Physiol. Mol. Biol. Plants 2019, 25, 667–681. [Google Scholar] [CrossRef]
  13. Gupta, P.; Sharma, R.; Sharma, M.K.; Sharma, M.P.; Satpute, G.K.; Garg, S.; Singla-Pareek, S.L.; Pareek, A. Signaling cross talk between biotic and abiotic stress responses in soybean. In Abiotic and Biotic Stresses in Soybean Production; Oxford Academic Press: Oxford, UK, 2016; Volume 1, pp. 27–52. [Google Scholar]
  14. Wijewardana, C.; Reddy, K.; Alsajri, F.; Irby, J.; Krutz, J.; Golden, B. Quantifying soil moisture deficit effects on soybean yield and yield component distribution patterns. Irrig. Sci. 2018, 36, 241–255. [Google Scholar] [CrossRef]
  15. Bengough, A.G.; Mullins, C.E. Mechanical impedance to root growth: A review of experimental techniques and root growth responses. J. Soil Sci. 1990, 41, 341–358. [Google Scholar] [CrossRef]
  16. Tu, J.; Tan, C. Effect of soil compaction on growth, yield and root rots of white beans in clay loam and sandy loam soil. Soil Biol. Biochem. 1991, 23, 233–238. [Google Scholar] [CrossRef]
  17. Yu, L.X.; Ray, J.D.; O’Toole, J.C.; Nguyen, H.T. Use of wax_petrolatum layers for screening rice root penetration. Crop Sci. 1995, 35, 684–687. [Google Scholar] [CrossRef]
  18. Barraclough, P.; Weir, A. Effects of a compacted subsoil layer on root and shoot growth, water use and nutrient uptake of winter wheat. J. Agric. Sci. 1988, 110, 207–216. [Google Scholar] [CrossRef]
  19. Busscher, W.; Sojka, R.; Doty, C. Residual effects of tillage on coastal plain soil strength1. Soil Sci. 1986, 141, 144–148. [Google Scholar] [CrossRef]
  20. Kim, S.H.; Subramanian, P.; Hahn, B.S.; Ha, B.K. High-Throughput Phenotypic Characterization and Diversity Analysis of soybean Roots (Glycine max L.). Plants 2022, 11, 2017. [Google Scholar] [CrossRef] [PubMed]
  21. Fried, H.G.; Narayanan, S.; Fallen, B. Characterization of a soybean (Glycine max L. Merr.) germplasm collection for root traits. PLoS ONE 2018, 13, e0200463. [Google Scholar] [CrossRef]
  22. Carter, T. Breeding for drought tolerance in soybean-where do we stand. In World Soybean Research Conference IV; Asociacion Agrentina de la Soja: Rosario, Argentina, 1989. [Google Scholar]
  23. Gaur, P.M.; Krishnamurthy, L.; Kashiwagi, J. Improving drought-avoidance root traits in chickpea (Cicer arietinum L.)-current status of research at ICRISAT. Plant Prod. Sci. 2008, 11, 3–11. [Google Scholar] [CrossRef]
  24. Ao, J.; Fu, J.; Tian, J.; Yan, X.; Liao, H. Genetic variability for root morph-architecture traits and root growth dynamics as related to phosphorus efficiency in soybean. Funct. Plant Biol. 2010, 37, 304–312. [Google Scholar] [CrossRef]
  25. Liang, Q.; Cheng, X.; Mei, M.; Yan, X.; Liao, H. QTL analysis of root traits as related to phosphorus efficiency in soybean. Ann. Bot. 2010, 106, 223–234. [Google Scholar] [CrossRef] [PubMed]
  26. Bengough, A.G.; McKenzie, B.M.; Hallett, P.D.; Valentine, T.A. Root elongation, water stress, and mechanical impedance: A review of limiting stresses and beneficial root tip traits. J. Exp. Bot. 2011, 62, 59–68. [Google Scholar] [CrossRef] [PubMed]
  27. Lynch, J. Root Architecture and Plant Productivity. Plant Physiol. 1995, 109, 7–13. [Google Scholar] [CrossRef] [PubMed]
  28. Zhao, C.; Zhang, Y.; Du, J.; Guo, X.; Wen, W.; Gu, S.; Wang, J.; Fan, J. Crop Phenomics: Current Status and Perspectives. Front. Plant Sci. 2019, 10, 714. [Google Scholar] [CrossRef]
  29. Waisel, Y.; Eshel, A.; Kafkafi, U. Plant-Roots–The Hidden Half, 3rd ed.; Marcel Decker: New York, NY, USA, 2002; pp. 775–776. [Google Scholar]
  30. Poorter, H.; Nagel, O.W. The role of biomass allocation in the growth response of plants to different levels of light, CO2, nutrients and water: A quantitative review. Funct. Plant Biol. 2000, 27, 1191. [Google Scholar] [CrossRef]
  31. Eshel, A.; Beeckman, T. Plant Roots: The Hidden Half; CRC Press: Boca Raton, FL, USA, 2013. [Google Scholar]
  32. Manschadi, A.M.; Hammer, G.L.; Christopher, J.T.; Devoil, P. Genotypic variation in seedling root architectural traits and implications for drought adaptation in wheat (Triticum aestivum L.). Plant Soil 2008, 303, 115–129. [Google Scholar] [CrossRef]
  33. Atkinson, J.A.; Pound, M.P.; Bennett, M.J.; Wells, D.M. Uncovering the hidden half of plants using new advances in root phenotyping. Curr. Opin. Biotechnol. 2019, 55, 1–8. [Google Scholar] [CrossRef]
  34. Gahoonia, T.S.; Ali, O.; Sarker, A.; Nielsen, N.E.; Rahman, M.M. Genetic variation in root traits and nutrient acquisition of lentil genotypes. J. Plant Nutr. 2006, 29, 643–655. [Google Scholar] [CrossRef]
  35. Tayade, R.; Kim, S.; Tripathi, P.; Choi, Y.D.; Yoon, J.B.; Kim, Y. High-Throughput Root Imaging Analysis Reveals Wide Variation in Root Morphology of Wild Adzuki bean (Vigna angularis) Accessions. Plants 2022, 11, 405. [Google Scholar] [CrossRef]
  36. Attipoe, J.Q.; Khan, W.; Tayade, R.; Steven, S.; Islam, M.S.; Lay, L.; Ghimire, A.; Kim, H.; Sereyvichea, M.; Propey, T.; et al. Evaluating the Effectiveness of Calcium Silicate in Enhancing soybean Growth and Yield. Plants 2023, 12, 2190. [Google Scholar] [CrossRef]
  37. Freschet, G.T.; Roumet, C.; Comas, L.H.; Weemstra, M.; Bengough, A.G.; Rewald, B.; Bardgett, R.D.; De Deyn, G.B.; Johnson, D.; Klimešová, J.; et al. Root traits as drivers of plant and ecosystem functioning: Current understanding, pitfalls and future research needs. New Phytol. 2021, 232, 1123–1158. [Google Scholar] [CrossRef]
  38. Eissenstat, D.M.; Kucharski, J.M.; Zadworny, M.; Adams, T.S.; Koide, R.T. Linking root traits to nutrient foraging in arbuscular mycorrhizal trees in a temperate forest. New Phytol. 2015, 208, 114–124. [Google Scholar] [CrossRef]
  39. Tripathi, P.; Kim, Y. Investigation of root phenotype in soybeans (Glycine max L.) using imagery data. J. Crop Sci. Biotechnol. 2022, 25, 233–241. [Google Scholar] [CrossRef]
  40. Dayoub, E.; Lamichhane, J.R.; Schoving, C.; Debaeke, P.; Maury, P. Early-Stage Phenotyping of Root Traits Provides Insights into the Drought Tolerance Level of soybean Cultivars. Agronomy 2021, 11, 188. [Google Scholar] [CrossRef]
  41. Schenk, H.J.; Jackson, R.B. Rooting depths, lateral root spreads and below-ground/above-ground allometries of plants in water-limited ecosystems. J. Ecol. 2002, 90, 480–494. [Google Scholar] [CrossRef]
  42. Desmae, H.; Jordan, D.R.; Godwin, I.D. Geographic patterns of phenotypic diversity in sorghum (Sorghum bicolor (L.) Moench) landraces from North Eastern Ethiopia. Afr. J. Agric. Res. 2016, 11, 3111–3122. [Google Scholar]
  43. Liu, S.; Begum, N.; An, T.; Zhao, T.; Xu, B.; Zhang, S.; Deng, X.; Lam, H.M.; Nguyen, H.T.; Siddique, K.H.M.; et al. Characterization of Root System Architecture Traits in Diverse soybean Genotypes Using a Semi-Hydroponic System. Plants 2021, 10, 2781. [Google Scholar] [CrossRef] [PubMed]
  44. Chen, Y.; Palta, J.; Prasad, P.V.V.; Siddique, K.H.M. Phenotypic variability in bread wheat root systems at the early vegetative stage. BMC Plant Biol. 2020, 20, 185. [Google Scholar] [CrossRef] [PubMed]
  45. Becker, S.; Byrne, P.; Reid, S.; Bauerle, W.; McKay, J.; Haley, S. Root traits contributing to drought tolerance of synthetic hexaploid wheat in a greenhouse study. Euphytica 2016, 207, 213–224. [Google Scholar] [CrossRef]
  46. Forde, B.; Lorenzo, H. The nutritional control of root development. Plant Soil 2001, 232, 51–68. [Google Scholar] [CrossRef]
  47. Rewald, B.; Leuschner, C. Belowground competition in a broad-leaved temperate mixed forest: Pattern analysis and experiments in a four-species stand. Eur. J. For. Res. 2009, 128, 387–398. [Google Scholar] [CrossRef]
  48. Zhao, Z.; Chen, G.; Zhang, C. Interaction between reactive oxygen species and nitric oxide in drought-induced abscisic acid synthesis in root tips of wheat seedlings. Funct. Plant Biol. 2001, 28, 1055–1061. [Google Scholar] [CrossRef]
Figure 1. Geographic Distribution of 216 Germplasms. Numbers associated with each geographical origin indicate the number of germplasms sourced from that location. Additionally, 10 germplasms used in the study have unknown origins.
Agronomy 13 02666 g001
Figure 2. Histograms showing a normal distribution, forming nearly a bell curve of all traits of the 216 germplasms over two years (2021–2022). TRL: Total Root Length; AD: Average Diameter; RV: Root Volume; NT: Number of Tips; NF: Number of Forks; and TTL: Tertiary Total Length.
Agronomy 13 02666 g002
Figure 3. Heatmap showing the correlation between RMTs. The sidebar represents the range of Pearson correlation coefficients ranging from −1 to 1. TRL: Total Root Length; AD: Average Diameter; RV: Root Volume; NT: Number of Tips; NF: Number of Forks; and TTL: Tertiary Total Length.
Agronomy 13 02666 g003
Figure 4. Joint plots demonstrate the linear relationships between important root traits. TRL: Total Root Length; AD: Average Diameter; RV: Root Volume; NT: Number of Tips; NF: Number of Forks; and TTL: Tertiary Total Length.
Agronomy 13 02666 g004
Figure 5. A biplot of PC1 (77.0%) and PC2 (15.0%) based on six root traits, TRL: Total Root Length; AD: Average Diameter; RV: Root Volume; NT: Number of Tips; NF: Number of Forks; and TTL: Tertiary Total Length, of 216 germplasms of diverse origins. AF: Africa; ASIA: EUP: Europe: AM: North America; AUS: Australia; and SA: South America.
Agronomy 13 02666 g005
Figure 6. A heatmap showing root traits’ correlations with PCs. The sidebar represents the range of Pearson correlation coefficients ranging from −1 to 1. TRL: Total Root Length; AD: Average Diameter; RV: Root Volume; NT: Number of Tips; NF: Number of Forks; and TTL: Tertiary Total Length.
Agronomy 13 02666 g006
Figure 7. K-means clustering analysis of 216 accessions based on six measured root traits. n = number of accessions.
Agronomy 13 02666 g007
Figure 8. Silhouette scores of the three clusters of root traits, representing cohesion in the clusters.
Agronomy 13 02666 g008
Figure 9. Box plots of six root traits in three clusters of 216 soybean germplasms. The letters above the box indicate the statistical differences based on the least square difference (LSD). TRL: Total Root Length; AD: Average Diameter; RV: Root Volume; NT: Number of Tips; NF: Number of Forks; and TTL: Tertiary Total Length.
Agronomy 13 02666 g009
Table 1. Descriptive statistics of root traits of 216 soybean germplasms over two years (2021–2022).
TRLADRVNTNFTTL
Mean899.440.461.421140.822522.23672.67
Std Dev212.330.030.28308.25738.25183.97
Min415.730.390.69554.67678.11227.56
Max1426.240.572.221824.174677.831189.26
Kurtosis–0.690.64−0.03−0.79−0.48−0.22
Skewness−0.070.59−0.080.120.100.22
TRL: Total Root Length; AD: Average Diameter; RV: Root Volume; NT: Number of Tips; NF: Number of Forks; and TTL: Tertiary Total Length.
Table 2. ANOVA examination for different root parameters among 216 cultivated soybeans over two consecutive years (2021–2022).
TraitsSourceDFType III SSMean SquareF ValuePr > F
TRLvar.21589,031,898.74414,101.8528.22<0.0001
rep.22973.041486.520.100.9037
ADvar.2150.929318360.004322418.02<0.0001
rep.20.00884290.004421458.200.0003
RVvar.21599.20705540.4614281615.69<0.0001
rep.20.208605860.104302933.550.0297
NTvar.215156,362,761.30727,268.7014.24<0.0001
rep.2361,778.50180,889.203.540.0298
NFvar.2151,199,371,126.005,578,470.0020.64<0.0001
rep.244,006.0022,003.000.080.9218
TTLvar.21566,205,864.10307,934.2512.44<0.0001
rep.215,965.857982.920.320.7244
TRL: Total Root Length; AD: Average Diameter; RV: Root Volume; NT: Number of Tips; NF: Number of Forks; TTL: Tertiary Total Length; and var: variety; rep: replication.
Table 3. Top and bottom 5% varieties based on root trait performance.
RankingIT NumberTRL (cm)Origin IT NumberAD (mm)Origin IT NumberRV (cm3)Origin IT NumberNTOriginIT NumberNFOriginIT NumberTTL (cm)Origin
Top1IT1154911426.24KORIT1562620.57KORIT1154912.22KORIT1433471824.17KORIT1546214677.80KORIT1546211189.26KOR
2IT1543971377.52KORIT1562530.55KORIT1433472.18KORIT1154911781.75KORIT1154914449.20KORIT1601051165.76KOR
3IT1546211363.06KORIT1561950.54KORIT1547242.08KORIT1546211752.33KORIT238484093.50KORIT1433471165.42KOR
4IT1433471325.75KORPUNGSAN0.54KORIT1431692.05KORIT1547241741.33KORIT1601054002.30KORIT1154911113.54KOR
5IT238481317.62KORIT1539150.53KORIT246811.97USAIT1539011734.50KORIT1431693987.80KORIT1543971096.73KOR
6IT1431691276.06KORIT230710.53SRBIT1543971.93KORIT253841723.17KORIT1433473960.20KORIT1547241090.54KOR
7IT1539011268.40KORIT1580730.52SRBIT1546211.93KORIT1010151715.50KORIT1546133909.30KORIT238481030.22KOR
8IT1547241267.25KORIT1431610.52KORIT1428181.89KORPUNGSAN1697.33KORIT1416273888.90KORIT1539011020.78KOR
9IT1601051267.23KORIT1619900.52KORIT1539011.89KORIT1537221688.67KORIT1547243746.10KORIT142811992.27KOR
10IT1546131241.95KORIT1430390.51KORIT1428071.88KORIT1601051680.67KORIT1418653741.00KORIT141865985.56UNK
11IT253841232.20KORIT1561900.51KORIT230711.86SRBIT1614351672.00CHNIT253843725.00KORIT161443973.60AUS
Bottom1IT25668415.73KORIT1461100.39TWNIT228910.69UNKIT161474554.67UNKPUNGSAN678.10KORIT103951227.56KOR
2IT153844459.19KORIT1089290.40KORIT256680.69KORIT153844558.33KORIT1538441094.80KORIT25668281.99KOR
3IT158006464.94BELIT1012560.40KORIT1461100.76TWNIT156262565.67KORIT1580731127.00SRBIT158063336.35ZAF
4IT157861492.51KORIT245700.41KORIT1580060.78BELIT158006572.33BELIT1580491140.50SWEIT24099338.58KOR
5IT158049492.62SWEIT1047890.41KORIT240990.82KORIT25668586.83KORIT256681141.80KORIT153844349.26KOR
6IT22891499.08UNKIT1431920.41JPNIT1417900.87KORIT156253598.50KORIT1578611181.90KORIT158006352.37BEL
7IT141790507.78KORIT1010150.41KORIT1039510.87KORIT21686610.33USAIT1580061190.30BELIT158073356.97SRB
8IT158073508.28SRBIT1155050.41KORIT216650.89CHNIT156278629.50BTNIT1614741275.00UNKIT141790360.16KOR
9IT161474509.85UNKIT1538340.41KORIT1580730.90SRBIT22074630.00UNKIT1562781337.70BTNIT22891361.49UNK
10IT156278524.50BTNIT241470.41KORIT216860.90USAIT103951638.17KORIT1562621352.20KORIT21649369.70HKG
11IT24099560.90KORIT230050.41DNKIT1580040.93BELIT158073649.00SRBIT1039511356.00KORIT21686369.80USA
Note: These accessions were graded on the basis of performance of the two-year data. The accessions (represented by their IT numbers) mentioned made up the top 5% and bottom 5% arranged in descending and ascending order, respectively. TRL: Total Root Length; AD: Average Diameter; RV: Root Volume; NT: Number of Tips; NF: Number of Forks; and TTL: Tertiary Total Length.
Table 4. Eigenvalues and proportions of principal components of six root traits of 216 germplasms.
EigenvaluesExplained VarianceCumulative Variance
PC14.6440.7700.770
PC20.9000.1490.919
PC30.2060.0340.953
PC40.1070.0210.974
PC50.1220.0140.988
PC60.0270.0121.000
Table 5. Eigenvectors of six root traits of 216 germplasms.
TraitsPrincipal Component
(Eigenvectors)
123
TRL0.460−0.024−0.057
AD−0.265−0.8520.216
RV0.394−0.486−0.043
NT0.4250.0920.828
NF0.4480.023−0.078
TTL0.426−0.171−0.507
Disclaimer/Publisher’s Note: The statements, opinions and data contained in all publications are solely those of the individual author(s) and contributor(s) and not of MDPI and/or the editor(s). MDPI and/or the editor(s) disclaim responsibility for any injury to people or property resulting from any ideas, methods, instructions or products referred to in the content.

