Abstract
The lingonberries represent a valuable resource for many sectors of the food industry in a wide variety of both organic and conventional products. In the context of little information on the use of dried and ground lingonberries mixed with flour in bakery processing, this study aimed to evaluate how the use of spelt wheat flour fortified with dried lingonberry powder in the preparation of cookies, muffins, and brioches with different types of dough can improve their nutritional, functional, and sensory properties, and the degree to which the rheological properties of the dough are affected. The results of the proximate composition analysis revealed that the use of fortified flour in the pastries matrix led to a significant increase in mineral content by an average of 9% and a reduction in protein content up to 7% progressively with the concentration of fruit powder in fortified flour, relative to control samples. The phytochemical profile of pastry products led to a statistically significant enhancement by using fortified flour in their manufacturing formula, with results showing increases of 10 times in total flavonoids content, 9.3 times in total phenolic content, up to 2 times in DPPH (1,1-diphenyl-2-picrylhydrazyl) radical inhibition ability, and for FRAP (ferric-reducing antioxidant power), with values of 14.8 times relative to the control in cookies. The rheological behavior highlighted that the mixing of lingonberry powder with spelt flour is suitable for dough prepared with liquid in order to form gluten up to 15% of fruit addition. The best rated from a sensory point of view were muffins prepared from flour fortified with 10% lingonberry powder. The data resulted from this research suggest that the inclusion of lingonberry powder in spelt wheat flour consists of a promising solution to develop innovative pastry products with improved functional properties.
1. Introduction
Lingonberry (Vaccinium vitis-idaea L.) is a wild dwarf perennial shrub, spreading over large areas mainly in northern Eurasia, but also in North America [1,2]. In the Scandinavian peninsula countries, lingonberries valorized in food products are considered valuable in terms of their content of bioactive compounds such as antioxidants and vitamins [2]. Lingonberries are predominantly wild, but there are also some small-scale cultivated varieties [3]. In Romania, lingonberry grows in the high areas of the Carpathian Mountains, especially in Transylvania, at altitudes above 1300 m. Consumption of lingonberries is most often linked to the prevention of pathologies such as cancer, [4,5], cardiovascular diseases [6], and diabetes [7] attributed to their high content of bioactive compounds, including lignans, vitamins C, polyphenols, inositol, tocopherols, fatty acids, glycerophospholipids, triacylglycerols, and phytosterols [8]. Vaccinum vitis-idaea fruits have considerable fiber content among pectin, lignin, cellulose, and cuticular polymers [9]. Lingonberries intake has been shown to prevent obesity caused by poor diet and diabetes-related inflammation, aging of the brain, and the onset of neurodegenerative diseases [10]. The antioxidant activity of the above–mentioned bioactive compounds also indicates that lingonberries have significant antibacterial, anti-inflammatory, and antiallergic properties, as well as anti-thrombotic actions [11,12]. In the human diet, lingonberries are consumed both fresh and processed by various methods such as freezing and preserving in the form of jams, jellies, compotes, juices, or syrup, as well as alcoholic drinks. They are also used fresh or candied as decorative elements in confectionery products [13,14,15]. Another method of processing lingonberry is hot-air drying or convective drying [16]. They also have a fairly high sugar content, but the sweetness is diminished by the acidity of the fruit [14]. The use of natural, nutritionally valuable raw materials including lingonberries in food processing is a major current issue [15]. Bakery products are one of the most consumed and appreciated foods worldwide, and for this reason, this industrial sector is in a continuous process of global development and innovation. In this context, identifying viable and valuable solutions for the development of functional flour products enriched in nutrients from natural sources such as vitamins, minerals, fiber, and antioxidants beneficial to human health is one of the main concerns of producers in this field [17,18]. The use of dried fruit powder in the processing of cereal products is an optimal solution to improve their nutritional quality with health benefits for consumers and is increasingly approached by processors in the field [18,19]. Along with increasing nutritional value, adding dried fruit to pastry batters has the effect of improving the physical, chemical, sensorial aspects, and microbiological properties of finished products [20]. Fruits are an important source of dietary fiber, which is considered responsible for enhancing some physical characteristics of various flour products including bread, pasta, and cakes, such as volume, firmness, softness, and elasticity due to their high capacity to retain water and fat [21,22]. In the bakery industry, both insoluble and soluble fruit fibers are used to improve the technological and rheological properties of doughs used as gelling agents, texture enhancers, water binders, and fat substitutes [23]. Moreover, the use of fibers in flour products has the effect of increasing their attractiveness due to the favorable effect on sensory attributes such as appearance, taste, and color [24]. Due to their richness in nutrients, the consumption of functional foods made with fruit and vegetable powder has the ability to prevent some diseases such as cardiovascular diseases, cancers, ulcers, or diabetes [25]. Among the most commonly used fruit powders in the preparation of pastries are apple, quince, orange, various berries, grape pomace, mango, peach, melon [20], strawberry, black currant, raspberry, and sour cherry [26], but mostly the by-products resulting from their processing are used, which are ground after prior drying. Fruit powders are used mainly in cakes, muffins, biscuits, and pasta formulas [20,21,22,23,24,25,26]. Spelt flour is highly appreciated and has become more and more accessible in the processing of bakery products due to both its superior nutritional qualities and remarkable baking properties [27]. Spelt flour benefits from all the nutrients necessary for a balanced human diet, including carbohydrates, proteins (with an optimal profile in essential amino acids), and fats (with a valuable fatty acid content), as well as considerable amounts of vitamins and minerals [28]. In view of the insufficient information in the literature studied on the use of a mixture of spelt flour and dehydrated lingonberries in the formulation of some pastry products, the present study aimed to design and evaluate, in terms of sensory, proximate composition, and antioxidant properties, some muffins, cookies, and brioches prepared from spelt flour, which was replaced with lingonberry powder in the proportion of 5%, 10%, 15%, 20%, and 25%. Another direction addressed in the study was to identify how mixing spelt flour with powdered lingonberries affects the rheological behavior of bakery dough. In our opinion, the data obtained from our study are relevant for producers in the bakery industry in terms of developing innovative products with improved nutritional properties through the use of spelt flour and lingonberry powder in the preparation of pastries. The added value of our study lies in proposing a direction for the valorization of spelt flour and lingonberry fruits processed by drying at moderate temperature in order to obtain a powder with biochemical and microbiological stability.
2. Materials and Methods
2.1. Preparation of Fortified Flours
The whole wheat spelt flour used in this study was purchased from a local producer in western Romania (SC TERRA NATURA, 63, Dorobantilor Street, SAD 3, 300309, Timisoara, Timis County, Romania). Lingonberries were acquired frozen from a Romanian producer (SC Royal German Fisch, 4, Industriei Street, 545600 Tarnaveni, Mures County, Romania). After prior thawing at room temperature, the lingonberries were dried in a multi-layer food dehydrator (Model Fruit Dryer frutty 12 from Inderst GmbH, Marlengo, Italy), at 60 °C for 16 h, to preserve the bioactive compounds of fruits. Dried lingonberries were then ground using a freestanding spice grinder with a tilt with 20 L capacity and a speed of 1200 rpm (Model G20 from Yazicilar Kitpro Machinery Manufacturing, İzmir, Turkey) until they were transformed into a fine powder passed through a 0.150 mm mesh sieve.
The obtained powder was incorporated in spelt wheat flour in the following proportions: 5% lingonberry powder + 95% spelt wheat flour (SFLP5), 10% lingonberry powder + 90% spelt wheat flour (SFLP10), 15% lingonberry powder + 85% spelt wheat flour (SFLP15), 20% lingonberry powder + 80% spelt wheat flour (SFLP20), as well as 25% lingonberry powder + 75% spelt wheat flour (SFL25). After preparation, the fortified flours were packed in paper bags and were stored at room temperature, in the dark, until used in the preparation of pastries.
2.2. Preparation of Pastry Products
Five types of brioches (B) with fortified flour from leavened dough were made according to the recipes shown in Table 1, as follows: brioches with 95% spelt flour and 5% lingonberry powder (BSFLP5), brioches with 90% spelt flour and 10% lingonberry powder (BSFLP10), brioches with 85% spelt flour and 15% lingonberry powder (BSFLP15), brioches with 80% spelt flour and 20% lingonberry powder (BSFLP20), and brioches with 75% spelt flour and 25% lingonberry powder (BSFLP25), as well as brioches from spelt flour (BSF) used as a control. Cookies (C) from the soft dough, by recipes presented in Table 1: cookies with 95% spelt flour and 5% lingonberry powder (CSFLP5), cookies with 90% spelt flour and 10% lingonberry powder (CSFLP10), cookies with 85% spelt flour and 15% lingonberry powder (CSFLP15), cookies with 80% spelt flour and 20% lingonberry powder (CSFLP20), and cookies with 75% spelt flour and 25% lingonberry powder (CSFLP25), as well as cookies from spelt flour (CSF) used as a control were prepared. The fortified flours were also used to prepare muffins (M) from sponge cake dough: muffins with 95% spelt flour and 5% lingonberry powder (MSFLP5), muffins with 90% spelt flour and 10% lingonberry powder (MSFLP10), muffins with 85% spelt flour and 15% lingonberry powder (MSFLP15), muffins with 80% spelt flour and 20% lingonberry powder (MSFLP20) and muffins with 75% spelt flour and 25% lingonberry powder (MSFLP25), and muffins brioches from spelt flour (MSF) used as a control according to the recipes listed in Table 1. Sugar, milk with 3.5% fat, butter (82%), eggs, baking powder, lemon peel, iodized salt, and compressed Saccharomyces cerevisiae yeast were purchased from a local supermarket. Before the investigation of proximate composition and phytochemical characteristics, the pastry products were packed in polythene bags to preserve freshness and kept at room temperature (20 °C) for 3 days. Sensory analysis was performed the day after the sample preparation.

Table 1.
The recipes for brioches, cookies, and muffins from spelt wheat flour fortified with dehydrated lingonberry powder.
2.3. The Technological Process of Obtaining the Pastry Products from Spelt Flour Fortified with Lingonberry Powder
The technological process and technical operating parameters of pastry products are carried out according to steps from chart-flow presented in Figure 1: (a) of cookies, (b) of muffins, and (c) of brioches. The doughs were prepared using a Maxima Spiral Mixer, MSM 10, and then were cooked in an FM pastry oven, which is electric and has 10 trays and touch screen control panel in compliance with the technological parameters shown in Figure 1 for each pastry product category.
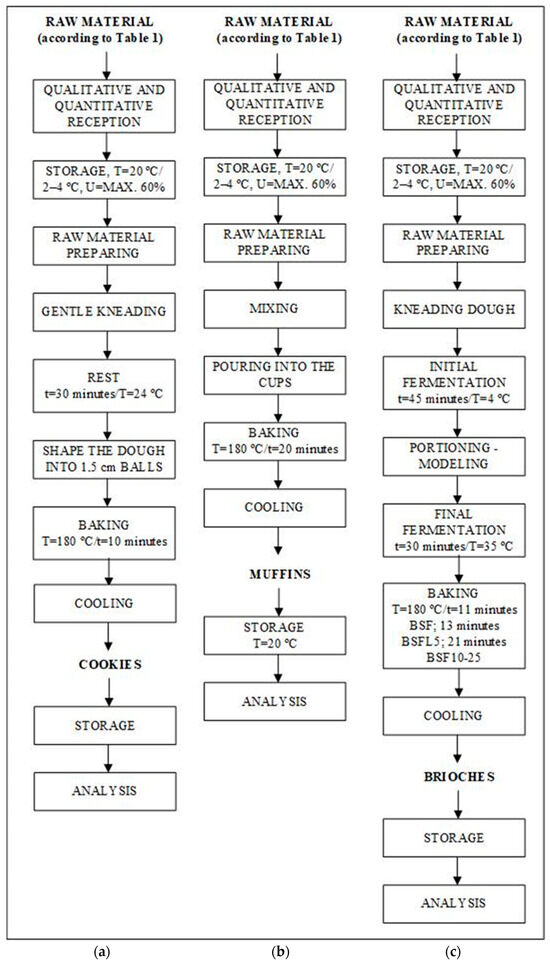
Figure 1.
Chart-flow of pastry products: (a) of cookies, (b) of muffins, and (c) of brioches.
2.4. Determination of Proximate Composition and Energetical Values of Flours and Pastry Products
The proximate composition analysis was carried out using the methods ISO Methods: SR 91/2007 pct.10 for moisture; SR 91:2007 pct.14.4 for lipid; SR EN ISO 8968-1:2014 for protein; STAS 90-2007, pct. 20 for sugar; and SR ISO 2171/2010 [29] in case of ash. The carbohydrate content (%) was calculated as the difference between 100 and the sum of moisture, lipids, proteins, and ash. The energy values of the samples were calculated as the sum of the values determined for macronutrients multiplied by their caloric coefficients, as follows: 1 g lipids = 9 kcal, 1 g carbohydrates = 4 kcal, and 1 g protein = 4 kcal.
2.5. Phytochemical Characteristics of Fortified Flour and Pastry Products
2.5.1. Preparation for the Alcoholic Extract
To 1 g of each sample weighed and placed in tubes with lids, 10 mL of 70% ethanol (SC CHIMREACTIV SRL, Bucharest, Romania) was added. After fixing the lid, the tubes were shaken for 30 min in a Holt mechanical shaker (IDL, Freising, Germany), and then the extracts were filtered through Whatman filter paper.
2.5.2. Determination of Total Phenolic Content (TPC)
The total phenolic content (TPC) of spelt flour (SF), lingonberry powder (LP), fortified flours and cookies, muffins, and brioches (Table 1) was evaluated using the Folin-Ciocâlteu method [30]. Before starting the analysis, the alcohol extracts were diluted with distilled water in the following ratios: 1:5 (v/v) for SF, 1:100 (v/v) for LP, 1:10 (v/v) for fortified flours, and 1:5 (v/v) for pastry products. Over 0.5 mL of each filtered extract was added to 2.5 mL Folin-Ciocâlteu reagent (Sigma-Aldrich Chemie GmbH, Munich, Germany) aqueous solution (distilled water) 1:10 (v/v). After keeping the mixture at room temperature for 5 min, 2 mL Na2CO3 7.5% (w/v) aqueous solution (Geyer GmbH, Renningen, Germany) was added in each sample, and the extracts were placed into a thermostat (INB500, Memmert GmbH, Schwabach, Germany) for 2 h at 25 °C. The absorbance was then measured at 750 nm using the Specord 205 spectrophotometer (Analytik Jena AG, Jena, Germany) against the blank, which was also prepared under conditions similar to the samples. The results were expressed in mg gallic acid equivalent (GAE) per 100 g of samples with all determinations being carried out in triplicate. Standard gallic acid solutions (Fluka, Madrid, Spain) with a concentration between 10 and 100 mg GAE/L were used to establish the calibration curve. TPC was expressed as mg gallic acid equivalents (GAE)/g [31].
2.5.3. Assessment of Antioxidant Capacity Using DPPH (1,1-Diphenyl-2-picrylhydrazyl) Radical Scavenging Activity Assay
The antioxidant activity of spelt flour, lingonberry powder, fortified flours, cookies, muffins, and brioches (Table 1) was determined by the method described by Ciulca et al., 2021 [32]. Before starting the analysis, the alcohol extracts were diluted with distilled water as follows: 1:10 (v/v) for SF, fortified flours, and pastry products, and 1:200 (v/v) for LP. Over 1 mL extract from each sample was added to 2.5 mL ethanolic solution of DPPH (1,1-diphenyl-2-picrylhydrazyl); 0.03 mM (Sigma-Aldrich, Taufkirchen, Germany) 70% (v/v) and the mixture was then homogenized on holt plate stirrer (IDL, Freising, Germany). Further, the mixtures were maintained for 30 min at room temperature in the dark. After incubation, the absorbance of samples was read at 518 nm using a UV-VIS Specord 205 spectrophotometer (Analytik Jena AG, Jena, Germany) versus a 70% (v/v) ethanol solution. Three readings were taken for each sample. The percentage of inhibition of DPPH was calculated using the Equation (1):
where AC and AS represent absorbance values corresponding to the control and the investigated samples, respectively. All experimental analyses were performed in triplicate.
2.5.4. Evaluation of Total Antioxidant Capacity by the Ferric-Reducing Antioxidant Power Assay (FRAP)
The antioxidant activity of SF, LP, fortified flours, cookies, muffins, and brioches (Table 1) was determined using the ferric-reducing antioxidant power (FRAP) method proposed by Benzie and Strain [33]. The method consists of the investigation of the antioxidant capacity of compounds from samples to reduce Fe3+ from the Fe3+-2,4,6-tris(2-pyridyl)-1,3,5-triazine (TPTZ) complex to the Fe2+ form in a sodium acetate buffer solution, pH 3.6, incubated at 37 °C for 30 min. Before starting the analysis, the alcohol extracts were diluted with distilled water in the following ratios: 1:5 (v/v) for SF, 1:150 (v/v) for LP, 1:10 (v/v) for fortified flours, and 1:5 (v/v) for pastry products. To perform experimental determinations over 0.5 mL of each extract from the investigated sample (SF, LP, fortified flours, and pastry products prepared according to recipes from Table 1 and technology listed in Figure 1), 2.5 mL of FRAP reagent was added. Then, the samples were controlled by a thermostat at 37 °C for 30 min. After incubation, the absorbance of extracts was measured relative to a control solution prepared in similar conditions at 595 nm. The calibration curve was plotted with a standard solution of Fe2+ with concentrations between 0.05 and 0.4 µM Fe2+/mL. The absorbance was registered using a Specord 205 UV-VIS spectrophotometer (Analytik Jena Inc., Jena, Germany). The FRAP value of the investigated sample was performed in triplicate and was expressed as µM Fe2+ equivalents/g.
2.5.5. Determination of Total Flavonoids Content (TFC)
The amount of total flavonoids of SF, LP, fortified flours, and pastry products was measured using a modified version of the procedure described by Cocan et al. (2022) [34]. Thus, 1 mL was taken from each extract to which 4 mL of distilled water and 0.3 mL of 5% NaNO2 solution were added. After a 6-min rest at room temperature, 0.3 mL of 10% AlCl3 was added to each sample, and a further 6-min rest was allowed to stand at room temperature. Finally, 2 mL of 4% NaOH solution was added and made up to 10 mL with 70% ethanol. After 15 min of standing at room temperature, the absorbance of the mixture was read relative to a control solution containing 70% ethanol using a UV-VIS spectrophotometer (Specord 205; Analytik Jena AG, Jena, Germany). All measurements were carried out in triplicate, and the results were expressed in mg QUE/100 g. The calibration curve was performed using quercetin in the concentration range of 0.5–50 µg/mL.
2.6. Rheological Behavior of Dough Using the Mixolab Assay
The samples subjected to the Mixolab assay were SF used as control, SFLP5, SFLP10, SFLP15, SFLP20, and SFL25. The performance and quality of hydrated cereal flours in baking are evaluated using the Mixolab, which is dough testing equipment. It is used to describe the rheological behavior and pasting characteristics of starch-and flour-water mixes when they are combined with heat transfer (temperature changes). There are five different phases of the Mixolab curve or graph: phase I, initial mixing, and dough formation; Phase II, weakening, evaluation of gluten weakening as a function of torque reduction and decrease in dough consistency (C2); Phase III, evaluation of starch gelatinization (C3); Phase IV, stability during baking (C4); Gel stability minimum consistency during baking; Phase V, retrogradation, cooling (C5). Evaluation of starch retrogradation is correlated to bread staling [35].
2.7. Sensory Evaluation of Pastry Products
Sensory evaluation of cookies, muffins, and brioches with fortified flours was conducted as described by ISO 4121:2002 [36], by a team of 22 evaluators (males and females), with ages between 19–55, non-smokers, without known cases of food allergies. The sensory analysis of the products followed laboratory ethical guidelines and written informed consent was obtained from each evaluator in conformity with the European Union guidelines on Ethics and Food-Related Research [37]. The control samples (MSF, CSF, and BSF) consisting of muffins, cookies, and brioche obtained from spelt flour were also evaluated together with the other samples: muffins (MSFLP5, MSFLP10, MSFLP15, MSFLP20, and MSFLP25); cookies (CSFLP5, CSFLP10, CSFLP15, and CSFLP20, and CSFLP25); brioches (BSFLP5, BSFLP10, BSFLP15, BSFLP20, and BSFLP25). The samples were served in a random order, under normal illumination, at room temperature, on cardboard plates with two-digit character encoding. Evaluators were asked to evaluate the sensory attributes (appearance, odor/aroma, texture/porosity, taste/chewing behavior, and overall acceptability) using a 5-point hedonic scale [38], with the following rates: 1 = strongly disliked; 2 = disliked; 3 = neither like nor dislike; 4 = like moderately; 5 = like very much. Still water was used to rinse the mouth between samples during the evaluation [39].
2.8. Statistical Analysis
All determinations were performed in triplicate and results are reported as mean values ± standard deviation (SD). Differences between means were analyzed by multiple comparisons t-test (with two samples assuming equal variances) using Microsoft Excel 365 software (Version 2208, Redmond, WA, USA). Values at p < 0.05 differences were considered significant.
3. Results and Discussion
3.1. The Proximate Composition of SF, LP, Fortified Flour, and Pastry Products
Table 2 illustrates the proximate composition of the SF, LP, and fortified flours, and Table 3 lists the proximate compositions of pastry products (cookies, muffins, and brioches).
Table 2.
Proximate composition (w/w) of the SF, LP, and fortified flours.
Table 3.
Proximate composition (w/w) of the pastry products.
As shown in Table 2, there are significant differences in moisture, mineral, protein, and sugar contents between SF and LP, which are reflected in the proximate composition of fortified flours and pastry products. The moisture content of LP was 2.5 times lower than SF, and this is reflected in a decreasing trend in the humidity level of the fortified flour, which changes progressively to the amount of fruit powder added. The moisture content of the fortified flour samples did not differ significantly from each other or from SF. In the case of the pastry products, the proportion in which LP was incorporated in the fortified flours had a significant influence on the moisture content of products both in the same category and between the different categories of pastry products (Table 3). Within the same assortment, the increase in moisture with increasing LP content could be attributed to the higher water-holding capacity of the fiber from fruits [40]. The moisture content was listed for brioches on average three times higher than that for cookies, which registered the lowest humidity (Table 3). The significant differences in humidity between different categories of pastry products are both a cause of the non-use of a liquid ingredient in the formulations of cookies and muffins compared to brioches in which milk has been included in the recipe under the same baking temperature: T = 180 °C. In addition, the intermediary water content of the muffins is explained by the use of a higher amount of eggs in the recipe compared to cookies. The high content of minerals in LP (2.71 g/100 g) compared to SF (1.60 g/100 g) has a significant influence on the mineral content of both fortified flours and pastry products, increasing with the amount of LP incorporated in the SF. For fortified flours, the values recorded were in the range of 1.63–1.91 g/100 g, and for pastry products, the values recorded were 1.84–1.97 g/100 g for cookies, 0.96–1.03 g/100 g for muffins, and 2.21–2.36 g/100 g for brioches. This high mineral content of lingonberries recommends LP as a functional matrix in pastry products. The significant difference in protein content between the raw materials used (14.81 g/100 g for SF and 8.51 g/100 g for LP) is also reflected in the protein content of fortified flours and pastry products, decreasing progressively with the amount of LP incorporated up to 11.8% SFLP25. The protein content of the pastry products is also influenced by the protein intake of the other ingredients added to the recipes (Table 1). The decrease in the protein content of pastries is due to the lower protein content of milk, eggs, and butter compared to that of fortified flours. Thus, the protein content of cookies decreases due to increasing LP content by up to 7% in CSFLP25 compared with CSF, up to 4.3% in MSFLP25 against the MSF, and by up to 6.7% in BSFLP25 compared with BSF. Lipids also showed a decrease progressively to the amount of LP used in the composition of the fortified flours, which can be attributed to the lower lipid content of LP (2.44 g/100 g) compared to SF (3.85 g/100 g). The significantly higher fat content of pastry products was influenced by the lipid intake of the components in their manufacturing formulas and is determined by the quantities of butter, eggs, and milk used (Table 1). Carbohydrate content was higher in LP (81.96 g/100 g) compared to SF (68.49 g/100 g), which contributed to the higher carbohydrate content in fortified flours but also in pastry products as the proportion of LP increased, with registered values within 60.63–60.82 g/100 g for cookies, 52.94–53.07 g/100 g for muffins and 53.08–53.32 g/100 g for brioches. Sugar content was also significantly influenced by the incorporation of LP in fortified flours but also in pastry products, due to 46.81 g/100 g sugar content in LP compared to 0.58 g/100 g identified in SF. Consequently, the sugar values of fortified flours increased up to four times in SFLP25. The sugar content of pastry products was also significantly influenced by the quantity of sugar used in their recipe. Therefore, the sugar content of cookies increased to 4.5% in CSFLP25 compared to CSF, up to 1.5% for MSFLP25 against MSF, and 11.8% in BSFLP25 compared with BSF. The energy value of the pastry products was also influenced by the amount of LP in the composition. Thus, the addition of LP led to an increase in the energy value of fortified flours from 368.74 kcal/100 g of SFLP5 to 371.74 kcal/100 g of SFLP25. The highest energy value was calculated for cookies, followed by muffins, and the lowest energy intake was registered for brioches (Table 3). The obtained results are correlated with the amount of butter used at their processing.
The values registered in the present study are in accordance with the values reported in various studies from the literature. Thus, Kulathunga et al. (2021) reported, for spelt wheat flour, a content of 8.9% moisture, 2.1% ash, 15.2% protein, and 1.6% fat [41]. Biel et al. (2021) reported a content of 9.3 g/100 g moisture, 12.80 g/100 g protein, and 1.86 g/100 g mineral substances [42]. For lingonberry powder, Jurevičiūtė et al. (2022) reported a content of 3.41 g/100 g moisture, 1.18 g/100 g minerals, 8.60 g/100 g protein, and 9.83 g/100 g lipids [43]. Morina (2002) reported a similar trend of increasing mineral content with an increasing proportion of fruit waste powder in baked products, with values ranging from 0.65–1.57% [44].
Uchoa et al. (2009) studied the effect of fruit powder supplementation on the physicochemical properties of biscuits-type cookies, reporting a moisture content between 4.1–4.9 g/100 g, which was influenced by the proportion of fruit powder added. The protein content decreased with an increasing proportion of fruit powder, and the lipid content decreased, similar to the values recorded in our study [45]. Reis et al. (2018) studied the effect of supplementing cake and bread with orange passion fruit peel flour and reported an increase in moisture content following the addition of orange passion fruit peel flour up to 41.31 g/100 g for the supplemented sample, and in the case of bread, the moisture content decreased up to 28.41 g/100 g for the supplemented sample. The protein content increased in the case of cakes with orange passion fruit peel flours up to 6.56 g/100 g and in the case of bread, with orange passion fruit peel flour up to 7.65 g/100 g. For both types of samples studied, the lipid content decreased due to the addition of orange passion fruit peel flour up to 7.46 g/100 g in the supplemented cakes sample and up to 2.05 g/100 g. The mineral content increased significantly due to the addition of orange passion fruit peel flour, up to 2.47 g/100 g for the supplemented cake sample and up to 3.54 g/100 g in the sample supplemented with orange passion fruit peel flour. The carbohydrate content as in our study decreased due to the addition of orange passion fruit peel flour, and the reported values were 42.20 g/100 g for the cake supplemented with orange passion fruit peel flour and 58.35 g/100 g for the bread in which the orange passion fruit peel flour was added [46]. Okoye and Obi studied the nutrient composition and sensory properties of wheat-African bread fruit composite flour cookies. In this study, similar to the trend recorded in our study, the content of moisture, protein, lipids, and mineral substances increased proportionally with the increase in the proportion of bread fruit flour added, and the values recorded in this case ranged from 8.60–9.44 g/100 g for moisture, 9.84–13.08 g/100 g for protein, 3.86–5.66 g/100 g lipids, and 4.82–5.24 g/100 g for mineral substances. The carbohydrate content decreased as the proportion of bread fruit flour decreased in the cookie composition, with values ranging from 67.76–72.84 g/100 g [47].
3.2. Phytochemical Characteristics of Fortified Flours and Pastry Products
3.2.1. Total Phenolic Content (TPC) of Fortified Flours and Pastry Products
The total phenolic content (TPC) of SF, LP, and fortified flours is shown in Figure 2, and the TPC for pastry product samples is shown in Figure 3 and is expressed as mg GAE/100 g.
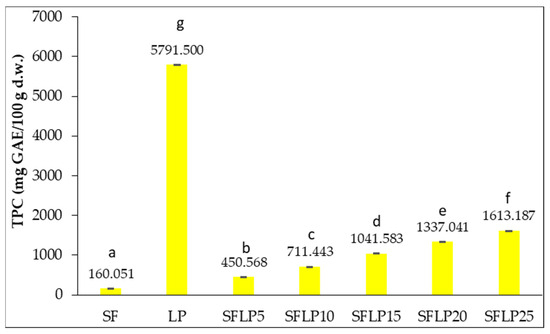
Figure 2.
Total polyphenolic content (TPC) of SF, LP, and fortified flours. Results are expressed as the mean value of three determinations ± standard deviation (SD) indicated by the error bars. According to the t-test, different letters (a–g) represented in the columns are significant differences (p < 0.05) between the values of the samples.
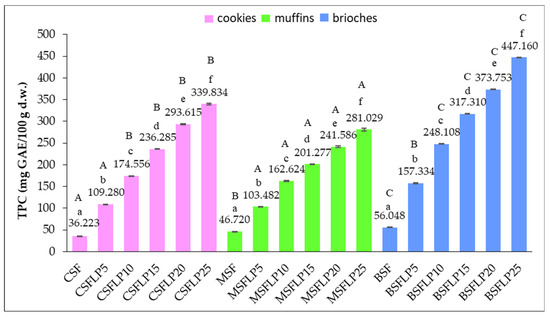
Figure 3.
Total polyphenolic content (TPC) of the pastry products. Results are expressed as the mean value of three determinations ± standard deviation (SD) indicated by the error bars. According to the t-test, different letters (a–f) represent significant differences (p < 0.05) between the values of samples from the same category. Different capital letters (A–C) represent significant differences between the values of samples containing premix with the same proportion of CSF and LP.
The data plotted in Figure 2 reveal that the total polyphenols content found in lingonberry powder (5791.500 mg GAE/100 g) is 39 times higher than that determined in spelt flour (160.051 mg GAE/100 g), and it can be attributed to the considerably high level of phenolic compounds of fruits. Consequently, the incorporation of LP into SF resulted in a statistically significant increase in the level of phenolic compounds in fortified flour samples progressively with the percentage of fruit powder mixed into the spelt flour from 2.8 times in SFLP5 to 10.2 times in SFLP25 against SF. The TPC level of fortified flours was in the range of 450.568 mg GAE/100 g–1613.187 mg GAE/100 g. Lacko-Bartošová et al. found that whole spelt flour has a considerably higher polyphenols content of 343.8 µg FAE/g DM compared with the values determined in the present study [48]. In another study, results with values in the range of 38.7 ± 1.3 mg GAE/g DM and 40.4 ± 0.7 mg GAE/g DM were reported by Ivaniseva for bread flour [49]. Related to lingonberry powder, our results are consistent with those reported by Dróżdż et al., which averaged 566 mg of GA/100 g fresh weight [13]. In addition, Piłat et al., in a study regarding the effect of lyophilization on the transformations of phenolic compounds in lingonberry, reported a total phenolic content in lyophilized fruit of 2428.81 GAE mg/100 g dry weight, which is lower than that determined by us in thermally dehydrated lingonberries [50]. Nilova et al. indicated a polyphenols level in fresh lingonberry fruit of 425.5 ± 14.5 mg GAE/100 g fresh fruit, which means 2263.29 mg GAE/100 g dry weight, which is close to that reported by Pilat et al. [51].
The analysis of the data represented in Figure 3 indicates that the TPC of pastry products revealed the same trend as fortified flours. Thus, the increasing level of LP incorporated in SF led to a statistically significant increase in TPC in pastries belonging to the same category progressively with the amount of fruit powder added. It should be noted that the content of phenolic compounds in pastry products was lower than that of fortified flours, and this may be a consequence of both the application of heat treatment during the baking process and the proportion in which LP was used in the manufacturing formula.
Within the same assortment, the lowest total polyphenolic content was registered for samples that contained 5% LP, and the highest level of phenol compounds was detected in pastries with 25% LP. Hence, in the case of cookies, the TPC ranged from 109.280 mg GAE/100 g in CSFLP5 to 339.834 mg GAE/100 g in CSFLP25, with an increase of 3 times in CSFLP5 against the control (CSF) and of 9.3 times in case of CSFLP25 compared to the CSF. Regarding the muffins, the lowest polyphenolic content was indicated in MSFLP5 (103.482 mg GAE/100 g), 2.2 times higher than MSF (control), and the highest TPC level was registered for MSFLP25 (281.029 mg GAE/100 g), 6 times higher related to the control. The same trend of TPC was revealed by brioches, wherein the polyphenolic content increased from 157.334 mg GAE/100 g in BSFLP5 to 447.160 mg GAE/100 g in BSFLP25. The inclusion of fortified flours in the manufacturing formula of brioches led to an improvement in their phenolic compound content from 2.8 times in the case of BSFLP5 to 7.8 times in BSFLP25.
Statistically significant differences were also noted between different categories of pastry prepared from the same type of fortified flours. Apart from the control samples, for all other pastry samples, the values obtained for TPC increased in the following order: MSFLP < CSFLP < BSFLP.
The values recorded for the three pastry categories analyzed are consistent with data reported in the literature. A similar trend was reported by Morina and Shehaj in their study on the supplementation of cookies with pomegranate rind powder in the proportion of 8,16, 23, 31, and 39%, with the total polyphenolic content increasing progressively with the proportion of pomegranate rind powder added, and with the obtained values falling within the range 294.67–2180.59 mg GAE/100 g [44]. Najjar et al. also recorded similar trends in a study in which they substituted flour with date seed powder, in proportions of 2.5%, 5%, and 7.5%. They also reported an increase in total polyphenol content with the proportion of date seed powder incorporated [52]. Özcan et al. in their research concerned the comparison of the bioactive compounds of cookies prepared from wheat flour and mahaleb seed powders indicating total polyphenol amounts up to 46.07 ± 1.67 mg GAE/100 g [53].
3.2.2. Total Flavonoids Content (TFC) of Fortified Flours and Pastry Products
The TFC results for spelt wheat, lingonberry powder, fortified flours, and pastry products obtained from them are shown in Figure 4 and Figure 5, respectively, and are expressed in quercetin equivalent (QUE).
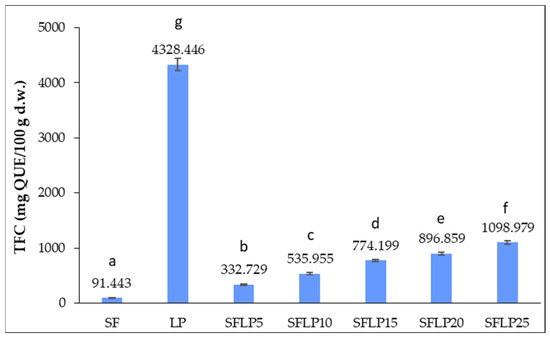
Figure 4.
Total flavonoid content (TFC) of SF, LP, and fortified flours. Results are expressed as the mean value of three determinations ± standard deviation (SD) indicated by the error bars. According to the t-test, different letters (a–g) represented in the columns are significant differences (p < 0.05) between the values of the samples.
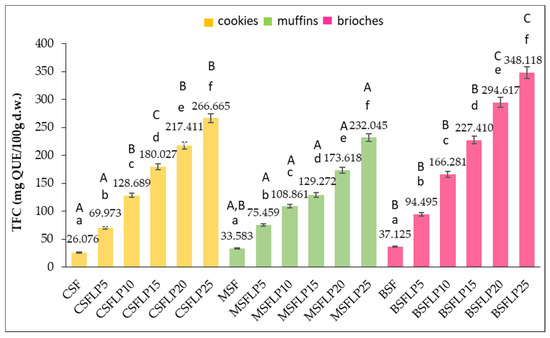
Figure 5.
Total flavonoid content (TFC) of the pastry products. Results are expressed as the mean value of three determinations ± standard deviation (SD) indicated by the error bars. According to the t-test, different letters (a–f) represent significant differences (p < 0.05) between the values of samples from the same category. Different capital letters (A–C) represent significant differences between the values of samples containing premix with the same proportion of CSF and LP.
By analyzing the results obtained, it can be seen that LP has a rich flavonoid content (4328.446 mg QUE/100 g) compared to SF (91.443 mg QUE/100 g). Thus, it is also justified the increase of TFC in fortified flours, progressively with the proportion of LP incorporated in spelt flour. In the case of fortified flours, the TFC content increased from 3.65 times in SFLP5 (332.729 mg QUE/100 g) to 12.25 times in SFLP25 (1098.979 mg QUE/100 g). As a result of the statistical analysis carried out for spelt flour, lingonberry powder, and fortified flours, there were significant differences between all samples, due to the 50 times higher flavonoid content of LP compared to SF. The recorded values are in agreement with the values reported by Ivanišová et al. in their study on the antioxidant activity of different milling fractions of selected cereals, whereas for spelt wheat flour, values between 0.33–1.55 mg QUE/g (sau 33–155 mg QUE/100 g) were reported [49]. Slightly lower TFC values for LP were reported by Dróżdż et al. in their study on the evaluation of bioactive compounds, minerals, and antioxidant activity of lingonberry, namely between 1.12–1.79 µg RE/100 g [13]. Vyas, et al. reported in their study on chemical analysis of lingonberry fruits a flavonoid content of 29 mg CE/g [54]. Nilova et al. reported a content of 371.2 mg RE/100 g fresh fruit for fresh lingonberry fruit [49].
The same linearity recorded for fortified flours was also recorded for samples of cookies, muffins, and brioches made thereof; thus, the TFC content increased with increasing levels of LP in the fortified flours composition. By analyzing the results obtained, it can be seen that for the cookie samples, the TFC values ranged from 26.076–266.665 mg QUE/100 g, for the muffins from 33.583–232.045 mg QUE/100 g, and for the brioches from 37.125–348.118 mg QUE/100 g). Thus, the use of fortified flours in the pastry products led to an increase in TFC values from 2.7 times in CSFLP5 to 10 times in CSFLP 25 relative to CSF, from 2.2 times in MSFLP5 to 3.7 times in MSFLP25 compared with MSF, and from 2.5 times in BSFLP to 9.2 times in BSFLP25. With the exception of the control samples, for all other samples, the values recorded for TFC increased in the following order: MSFLP < CSFLP < BSFLP. Statistically significant differences were analyzed between samples belonging to the same categories (cookies, muffins, and brioches) but also between different categories obtained from the same type of fortified flours. Thus, within all three product categories, there were significant differences between samples according to the t-test. With regard to the statistical analysis of the samples belonging to the different categories, it was found that with the exception of the control samples, for all other samples containing the same type of fortified flours, there were significant differences. In addition, when inspecting the TFC values, it can be seen that the cookies, muffins, and brioches samples had a lower TFC content than the fortified flours, and this can be attributed to the heat treatment and also to the quantity of fortified flours used in the pastry product formulation. As shown in Figure 5, a similarity is observed between the TFC values of the brioches and cookies, in which a similar amount of fortified flour was used in the recipe, of about 50% in relation to the whole quantity of raw materials (Table 1). As far as the muffin samples are concerned, fortified flour was included in a proportion of only 30% of the total amount of raw materials, and this may be an explanation for the lower TFC values obtained than in the case of cookies and brioches.
The values recorded for the three product categories analyzed are consistent with data reported in the literature. Thus, a similar trend was also reported by Morina and Shehaj in their study on the supplementation of cookies with pomegranate rind powder in the proportion of 8,16, 23, 31, and 39%, with the flavonoid content increasing in proportion to the pomegranate rind powder content, the value range being between 21.46 and 1088.11 mg CE/100 g [44]. Najjar et al. also recorded similar trends in their study, in which they substituted flour with date seed powder, in proportions of 2.5%, 5%, and 7.5% the flavonoid content increasing with the proportion of date seed powder [52]. In another study, Hussain et al. replaced white wheat flour with different proportions (0, 5, 10, and 15%) of pumpkin peel, flesh, and seeds powders in the biscuit recipe. Furthermore, in this case, the flavonoid content increased in the proportion of pumpkin powder added, with the highest flavonoid content (60.74 mg CE/100 g) being identified in the biscuits with the higher level of pumpkin powder added [55]. In addition, Sumczynski et al. in their study regarding total phenolics, flavonoids, antioxidant activity, crude fiber, and digestibility in non-traditional wheat flakes and muesli, reported a flavonoid content of 372.6 6 ±13.2 mg RE/kg for flakes from spelt wheat flour and 532.3 ± 1.23 mg RE/kg in case of muffins made from spelt flour [56]. The registered results showed that the total flavonoid content (TFC) increased with increasing LP content in both fortified flours and pastry product samples.
3.2.3. Antioxidant Capacity of Spelt Flour, Lingonberry Powder, Fortified Flours, and Pastry Products Using DPPH Assay
The antioxidant capacity was assessed by two methods, 1,1-diphenyl-2-picrylhydrazyl (DPPH) and radical scavenging activity ferric-reducing antioxidant power (FRAP) assay. The obtained results expressed as the percent inhibition of DPPH are shown in Table 4.
Table 4.
DPPH inhibition (%) of spelt flour, lingonberry powder, fortified flour, and pastry products.
The data from Table 4 highlight the significantly higher DPPH radical inhibition capacity of lingonberry powder compared to spelt wheat flour due to their abundance in polyphenols (including flavonoids, polyphenolic acids, anthocyanins, and procyanidins) and vitamins (A, B, and C) [11,13,48]. Hence, at a dilution of 1:2000, LP extract recorded a value 90% higher than that determined for SF, and this had a direct influence on the fortified flours. The percentage inhibition of DPPH radicals increased progressively with the percentage of LP incorporated in SF and fell within the range of 72.054 ± 0.239% in SPFL5 to 85.979 ± 0.079% in SPFL25. Plustea et al. reported a capacity of DPPH inhibition for wheat flour of 52.980 ± 0.245%, which is higher than those obtained by us and values within 70.403–82.369% for composite flours in which wheat flours were mixed in the proportion of 10, 20, and 30%, respectively, with lupin flour [57]. The results obtained for LP are consistent with those reported by Raba et al., i.e., 81.94 ± 0.762%. The same study was reported for premixes, in which spelt flour was mixed with dried lingonberries flour in a ratio of 75:25, a DPPH value of 43.47 ± 0.667%, which is much lower than those obtained in the present research [58]. In another study, Fatrcova-Śramkova et al. found a 55.60% DPPH antiradical activity in spelt wheat, which is higher than the values that we found [59].
In the case of pastry products, statistically significant differences were obtained not only within the same product category but also between different product categories. In the case of cookies, the % DPPH inhibition was from 29.741 ± 0.044% in the control (CSF) and up to 63.601 ± 0.120% in CSFLP25. As can be seen from Table 4, the inclusion of LP in SF resulted in a linear increase in DPPH radical scavenging capacity of cookie samples with the proportion of LP added to the value obtained for CSFLP25 being two times higher than the CSF control. This fact can be explained by the significantly higher capacity of DPPF inhibition of fruit powder due to its abundance in bioactive compounds such as flavonoids, polyphenols, and vitamins. The same profile of % DPPH was registered for muffin samples. Thereby, the use of fortified flours in the manufacturing formula of muffins led to the improvement of the DPPH radical scavenging capacity of MSFLP25 by 63% compared to MSF. Concerning brioches, their DPPH radical inhibition percentage indicated the same trend as for muffins and cookies (Table 4). Thus, the lowest value was determined in the case of BSF (47.707 ± 0.037%) and the highest for BSFLP25 (79.730 ± 0.046%), by 68% higher compared to brioche used as a control. According to the statistical analysis, there were significant differences between DPPH radical inhibition percentage between fortified flours and pastry products, and this can be attributed to the backing process at high temperature resulting in a decrease in the antioxidant activity of pastries. In addition, taking into consideration that it was applied the same thermal regime (Figure 1a–c) for all pastry products, the significant differences between DPPH values of cookies, muffins, and brioches can be explained by different ratios in which fortified flours and the other ingredients were used in pastries formulation. Among products belonging to different categories, for the same type of fortified flour used, the antioxidant activity expressed as percentage inhibition of DPPH radicals increased in the order of cookies < muffins < brioches.
In the other study related to the use of vegetable powder in bakery product preparation, Plustea et al. reported DPPH inhibition values in the range of 35.499–54.978% when using composite flour from wheat and lupin in the percentage of lupin added between 10 and 30% in bread processing [57]. According to Sturza et al. (2016), the percentage of free inhibited DPPH radicals in pastry products increased up to 73.52 ± 0.63% when 4% sea buckthorn flour was used in the preparation of gingerbread and up to 17.86 ± 0.61% when 4% sea buckthorn flour was included in sponge cake formula [60]. Ghendov-Mosanu et al. (2020) reported in their study that the use of 5% sea buckthorn flour led to an increase in the antioxidant activity of the samples to 20.05 ± 0.51% [61]. On the other hand, Muresan et al. (2019) reported that the biscuits prepared with sea buckthorn powder dehydrated for 12 h at 50 °C displayed an antioxidant activity of 88.97 ± 0.82%, and biscuits prepared with powder dehydrated for 5 h at 80 °C registered an antioxidant activity of 89.14 ± 0.27% [62].
3.2.4. Total Antioxidant Capacity of Spelt Flour, Lingonberry Powder, Fortified Flours, and Pastry Products by the Ferric-Reducing Antioxidant Power Assay (FRAP)
The results on FRAP values corresponding to the SF, LP, and fortified flour are shown in Figure 6 and those relating to pastry products in Figure 7.
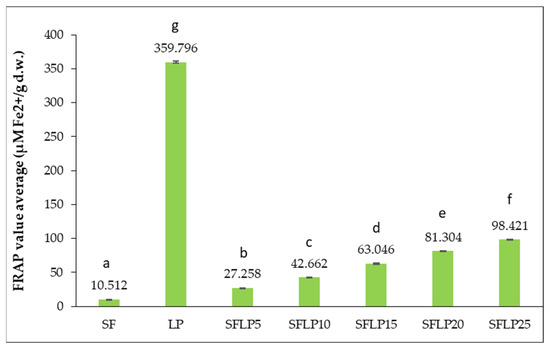
Figure 6.
Ferric reducing antioxidant power (FRAP) of SF, LP, and fortified flours. Results are expressed as the mean value of three determinations ± standard deviation (SD) indicated by the error bars. According to the t-test, different letters (a–g) represented in the columns are significant differences (p < 0.05) between the values of the samples.
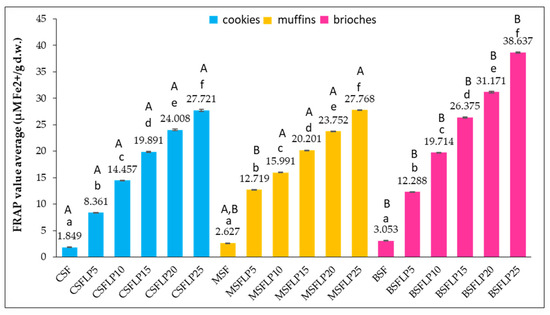
Figure 7.
Ferric-reducing antioxidant power (FRAP) of pastry products. Results are expressed as the mean value of three determinations ± standard deviation (SD) indicated by the error bars. According to the t-test, different letters (a–f) represent significant differences (p < 0.05) between the values of samples from the same category. Different capital letters (A,B) represent significant differences between the values of samples containing premix with the same proportion of CSF and LP.
Similar to the TPC and TFC profile and correlated with the DPPH values, the antioxidant activity expressed as FRAP values of the LP was significantly higher (37 times) than SP, and this is due to the abundance in bioactive compounds with antioxidant properties of lingonberries [11,13,48]. Consequently, the incorporation of lingonberry powder in spelt flour led to an increase in FRAP values of fortified flours progressively with the percentage of LP added up to above 10 times in SFLP25. The FRAP values of fortified flours were within 27.258 µM Fe2+/g (SFLP5), 63% higher compared to SF and 98.421 µM Fe2+/g (SFLP25), 3.6 times higher relative to the SF.
The results obtained for spelt flour in our study are consistent with those reported by Wang et al., i.e., 2.2 ± 0.3 µM Fe2+/g for white spelt flour and 7.4 ± 0.3 µM Fe2+/g for spelt whole-grain [63]. In another research, Yilmaz et al. found that FRAP antioxidant activity in whole spelt flour has values between 2.3 and 3.0 mmol TE/kg DM when extracted in solvents such as BuOH, MeOH:HCl, and MeOH:acetone:H2O [64]. Georgieva-Krasteva et al. reported similar results of FRAP values, 1.93 ± 0.15 mM TE/g DW for spelt grain extracted in glycerin [65]. Related to lingonberries, Vilkickytė and Raudonė reported in their study an FRAP value in powder of crude dry extracts of lingonberry of 5404.8 μM TE/g DW [66], higher than those found by us. Urbonaviciene et al. found a firing reducing power of lingonberries of 41.4 μmol TE/g FW (meaning about 345 μmol TE/g DW), which is close to those found in our study [67]. In addition, Boyanova et al. reported that for lingonberry extract, an FRAP has a value of 1989.0 ± 6.7 mM TE/100 g DM [68]. Mahloko et al. reported FRAP values of composite flours from wheat mixed in the proportion of 4% with banana and prickly pear flour up to 0.71 ± 0.01 mg/g [69]. In another study, Suryanto et al. reported that composite flour from a mixture of banana, corn, and sago flour at various levels has an antioxidant activity expressed as FRAP values up to 325 μmol TE/100 g [70].
The same linearity registered in the case of fortified flours was recorded for pastry product samples prepared by them (Figure 7). Hence, the incorporation of LP in SF had an effect on the increasing antioxidant activity expressed as FRAP value progressively with the fruit powder levels in the fortified flour composition. Analysis of the data from Figure 7 denotes that within the same assortment, there were statistically significant differences between FRAP values of samples with different percentages of incorporated LP and the control. Thus, the FRAP values of cookie samples with fortified flours ranged from 8.361–27.721 µM Fe2+/g, for the muffins from 12.719–27.768 µM Fe2+/g, and from 12.288 µM Fe2+/g to 38.637 µM Fe2+/g in case of the brioches. It can be observed that the use of fortified flours in the pastry manufacturing formula led to an increase in antioxidant activities expressed as FRAP values from 4.5 times in CSFLP5 to 14.8 times in CSFLP25 relative to CSF, from 4.8 times in MSFLP5 to above 10 times in MSFLP25 compared with MSF, and from 4 times in BSFLP to 12.42 times in BSFLP25. Between pastry products belonging to different assortments, it was observed that the lowest increase in the FRAP value in the sample prepared with fortified flour was indicated in the case of CSFLP (8.361µM Fe2+/g) and the highest increase in the FRAP value for BSFLP25 (38.637 µM Fe2+/g) related to the control CSF and BSF, respectively. For all pastry samples, the FRAP values increased in the following order: MSFLP < CSFLP < BSFLP.
Najjar et al. reported FRAP values from 25.62 µgTE/g to 151.45 µgTE/g for composite cookies when whole wheat flour was substituted with date seed powder between 2.5%, 5%, and 7.5% [52]. In another research that concerned the possibility of using grapefruit peel powder in cake to enhance its antioxidant properties, Ukom et al. found similar FRAP values of 20.56 ± 0.02 µM Fe2+/g when 2.5% grapefruit peel powder was added, 25.07 ± 0.04 µM Fe2+/g at 3.7% fruits powder added and 29.66 ± 0.03 µM Fe2+/g at 5% grapefruit peel powder added [71]. These results are in line with those registered in our study. In addition, Tolve et al. reported in a study in which wheat flour was substituted with grape pomace powder, with FRAP values consistent with those found in our research: 795.26 ± 63.11 μM TE/100 g DM (7.95 μM TE/g) at 5% substitution and 1577.39 ± 87.20 μM TE/100 g DM (15.77 μM TE/g) at 10% substitution [72].
As TPC and TFC profiles, the DPPH and FRAP increased in all pastry products made from fortified flours compared to the pastry control samples progressively with the amount of lingonberry powder incorporated. In addition, this parameter listed higher values of fortified flours against pastries prepared by them and is supported on the one hand by the application of heat treatment in the preparation of products and on the other hand by their inclusion in different quantities in pastries manufacturing formulas together with the other components, which in turn contribute to the value of the parameters mentioned.
3.3. Rheological Behaviour of Fortified Flours Using the Mixolab Assay
Using the Mixolab “Chopin+” protocol can study the mechanical changes following mixing and heating, simulating mechanical work, and the heat conditions that could be expected during the baking process. The determined primary parameters are listed in Table 5.
Table 5.
The primary parameters of the spelt flour and fortified flours.
When the ingredients are mixed for the first time, the material is evenly distributed, the initial spherical protein particles break down, and the flour is hydrated. This leads to the formation of a three-dimensional viscoelastic structure with gas-retaining properties, in which polymeric proteins are the main component [73]. The torque of all evaluated samples started at the optimal value of the dough consistency of 1.106 Nm (SFLP20)–1.125 Nm (SFLP10), and in individual indicative parameters (C1, C2, C3, C4, and C5), it changed depending on the percentage of lingonberry powder used. At point C1, the dough proved to be able to resist deformation for a certain period of time, which determines the stability of the dough [74]. In fortified flours, except for the SFLP5 sample, the C2 value was higher than in the control sample, meaning that the lingonberry powder strengthens the protein network of the dough. The level of protein strengthening depended on the amount of lingonberry powder added. The most stable protein network was found with lower additions, 10% lingonberry powder (SFLP10). In the samples SFLP20 and SFLP25, the protein network was increased by up to 29.2% and 29.6%, respectively, in comparison to the control sample, which is a considerable increase. The higher C2 value means the lower thermal stability. Thus, we observed lower values of C2 for the fortified flours with 5% and 15% lingonberry powder (SFLP5 and SFLP15), which can be considered the most suitable in terms of the thermal stability of the protein network.
Similar results were highlighted by Bojnanská et al., who reported that the most stable protein network was found in the case of lower additions (5%) of legumes in composite flours [75].
During the heating stage, doughs containing legume flours showed different pasting properties (C3 value) in comparison to the wheat spelt dough, but we cannot generalize their influence (Table 1). In this stage (C3), the starch granules absorb the water available in the medium and swell, and the amylose chains leach out into the aqueous intergranular phase promoting an increase in the viscosity and thus a higher torque of 0.869 Nm (SFLP10)–1.622 Nm (SFLP5). Similar results were registered by Lacko-Bartošová et al., pointing out a maximum value of torque in the C3 stage of 1.62 Nm, indicating higher starch gelatinization temperature and higher dough viscosity [76]. These processes continue until mechanical shear stress and temperature limitation lead to the physical disintegration of the particles, generating a decrease in viscosity [73]. In terms of baking stability (C4), consistency decreases as a result of amylolytic activity, with higher torque values recorded for SFLP5 (1047 Nm) and SFLP15 (1028 Nm) (Table 1). The C5 phase (retrogradation and cooling) of all fortified flour samples indicates lower amylolytic activities.
The obtained results indicate that the substitution of spelt flour with lingonberry powder is best suited to the preparation of pastry doughs that include a percentage in the recipe up to 10–15%. Above this value, the stability of doughs decreases, they are harder to process, and the products will lack volume and have a less attractive appearance.
Considering all the rheological parameters analyzed with the help of the Mixolab system, we can conclude that from the point of view of dough processability, the addition of 10–15% lingonberry powder leads to obtaining bakery products with optimal qualities.
3.4. Sensory Evaluation of Pastry Products
Sensory evaluation of the pastry products was carried out in order to assess consumer acceptance and preferences, and the results are depicted in Figure 8 (a–muffins, b–cookies, c–brioches). Sensory evaluation of the muffins, cookies, and brioche with fortified flours was carried out in order to assess consumer acceptance and preferences. The analysis was performed by comparing consumer preferences for products containing fortified flours with those of control products.
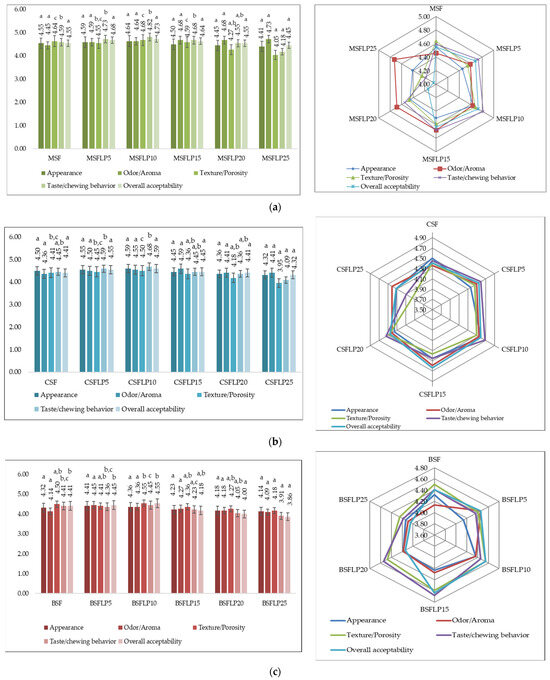
Figure 8.
(a) Sensorial analysis of pastry products using 5-point hedonic scale (n = 22) of muffins. The results are expressed as the mean value of the scores obtained from the analysis of the products by the 22 evaluators ± the standard deviation (SD) indicated by the error bars. According to the t-test, different letters (a–c) represent significant differences (p < 0.05) between the values of samples in the same category for the characteristics evaluated. (b) Sensorial analysis of pastry products using 5-point hedonic scale (n = 22) of cookies. The results are expressed as the mean value of the scores obtained from the analysis of the products by the 22 evaluators ± the standard deviation (SD) indicated by the error bars. According to the t-test, different letters (a–c) represent significant differences (p < 0.05) between the values of samples in the same category for the characteristics evaluated. (c) Sensorial analysis of pastry products using ta 5-point hedonic scale (n = 22) of brioches. The results are expressed as the mean value of the scores obtained from the analysis of the products by the 22 evaluators ± the standard deviation (SD) indicated by the error bars. According to the t-test, different letters (a–c) represent significant differences (p < 0.05) between the values of samples in the same category for the characteristics evaluated.
Figure 8a–c indicates the mean scores for the sensory attributes (appearance, texture/porosity, taste/chewing behavior, odor/aroma, and overall acceptability) of the studied pastry products and emphasizes the influence of the addition of different proportions of lingonberries in obtaining spelt pastry products on their sensory characteristics. The highest scores were recorded in muffin samples, especially MSFLP10 samples (10% lingonberries powder) concerning the attributes: appearance (4.636), taste/chewing behavior (4.818), texture/porosity (4.682) and overall acceptability (4.727), while the lowest values were those of MSFLP25 (25% lingonberries powder) recording 4.409 points in appearance, 4.245 points in texture/porosity, 4.182 in taste/chewing behavior, and 4.045 points for overall acceptability (Figure 8a). Among studied pastries, brioches with fortified flours were less appreciated by consumers registering, in terms of overall acceptability, values between 3.8636 (BSFLP25) and 4.5455 (BSFLP10) (Figure 8c). After muffins, cookies were preferred by consumers registering values between 4.4091 (CSF) and 4.5909 (CSFLP10) to overall acceptability. In terms of the most appreciated proportion of lingonberries added, the 10% of LP added in the formula was the most appreciated in terms of taste, aroma, and overall acceptability of all products.
Similar studies regarding the sensory evaluation of bakery products with lingonberry and spelt flour have been carried out by Lončar et al. and Mildner-Szkudlarz et al. [77,78].
Following the sensory evaluation that reflects the consumer preferences, it can be pointed out that the addition of LP in pastry product formula significantly influenced the appearance, taste/chewing behavior, texture/porosity, odor/aroma, and overall acceptability of bakery products, especially muffins being highly appreciated by panelists.
4. Conclusions
The results presented in this study support the fact that in terms of proximate composition, phytochemical and sensory characteristics of the fortifying spelt wheat flour with lingonberry powder can be addressed as a viable perspective for the development of innovative bakery products. The use of fortified spelt flour with lingonberry powder enhanced the nutritional profile of all three pastry products relative to control samples, especially in terms of mineral and sugar content with the highest increases registered for biscuits. On the other hand, the functional characteristics of pastry products were significantly increased with LP incorporation, with the highest increase being registered for CSFL25 in the case of TFC up to 10 times, TPC up to 9.3, DPPH radical inhibition capacity up to 2 times relative to the control, and up to 14.8 times for FRAP values. The rheological behavior suggests that the incorporation of LP in SF does not affect the quality of dough with liquid in composition up to 15%. In terms of technological properties, biscuits, and cookie doughs performed best, including 25% LP fortified flours. The most appreciated category of pastries prepared with fortified flour was muffins with 10% LP incorporated in SF. The incorporation of LP had a positive influence on the sensory attributes of all three pastry products prepared with SFLP 10%, with the highest scores being recorded for muffins. Overall, the results of our research led to the idea that the incorporation of lingonberry powder into spelt flour up to 10% is a viable solution for improving the nutritional properties, phytochemical profile, and sensory characteristics of bakery products without depreciating the technological properties of pastry doughs.
Author Contributions
Conceptualization, D.-N.R. and I.C.; methodology, D.-N.R., M.-A.P., E.A., I.R., I.C. and M.N.; software, D.-N.R., I.C., M.N., C.D. and G.S.; formal analysis, D.-N.R., M.-A.P., E.A., I.C., M.N., G.S. and C.D.M.; investigation, D.-N.R., M.-A.P., E.A., I.R., I.C., M.N., G.S. and C.D.; resources, I.R. and G.S.; data curation, D.-N.R., C.D., M.N., I.C. and G.S.; writing—original draft preparation, D.-N.R., M.-A.P., E.A., I.R., I.C., M.N., C.D.M., C.D. and G.S.; writing—review and editing, D.-N.R. and I.C.; supervision, M.-A.P. and I.R. All authors have read and agreed to the published version of the manuscript.
Funding
This research is funded by the Ministry of Research, Innovation and Digitization from Romania within the project entitled: “Increasing the impact of excellence research on the capacity for innovation and technology transfer within USAMVB Timisoara”, code 6PFE, submitted in the competition Program 1—Development of the national system of research—development, Subprogram 1.2—Institutional performance, Institutional development projects—Development projects of excellence in R.D.I. and through the West Regional Development Agency, Romania, by the Project “Achieving technology transfer to obtain innovative functional foods enriched in bioactive compounds—CTTU 2020”, SMIS Code: 140030, submitted in the competition Regional Operational Program 2014–2020, Priority Axis 1: Promoting technology transfer.
Institutional Review Board Statement
The study was carried out in compliance with the Declaration of Helsinki and approved by the Bioethics Committee of the University of Life Sciences “King Michael I”, Timisoara, Aradului Street No 119, 300645 Timisoara, Romania (No 206/04 April 2023); Project Code: POR/2020/1/1.1.A./2/140030.
Informed Consent Statement
Informed consent was obtained for from all subjects involved in the study.
Data Availability Statement
The analysis reports corresponding to the samples analyzed and presented in the paper can be provided by the Interdisciplinary Research Platform (PCI) at the University of Life Sciences “King Michael I”, Timisoara.
Acknowledgments
The authors of this research expresses its gratitude for the support provided by the Interdisciplinary Research Platform at the University of Life Sciences “King Michael I”, Timisoara, where the analyses were carried out.
Conflicts of Interest
The authors declare no conflict of interest. The funders have no role in the present study.
References
- Isaak, C.K.; Petkau, J.C.; Karmin, O.; Debnath, S.C.; Siow, Y.L. Manitoba Lingonberry (Vaccinium vitis-idaea) Bioactivities in Ischemia-Reperfusion Injury. J. Agric. Food Chem. 2015, 63, 5660–5669. [Google Scholar] [CrossRef]
- Alam, Z.; Roncal, J.; Peña-Castillo, L. Genetic variation associated with healthy traits and environmental conditions in Vaccinium vitis-idaea. BMC Genom. 2018, 19, 4. [Google Scholar] [CrossRef]
- Mane, C.; Loonis, M.; Juhel, C.; Dufour, C.; Malien-Aubert, C. Food grade lingonberry extract: Polyphenolic composition and in vivo protective effect against oxidative stress. J. Agric. Food Chem. 2011, 59, 3330–3339. [Google Scholar] [CrossRef] [PubMed]
- Lippert, E.; Ruemmele, P.; Obermeier, F.; Goelder, S.; Kunst, C.; Rogler, G.; Dunger, N.; Messmann, H.; Hartmann, A.; Endlicher, E. Anthocyanins prevent colorectal cancer development in a mouse model. Digestion 2017, 95, 275–280. [Google Scholar] [CrossRef] [PubMed]
- Nguyen, V.; Tang, J.; Oroudjev, E.; Lee, C.J.; Marasigan, C.; Wilson, L.; Ayoub, G. Cytotoxic effects of bilberry extract on MCF7-GFP-tubulin breast cancer cells. J. Med. Food 2010, 13, 278–285. [Google Scholar] [CrossRef] [PubMed]
- Habanova, M.; Saraiva, J.A.; Haban, M.; Schwarzova, M.; Chlebo, P.; Predna, L.; Gažo, J.; Wyka, J. Intake of bilberries (Vaccinium myrtillus L.) reduced risk factors for cardiovascular disease by inducing favourable changes in lipoprotein profiles. Nutr. Res. 2016, 36, 1415–1422. [Google Scholar] [CrossRef]
- Asgary, S.; Rafieian Kopaei, M.; Sahebkar, A.; Shamsi, F.; Goli-Malekabadi, N. Anti-hyperglycemic and anti-hyperlipidemic effects of Vaccinium myrtillus fruit in experimentally induced diabetes (antidiabetic effect of Vaccinium myrtillus fruit). J. Sci. Food Agric. 2016, 96, 764–768. [Google Scholar] [CrossRef]
- Määttä-Riihinen, K.R.; Kamal-Eldin, A.; Mattila, P.H.; González Paramás, A.M.; Törrönen, A.R. Distribution and contents of phenolic compounds in eighteen Scandinavian berry species. J. Agric. Food Chem. 2004, 52, 4477–4486. [Google Scholar] [CrossRef]
- Antolak, H.; Czyzowska, A.; Sakač, M.; Mišan, A.; Duragič, O.; Kregiel, D. Phenolic compounds contained in little-known wild fruits as antiadhesive agents against the beverage-spoiling bacteria Asaia spp. Molecules 2017, 22, 1256. [Google Scholar] [CrossRef]
- Santhakumar, A.B.; Bulmer, A.C.; Singh, I. A review of the mechanisms and effectiveness of dietary polyphenols in reducing oxidative stress and thrombotic risk. J. Hum. Nutr. Diet. 2014, 27, 1–21. [Google Scholar] [CrossRef]
- Kowalska, K. Lingonberry (Vaccinium vitis-idaea L.) Fruit as a Source of Bioactive Compounds with Health-Promoting Effects-A Review. Int. J. Mol. Sci. 2021, 22, 5126. [Google Scholar] [CrossRef] [PubMed]
- Kallio, H.; Nieminen, R.; Tuomasjukka, S.; Hakala, M. Cutin composition of five Finnish berries. J. Agric. Food Chem. 2006, 54, 457–462. [Google Scholar] [CrossRef] [PubMed]
- Dróżdż, P.; Šėžienė, V.; Wójcik, J.; Pyrzyńska, K. Evaluation of Bioactive Compounds, Minerals and Antioxidant Activity of Lingonberry (Vaccinium vitis-idaea L.) Fruits. Molecules 2017, 23, 53. [Google Scholar] [CrossRef]
- Viljanen, K.; Heiniö, R.L.; Juvonen, R.; Kössö, T.; Puupponen-Pimiä, R. Relation of sensory perception with chemical composition of bioprocessed lingonberry. Food Chem. 2014, 157, 148–156. [Google Scholar] [CrossRef]
- Ozola, L.; Kampuse, S. The influence of drying method to the changes of bioactive compounds in lingonberry by-products. Agron. Res. 2018, 16, 1781–1795. [Google Scholar] [CrossRef]
- Karam, M.C.; Petit, J.; Zimmer, D.; Baudelaire Djantou, E.; Scher, J. Effects of drying and grinding in production of fruit and vegetable powders: A review. J. Food Eng. 2016, 188, 32–49. [Google Scholar] [CrossRef]
- Caleja, C.; Barros, L.; Antonio, A.L.; Oliveira, M.B.P.P.; Ferreira, I.C.F.R. A comparative study between natural and synthetic antioxidants: Evaluation of their performance after incorporation into biscuits. Food Chem. 2017, 2, 342–346. [Google Scholar] [CrossRef]
- Salehi, F. Recent applications of powdered fruits and vegetables as novel ingredients in biscuits: A review. Nutrire 2020, 45, 1. [Google Scholar] [CrossRef]
- Potter, R.; Stojceska, V.; Plunkett, A. The use of fruit powders in extruded snacks suitable for Children’s diets. LWT—Food Sci. Technol. 2013, 51, 537–544. [Google Scholar] [CrossRef]
- Salehia, F.; Aghajanzadeh, S. Effect of dried fruits and vegetables powder on cakes quality: A review. Trends Food Sci. Technol. 2020, 95, 162–172. [Google Scholar] [CrossRef]
- Elleuch, M.; Bedigian, D.; Roiseux, O.; Besbes, S.; Blecker, C.; Attia, H. Dietary fibre and fibre-rich by-products of food processing: Characterisation, technological functionality and commercial applications: A review. Food Chem. 2011, 124, 411–421. [Google Scholar] [CrossRef]
- Puvanenthiran, A.; Stevovitch-Rykner, C.; McCann, T.H.; Day, L. Synergistic effect of milk solids and carrot cell wall particles on the rheology and texture of yoghurt gels. Food Res. Int. 2014, 62, 701–708. [Google Scholar] [CrossRef]
- O’Shea, N.; Arendt, E.K.; Gallagher, E. Dietary fibre and phytochemical characteristics of fruit and vegetable by-products and their recent applications as novel ingredients in food products. Innov. Food Sci. Emerg. Technol. 2012, 16, 1–10. [Google Scholar] [CrossRef]
- Salehi, F. Quality, physicochemical, and textural properties of dairy products containing fruits and vegetables: A review. Food Sci. Nutr. 2021, 9, 4666–4686. [Google Scholar] [CrossRef] [PubMed]
- Sudha, M.L.; Dharmesh, S.M.; Pynam, H.; Bhimangoude, S.V.; Eipson, S.W.; Somasundaram, R. Antioxidant and cyto/DNA protective properties of apple pomace enriched bakery products. J. Food Sci. Technol. 2016, 53, 1909–1918. [Google Scholar] [CrossRef]
- Górnaś, P.; Juhņeviča-Radenkova, K.; Radenkovs, V.; Mišina, I.; Pugajeva, I.; Soliven, A.; Segliņa, D. The impact of different baking conditions on the stability of the extractable polyphenols in muffins enriched by strawberry, sour cherry, raspberry or black currant pomace. LWT—Food Sci. Technol. 2016, 65, 946–953. [Google Scholar] [CrossRef]
- Frakolaki, G.; Giannou, V.; Topakas, E.; Tzia, C. Chemical characterization and breadmaking potential of spelt versus wheat flour. J. Cereal Sci. 2018, 79, 50–56. [Google Scholar] [CrossRef]
- Wiwart, M.; Suchowilska, E.; Lajszner, W.; Graba, L. Identification of hybrids of spelt and wheat and their parental forms using shape and color descriptors. Comput. Electron. Agric. 2012, 83, 68–76. [Google Scholar] [CrossRef]
- ISO. ISO Methods: Moisture SR 91/2007 pct.10, protein SR EN ISO 8968-1:2014; Total Lipid SR 91:2007 pct.14.4; Mineral Substances SR ISO 2171/2010, Sugar SR ISO 91-2007. Available online: https://ipstesting.com/find-a-test/iso-test-methods/ (accessed on 20 January 2023).
- Obistioiu, D.; Cocan, I.; Tîrziu, E.; Herman, V.; Negrea, M.; Cucerzan, A.; Neacsu, A.-G.; Cozma, A.L.; Nichita, I.; Hulea, A.; et al. Phytochemical Profile and Microbiological Activity of Some Plants Belonging to the Fabaceae Family. Antibiotics 2021, 10, 662. [Google Scholar] [CrossRef]
- Singleton, V.L.; Orthofer, R.; Lamuela-Raventos, R.M. Analysis of total phenols and other oxidation substrates and antioxidants by means of Folin-Ciocalteu reagent. Meth. Enzymol. 1999, 299, 152–178. [Google Scholar] [CrossRef]
- Ciulca, S.; Roma, G.; Alexa, E.; Radulov, I.; Cocan, I.; Madosa, E.; Ciulca, A. Variation of Polyphenol Content and Antioxidant Activity in Some Bilberry (Vaccinium myrtillus L.) Populations from Romania. Agronomy 2021, 11, 2557. [Google Scholar] [CrossRef]
- Benzie, I.F.F.; Strain, L. Ferric reducing ability of plasma (FRAP) as a measure of antioxidant power: The FRAP assay. Anal. Biochem. 1996, 239, 70–76. [Google Scholar] [CrossRef]
- Cocan, I.; Cadariu, A.-I.; Negrea, M.; Alexa, E.; Obistioiu, D.; Radulov, I.; Poiana, M.-A. Investigating the Antioxidant Potential of Bell Pepper Processing By-Products for the Development of Value-Added Sausage Formulations. Appl. Sci. 2022, 12, 12421. [Google Scholar] [CrossRef]
- Bonet, A.; Blaszczak, W.; Rosell, C. Formation of Homopolymers and Heteropolymers Between Wheat Flour and Several Protein Sources by Transglutaminase-Catalyzed Cross-Linking. Cereal Chem. 2006, 83, 655–662. [Google Scholar] [CrossRef]
- ISO 4121:2002; Sensory analysis: Methodology: Evaluation of Food Product by Methods of Using Scales. International Organization for Standardization: Geneva, Switzerland, 2002.
- Alfonsi, A.; Coles, D.; Hasle, C.; Koppel, J.; Ladikas, M.; Schmucker von Koch, J.; Schroeder, D.; Sprumont, D.; Verbeke, W.; Zaruk, D. Guidance Note: Ethics and Food-Related Research; European Commission Ethics Review Sector: Brussels, Belgium, 2012. [Google Scholar]
- Scholtz, S.C.; Bosman, M.J.C. Consumer acceptance of high-fibre muffins and rusks baked with red palm olein. Int. J. Food Sci. Technol. 2005, 40, 857–866. [Google Scholar] [CrossRef]
- Kojić, J.; Belović, M.; Krulj, J.; Pezo, L.; Teslić, N.; Kojić, P.; Tukuljac, L.P.; Šeregelj, V.; Ilić, N. Textural, Color and Sensory Features of Spelt Wholegrain Snack Enriched with Betaine. Foods 2022, 11, 475. [Google Scholar] [CrossRef] [PubMed]
- Walker, R.; Tseng, A.; Cavender, G.; Ross, A.; Zhao, Y. Physicochemical, Nutritional, and Sensory Qualities of Wine Grape Pomace Fortified Baked Goods. J. Food Sci. 2014, 79, S1811–S1822. [Google Scholar] [CrossRef]
- Kulathunga, J.; Reuhs, B.L.; Zwinger, S.; Simsek, S. Comparative Study on Kernel Quality and Chemical Composition of Ancient and Modern Wheat Species: Einkorn, Emmer, Spelt and Hard Red Spring Wheat. Foods 2021, 10, 761. [Google Scholar] [CrossRef]
- Biel, W.; Jaroszewska, A.; Stankowski, S.; Sobolewska, M.; Kępińska-Pacelik, J. Comparison of yield, chemical composition and farinograph properties of common and ancient wheat grains. Eur. Food Res. Technol. 2021, 247, 1525–1538. [Google Scholar] [CrossRef]
- Jurevičiūtė, I.; Keršienė, M.; Bašinskienė, L.; Leskauskaitė, D.; Jasutienė, I. Characterization of Berry Pomace Powders as Dietary Fiber-Rich Food Ingredients with Functional Properties. Foods 2022, 11, 716. [Google Scholar] [CrossRef] [PubMed]
- Morina, A.; Shehaj, A. Physico-chemical parameters and antioxidant activity of baked product fortified with fruit waste powder. J. Biol. Studies. 2022, 5, 221–228. [Google Scholar]
- Uchoa, A.M.A.; Correia da Costa, J.M.; Maia, G.A.; Meira, T.R.; Sousa, P.H.M.; Montenegro Brasil, I. Formulation and physicochemical and sensorial evaluation of biscuit-type cookies supplemented with fruit powders. Plant Foods Hum. Nutr. 2009, 64, 153–159. [Google Scholar] [CrossRef]
- Reis, L.C.R.D.; Facco, E.M.P.; Salvador, M.; Flôres, S.H.; Rios, A.D.O. Characterization of orange passion fruit peel flour and its use as an ingredient in bakery products. J. Culin. Sci. Technol. 2020, 18, 214–230. [Google Scholar] [CrossRef]
- Okoye, J.I.; Obi, C.D. Nutrient composition and sensory properties of wheat-African bread fruit composite flour cookies. Sky J. Food Sci. 2017, 6, 027–032. [Google Scholar]
- Lacko-Bartosova, M.; Lacko-Bartošová, L.; Kobida, L. Phytoprotective compounds of non-traditional cereals. In Proceedings of the 18th Alps-Adria Scientific Workshop, Cattolica, Italy, 1–6 April 2019; pp. 22–23. [Google Scholar] [CrossRef]
- Ivanišová, E.; Ondrejovič, M.; Šilhár, S. Antioxidant activity of milling fractions of selected cereals. Nova Biotechnol. Chim. 2012, 11, 45–56. [Google Scholar] [CrossRef]
- Pilat, B.; Zadernowski, R.; Czaplicki, S.; Jez, M. Cold storage, freezing and lyophilisation and its effect on transformations of phenolic compounds in lingonberry (Vaccinium vitis-idaea L.). Pol. J. Nat. Sci. 2018, 33, 101–113. [Google Scholar]
- Nilova, L.; Malyutenkova, S.; Ikramov, R. A study of the chemical composition and antioxidant properties of products of wild berries processing. IOP Conf. Ser. Earth Environ. Sci. 2019, 337, 012025. [Google Scholar] [CrossRef]
- Najjar, Z.; Kizhakkayil, J.; Shakoor, H.; Platat, C.; Stathopoulos, C.; Ranasinghe, M. Antioxidant Potential of Cookies Formulated with Date Seed Powder. Foods 2022, 11, 448. [Google Scholar] [CrossRef]
- Özcan, M.M.; Kandil, M.; Yılmaz, H. Comparison of the bioactive compounds, phytochemicals, nutrients and sensory properties of cookies prepared using wheat flour and mahaleb seed powders. Food Humanit. 2023, 1, 482–488. [Google Scholar] [CrossRef]
- Vyas, P.; Kalidindi, S.; Chibrikova, L.; Igamberdiev, A.U.; Weber, J.T. Chemical analysis and effect of blueberry and lingonberry fruits and leaves against glutamate-mediated excitotoxicity. J. Agric. Food Chem. 2013, 61, 7769–7776. [Google Scholar] [CrossRef]
- Hussain, A.; Kausar, T.; Sehar, S.; Sarwar, A.; Ashraf, A.H.; Jamil, M.A.; Noreen, S.; Rafique, A.; Iftikhar, K.; Quddoos, M.Y. Determination of total phenolics, flavonoids, carotenoids, β-carotene and dpph free radical scavenging activity of biscuits developed with different replacement levels of pumpkin (Cucurbita maxima) peel, flesh and seeds powders. Turk. J. Agric.-Food Sci. Technol. 2022, 10, 1506–1514. [Google Scholar] [CrossRef]
- Sumczynski, D.; Bubelova, Z.; Sneyd, J.; Erb-Weber, S.; Mlcek, J. Total phenolics, flavonoids, antioxidant activity, crude fibre and digestibility in non-traditional wheat flakes and muesli. Food Chem. 2015, 174, 319–325. [Google Scholar] [CrossRef] [PubMed]
- Plustea, L.; Negrea, M.; Cocan, I.; Radulov, I.; Tulcan, C.; Berbecea, A.; Popescu, I.; Obistioiu, D.; Hotea, I.; Suster, G.; et al. Lupin (Lupinus spp.)-Fortified Bread: A Sustainable, Nutritionally, Functionally, and Technologically Valuable Solution for Bakery. Foods 2022, 11, 2067. [Google Scholar] [CrossRef] [PubMed]
- Raba, D.N.; Poiană, M.A.; Dumbravă, D.G.; Popa, M.V.; Mişcă, C.D. Influence of the addition of dehydrated lingonberries in spelt flour on its bakery properties, physicochemical characteristics, antioxidant and antimicrobial properties. Int. Multidiscip. Sci. GeoConference SGEM 2022, 22, 225–232. [Google Scholar] [CrossRef]
- Fatrcova-Śramkova, K.; Lacko-Bartośova, M.; Mariassyova, M. Bioproducts made from spelt wheat (Triticum spelta) and their antioxidant properties. J. Ecol. Health 2010, 14, 185–187. [Google Scholar]
- Sturza, R.A.; Ghendov-Mosanu, A.A.; Deseatnicov, O.I.; Suhodol, N.F. Use of sea buckthorn fruits in the pastry manufacturing. Sci. Study Res. Chem. Chem. Eng. Biotechnol. Food Ind. 2016, 17, 35–43. [Google Scholar]
- Ghendov-Mosanu, A.; Cristea, E.; Patras, A.; Sturza, R.; Padureanu, S.; Deseatnicova, O.; Turculet, N.; Boestean, O.; Niculaua, M. Potential Application of Hippophae Rhamnoides in Wheat Bread Production. Molecules 2020, 25, 1272. [Google Scholar] [CrossRef]
- Muresan, E.A.; Chis, S.; Cerbu, C.G.; Man, S.; Pop, A.; Marc, R.; Muresan, V.; Muste, S. Development and characterization of biscuits based on sea buckthorn and blueberries by-products. J. Agroaliment. Process. Technol. 2019, 25, 59–63. [Google Scholar]
- Wang, J.; Chatzidimitriou, E.; Wood, L.; Hasanalieva, G.; Markelou, E.; Iversen, P.O.; Seal, C.; Baranski, M.; Vigar, V.; Ernst, L.; et al. Effect of wheat species (Triticum aestivum vs. T. spelta), farming system (organic vs. conventional) and flour type (wholegrain vs. white) on composition of wheat flour—Results of a retail survey in the UK and Germany—2. Antioxidant activity, and phenolic and mineral content. Food Chem. X 2020, 6, 100091. [Google Scholar] [CrossRef]
- Yilmaz, V.A.; Brandolini, A.; Hidalgo, A. Phenolic acids and antioxidant activity of wild, feral and domesticated diploid wheats. J. Cereal Sci. 2015, 64, 168–175. [Google Scholar] [CrossRef]
- Georgieva-Krasteva, L.; Hristova, I.; Mihaylova, D.; Dobreva, K. Spelt (Triticum aestivum ssp. spelta)—From Field to Cosmetics. Int. J. Pharmacogn. Phytochem. Res. 2017, 9, 613–617. [Google Scholar] [CrossRef][Green Version]
- Vilkickytė, G.; Raudonė, L. Antiradical, Reducing, and Chelating Activities of Phenolic Fractions from Vaccinium vitis-idaea L. Fruits. In Proceedings of the Vital Nature Sign: 15th International scientific conference “The Vital Nature Sign”, Online, 20–21 May 2021; Vytautas Magnus University: Kaunas, Lithuania, 2021. Available online: https://hdl.handle.net/20.500.12512/111123 (accessed on 25 July 2023).
- Urbonaviciene, D.; Bobinaite, R.; Viskelis, P.; Viskelis, J.; Petruskevicius, A.; Puzeryte, V.; Cesoniene, L.; Daubaras, R.; Klavins, L.; Bobinas, C. Nutritional and Physicochemical Properties of Wild Lingonberry (Vaccinium vitis-idaea L.)—Effects of Geographic Origin. Molecules 2023, 28, 4589. [Google Scholar] [CrossRef]
- Boyanova, P.; Gradinarska, D.; Dobreva, V.; Ivanov, I.; Petkova, N. Effects of lingonberry extract (Vaccinium vitis-idaea L.) on the antioxidant, physicochemical and sensory characteristics of ice cream. BIO Web Conf. 2022, 45, 01008. [Google Scholar] [CrossRef]
- Mahloko, L.M.; Silungwe, H.; Mashau, M.E.; Kgatla, T.E. Bioactive compounds, antioxidant activity and physical characteristics of wheat-prickly pear and banana biscuits. Heliyon 2019, 5, e02479. [Google Scholar] [CrossRef] [PubMed]
- Suryanto, E.; Momuat, L.I.; Wehantouw, F. Phytochemical composition and antioxidant activity of composite flour from banana, corn and sago. Int. J. ChemTech Res. 2018, 11, 257–266. [Google Scholar] [CrossRef]
- Ukom, A.N.; Ezenwigbo, M.C.; Ugwuona, F.U. Grapefruit peel powder as a functional ingredient in cake production: Effect on the physicochemical properties, antioxidant activity and sensory acceptability of cakes during storage. Int. J. Gastron. Food Sci. 2022, 28, 100517. [Google Scholar] [CrossRef]
- Tolve, R.; Simonato, B.; Rainero, G.; Bianchi, F.; Rizzi, C.; Cervini, M.; Giuberti, G. Wheat Bread Fortification by Grape Pomace Powder: Nutritional, Technological, Antioxidant, and Sensory Properties. Foods 2021, 10, 75. [Google Scholar] [CrossRef] [PubMed]
- Rosell, C.M.; Collar, C.; Haros, M. Assessment of hydrocolloid effects on the thermo-mechanical properties of wheat using the Mixolab. Food Hydrocoll. 2007, 21, 452–462. [Google Scholar] [CrossRef]
- Rosell, C.M.; Santos, E.; Collar, C. Physical characterization of fiber-enriched bread doughs by dual mixing and temperature constraint using the Mixolab. Eur. Food Res. Technol. 2010, 231, 535–544. [Google Scholar] [CrossRef]
- Bojnanská, T.; Musilová, J.; Vollmannová, A. Effects of Adding Legume Flours on the Rheological and Breadmaking Properties of Dough. Foods 2021, 10, 1087. [Google Scholar] [CrossRef]
- Lacko-Bartošová, M.K.; Petr, K.; Lacko-Bartošová, L.; Štěrba, Z. Quality evaluation of emmer wheat genotypes based on rheological and Mixolab parameters. Czech J. Food Sci. 2019, 37, 192–198. [Google Scholar] [CrossRef]
- Lončar, B.; Pezo, L.; Filipović, V.; Nićetin, M.; Filipović, J.; Pezo, M.; Šuput, D.; Aćimović, M. Physico-Chemical, Textural and Sensory Evaluation of Spelt Muffins Supplemented with Apple Powder Enriched with Sugar Beet Molasses. Foods 2022, 11, 1750. [Google Scholar] [CrossRef] [PubMed]
- Mildner-Szkudlarz, S.; Bajerska, J.; Górnaś, P.; Segliņa, D.; Pilarska, A.; Jesionowski, T. Physical and Bioactive Properties of Muffins Enriched with Raspberry and Cranberry Pomace Powder: A Promising Application of Fruit By-Products Rich in Biocompounds. Plant Foods Hum. Nutr. 2016, 71, 165–173. [Google Scholar] [CrossRef] [PubMed]
Disclaimer/Publisher’s Note: The statements, opinions and data contained in all publications are solely those of the individual author(s) and contributor(s) and not of MDPI and/or the editor(s). MDPI and/or the editor(s) disclaim responsibility for any injury to people or property resulting from any ideas, methods, instructions or products referred to in the content. |
© 2023 by the authors. Licensee MDPI, Basel, Switzerland. This article is an open access article distributed under the terms and conditions of the Creative Commons Attribution (CC BY) license (https://creativecommons.org/licenses/by/4.0/).