Abstract
The root traits of many warm-season pasture species have not been characterised thoroughly. Depending on the nature of legume root architecture, alternative phosphorus (P) application strategies may improve the success of legume establishment and persistence, particularly if legumes exhibit a spatially responsive root system. The purpose of the present experiment was to investigate the root morphology of several warm-season pasture species and to determine the response of these species to a subsurface application of P fertiliser. Monocultures of two grasses (Panicum coloratum and Digitaria eriantha) and two legumes (Medicago sativa and Desmanthus spp.) were established in pots to investigate root morphology and P acquisition in response to three soil-P distribution treatments. The P fertiliser that was applied to the subsurface ‘band’ layer was labelled with 32P-radioisotope to determine P recovery. There were significant differences in shoot yield and root morphology among the species. The largest shoot yields were usually produced by plants grown in the uniform high-P treatment, while the grasses generally produced longer roots more efficiently than the legumes across the three soil-P distribution treatments. Nevertheless, each species responded to the banded high-P treatment by acquiring more P from the zone of P enrichment (banded high-P = 31% cf., uniform low-P = 3%, and uniform high-P = 9%). This result suggests that a subsurface application of P fertiliser at the planting stage will benefit warm-season pasture species, particularly grasses that are highly responsive to fertiliser placement. Nevertheless, preferential placement of fertiliser below legumes may improve the productivity of this component if their root systems have more time to respond spatially.
1. Introduction
Legumes are expected to improve the productivity of northern Australian grazing systems by facilitating nitrogen fixation and improving forage quality [1,2]. However, C4 grasses, such as Cenchrus ciliaris L. and Panicum spp., generally dominate mixed pasture swards [3,4] because tropical pasture legumes often lack persistence [5]. Poor legume persistence may occur due to the relatively high palatability of legumes, which results in preferential grazing of the legume component [6,7]. Alternatively, poor persistence may occur due to differences in growth rates between legumes and grasses, or because of varietal differences in root traits that influence nutrient-acquisition efficiency [8,9].
The acquisition of relatively immobile nutrients, such as phosphorus (P), is mainly determined by the root–soil interface developed by plants in P-deficient soil [10]. Consequently, differences in root traits often determine the P requirements of many plant species. For example, temperate pasture grasses produce relatively long, thin roots with long root hairs, whereas temperate pasture legumes produce relatively short, thick roots with short root hairs [9,11,12]. These differences mean that legumes often require higher soil P concentrations to maintain optimal productivity than grasses [13]. These differences in P-acquisition efficiency are well-defined for temperate pasture species, which has enabled improved nutrient management in the grazing systems of southern Australia. In contrast, the root traits and P requirements of many tropical pasture species are poorly understood, meaning that there is potential to improve nutrient management in the grazing systems of northern Australia.
Phosphorus is often distributed in a patchy manner in soil, meaning that plant roots must respond spatially to maximise P acquisition [14]. For example, root length proliferation (i.e., the initiation of new lateral roots) results in a highly localised response to heterogeneously distributed soil P and leads to greater exploitation of a P-enriched zone [14,15,16]. However, there are trade-offs in the development of root length because root elongation, in contrast to root proliferation, leads to greater soil exploration [17] and water acquisition from depth [18]. The optimal root foraging strategy of pasture species is likely to involve the acquisition of both nutrients and water [19], particularly in the nutrient-responsive soils of northern Australia that are seasonally dry.
Legume persistence and productivity may be improved by identifying root traits that confer better P-acquisition efficiency. There are likely to be varietal differences in P-acquisition among warm-season legumes. Indeed, differences in root morphological traits were observed among several Desmanthus spp. genotypes [20]. A greater understanding of these root traits may assist in the future selection of P-efficient legumes. Alternatively, improvements in legume productivity and persistence may be achieved by using P fertiliser placement strategies. Phosphorus fertiliser is not commonly applied in the extensive grazing systems of northern Australia, but there may be an opportunity to apply fertiliser in arable paddocks during pasture establishment [21]. Previous research has suggested that the P recovery of temperate pastures can be improved through a subsurface application of P fertiliser [22]. A similar response may occur in tropical pastures, which could lead to improved P-acquisition efficiency and pasture productivity. The objectives of the present study were to determine: (i) varietal differences in root morphology among several warm-season pasture species, and (ii) the response of these species in terms of root morphology and P acquisition to a subsurface application of P fertiliser.
2. Materials and Methods
2.1. Plant Material
Four warm-season pasture species were grown to investigate shoot and root growth in response to three soil-P distribution treatments. The pasture species were Bambatsi Panic (Panicum coloratum L.), Premier Digit (Digitaria eriantha Steud. cv. Premier), Haymaster Lucerne (Medicago sativa L. cv. Haymaster), and Progardes® Desmanthus (a mixture of five cultivars, JCU 1–5, comprising three Desmanthus species, D. bicornutus S. Watson, D. leptophyllus Kunth and D. virgatus (L.) Willd). These pasture species were selected because they are commonly grown in the mixed pastures of northern, inland New South Wales, Australia.
2.2. Plant Growth Conditions
A sandy soil (Grey Tenosol [23]) was gathered from the top 15 cm of a paddock in Armidale, NSW, Australia (30°26′21.4″ S 151°39′55.5″ E). This soil was used because it enables easy recovery of roots for analysis. The soil had a Colwell extractable P concentration of 5 mg P kg−1, a Phosphorus Buffering Index of 29, and a pH (1:5 w/v; 0.01 M CaCl2) of ~5.3 (see [24] for the various methods). The soil was sieved to 5 mm and a basal nutrient solution was applied to the soil that contained 150 mg kg−1 soil CH4N2O, 100 mg kg−1 K2SO4, 100 mg kg−1 MgSO4·7H2O, 0.4 mg kg−1 MnCl2·4H2O, 0.4 mg kg−1 CuCl2·2H2O, 0.4 mg kg−1 ZnCl2·2H2O, 0.4 mg kg−1 Na2MoO4, and 0.4 mg kg−1 H3BO3. Two P-amended soils (5 and 50 mg P kg−1) were prepared by adding Ca(H2PO4)2·H2O salt to the soil. The calcium that was applied in the 5 mg P kg−1 soil was balanced using a CaCl2·2H2O solution to be equivalent to that applied in the 50 mg P kg−1 soil. The Colwell extractable P concentrations of the amended 5 and 50 mg P kg−1 soils were 9 and 37 mg Colwell P kg−1, respectively.
The two amended soils were used to prepare three contrasting soil-P distribution treatments, as shown in the Supplementary Materials (Figure S1). The banded high-P treatment provided a concentrated, localised source of P that mimicked a shallow band of P fertiliser below the soil surface. The uniform low-P and high-P treatments were the negative and positive controls, respectively. The uniform low-P treatment included the addition of 5 mg P kg−1 soil throughout the profile because it was expected that the low Colwell extractable P concentration of the unamended soil (i.e., 5 mg P kg−1) would constrain plant growth substantially, particularly for the two legumes. The uniform high-P treatment included the addition of 50 mg P kg−1 soil throughout the profile because it was expected that this application rate would allow maximum plant growth. These soil-P distribution treatments were prepared in cylindrical PVC pots (87 mm internal diameter; 200 mm height) using three layers of soil: a ‘subsoil’ layer (780 g oven-dry soil; 123 mm soil height), a ‘band’ layer (125 g oven-dry soil; 20 mm soil height), and a ‘topsoil’ layer (295 g oven-dry soil; 47 mm soil height). The thickness of the soil layers was expected to allow the pasture species to respond to the applied P within the timeframe of the experiment. The soil that was used in the ‘band’ layer was labelled with ~10.5 MBq kg−1 of 32P-radioisotope tracer. The band layer was marked by placing Alkathene beads at the soil layer interfaces.
Monocultures of each pasture species were established by sowing seed to achieve a population of ~9 plants pot−1. The Progardes® Desmanthus seeds were immersed briefly in hot water prior to sowing to break seed dormancy [25]. Three replicate pots of each species in each soil-P distribution treatment were prepared. The pots were then watered and placed in a glasshouse (natural daylight, 30/20 °C) in Armidale, NSW, Australia. Plants were grown in July/August of 2019. The pots were watered daily so that soil moisture was maintained between 80 and 100% field capacity. An additional 150 mg kg−1 soil CH4N2O and 100 mg kg−1 K2SO4 were applied to each pot at the midpoint of the experiment.
2.3. Harvest and Analysis
Plants were harvested after six weeks of growth. Shoots were cut at the soil surface and oven-dried at 70 °C for 72 h and weighed. The soil from each pot was removed as an intact core and cut at the interfaces of the three soil layers. The roots were then washed from the soil over 2 mm sieves. Roots were washed from each section as a whole for scanning and drying. Root samples were scanned with an Epson Perfection V700 Photo flatbed scanner (Seiko Epson Corporation, Suwa, Japan) at 600 dpi. When a root sample was too large for scanning in one pass, a representative subsample was scanned while the remaining roots were dried. Root length and average root diameter were assessed using WinRHIZOTM software Version 2009c (Regent Instruments Inc., Quebec City, QC, Canada) [26]. Roots were then oven-dried at 70 °C for 72 h and weighed. Total root mass fraction was calculated as the mass of roots divided by total plant dry mass (i.e., the combined dry mass of shoots and roots). Root length densities were calculated as root length per unit soil volume. Soil volumes were 279, 119, and 731 cm3 in the topsoil, band, and subsoil layers, respectively.
Shoot samples were ground before a ~0.5 g subsample was pre-digested for at least 16 h in 1 mL deionised water and 4 mL 70% (v/v) nitric acid. These samples were then digested using a Milestone UltraWAVE 640 (Milestone Srl, Sorisole, Italy). The P concentration of the digested samples was determined using an Inductively Coupled Plasma-Optical Emission Spectrometer (ICP-OES) (Agilent, Mulgrave, Australia). Shoot P content was calculated by multiplying shoot P concentration and shoot dry mass. Digested shoot samples were also analysed for 32P-radioisotope activity using a PerkinElmer Tri-Carb 2810TR (PerkinElmer, Waltham, MA, USA). A scintillation cocktail was prepared by mixing 3 mL of digested sample with 17 mL of scintillant (PerkinElmer UltimaGold AB). All samples were then analysed by liquid scintillation counting (LSC) for 5 min and were corrected for radioactive decay and dilution. The 32P-radioisotope counts were used to calculate the specific activity of the shoot material, the amount of plant P derived from applied P, and the recovery of applied P (see [27] for further details) as follows:
The specific activity of P applied to the ‘band’ layer was ~2.1 MBq mg P−1 in the uniform low-P treatment, and ~0.2 MBq mg P−1 in the uniform high-P and banded high-P treatments.
Measured parameters were analysed in R Version 4.0.2 [28] by fitting linear models and using an analysis of variance (ANOVA) with ‘species’ and ‘P treatment’ as predictor variables. Linear mixed-effects models were fitted to the root traits that were measured in each soil layer (i.e., topsoil, band, and subsoil) (R package: nlme) [29]. These models included ‘species’, ‘P treatment’, and ‘soil layer’ as fixed effects, and ‘pot’ as a random effect. When appropriate, the effect of ‘replicate’ was included in the most parsimonious model. Means and standard errors were calculated from the fitted models (R package: emmeans) [30] and means were compared using Tukey’s honest significance differences (HSD). Normal quantile–quantile plots and Shapiro–Wilkes tests were used to test the normality of the residuals for all fitted models. When required, these models were log-transformed to meet the assumptions of normality. A 5% level of significance was applied for all statistical tests.
3. Results and Discussion
Shoot dry mass was influenced by soil P supply, with the largest yields usually produced in the uniform high-P treatment (p = 0.004; Table 1). The banded high-P treatment was also expected to improve plant growth compared to the uniform low-P treatment, but this did not occur within the six-week growth period. Because warm-season pasture species are relatively slow to establish, it is likely they would have explored more of the banded fertiliser and acquired more P if they had been grown for longer. The exception to these results was Premier Digit, which was highly productive in each of the soil-P distribution treatments. Accordingly, there were differences in shoot dry mass among the species as follows: Premier Digit > Haymaster Lucerne = Bambatsi Panic > Progardes® Desmanthus (p < 0.001; Table 1). Known differences in growth rate and preferred soil type, along with potential differences in P-acquisition efficiency and P-utilisation efficiency, are likely to have influenced the growth of the different species. Regardless, these varietal differences in shoot yield indicate that some species may be more compatible to be grown together in mixed pasture swards than others.

Table 1.
Shoot dry mass, shoot phosphorus (P) concentration, shoot P content, and shoot P content per unit total root length of four warm-season pasture species grown in three soil-P distribution treatments. Values show the mean ± standard error (n = 3). ANOVA results are provided for species, P treatment, and the species × P treatment interaction.
Shoot P concentrations were generally highest in the uniform high-P treatment (p < 0.001; Table 1). The exception was Progardes® Desmanthus, which also achieved a high shoot P concentration in the banded high-P treatment. The increase in shoot P concentrations associated with higher levels of soil-P supply indicates that warm-season grasses and legumes will accumulate tissue P, with consequent improvements in forage quality, provided sufficient P is available in the soil. There were varietal differences in shoot P concentration (p = 0.003; Table 1), but these were primarily due to the high shoot P concentration of Progardes® Desmanthus in the banded high-P treatment. Differences in shoot dry mass and shoot P concentration meant that shoot P content, which provides an indication of total plant P uptake, also differed according to soil-P distribution treatment (p < 0.001) and pasture species (p < 0.001) (Table 1).
Total root mass fraction (i.e., the proportion of plant biomass allocated to roots) did not vary in response to the soil-P distribution treatment (p = 0.168). However, there were differences in total root mass fraction among the pasture species (p < 0.001). On average across the soil-P distribution treatments, Premier Digit (0.45 g g−1) and Haymaster Lucerne (0.44 g g−1) allocated more biomass to roots than Progardes® Desmanthus (0.35 g g−1) and Bambatsi Panic (0.30 g g−1). These differences in total root mass fraction were associated with differences in biomass allocation to the three soil layers (i.e., topsoil, band, and subsoil), depending on the soil-P distribution treatment (p = 0.065). Varietal differences in the allocation of biomass to roots only partly explained the shoot yield results, which suggests that other factors contributed to the efficiency of P acquisition.
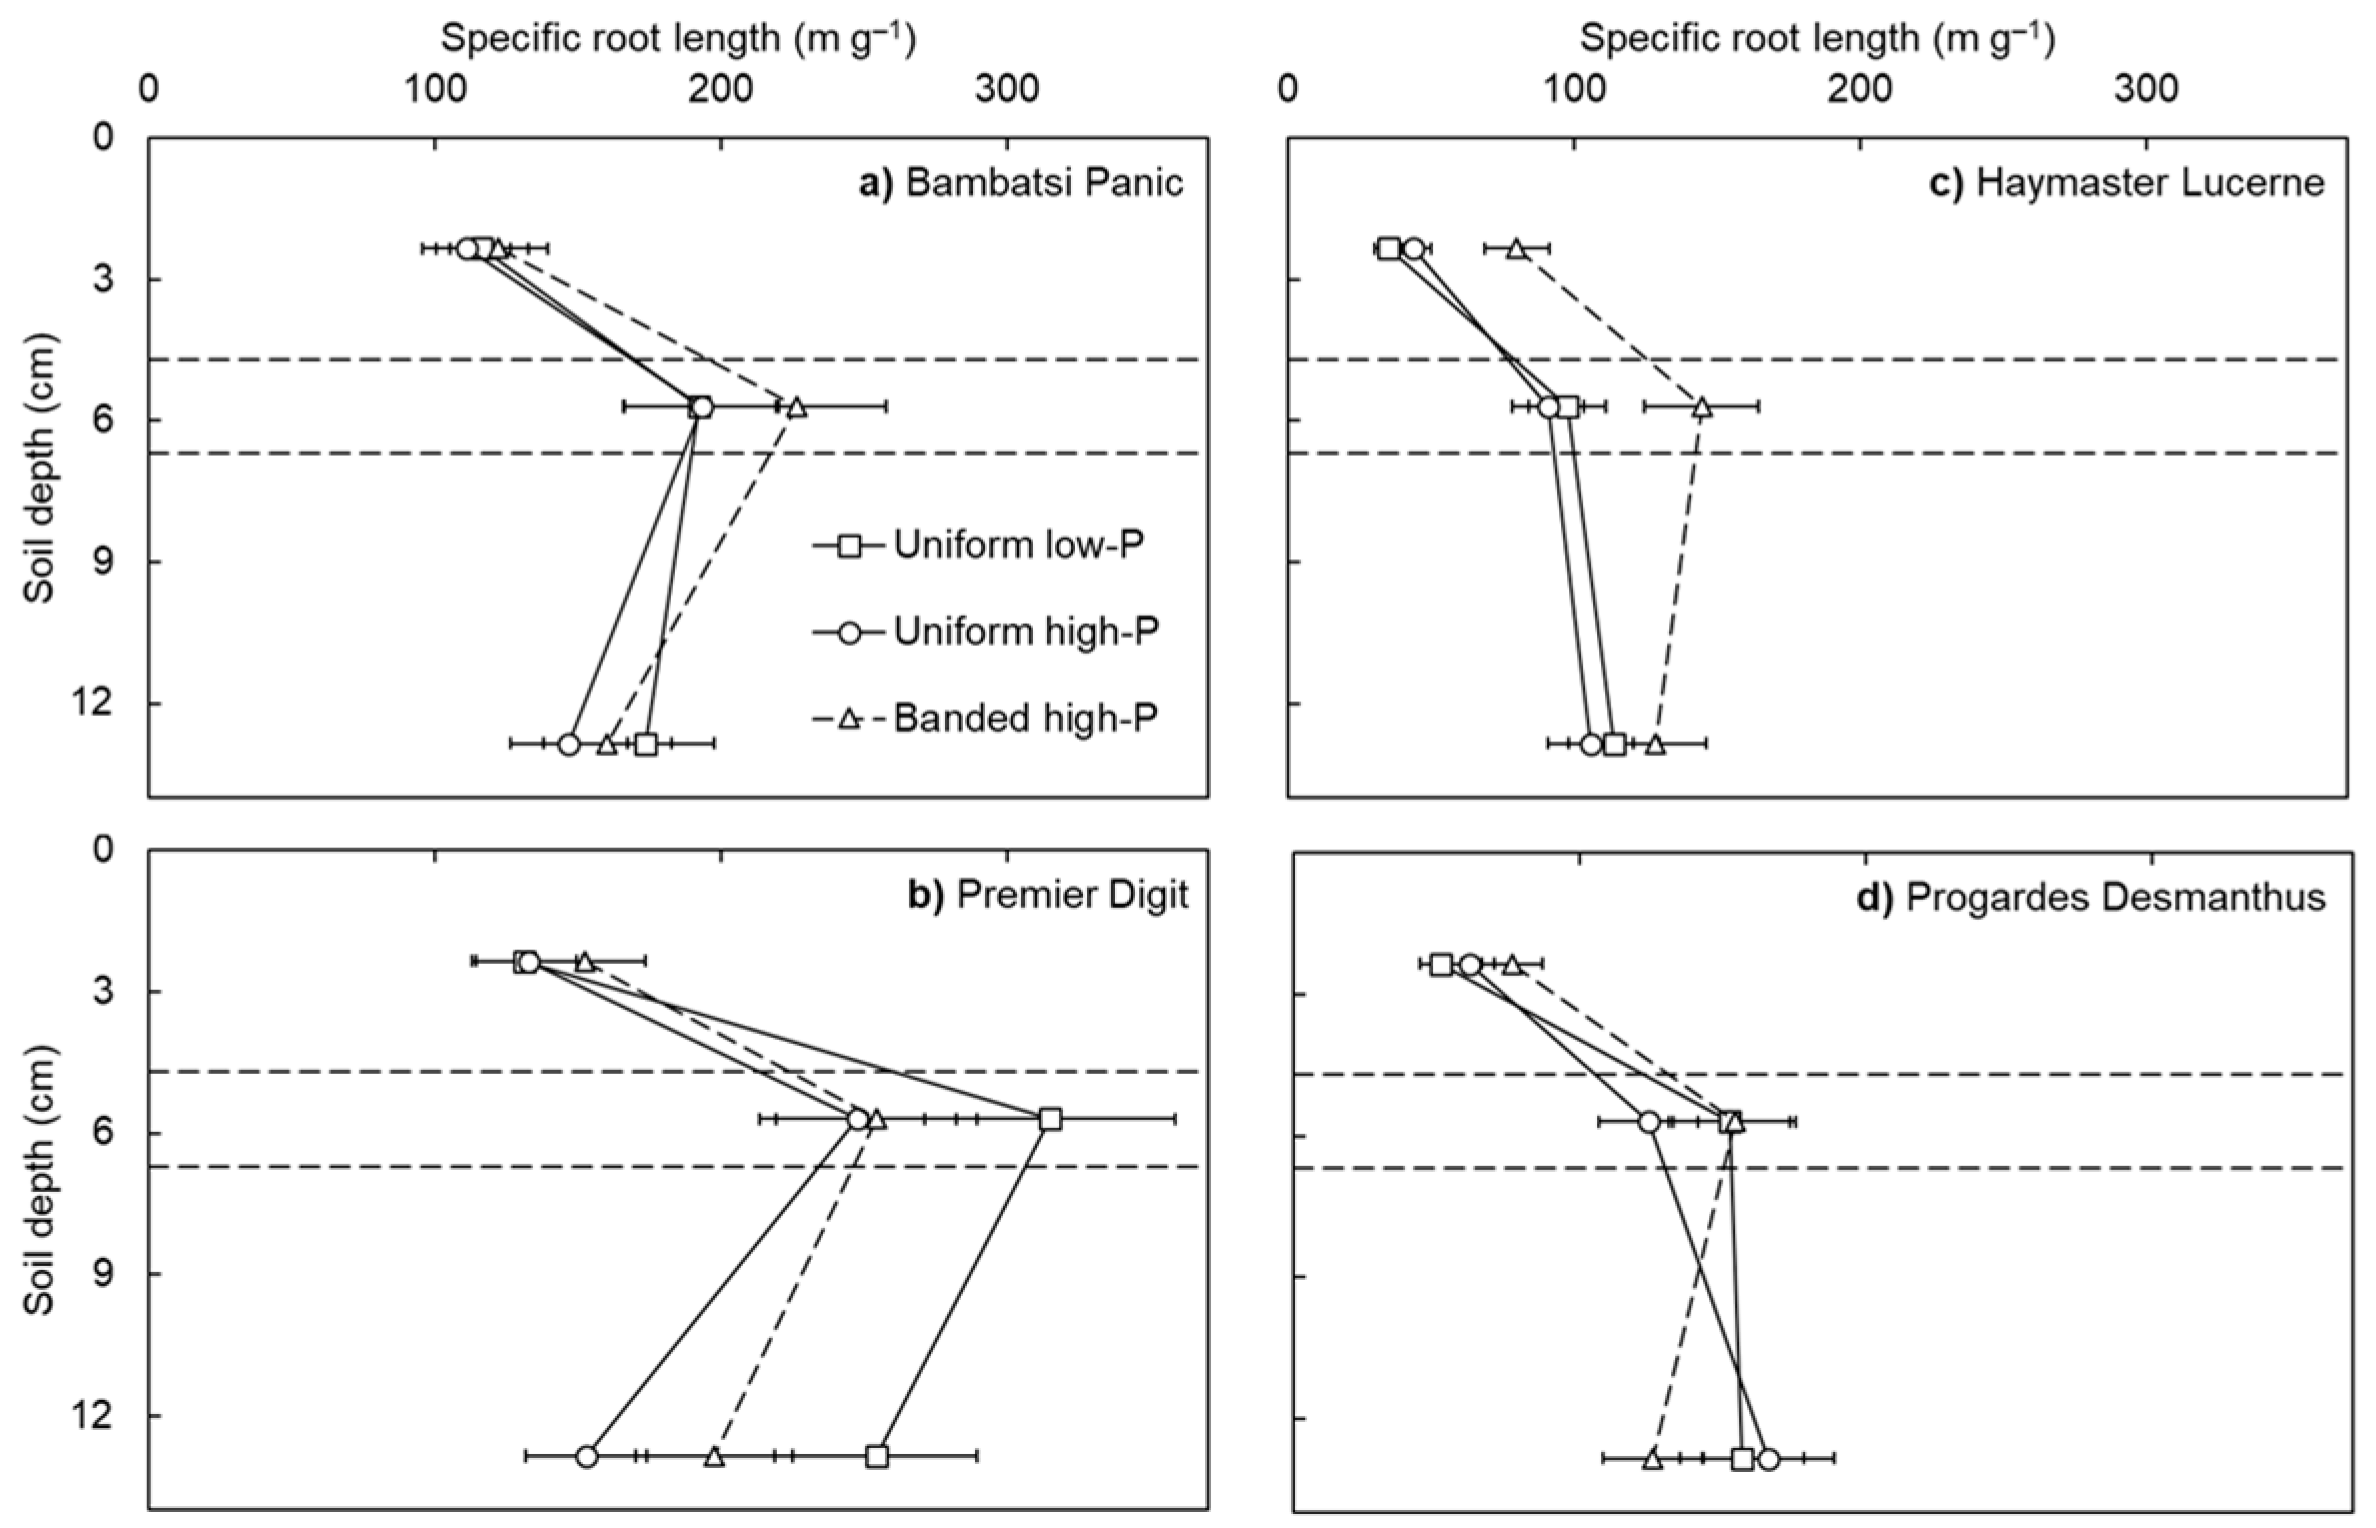
Specific root length differed among the pasture species, with the grasses (i.e., Premier Digit and Bambatsi Panic) producing roots more efficiently than the legumes (i.e., Progardes® Desmanthus and Haymaster Lucerne) (p < 0.001; Figure 1). This result was associated with varietal differences in average root diameter (on average across the treatments, Premier Digit = 0.14 mm, Bambatsi Panic = 0.18 mm, Progardes® Desmanthus = 0.24 mm, and Haymaster Lucerne = 0.28 mm; p < 0.001) and is consistent with what has been observed among temperate grasses and legumes [8]. It is likely that the efficient production of root length by the grasses influenced the efficiency of P acquisition in the present experiment, as has been found among temperate pasture species [11,12]. Specific root length also differed according to the soil layer (p < 0.001) and, to a lesser extent, the soil-P distribution treatment (p = 0.014). On average across the soil-P distribution treatments, the specific root lengths of the grasses were highest in the ‘band’ layer whereas that of the legumes were highest in the ‘subsoil’ layer. This result may be associated with inherent differences in root development between the grasses, which produce fibrous roots that are effective for surface foraging, and the legumes, which produce taproots that are generally more effective for subsoil exploration. Further research is warranted to characterise more root traits of a wider range of pasture species.
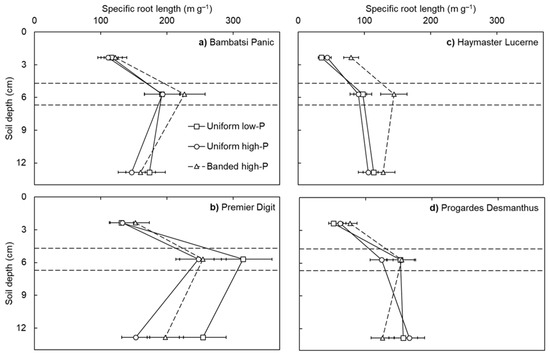
Figure 1.
Specific root length in the topsoil, band, and subsoil layers of four warm-season pasture species grown in three soil-phosphorus (P) distribution treatments. Soil depth values correspond to the depth below the soil surface of the mid-point of each soil layer (i.e., topsoil = 2.4 cm, band = 5.7 cm, and subsoil = 12.9 cm) and the horizontal lines depict the interfaces between soil layers. Values show the mean ± standard error (n = 3). Data points of the uniform low-P and uniform high-P treatments are joined by solid lines whereas data points of the banded high-P treatment are joined by dashed lines.
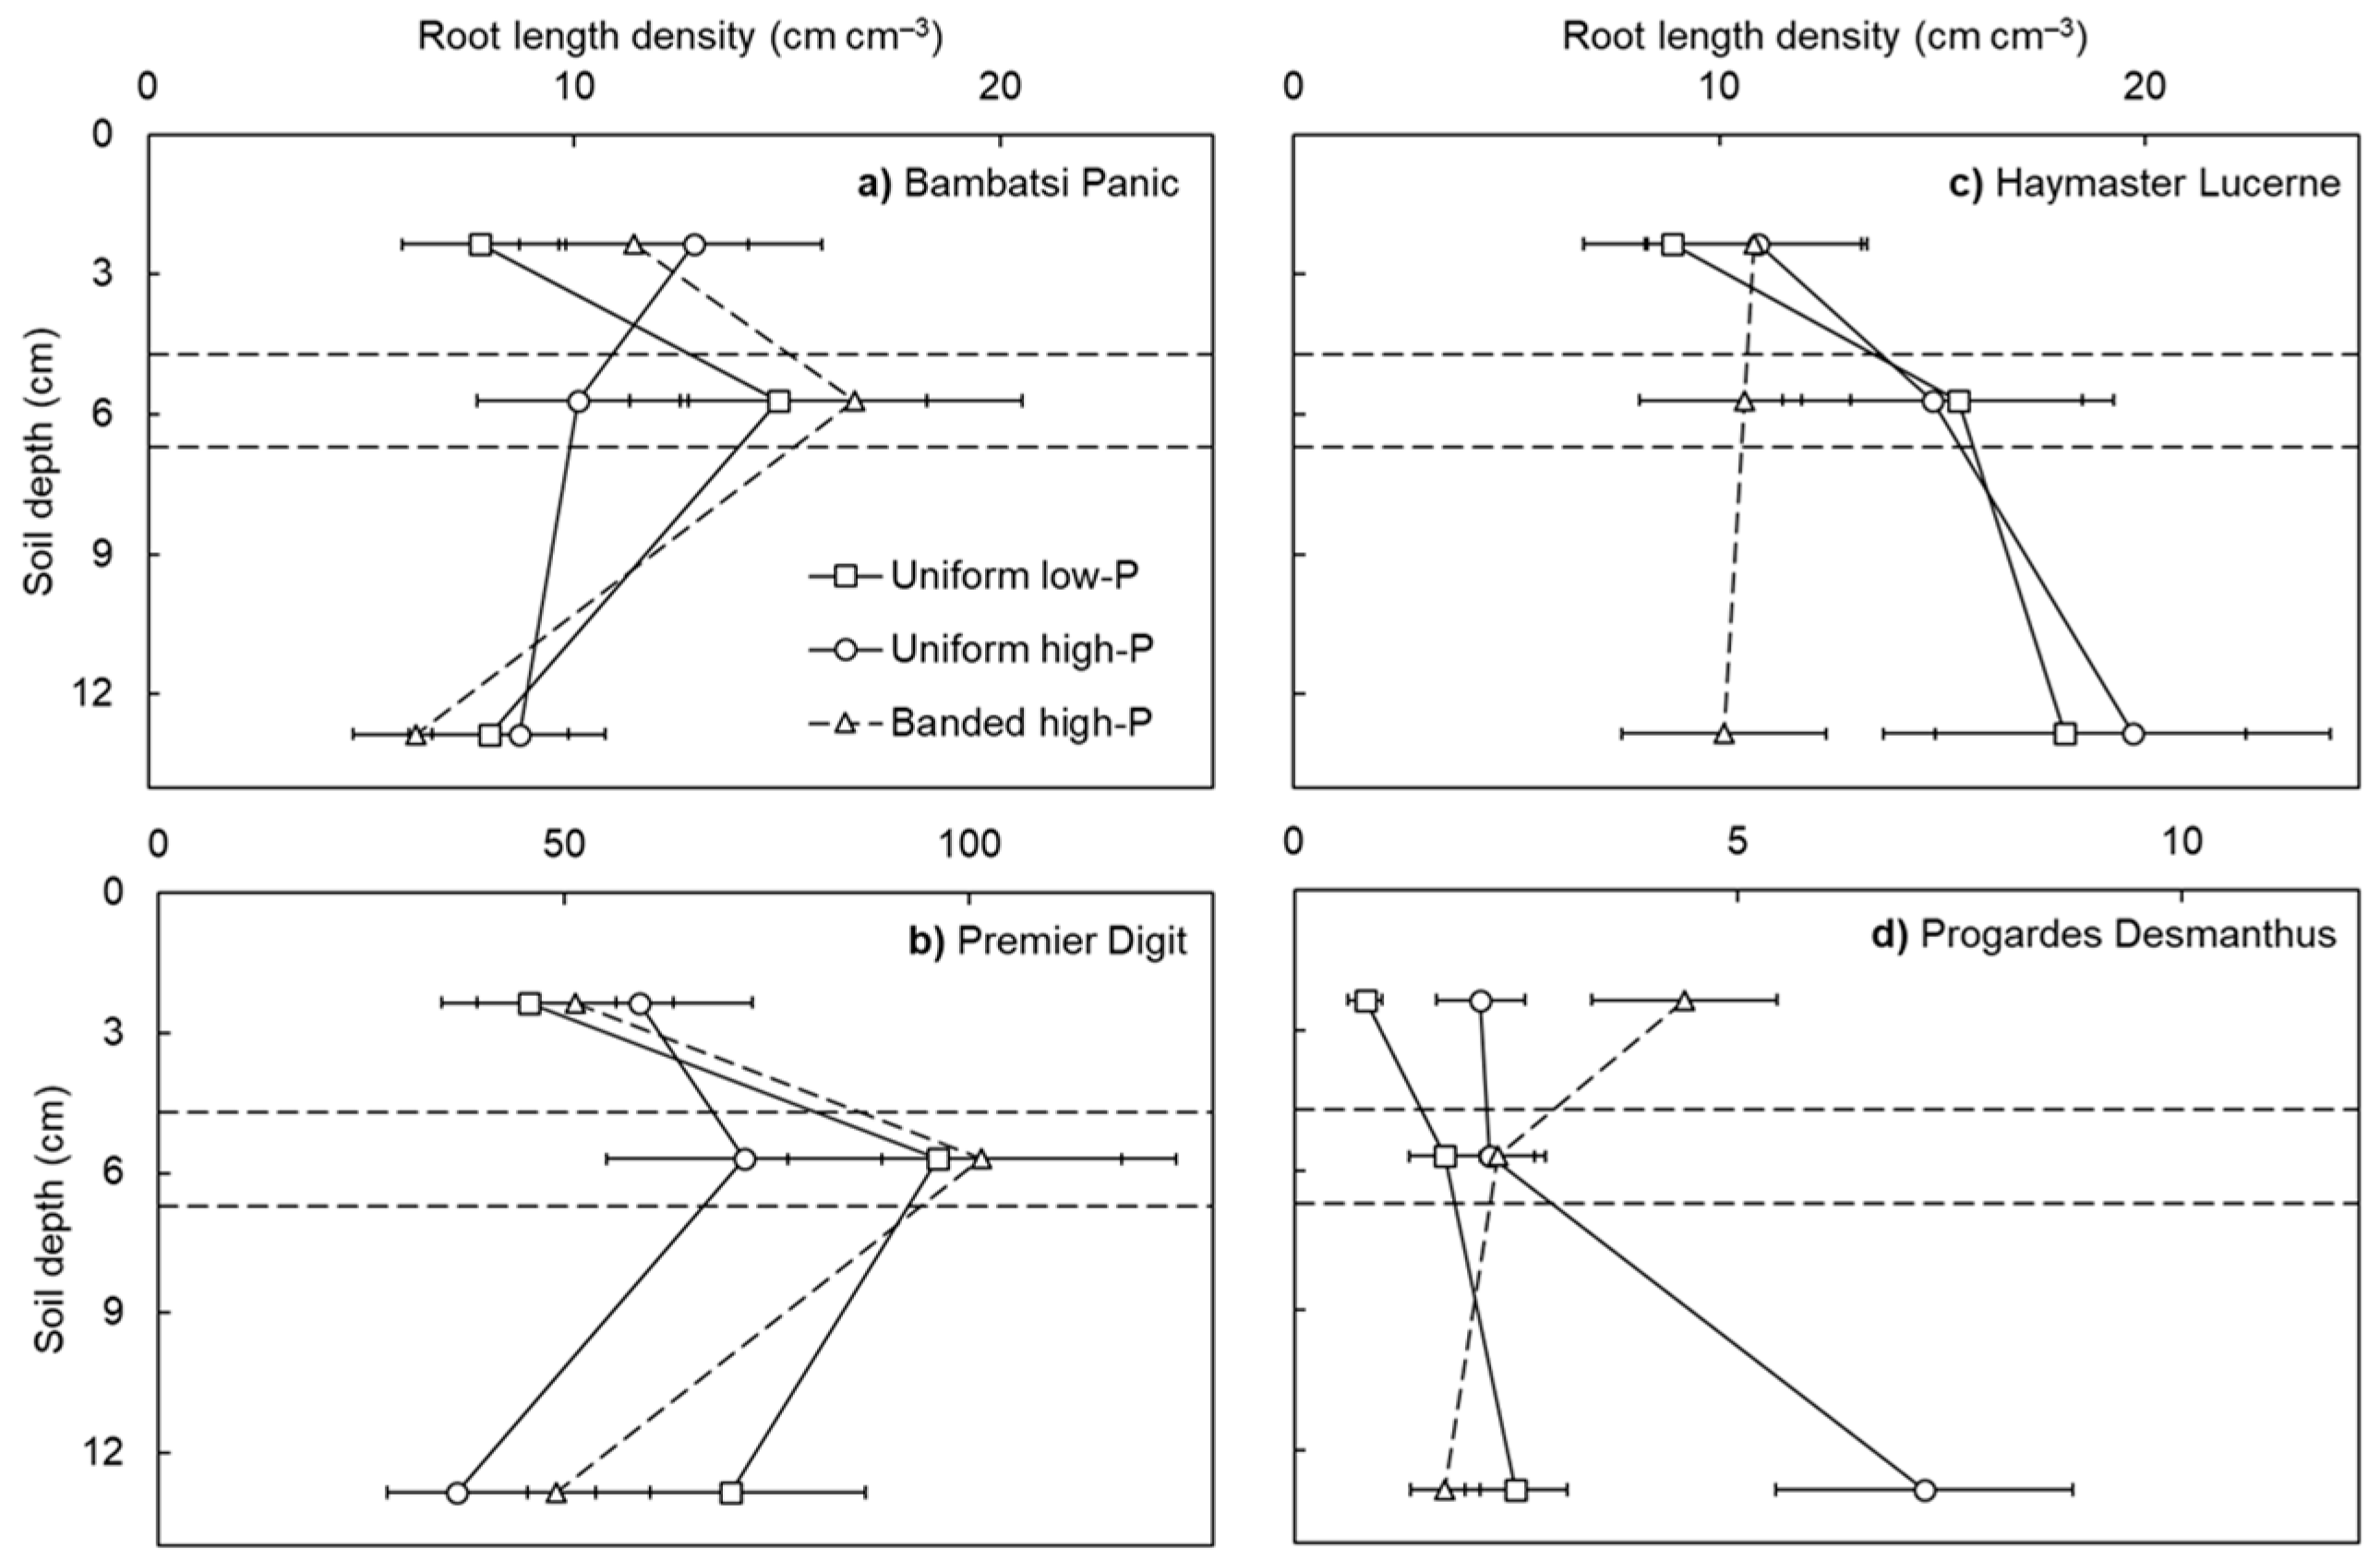
Root length density differed among the pasture species (p < 0.001: Figure 2). The largest root length densities were achieved by Premier Digit, followed by Bambatsi Panic and Haymaster Lucerne, then Progardes® Desmanthus. These species responded differently across the three soil layers (species × soil layer interaction; p < 0.001). In general, the grasses produced the highest root length densities in the band layer, whereas the root length densities of the legumes were stable or increased with soil depth. Furthermore, there was a higher responsiveness among the grasses to the localised source of P fertiliser than the legumes in the banded high-P treatment. When comparing the root length densities in the topsoil and band layers (i.e., an indication of root proliferation in response to the P fertiliser), Premier Digit and Bambatsi Panic achieved 2.1-fold and 1.5-fold increases, respectively. In contrast, the root length densities of Haymaster Lucerne and Progardes® Desmanthus were either stable or decreased between these soil layers.
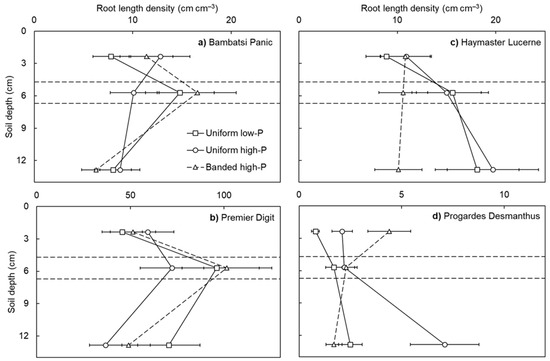
Figure 2.
Root length density in the topsoil, band, and subsoil layers of four warm-season pasture species grown in three soil-phosphorus (P) distribution treatments. Soil depth values correspond to the depth below the soil surface of the mid-point of each soil layer (i.e., topsoil = 2.4 cm, band = 5.7 cm, and subsoil = 12.9 cm) and the horizontal lines depict the interfaces between soil layers. The x-axes showing root length density are not the same for each pasture species (Premier Digit > Bambatsi Panic = Haymaster Lucerne > Progardes® Desmanthus). Values show the mean ± standard error (n = 3). Data points of the uniform low-P and uniform high-P treatments are joined by solid lines whereas data points of the banded high-P treatment are joined by dashed lines.
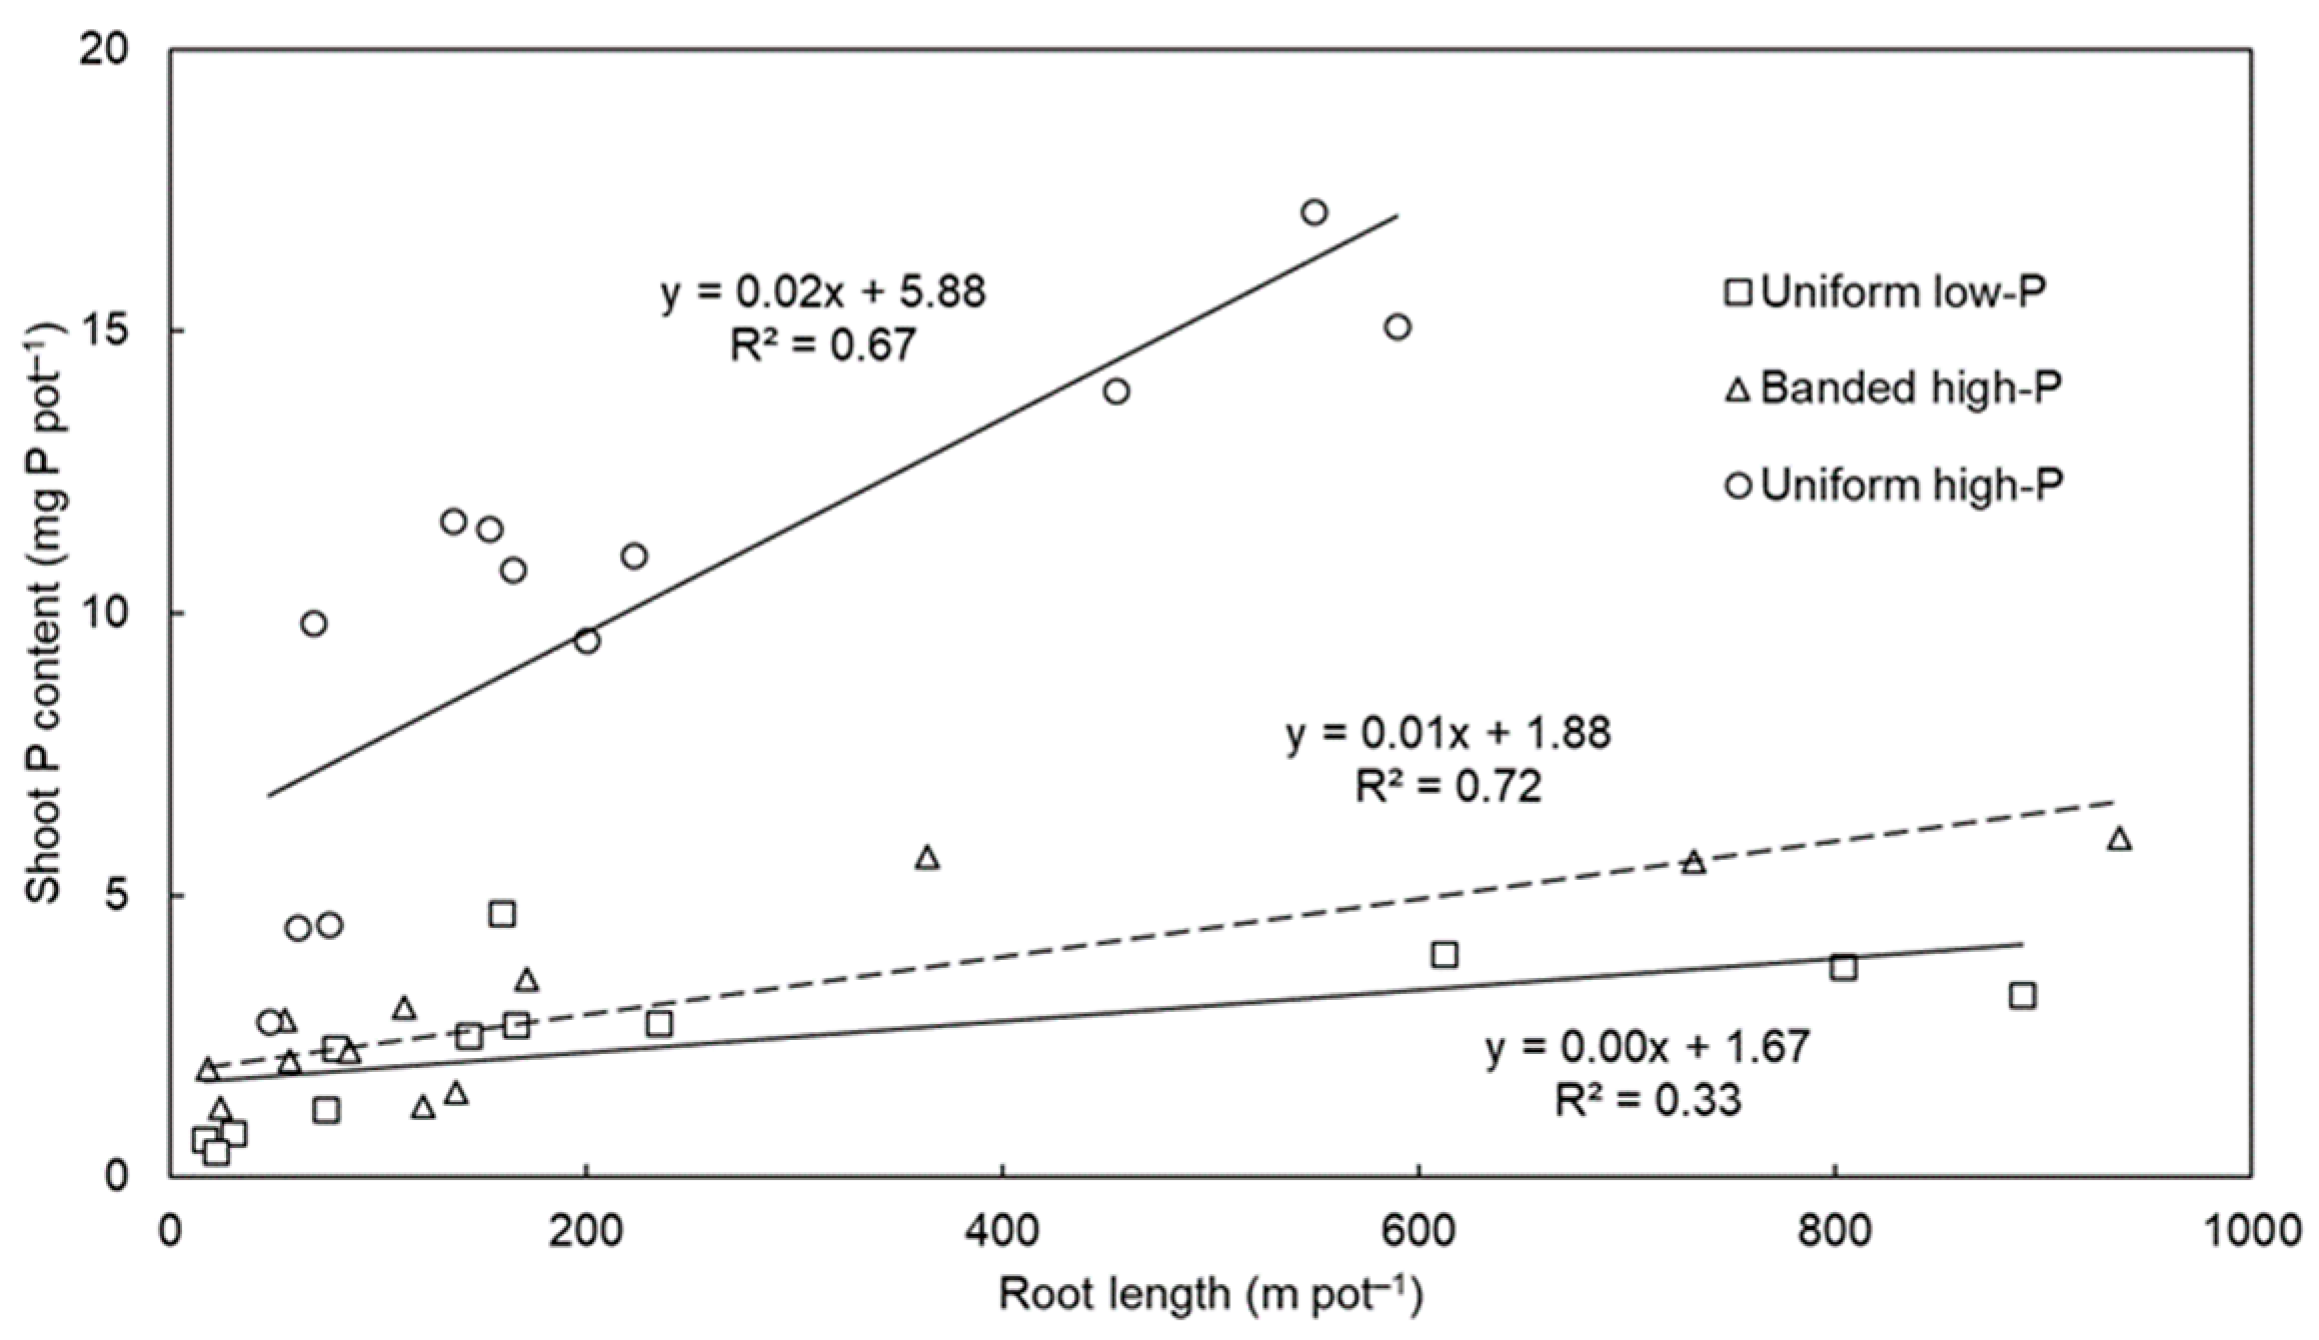
The significant correlations between total root length and shoot P content (i.e., an indicator of total plant P uptake) (Figure 3) demonstrated the importance of root length for P acquisition among the species. On average across the pasture species, the highest correlation was observed for the banded high-P treatment (R2 = 0.72, p < 0.001), followed by the uniform high-P (R2 = 0.67, p = 0.001) and uniform low-P (R2 = 0.33, p = 0.029) treatments. Previous experiments have demonstrated the importance of long nutrient-foraging roots for P acquisition [11] because P is relatively immobile in soil and longer roots increase the root surface area and thus improve the chance of P interception and acquisition. There were also significant differences in shoot P content per unit total root length (Table 1). On average across the pasture species, P uptake per unit root length was highest in the uniform high-P treatment, followed by the banded high-P treatment, and then the uniform low-P treatment (p < 0.001). There were also varietal differences for this trait (p < 0.001) and differences in how the pasture species responded to the soil-P distribution treatments (species × P treatment interaction; p = 0.004). For example, most of the species had a similarly small shoot P content per unit total root length in the uniform low-P and banded high-P treatments, whereas the shoot P content per unit total root length of Progardes® Desmanthus was similarly large in the uniform high-P and banded high-P treatments.
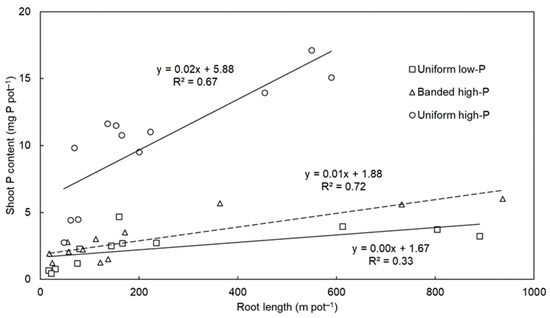
Figure 3.
The relationship between total root length and shoot phosphorus (P) content among four warm-season pasture species grown in three soil-P distribution treatments. The uniform low-P and uniform high-P treatments have solid regression lines whereas the banded high-P treatment has a dashed regression line. The regression lines and R2 coefficients of determination were fitted separately for each soil-P distribution treatment and include all data points of each species.
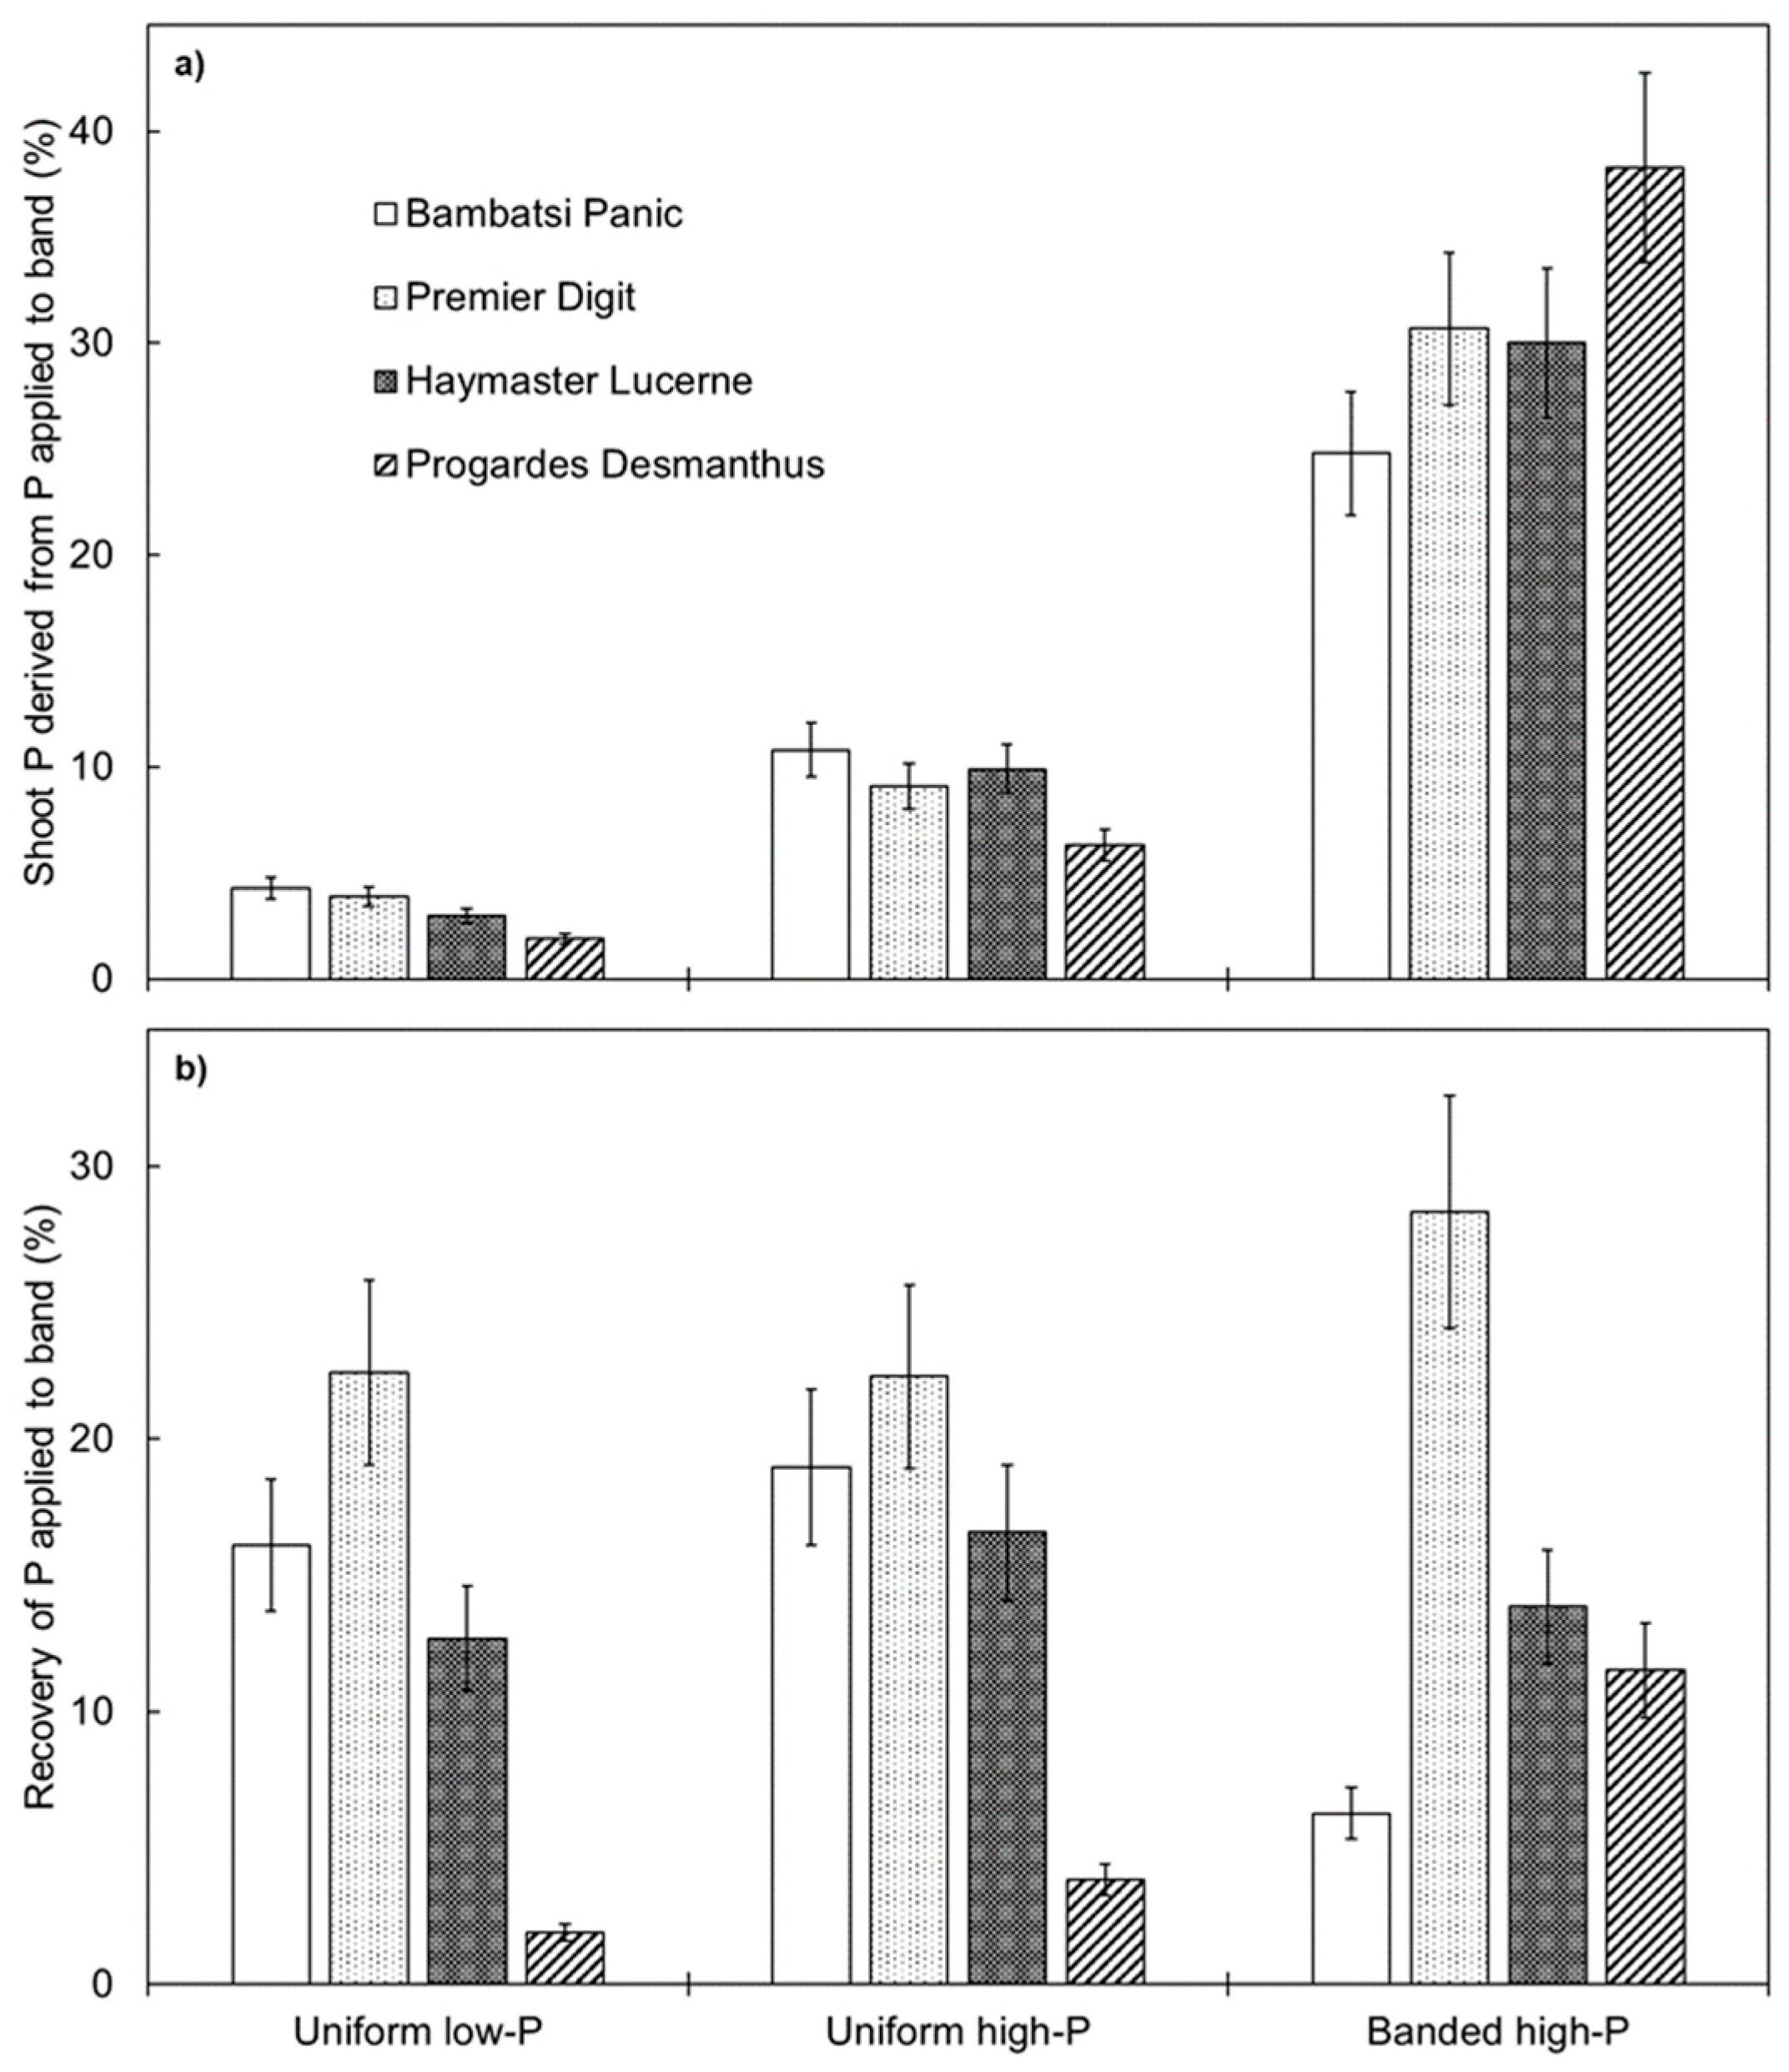
Shoot P derived from P applied to the band layer (i.e., a measure of how important applied P fertiliser was for plant growth) was relatively low for each of the pasture species when P fertiliser was distributed evenly throughout the soil profile but was significantly higher when P fertiliser was localised in the banded high-P treatment (p < 0.001; Figure 4a). Each of the pasture species responded to the subsurface application of P fertiliser, which indicates that this may be a useful technique to improve the productivity of warm-season pasture species in northern Australia. However, the way in which the grasses and legumes responded was different. The two species of grass responded by proliferating root length in the vicinity of the applied P fertiliser. The spatial distribution of root length for nutrient foraging is important in pasture systems because soil P is generally stratified [31,32] or distributed in a heterogeneous manner [14,15]. In contrast to the grasses, the two legumes did not respond spatially; therefore, other root traits must have been important for P acquisition. For example, the legumes may have upregulated P transporters under conditions of higher P concentration. Indeed, Progardes® Desmanthus had a relatively high shoot P content per unit of total root length in the uniform high-P and banded high-P treatments. Alternatively, mycorrhizal colonisation may have improved P uptake if mycorrhizal hyphae proliferated within the band layer.
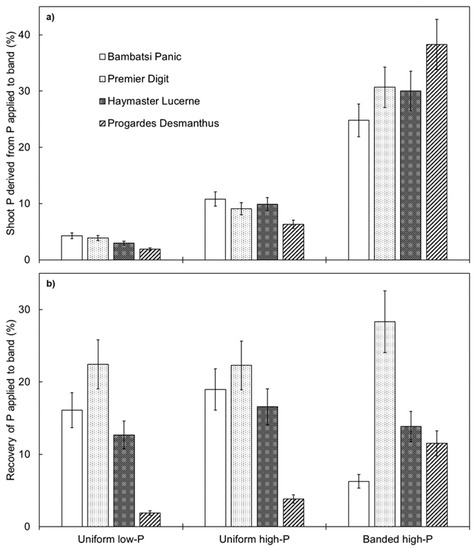
Figure 4.
Shoot phosphorus (P) derived from P applied to the band layer (a) and recovery of P applied to the band layer (b) of four warm-season pasture species grown in three soil-P distribution treatments. Values show the mean ± standard error (n = 3). ANOVA results for shoot P derived from P applied to band were: species p = 0.016, P treatment p < 0.001, and species × P treatment interaction p < 0.001. ANOVA results for recovery of P applied to band were: species p < 0.001, P treatment p = 0.017, and species × P treatment interaction p < 0.001.
Recovery of P applied to the band layer was influenced by pasture species (p < 0.001) and, to a lesser extent, by soil-P distribution treatment (p = 0.017) (Figure 4b). On average across the soil-P distribution treatments, the recovery of P was the highest for Premier Digit, followed by Haymaster Lucerne and Bambatsi Panic, then Progardes® Desmanthus. In general, the recovery of P was similar across the three soil-P distribution treatments for Premier Digit and Haymaster Lucerne. In contrast, Bambatsi Panic recovered less P in the banded high-P treatment, whereas Progardes® Desmanthus recovered more P in this treatment, compared to when P fertiliser was distributed evenly throughout the soil profile. This result indicates that a subsurface application of P fertiliser may be a relatively efficient way of applying P fertiliser within tropical pasture systems. This is consistent with the findings of McLachlan, Guppy, and Flavel [22], who suggested that banded applications of fertiliser may improve P fertiliser recovery in temperate pasture systems. Nevertheless, the recovery of P fertiliser by Premier Digit in the present experiment was substantially higher than that of Progardes® Desmanthus, suggesting that the grass component of tropical pasture swards is likely to compete more effectively for applied P fertiliser than the legume component.
Nutrient inputs are currently limited in the extensive grazing systems of northern Australia. Under these conditions, improved P-acquisition efficiency and overall pasture productivity may be achieved by growing plants with superior root morphologies. For example, there were clear differences in root morphology between the different grasses and legumes that influenced P acquisition. It is expected that under mixed sward conditions, highly productive C4 grasses will outcompete the legume component. Nevertheless, the grasses and legumes both responded in some way to the banded application of P fertiliser in the present experiment. Further research is required to determine the viability of a subsurface application of P fertiliser in warm-season pasture swards. A subsurface application of P fertiliser, particularly below the legume component, may help improve the productivity and persistence of mixed pasture swards.
4. Conclusions
There were substantial differences in shoot yield and root morphology among the four warm-season pasture species. In particular, the two species of grass responded spatially by proliferating root length in the vicinity of the banded P fertiliser, whereas the two legumes did not. This may be because it takes longer for legumes to proliferate roots when compared to grasses. Nevertheless, each of the species responded to the subsurface application of P fertiliser by deriving more P from the zone of P enrichment. The collective results indicate that a subsurface application of P fertiliser may be effective in warm-season pasture swards, particularly when plants have more time to respond to a localised source of P fertiliser. This application strategy could be used to improve the productivity and persistence of legumes by placing fertiliser in the vicinity of this component only at the planting stage.
Supplementary Materials
The following supporting information can be downloaded at: https://www.mdpi.com/article/10.3390/agronomy13102524/s1, Figure S1: Diagrammatic illustration of the three soil-P distribution treatments used to investigate the root morphology and P acquisition of four warm-season pasture species. Thick lines represent the pot confine whereas dashed lines represent the soil surface and soil layer interfaces. The 5 and 50 mg P kg−1 labels depict the amount of P that was applied to each soil layer (i.e., topsoil, band, and subsoil). The P applied to the ‘band’ layer was labelled with ~10.5 MBq kg−1 of 32P-radioisotope tracer.
Author Contributions
Conceptualisation, B.J.S., R.J.F. and C.N.G.; methodology, J.W.M., B.J.S., R.J.F. and C.N.G.; formal analysis, J.W.M. and R.J.F.; investigation, J.W.M., B.J.S., R.J.F. and C.N.G.; writing—original draft preparation, J.W.M.; writing—review and editing, J.W.M., B.J.S., R.J.F. and C.N.G. All authors have read and agreed to the published version of the manuscript.
Funding
This research was funded by Meat and Livestock Australia and the Australian Government through the Meat Donor Company, through an investment in ‘Phosphorus management and requirements of tropical legume pasture swards’ Project P.PSH.1050.
Data Availability Statement
The data presented in this study are available on request from the corresponding author.
Acknowledgments
Jane Carruthers, Emma Flavel, and Calista McLachlan are thanked for their technical assistance.
Conflicts of Interest
The authors declare no conflict of interest.
References
- Jones, R.M.; Rees, M.C. Evaluation of tropical legumes on clay soils at four sites in southern inland Queensland. Trop. Grassl. 1997, 31, 95–106. [Google Scholar]
- Clem, R.L.; Hall, T.J. Persistence and productivity of tropical pasture legumes on three cracking clay soils (Vertisols) in north-eastern Queensland. Aust. J. Exp. Agric. 1994, 34, 161–171. [Google Scholar] [CrossRef]
- Haling, R.E.; Campbell, C.D.; Tighe, M.K.; Guppy, C.N. Effect of competition from a C4 grass on the phosphorus response of a subtropical legume. Crop Pasture Sci. 2013, 64, 985–992. [Google Scholar] [CrossRef]
- Robertson, F.A.; Myers, R.J.K.; Saffigna, P.G. Nitrogen cycling in brigalow clay soils under pasture and cropping. Aust. J. Soil Res. 1997, 35, 1323–1340. [Google Scholar] [CrossRef]
- Peck, G.; Hall, T.; Silcock, R.; Clem, B.; Buck, S.; Kedzlie, G. Persistence of pasture legumes in southern and central Queensland. In Proceedings of the 16th Australian Society of Agronomy Conference, Armidale, Australia, 14–18 October 2012. [Google Scholar]
- McCaskill, M.R.; Mitchell, M.L.; Zollinger, R.; Armstrong, R.D.; Partington, D. Dry matter and nutritive value responses of native, naturalised and sown pasture species to soil Olsen P. Crop Pasture Sci. 2019, 70, 1097–1109. [Google Scholar] [CrossRef]
- Muir, J.P.; Pitman, W.D.; Dubeux, J.C., Jr.; Foster, J.L. The future of warm-season, tropical and subtropical forage legumes in sustainable pastures and rangelands. Afr. J. Range Forage Sci. 2014, 31, 187–198. [Google Scholar] [CrossRef]
- Evans, P.S. Comparative root morphology of some pasture grasses and clovers. N. Z. J. Agric. Res. 1977, 20, 331–335. [Google Scholar] [CrossRef]
- Hill, J.O.; Simpson, R.J.; Moore, A.D.; Chapman, D.F. Morphology and response of roots of pasture species to phosphorus and nitrogen nutrition. Plant Soil 2006, 286, 7–19. [Google Scholar] [CrossRef]
- Lynch, J.P. Roots of the second green revolution. Aust. J. Bot. 2007, 55, 493–512. [Google Scholar] [CrossRef]
- Haling, R.E.; Yang, Z.; Shadwell, N.; Culvenor, R.A.; Stefanski, A.; Ryan, M.H.; Sandral, G.A.; Kidd, D.R.; Lambers, H.; Simpson, R.J. Root morphological traits that determine phosphorus-acquisition efficiency and critical external phosphorus requirement in pasture species. Funct. Plant Biol. 2016, 43, 815–826. [Google Scholar] [CrossRef]
- Yang, Z.; Culvenor, R.A.; Haling, R.E.; Stefanski, A.; Ryan, M.H.; Sandral, G.A.; Kidd, D.R.; Lambers, H.; Simpson, R.J. Variation in root traits associated with nutrient foraging among temperate pasture legumes and grasses. Grass Forage Sci. 2017, 72, 93–103. [Google Scholar] [CrossRef]
- Simpson, R.J.; Richardson, A.E.; Nichols, S.N.; Crush, J.R. Pasture plants and soil fertility management to improve the efficiency of phosphorus fertiliser use in temperate grassland systems. Crop Pasture Sci. 2014, 65, 556–575. [Google Scholar] [CrossRef]
- Hodge, A. Plastic plants and patchy soils. J. Exp. Bot. 2006, 57, 401–411. [Google Scholar] [CrossRef]
- Hodge, A. The plastic plant: Root responses to heterogeneous supplies of nutrients. New Phytol. 2004, 162, 9–24. [Google Scholar] [CrossRef]
- Drew, M.C. Comparison of the effects of a localised supply of phosphate, nitrate, ammonium and potassium on the growth of the seminal root system, and the shoot, in barley. New Phytol. 1975, 75, 479–490. [Google Scholar] [CrossRef]
- Lynch, J.P. Root phenes for enhanced soil exploration and phosphorus acquisition: Tools for future crops. Plant Physiol. 2011, 156, 1041–1049. [Google Scholar] [CrossRef] [PubMed]
- Lynch, J.P.; Wojciechowski, T. Opportunities and challenges in the subsoil: Pathways to deeper rooted crops. J. Exp. Bot. 2015, 66, 2199–2210. [Google Scholar] [CrossRef]
- Ho, M.D.; Rosas, J.C.; Brown, K.M.; Lynch, J.P. Root architectural tradeoffs for water and phosphorus acquisition. Funct. Plant Biol. 2005, 32, 737–748. [Google Scholar] [CrossRef]
- McLachlan, J.W.; Guppy, C.N.; Flavel, R.J. Differences in phosphorus acquisition and critical phosphorus requirements among nine Desmanthus spp. genotypes. Crop Pasture Sci. 2021, 72, 742–753. [Google Scholar] [CrossRef]
- McIvor, J.G.; Guppy, C.; Probert, M.E. Phosphorus requirements of tropical grazing systems: The northern Australian experience. Plant Soil 2011, 349, 55–67. [Google Scholar] [CrossRef]
- McLachlan, J.W.; Guppy, C.N.; Flavel, R.J. Banded application improves the recovery of phosphorus fertiliser in a temperate pasture sward containing red clover. In Proceedings of the 19th Australian Society of Agronomy Conference, Wagga Wagga, Australia, 25–29 August 2019. [Google Scholar]
- Isbell, R.F. The Australian Soil Classification; CSIRO Publishing: Melbourne, Australia, 1996. [Google Scholar]
- Rayment, G.E.; Lyons, D.J. Soil Chemical Methods—Australasia; CSIRO Publishing: Melbourne, Australia, 2011. [Google Scholar]
- Hopkinson, J.M.; English, B.H. Germination and hardseededness in desmanthus. Trop. Grassl. 2004, 38, 1–16. [Google Scholar]
- Bouma, T.J.; Nielsen, K.L.; Koutstaal, B. Sample preparation and scanning protocol for computerised analysis of root length and diameter. Plant Soil 2000, 218, 185–196. [Google Scholar] [CrossRef]
- IAEA. Use of Isotope and Radiation Methods in Soil and Water Management and Crop Nutrition; Training Course Series No. 14; IAEA: Vienna, Austria, 2001. [Google Scholar]
- R Core Team. R: A Language and Environment for Statistical Computing; R Foundation for Statistical Computing: Vienna, Austria, 2020. [Google Scholar]
- Pinheiro, J.; Bates, D.; DebRoy, S.; Sarkar, D.; Team, R.C. Nlme: Linear and Nonlinear Mixed Effects Models. R Package Version 3.1-148. 2020. Available online: https://CRAN.R-project.org/package=nlme (accessed on 12 September 2023).
- Lenth, R. Emmeans: Estimated Marginal Means, Aka Least-Squares Means. R Package Version 1.5.0. 2020. Available online: https://CRAN.R-project.org/package=emmeans (accessed on 12 September 2023).
- Simpson, R.J.; Stefanski, A.; Marshall, D.J.; Moore, A.D.; Richardson, A.E. Management of soil phosphorus fertility determines the phosphorus budget of a temperate grazing system and is the key to improving phosphorus efficiency. Agric. Ecosyst. Environ. 2015, 212, 263–277. [Google Scholar] [CrossRef]
- McLaughlin, M.J.; McBeath, T.M.; Smernik, R.; Stacey, S.P.; Ajiboye, B.; Guppy, C. The chemical nature of P accumulation in agricultural soils—Implications for fertiliser management and design: An Australian perspective. Plant Soil 2011, 349, 69–87. [Google Scholar] [CrossRef]
Disclaimer/Publisher’s Note: The statements, opinions and data contained in all publications are solely those of the individual author(s) and contributor(s) and not of MDPI and/or the editor(s). MDPI and/or the editor(s) disclaim responsibility for any injury to people or property resulting from any ideas, methods, instructions or products referred to in the content. |
© 2023 by the authors. Licensee MDPI, Basel, Switzerland. This article is an open access article distributed under the terms and conditions of the Creative Commons Attribution (CC BY) license (https://creativecommons.org/licenses/by/4.0/).

