Article

Quality Characteristics of White Leaf Tea of ‘Baiye 1’ (Camellia sinensis) in Different Producing Areas

1
Key Laboratory of Tea Biology and Resource Utilization of Tea, Tea Research Institute, Chinese Academy of Agricultural Sciences, Hangzhou 310008, China
2
Graduate School of Chinese Academy of Agricultural Sciences, Beijing 100081, China
3
Institute of Fruit and Tea of Hubei Academy of Agricultural Sciences, Wuhan 430209, China
4
Anji Agriculture and Rural Bureau, Huzhou 313300, China
5
Tea Development Center of Zhengan Agriculture and Rural Bureau, Zunyi 563400, China
*
Author to whom correspondence should be addressed.
Agronomy 2023, 13(10), 2526; https://doi.org/10.3390/agronomy13102526
Submission received: 4 September 2023 / Revised: 25 September 2023 / Accepted: 28 September 2023 / Published: 29 September 2023
(This article belongs to the Special Issue Advances in Tea Agronomy: From Yield to Quality — Volume II)

Abstract

:
In order to find out the differences in tea quality characteristics from different regions and the reasons for their formation, 32 biochemical components, 22 mineral elements, and 3 stable isotope ratios were determined in 93 white leaf tea (WLT) samples. The findings revealed that significant differences in the content of free amino acids, catechins, caffeine, several mineral elements, and stable isotope ratios were observed among the WLT samples of different origins. Furthermore, a Pearson correlation analysis showed significant correlations of 15 chemical composition qualities and 14 mineral elements with soil factors. The δ 13C and δ 18O values were significantly correlated with meteorological factors. Classification models based on multiple chemical signatures facilitated successful differentiation of WLT of different origins, achieving a high prediction accuracy of over 90%. This study comprehensively identified distinct quality characteristics of WLT from different regions in China and proved an effective method in classifying WLT samples from the main production areas.

1. Introduction

Tea, derived from the new shoots of Camellia sinensis (L.) trees, stands as one of the world’s most popular non-alcoholic beverages. The presence of abundant bioactive compounds, such as tea polyphenols and amino acids, in the tea has been linked to its potential protective effects against cancers and cardiovascular diseases [1]. In general, according to the degree of fermentation and processing methods, tea can be classified into six categories: green tea, black tea, Oolong tea, white tea, yellow tea, and dark tea. White leaf tea (WLT) is a specific type of green tea that is processed from the raw materials of “Baiye 1”. It is characterized by high amino acid content and low tea polyphenol content, resulting in a mellow, fresh, and highly aromatic flavor. Its superior taste has endeared it to a wide consumer base while its health benefits have made it the preferred tea among tea producers. The widespread adoption of this variety has led to the emergence of WLT as a renowned specialty in various regions, such as Anji white tea in Zhejiang Province and Zhengan white tea in Guizhou Province, both of which have earned recognition as agricultural geographical indications, significantly benefiting the local economy and earning the reputation of “a leaf that brews better livelihoods for farmers”. However, variations in branding and planting histories have resulted in significant price discrepancies for WLT among different production regions. Consequently, some merchants, driven by profit motives, have resorted to selling low-priced WLT under the guise of high-value branded tea, disrupting the integrity of the tea market. Furthermore, the specific quality characteristics of WLT from different geographical environments remain to be understood. In light of the need to protect the geographical indication brand of agricultural products and identify the quality attributes of WLT from distinct regions, it becomes imperative to develop an efficient and effective method for tracing the origin of tea.
Numerous studies [2,3,4] have consistently highlighted the close relationship between tea quality and its geographical origin and planting environment. The type of soil plays a crucial role in facilitating the exchange of air, water, and nutrients between tea trees and the soil, ultimately influencing the quality and yield of tea [5,6]. Among the essential nutrient elements in tea plants, nitrogen and phosphorus play a key role in regulating the synthesis of amino acids and polyphenols, thereby affecting the quality and yield of tea leaves [7,8]. Additionally, potassium stimulates and moderates various enzymes, leading to enhanced metabolism and improved resistance against biotic and abiotic stressors [9]. In addition to nitrogen, phosphorus, and potassium, tea plants need to absorb various trace elements. Some trace elements, such as magnesium, iron, copper, manganese, aluminum, and selenium, also play indispensable roles in tea plantation [10,11,12,13]. Meteorological factors, including temperature, humidity, sunshine, and precipitation, exert a significant influence on tea growth and development [14]. Xia et al. [15] conducted an analysis of the stable isotope ratio of tea plants in response to temperature and sunlight, observing a negative correlation between stable isotope ratios and photosynthetic parameters.
In recent times, numerous methods have been employed to classify the geographical origin of tea based on the chemical compositions [16,17], mineral elements [18], and stable isotope ratios [19,20]. The quality of tea is significantly influenced by its biochemical components, which can vary greatly depending on the type of tea. Compared with wild tea cultivars, the “Baiye 1” tea cultivar comprises abundant amino acids, which play a crucial role in the formation of flavor compounds during processing. High-performance liquid chromatography (HPLC) is a widely used technique in the food industry to qualitatively and quantitatively analyze biochemical components in tea, offering rapid detection and high accuracy. Oolong teas from different regions have unique sensory qualities and differ greatly in their chemical compositions [21]. By combining the phytochemical analysis with chemometric methods, it is possible to classify and identify teas of different origins [22]. These studies highlight the role of biochemical components as valuable markers for distinguishing the production regions of tea. Unlike phytochemicals, mineral elements and stable isotopes are considered steady indicators as they are not susceptible to the processing methods and storage conditions. Hence, mineral element compositions and stable isotope ratio are commonly used for tracing the origins of agricultural products. For example, the geographical origin of oolong tea was distinguished using 15 elements and support vector machine models [23]. Similar approaches, using tea quality indicators combined with chemometric methods, have been utilized to differentiate production regions of Wuyi rock tea [24] and Cassiae Semen tea [25]. However, there are a lack of studies addressing the geographical origin classification of WLT based on multiple indicators. Furthermore, given that Anji white tea is a geographical indication agricultural product, it is crucial to distinguish it from green tea of other regions in Zhejiang Province, aiding in traceability and quality control efforts.
Therefore, the primary objectives of this study were (1) to examine differences in the chemical compositions, mineral element contents, and stable isotope characteristics of WLT originating from different production areas and (2) to select characteristic indicators closely related to the geographical origins for establishing a traceability model. The results of our study can provide a theoretical basis for the traceability of WLT.

2. Materials and Methods

2.1. Sample Collection

A total of 93 white leaf tea samples were collected over two years, following the same plucking standard of one bud and one leaf from the “Baiye 1” tea cultivar in Zhejiang (ZJ, n = 48), Guizhou (GZ, n = 20), and Hubei (HB, n = 25) provinces. The samples were picked in April 2021 and April 2022, respectively, and subsequently processed to create dried tea samples using the same method. Among the samples from Zhejiang Province, 49 originated from two counties: Anji (ZJAJ, n = 28) and Songyang (ZJSY, n = 20). Detailed information on the geographical distribution of the WLT samples used in this study is provided in Table S1. Each tea sample was ground to a fine powder (<100 mesh) using an automatic sample grinder (MM301, Retsh GmbH, Shanghai, China).
Topsoil (0–20 cm depth) was collected from the same location as each tea sample, with each soil sample comprising a mixture from five different locations within each tea garden. The soil samples were allowed to dry naturally on a shelf for approximately 1 week until their weight became constant. Subsequently, the soil samples were passed through a 200-mesh sieve and stored in sealed bags with appropriate labeling.

Reagents

Analytical pure chemicals were used unless otherwise specified. Methanol, acetonitrile, formic acid, and nitric acid was purchased from Thermo Fisher Scientific Inc (Shanghai, China). All three chemicals used for HPLC were of HPLC grade.
Standards for catechin (C), epicatechin (EC), epicatechin gallate (ECG), epigallocatechin gallate (EGCG), epigallocatechin (EGC), gallocatechin (GC), gallocatechin gallate (GCG), gallic acid (GA), and caffeine (CAF) were purchased from Yuanye Biotechnology Ltd. (Shanghai, China). Additionally, standards for amino acids, including histidine (His), serine (Ser), glutamine (Gln), arginine (Arg), glycine (Gly), aspartic acid (Asp), glutamic acid (Glu), threonine (Thr), alanine (Ala), γ-aminobutyric acid (GABA), ethylamine (Eth), theanine (Thea), proline (Pro), cysteine (Cys), lysine (Lys), tyrosine (Tyr), methionine (Met), valine (Val), isoleucine (Ile), leucine (Leu), and phenylalanine (Phe) were obtained from Waters Technology Ltd. (Shanghai, China).

2.2. Sample Analysis

2.2.1. Soil Physicochemical Properties

The soil pH was determined using an ORION 3 STAR pH meter (Thermo Fisher Scientific, Shanghai, China), with a soil-to-water ratio of 1:2.5. Soil available Ca, Mg, P, and K were extracted simultaneously using Mehlich-3 leach, and their concentrations were measured using inductively coupled plasma-atomic emission spectrometer (ICP-AES) according to the method described by Sikora et al. [26].

2.2.2. Tea Biochemical Components

The total amount of amino acids in the tea samples were determined following the GB/T 8314-87 standard.
To extract free amino acids, 100 mg of tea powder was placed in a 15 mL centrifuge tube with 5 mL of ultrapure water and extracted at 100 °C for 30 min, followed by centrifugation for 10 min and collection of the supernatant through a 0.22 μm filter membrane. Next, 70 μL of AccQ-Flour borate buffer solution was mixed with 10 μL of the supernatant, followed by the addition of 20 μL of AccQ-Flour derivatizer. The mixture was heated in an oven at 55 °C for 10 min and analyzed using an ACQUITY UPLC ultra-performance liquid chromatograph (Waters Technology Co., Ltd., Shanghai, China) with an AccQ-Tag Ultra C18 column (1.7 μm, 2.1 mm × 100 mm) (Waters Technology Co., Ltd., Shanghai, China). The column temperature was set to 43 °C, and the wavelength, injection volume, and flow rate were maintained at 260 nm, 0.6 μL, and 0.7 mL/min, respectively.
To extract catechin and caffeine, 0.1000 g of tea powder was placed in a 10-mL centrifuge tube with 5 mL of 70% methanol and extracted at 70 °C for 20 min, followed by centrifugation for 10 min. The extract (0.2 mL) was added to a 5 mL graduated tube with 2 mL of stabilizing solution, and the supernatant was collected through a 0.22 μm filter membrane for HPLC analysis. HPLC was performed on E2695 HPLC (Waters Technology Co., Ltd., Shanghai, China) with a Synergi 4μ Polar-RP 80A column (250 mm × 4.6 mm) (Phenomenex Inc., Torrance, CA, USA). The column temperature was set to 40 °C, and the wavelength, injection volume, and flow rate were maintained at 280 nm, 10 μL, and 1.0 mL/min, respectively. The mobile phase A was 1% formic acid and the mobile phase B was acetonitrile.

2.2.3. Tea Mineral Elements

For the analysis of tea mineral elements, 200 mg of tea powder was precisely weighed into an acid-washed PTFE tube, and 5 mL of 30% nitric acid was added. The sample was then transferred to a microwave digestion tank for digestion.
The digestion procedure involved increasing the temperature to 120 °C in 5 min and maintaining it for 5 min, increasing to 140 °C in 5 min and maintaining it for 10 min, and finally increasing to 180 °C in 5 min and maintaining it for 10 min. The digestion solution was transferred to a 50 mL volumetric flask, and the volume was adjusted to the scale with 3% nitric acid. After thorough mixing, the solution was used for ICP-AES/MS analysis.
Additionally, total nitrogen (TN) and total carbon (TC) of 93 samples were identified using a carbon and nitrogen analyzer (Vario MAX CN, Langenselbold, Germany).

2.2.4. Tea Stable Isotope Ratios

To analyze C and N stable isotope ratios, 0.5 mg of tea powder was weighed and packed in a tin cup.
For O stable isotope ratio analysis, 1.0 mg of tea powder was weighed and packed in a silver cup. The packed tea samples were then placed into an elemental analyzer (EA, Flash 2000 HT, Thermo Fisher Scientific, USA), which was connected to an isotope mass spectrometer (IRMS, MAT 253 Plus, Thermo Fisher Scientific, Waltham, MA, USA).
The stable isotope ratios are expressed as δ values relative to international standards using the following equation (Vienna Pee Dee Belmnite for C, Air for N, and Standard Mean Ocean water, SMOW for O):
δ = [ ( R sample / R standard ) 1 ] × 1000
Here, Rsample and Rstandard represent the ratios of heavy to light isotopes (e.g., 13C/12C, 15N/14N, 18O/16O, 2H/1H) for the tea samples and the international standards, respectively. The δ values were multiplied by 1000 and are expressed in units of “per mill” (‰).
To ensure standardization and precision, the tea samples were analyzed together with reference standards, which included USGS40 (L-glutamic acid; δ 13CVPDB = −43.26‰, δ 15Nair = −4.5‰) for C and N stable isotope analysis, and USGS42 (Tibetan human hair powder; δ 2HVSMOW = −78.5‰, δ 18OVSMOW = 8.56‰) for H and O stable isotope analysis.

2.3. Statistic Analysis

Data are expressed as the mean ± standard deviation and were analyzed using SPSS (version 26.0, SPSS Inc., Chicago, IL, USA) and SIMCA-P (version 14.1, Umetrics, Umea, Sweden) software packages. Analysis of variance (ANOVA) and independent-samples T tests for independent samples were utilized to assess significant differences in the biochemical components, stable isotope ratios, and elemental composition of tea samples from different geographical sources at a confidence level of p = 0.05. Pearson’s correlation analysis was employed to investigate the relationship between various types of data and geographical environmental conditions. Three chemometric methods were used to determine the geographic origin of green tea samples: PCA, partial least squares discriminant analysis (PLS-DA), and OPLS-DA. Before applying PLS-DA and OPLS-DA, the data were scaled and normalized to balance differences among metrics. To validate these methods, all samples were divided into a training set (n = 74) and a test set (n = 19).

3. Results and Discussion

3.1. Difference in the Contents of Biochemical Components in WLT from Different Planting Regions

A total of 32 constituents were detected in the WLT samples (Table 1). ANOVA was conducted to investigate the impact of different geographical sources on the content of biochemical components of green tea made from the “Baiye 1” cultivar during 2021–2022. The analysis revealed that the content of 28 biochemical components in the WLT samples from different provinces, including those of GA, 5-GA, GC, C, EC, ECG, EGCG, CAF, His, Ser, Arg, Gly, Asp, Glu, Thr, Ala, GABA, Eth, Thea, Pro, Cys, Lys, Tyr, Met, Val, Ile, Leu, and Phe, differed significantly (p < 0.05). At the county level, the content of 13 biochemical components (5-GA, GC, GCG, His, Ser, Gln, Gly, Glu, Thr, Ala, Eth, Thea, and Val) in the WLT samples from different counties also exhibited significant differences (p < 0.05).
Comparing the provinces, the 5-GA, GC, C, and CAF contents of tea samples from ZJ were significantly higher than those of samples from the other two provinces (p < 0.05). The content of GA in WLT samples from GZ was significantly higher than that of samples from ZJ and HB (p < 0.05). In contrast, the Arg, Gly, Glu, GABA, Eth, Thea, and Met contents in the samples from HB were significantly higher than those in the samples from the other provinces (p < 0.05). Additionally, WLT samples from ZJ contained significantly higher levels of both ester catechins and non-ester catechins than those from the other two provinces (p < 0.05). However, the catechins quality index and the catechins astring index did not differ significantly among the samples from different provinces. When comparing the samples from ZJ, the GC and GCG contents of WLT samples from ZJSY were significantly higher than those of the samples from ZJAJ (p < 0.05). Conversely, ZJAJ sample was rich in 5-GA, His, Ser, Gln, Gly, Glu, Thr, Ala, Eth, Thea, and Val (p < 0.05).
Tea polyphenols are essential secondary metabolites in tea trees, consisting of catechins, flavonoids, anthocyanins, and other substances. Catechins are the main components of tea polyphenols, contributing to the tea’s astringency, including ester and non-ester catechins [27]. Free amino acids in tea infusion showed umami and sweet flavors, which can be attributed to the presence of amino acids with umami flavor, such as Asp, Glu, and GABA, and amino acids with sweet flavor, including Gly, Cys, Pro, Ser, Thr, Met, and Ala. The study results indicated that WLT from HB contained more sweet amino acids, which might be related to the altitude. The WLT in Xiangfeng, HB, generally originates from mountainous areas with an average altitude of approximately 800 m, and high altitude favors the accumulation of free amino acids and enhances the freshness of tea leaves [28].

3.2. Difference in the Contents of Mineral Elements among WLT from Different Production Regions

A total of 22 elements were detected in the tea samples by using ICP-AES and ICP-MS. To examine the effects of different geographical sources on the mineral element contents of WLT, a statistical analysis was performed on tea samples from different regions during 2021–2022 (Table 2). Samples from the three provinces differed significantly in the content of 15 mineral elements, namely Al, B, Ba, Cd, Co, Cu, Mn, Ni, P, S, Ti, V, Zn, Sn, and N (p < 0.05). Additionally, samples from the two counties in Zhejiang Province differed significantly in the content of 10 elements, namely Al, Co, Cr, K, Na, Ni, P, Zn, Bi, and N (p < 0.05).
Comparing the mineral elements of WLT samples from ZJ, GZ, and HB, we discovered that the content of Sn in ZJ samples was significantly higher than that in samples from the other two provinces (p < 0.05). The contents of Co and Mn in the WLT samples from GZ were significantly higher (p < 0.05), whereas the contents of five elements, Ba, Cu, Ni, S, and Zn, were significantly higher in the tea samples from HB (p < 0.05). Comparison of the samples from the two counties in Zhejiang Province indicated that Anji white tea contained higher levels of Co, Na, Ni, P, Zn, Bi, and N, whereas WLT samples from ZJSY exhibited higher levels of Al, Cr, and K (p < 0.05).

3.3. Comparative Analysis of Stable Isotope Features in WLT from Different Regions

Table 2 presents the stable isotope ratios in the tea samples from ZJ, GZ, and HB measured using IRMS. The δ 15N values varied from 1.60‰ to 3.56‰, δ 13C values varied from −25.70‰ to −33.34‰, and δ 18O values varied from 14.94‰ to 25.43‰. Statistical analysis was performed on tea samples from different regions during 2021–2022 to investigate differences in the stable isotope features. The δ 15N and δ 18O values of tea from the three provinces differed significantly (p < 0.05), whereas the samples from different counties showed no marked differences (p > 0.05). Among the samples from the three provinces, those from HB had the highest δ 15N value of 3.45‰, differing significantly from those of the samples from other provinces (p < 0.05).
Stable isotope ratios of plants exhibit natural variations, reflecting the geographic environment in which they grow. The continuous interaction between plants and their external environment results in the formation of specific ratios of “heavy” and “light” isotopes of certain elements in plant tissues [29]. Differences in carbon stable isotope abundance originate from the photosynthetic pathways of different types of plants, with C3 plants typically ranging from −34‰ to −24‰. In this study, the δ 13C values of green tea samples from different geographical sources ranged from −33.34‰ to −25.70‰, consistent with those reported in a study [30]. N stable isotope ratios in plants are generally closely related to local agricultural practices and soil nutrient conditions and show a weak correlation with the meteorological factors. Soil N is the primary cause of δ 15N variations in plants, and agricultural practices relying on organic fertilizers can lead to an increase in δ 15N values in plants [31]. High δ 15N values in HB samples compared with those in samples from other provinces indicate a high organic matter content in the local soil.

3.4. Correlation Analysis with Geographical Environment

3.4.1. Analysis of the Correlation of Soil Factors with Biochemical Composition and Mineral Elements of Tea Leaves

Pearson’s correlation analysis was conducted to examine the relationship of soil factors with tea biochemical components and mineral elements. The results are shown in Tables S2 and S3. Soil pH is a crucial factor in soil chemistry, and it can affect tea quality by altering the effectiveness of soil nutrients [32]. Soil pH showed a significant positive correlation with GA (correlation coefficient, 0.261; p < 0.05) and a highly significant negative correlation with ECG, GABA, and Cys (correlation coefficients of −0.376, −0.362, and −0.343, respectively; p < 0.01). Soil P promotes the formation of polyphenols and amino acids in tea leaves, thereby affecting the tea’s taste and aroma. Available P displayed a strong positive correlation (p < 0.01) with ECG (correlation coefficient of 0.292) and a negative correlation (correlation coefficient of −0.251, −0.206, and −0.225, respectively; p < 0.05) with GA, GCG, and Gln. It also exhibited a strong negative correlation (correlation coefficient of −0.321; p < 0.01) with EGCG, CAF, Ser, Asp, Glu, Thr, Ala, Eth, and Thea. The results and those reported by Zhou et al. [33] are consistent, indicating that soil available phosphorus was significantly and negatively correlated with Thea, CAF, and EGC, which further shows that the current tea garden earth contained excessive amounts of available P, which is not conducive to tea quality. Tea plants are susceptible to calcium, requiring less calcium than other crops. Available Ca showed negative and significant correlations with ECG, GABA, and Cys, whereas available potassium correlated negatively with GCG (correlation coefficient of −0.312; p < 0.01). Z. Liu et al. [34] reported that soil pH and water-soluble calcium were inversely correlated with the free amino acid and tea polyphenol contents in tea leaves, which is consistent with the results of the present study, further suggesting that proper pH reduction can improve tea quality.
The results of the correlation analysis between soil factors and tea mineral elements revealed that soil pH was significantly and positively correlated with the B, Ba, Ca, Cr, Fe, Mg, Ti, and Bi contents but significantly negatively correlated with the Cd, V, and Sb contents of the tea. Soil available calcium was significantly and positively correlated with the B, Ba, Ca, Cr, Fe, Mg, Ni, S, and Ti contents of the tea, whereas available magnesium was significantly and positively correlated with the Ba, Ca, Cr, Fe, Mg, Ni, Ti, and Sn contents of the tea. Available phosphorus showed a significant negative correlation with the B, Fe, and Ni contents but a significant positive correlation with the V, Sn, and Sb contents. Mineral elements play a crucial role in the metabolism of living organisms, and organisms cannot synthesize them on their own. Instead, they must absorb these elements from the external environment, such as soil and water [35,36]. The mineral element composition of the soil varies from region to region, leading to variations in the mineral element content of tea cultivated in different regions. For instance, K is involved in the photosynthesis of tea trees, which improves their drought tolerance; increases the content of biochemical components, such as amino acids, in their leaves; and stimulates the formation of tea aroma. The distribution of mineral resources in an area also affects the content of mineral elements in tea to some extent. For example, the high content of Mn in GZ and the highest content of Cu in HB may be explained by the abundance of Mn and Cu ores in GZ and HB provinces, respectively [37]. The soil environment can also explain differences in the mineral element content of tea samples from different regions. Soil pH, for example, affects the uptake and utilization of mineral elements in plants by influencing the solubility of mineral salts [38]. The results showed that the levels of mineral elements, such as Ba, Ca, Cr, Fe, and Mg, in tea were strongly influenced by the origin, which is consistent with the finding of Liu et al. [39]. There may be some differences in elemental correlations in different studies, which could be attributed to variations in characteristic parameters, such as soil pH and soil type, in different regions.

3.4.2. Correlation Analysis of Meteorological Variables with the Stable Isotope Ratio of Tea Leaves

The relationship between the three stable isotope ratios and four meteorological variables (humidity, temperature, precipitation, and sunshine) was investigated using Pearson’s correlation analysis. The results are shown in Table S4. The δ 13C of green tea samples exhibited a highly significant negative correlation with precipitation (correlation coefficient of −0.490; p < 0.01). W. Liu et al. [37] and Y. He et al. [35] also reported a decrease in δ 13C values with increasing precipitation, which aligns with the present study results. δ 18O showed a highly significant positive correlation (correlation coefficient of 0.435; p < 0.01) with precipitation, whereas δ 18O values exhibited a highly significant negative correlation with mean temperature (correlation coefficient of −0.541; p < 0.01). The δ 18O values correlated with precipitation, evaporation, and plant transpiration, indicating terrestrial, latitudinal, and seasonal effects. Here, the δ 18O values in ZJ Province were higher than those in other provinces, which may be attributed to the low relative humidity in ZJ Province when the trees were growing, resulting in enhanced local secondary evaporation and heavy isotope enrichment [40]. However, the trend of increasing oxygen stable isotope ratio with decreasing temperature was different from that observed with precipitation, which is consistent with the findings of W. Liu et al. [37] and may be influenced by multiple factors, such as meteorological conditions, water stress, and physiological processes in tea plants.

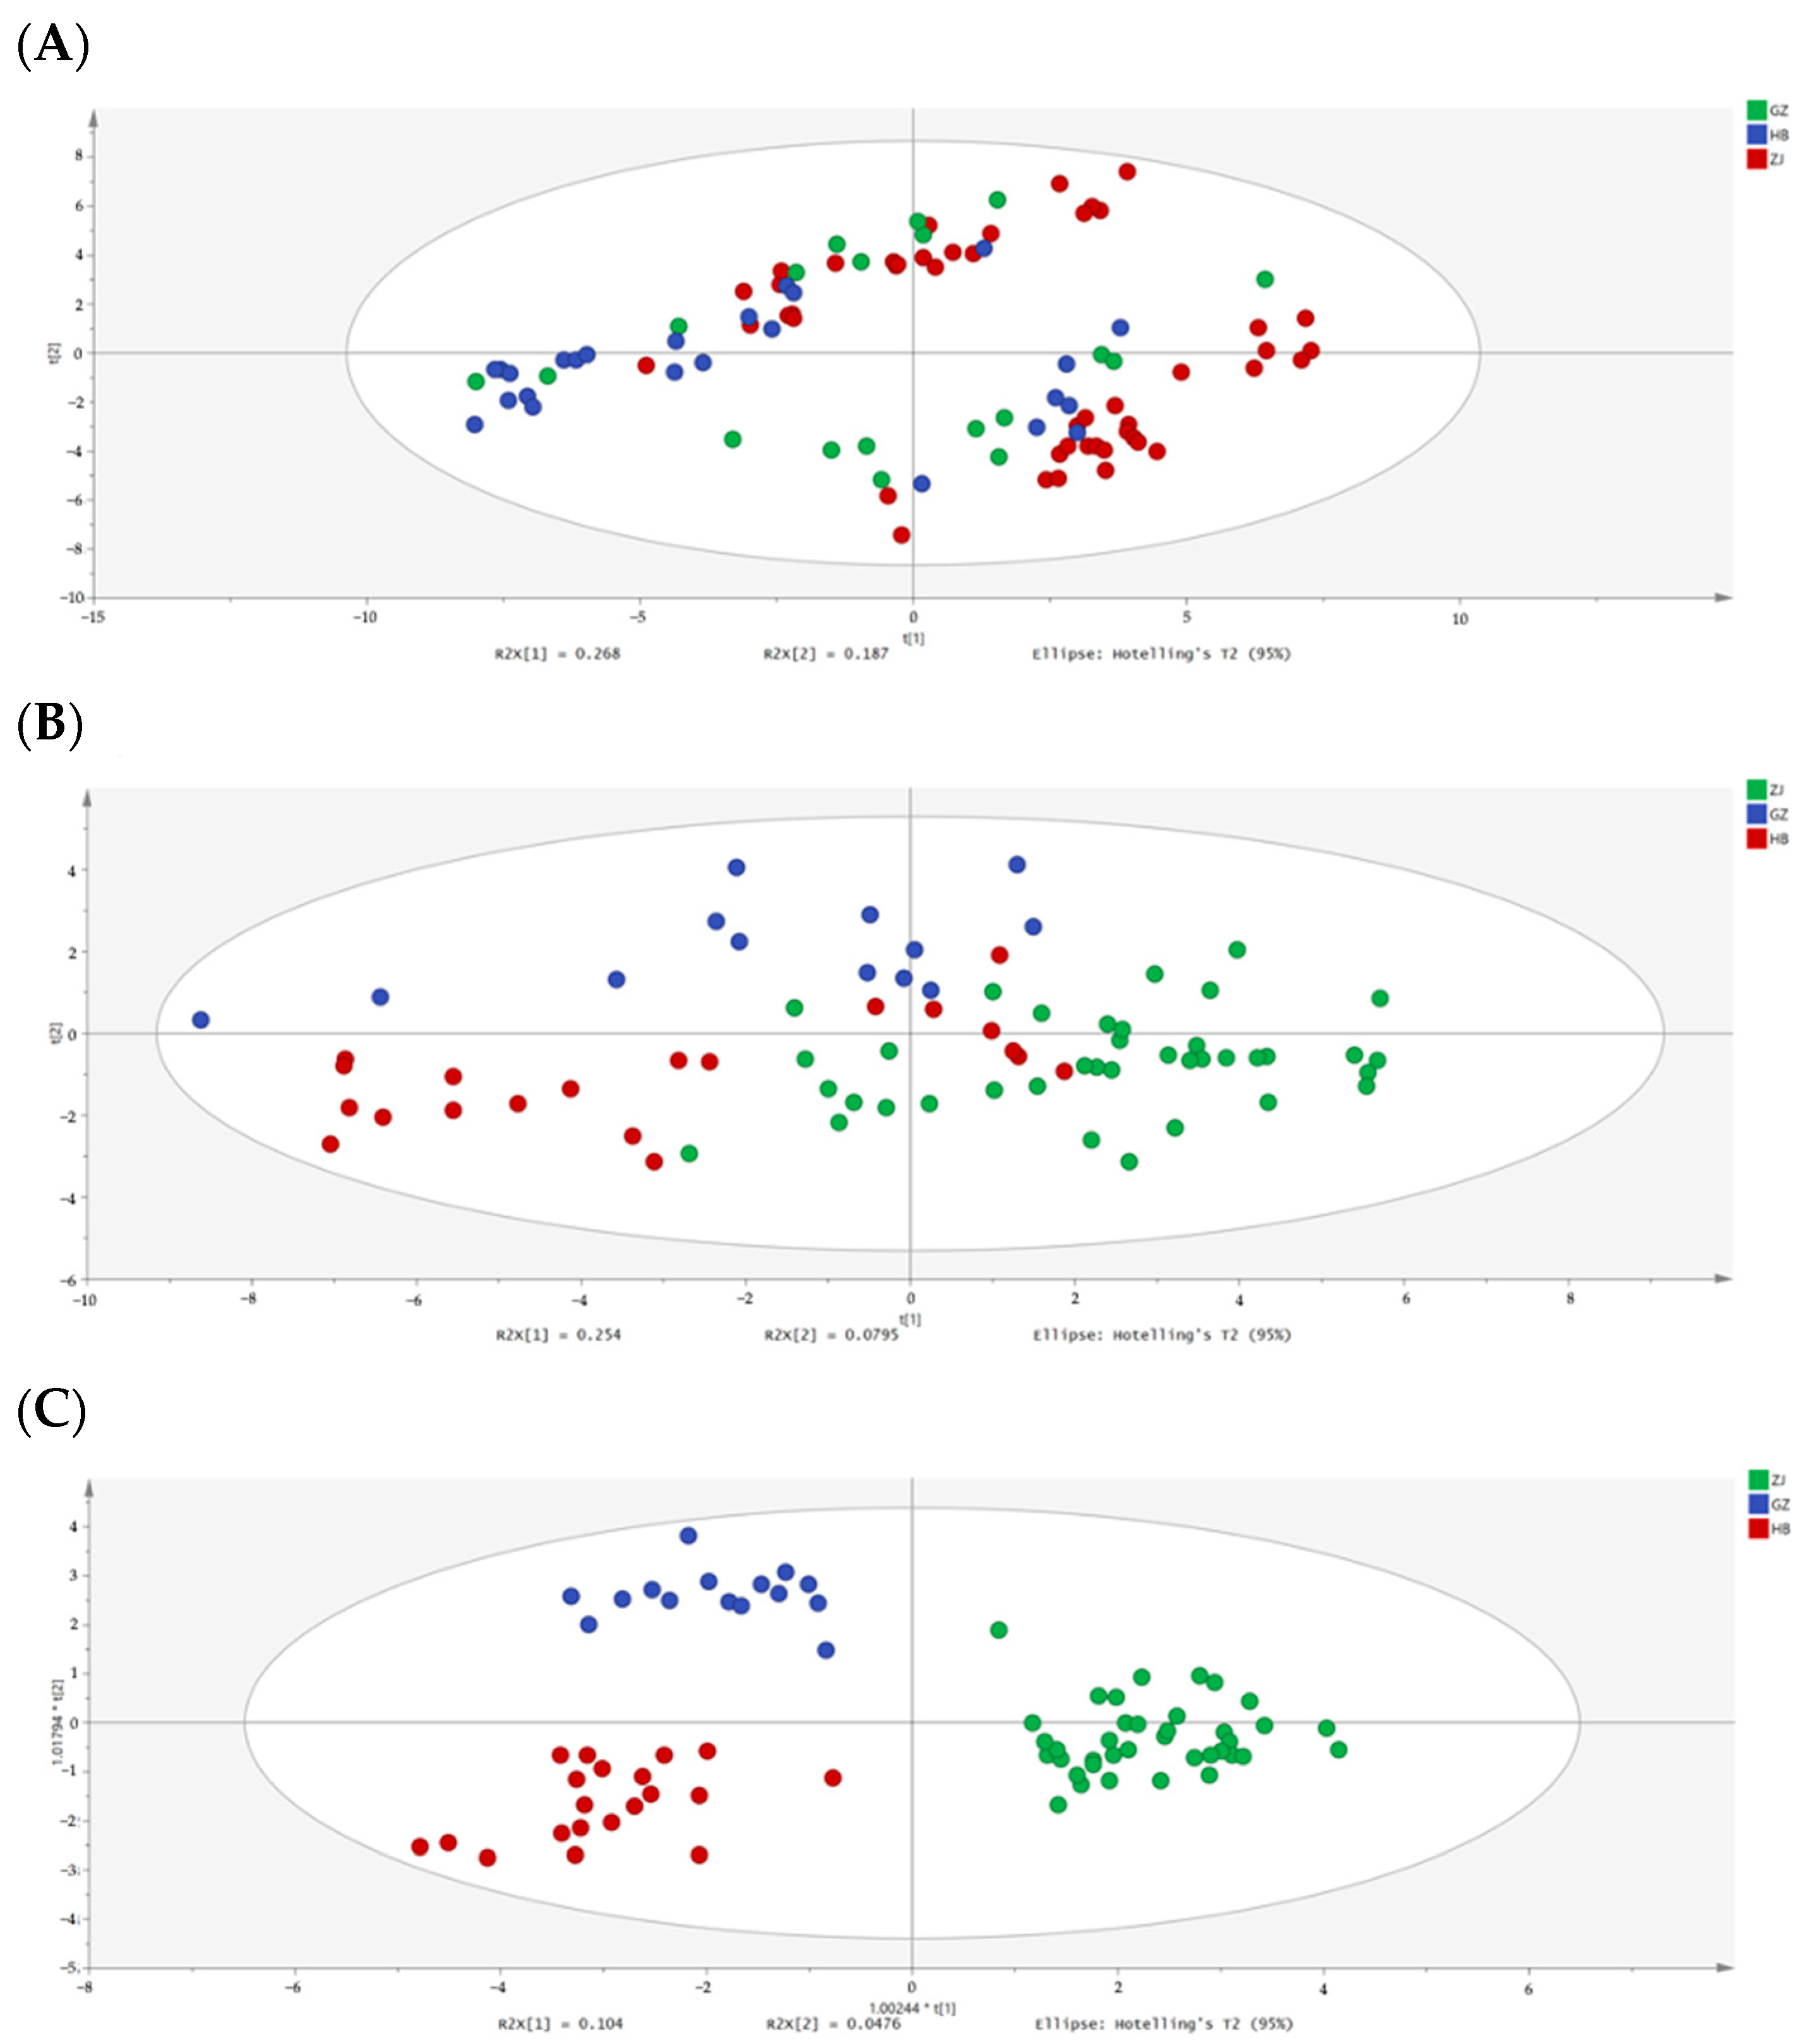
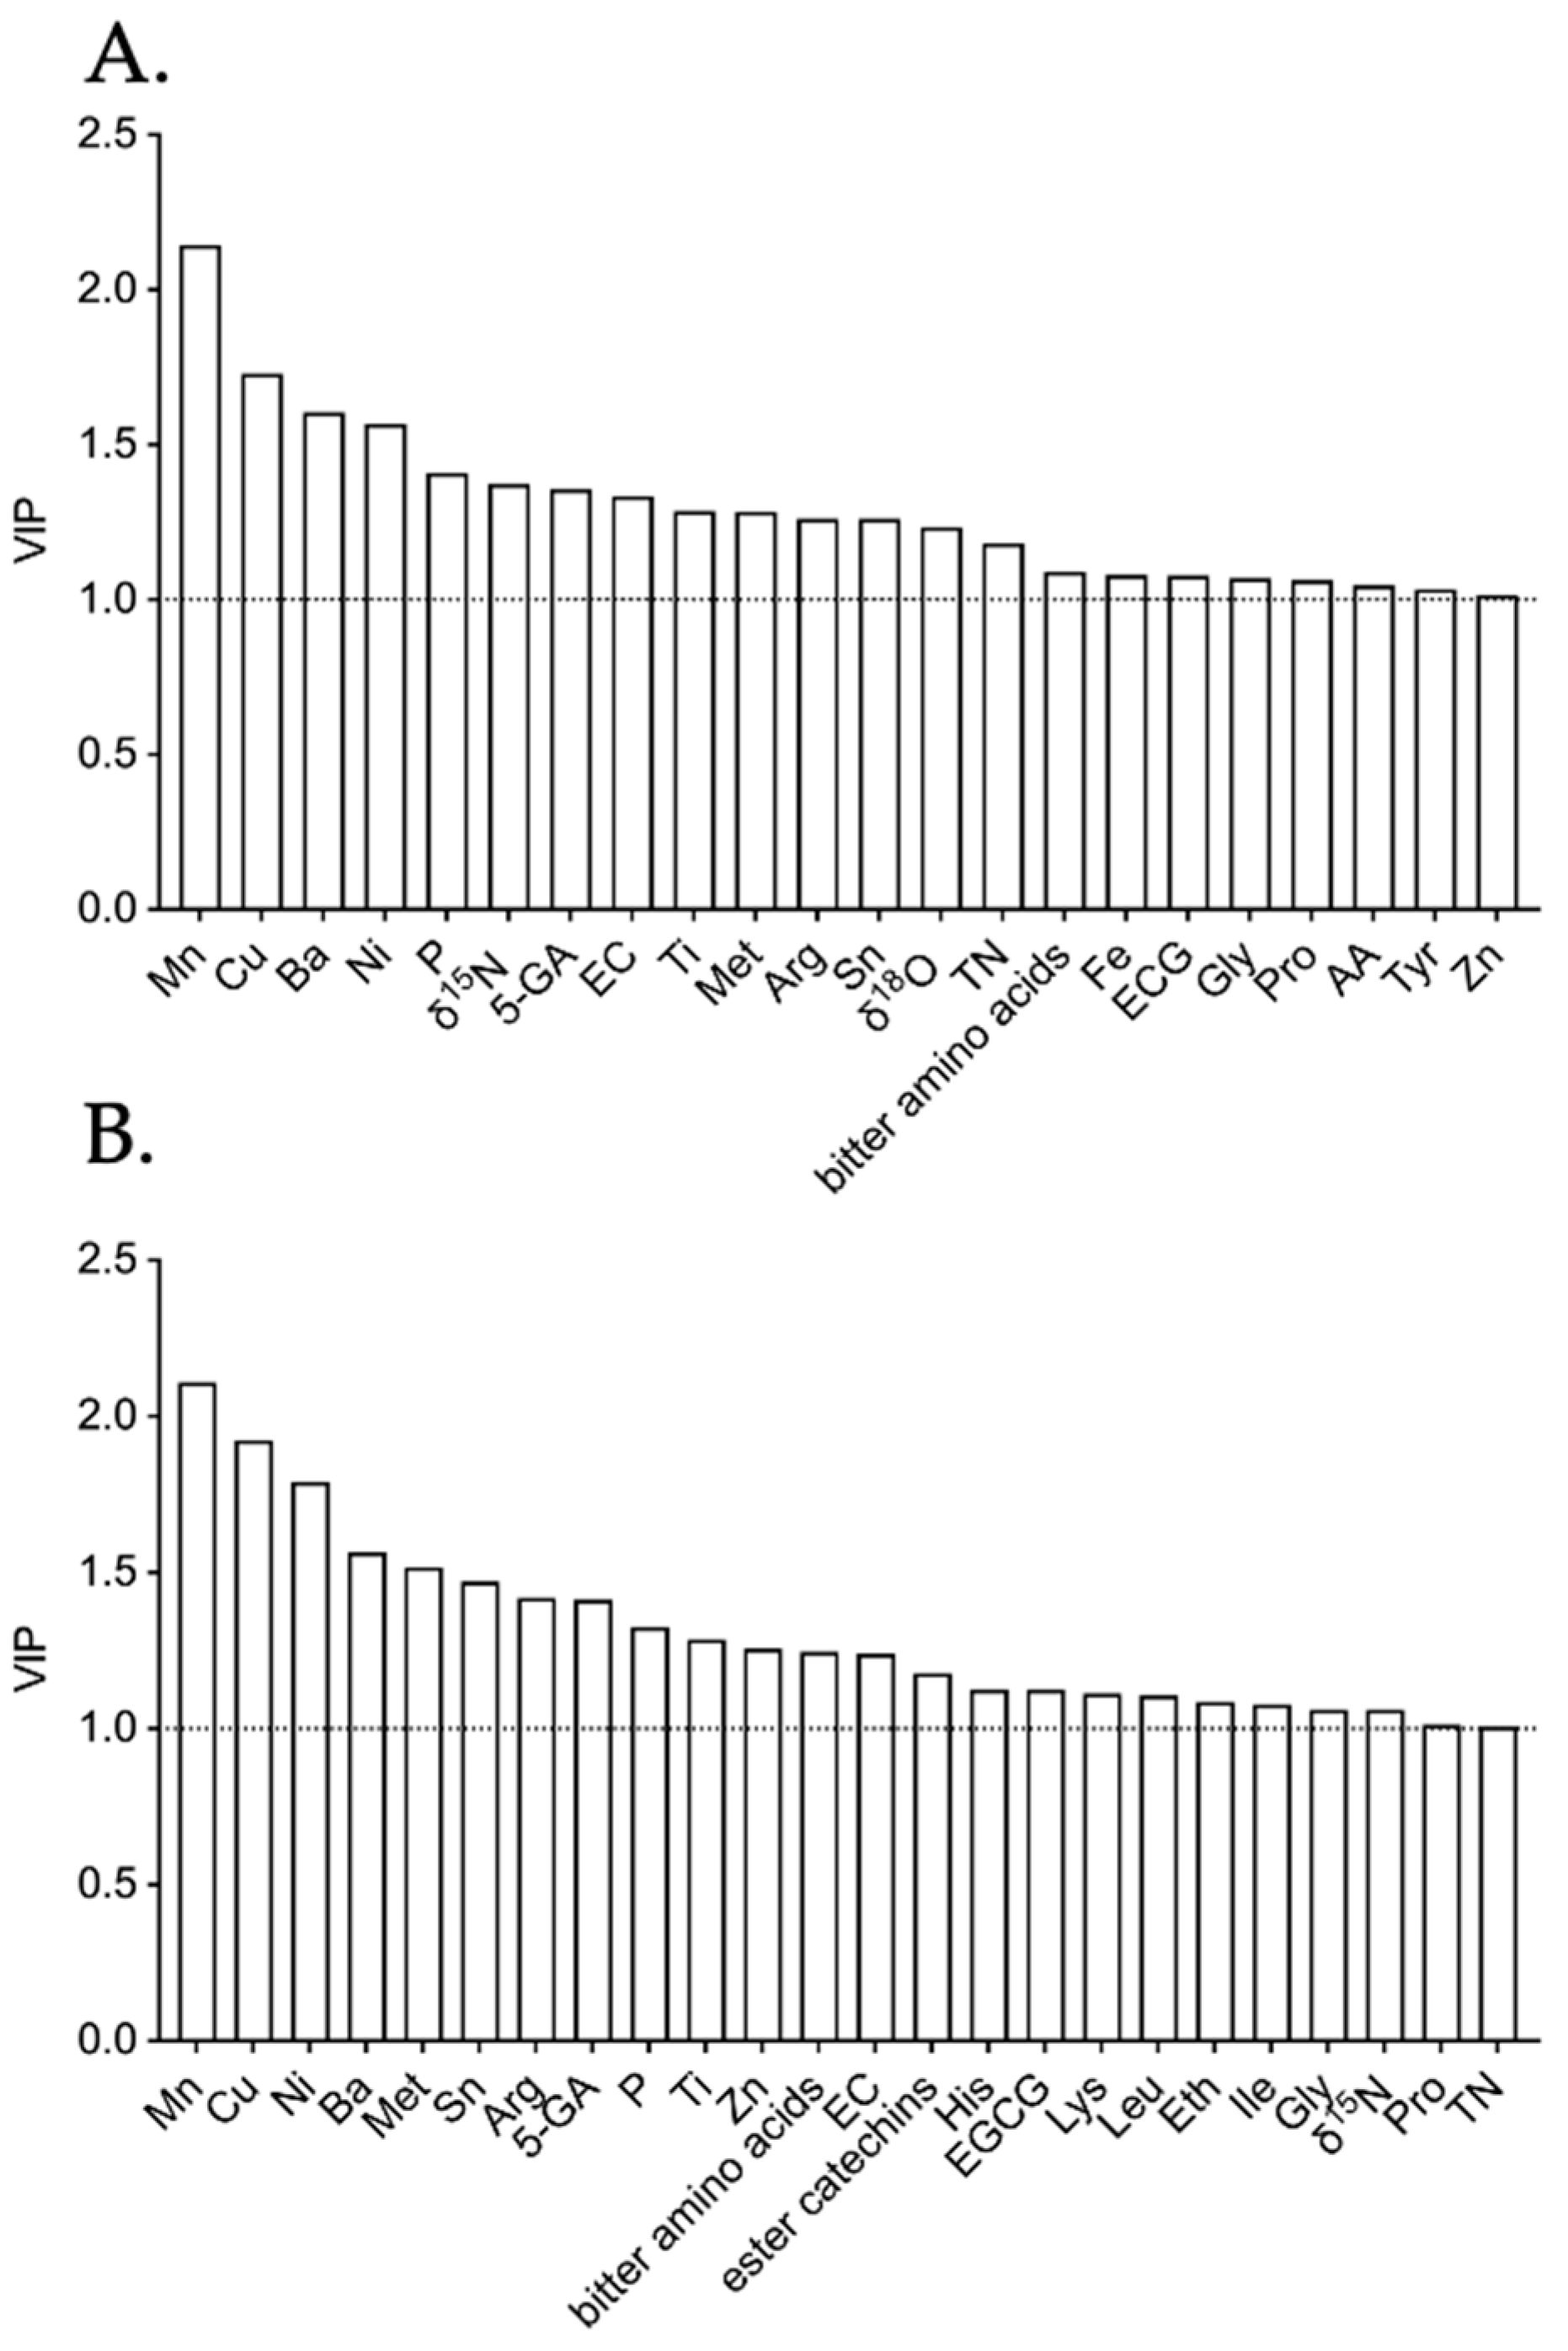
3.5. Chemometric Analysis to Distinguish the WLT Samples of Different Origins

PCA is an unsupervised model that converts a set of correlated variables into a set of uncorrelated principal components (PCs). PCs explain the most likely amount of data variation and provide a comprehensive visualization of the data [41,42]. PCA was used to analyze samples from three provinces, and the results are shown in Figure 1A and Figure S1A. The first two PCs explained 26.8% and 18.7% of the total variance, respectively, with a cumulative variance contribution of 45.6%. C, EGCG, ester amino acids, CAF, TC, non-galloylated catechins, B, Sn, GC, and Fe exhibited more positive effect values in PC1. In order to analyze tea samples from two countries in Zhejiang province, PCA demonstrated that the first two PCs explained 31.2% and 23.2% of the total variance, respectively, with a cumulative variance contribution of 54.4%. Fe, CAF, δ 13C, EGCG, ester catechins, umami amino acids, TC, B, Glu, Ala, Asp, Thea, Asp, Gln, 5-GA, C, Eth, Thr, Ser, sweet amino acids, and GA exhibited more positive effect values in PC1. The results suggested that free amino acids were the main primary components, suggesting that amino acid fractions contribute to the quality of tea leaves in different counties. However, because PCA is an unsupervised model, tea samples of different origins extensively overlapped without obvious clustering based on the score plot of PC1 versus PC2.
Supervised PLS-DA can ignore random errors and make the data analysis more focused and accurate. PLS-DA showed a better separation of the 74 samples from ZJ, HB, and GZ than PCA. The fit index (R2Y) of the PLS-DA model was 0.707, and the model prediction index (Q2) was 0.536, indicating good predictive ability of the model. The PLS-DA model identified 22 indicators with variable importance in projection (VIP) values > 1, namely Mn, Cu, Ba, Ni, δ 15N, P, 5-GA, EC, Ti, Met, Met, Arg, Sn, δ 18O, N, bitter amino acids, Fe, ECG, Gly, Pro, AA, Tyr, and Zn. PLS-DA was performed on samples from different counties in ZJ, resulting in better separation of the samples. The fit index (R2Y) of the PLS-DA model was 0.939, and the model prediction index (Q2) was 0.788, demonstrating good predictive ability. The model identified 25 indicators with VIP values greater than 1, including GC, 5-GA, N, Cr, Co, Ser, sweet amino acid, Bi, Ala, Ni, Glu, P, Thr, non-galloylated catechins, GCG, Mn, His, K, TC, Thea, Umami amino acid, Al, Val, Gln, and Zn. In addition, the intercepts of Q2 on the y-axis of the above models were less than 0 after 200 permutation tests, which indicated the reliability and robustness of the models (Figure S2A,B).
OPLS-DA is a supervised multivariate projection method that combines orthogonal signal correction (OSC) and PLS-DA to perform the correlation and discriminant analyses. Compared with PLS-DA, OPLS-DA has more interpretive power and could more accurately filter out the between-group differences. In this study, OPLS-DA was conducted on 56 indicators from 75 samples from different provinces. The WLT samples from different provinces were successfully divided into three clustering regions based on t1 versus t2 (Figure 1C, Figure S1C), with ZJ samples clearly separated from the other samples. The OPLS-DA model exhibited a fit index (R2Y) of 0.861 and a model prediction index (Q2) of 0.68, indicating excellent predictive ability. The reliability of the model was confirmed through the permutation test that was repeated 200 times (the intercept of Q2 was negative) (Figure S2C,D). OPLS-DA revealed 24 variables with VIP values greater than 1, including Mn, Cu, Ni, Ba, Met, Sn, Arg, 5-GA, P, Ti, Zn, bitter amino acid, EC, ester catechins, His, EGCG, Lys, leu, Eth, Ile, Gly, δ 15N, Pro, and TN (Figure 2B). Further, OPLS-DA was performed on the samples from different counties in Zhejiang Province, successfully dividing the tea samples into two regions based on their origins indicated by the model scoring map. The fit index (R2Y) of the dependent variable in OPLS-DA was 0.973, and the model prediction index (Q2) was 0.864, indicating good model prediction. The intercept of Q2 on the y-axis was less than 0, confirmed using the permutation test that was repeated 200 times, which indicated that the model was not overfitted and was robust. Twenty-seven variables with VIP values greater than 1 (GC, 5-GA, N, Cr, Ser, Sweet amino acid, Ni, Glu, Bi, P, Ala, GCG, non-galloylated catechins, K, Thr, Co, Al, Thea, Umami amino acid, Eth, TC, Val, Mn, Gly, Zn, His, and Gln) were identified, which significantly contributed to the model and, thus, can be considered key variables (Figure S3B).
The accuracy and reliability of PLS-DA and OPLS-DA models were verified using the training and test sets. Both PLS-DA and OPLS-DA models achieved high total accuracies for both training (98.65%) and test (100%) sets (Table 3). Similar high total accuracies were obtained for the analysis of tea samples from different counties in Zhejiang Province (Table S5).

4. Conclusions

In this study, white leaf tea samples from different provinces and counties in China were analyzed using HPLC, ICP-AES/MS, and EA-IRMS methods, which revealed the contents of 32 biochemical components, 22 mineral elements, and 3 stable isotope ratios in the samples. The levels of fresh amino acids, such as Gly and GABA, in green tea from HB were high, which may be due to the altitude conditions in the tea-growing region. The content of mineral elements also differed among the WLT samples. The highest content of Mn in the samples from GZ and the highest content of Cu in the samples from HB may be related to the distribution of mineral resources in each province. δ 13C values were negatively correlated with precipitation, and the δ 13C and δ 15N values were higher in the samples from HB, indicating the influence of local agricultural practices and climate change. δ 18O values were higher in the samples from ZJ, which could be attributed to the local climate. Moreover, correlation analysis revealed the significant impact of soil environment on the biochemical composition and mineral element content of tea leaves while climate change had certain effects on the stable isotope ratios of tea leaves from different geographical locations.
In summary, WLT samples were used as the research object to distinguish their origins (provinces and counties) based on their biochemical composition, mineral element contents, and stable isotope characteristics, combined with PCA, PLS-DA, and OPLS-DA. The OPLS-DA method achieved an origin discrimination accuracy of up to 90%. Key indicators for discriminating green tea from different provinces included Mg, Cu, Ni, Ba, Sn, Met, EC, TN, δ 15N, bitter amino acids, Pro, 5-GA, Arg, Ti, Zn, and Gly. To discriminate WLT from different counties in ZJ Province, key indicators included GC, 5-GA, TN, Cr, Ser, sweet amino acids, Bi, Glu, P, non-galloyated catechins, Ala, GCG, Thr, K, Co, Ni, Thea, Umami amino acids, Val, and Gln. However, further optimization of the origin differentiation method may be required as the characteristics of WLT of different origins may be influenced by factors, such as tree age and altitude. Additionally, to improve the accuracy and reliability of the differentiation method, variables need to be controlled, and tea samples from different years should be collected.

Supplementary Materials

The following supporting information can be downloaded at: https://www.mdpi.com/article/10.3390/agronomy13102526/s1, Figure S1: Analysis on differential white leaf tea origin classification; Figure S2: Permutation tests of the partial least squares discriminant analysis models; Figure S3: Variable importance plots; Table S1: Detailed information of green tea samples in the study; Table S2: Correlation analysis between soil factors and biochemical composition of tea samples; Table S3: Correlation analysis between soil factors and mineral elements of tea; Table S4: Correlations analysis between stable isotopes with meteorological factors; Table S5: Predictive abilities of the partial least squares discriminant analysis and orthogonal projections to latent structure-discriminant analysis models in discriminating different counties of WLT.

Author Contributions

Conceptualization, X.C.; methodology, Y.B. and P.Z.; validation, K.N.; formal analysis, M.T.; investigation, P.Z.; resources, X.C., Y.B. and J.L.; data curation, Z.F.; writing—original draft preparation, M.T.; writing—review and editing, K.N. and Y.S.; visualization, M.T.; supervision, J.L.; project administration, Y.S.; funding acquisition, Y.S. All authors have read and agreed to the published version of the manuscript.

Funding

This study was funded by the National Key Research and Development Program of China (2022YFF0606802); Crop Varietal Improvement and Insect Pests Control by Nuclear Radiation; the Earmarked Fund for CARS (CARS-19).

Data Availability Statement

The data presented in this study are available on request from the corresponding author. The data are not publicly available due to privacy.

Conflicts of Interest

The authors declare no conflict of interest.

References

  1. Dufresne, C.J.; Farnworth, E.R. A Review of Latest Research Findings on the Health Promotion Properties of Tea. J. Nutr. Biochem. 2001, 12, 404–421. [Google Scholar] [CrossRef]
  2. Song, M.; Li, Q.; Guan, X.; Wang, T.; Bi, K. Novel HPLC Method to Evaluate the Quality and Identify the Origins of Longjing Green Tea. Anal. Lett. 2013, 46, 60–73. [Google Scholar] [CrossRef]
  3. Zhao, H.; Yu, C.; Li, M. Effects of Geographical Origin, Variety, Season and Their Interactions on Minerals in Tea for Traceability. J. Food Compos. Anal. 2017, 63, 15–20. [Google Scholar] [CrossRef]
  4. Zhou, G.; Zhu, L.; Ren, T.; Zhang, L.; Gu, J. Geochemical Characteristics Affecting the Cultivation and Quality of Longjing Tea. J. Geochem. Explor. 1995, 55, 183–191. [Google Scholar] [CrossRef]
  5. Mao, Q.; Lu, X.; Zhou, K.; Chen, H.; Zhu, X.; Mori, T.; Mo, J. Effects of Long-Term Nitrogen and Phosphorus Additions on Soil Acidification in an N-Rich Tropical Forest. Geoderma 2017, 285, 57–63. [Google Scholar] [CrossRef]
  6. Ye, J.H.; Chen, X.T.; Liu, G.Y.; Jia, X.L.; Zhang, Q.; Zhu, C.L.; Wang, Y.H.; Jia, M.; Wang, H.B. Effect of Tea Soil Acidification on the Diversity and Function of Fungi Community. J. Appl. Bot. Food Qual. 2021, 94, 199–205. [Google Scholar] [CrossRef]
  7. Lin, Z.-H.; Qi, Y.-P.; Chen, R.-B.; Zhang, F.-Z.; Chen, L.-S. Effects of Phosphorus Supply on the Quality of Green Tea. Food Chem. 2012, 130, 908–914. [Google Scholar] [CrossRef]
  8. Wang, Z.; Geng, Y.; Liang, T. Optimization of Reduced Chemical Fertilizer Use in Tea Gardens Based on the Assessment of Related Environmental and Economic Benefits. Sci. Total Environ. 2020, 713, 136439. [Google Scholar] [CrossRef]
  9. Huang, W.; Lin, M.; Liao, J.; Li, A.; Tsewang, W.; Chen, X.; Sun, B.; Liu, S.; Zheng, P. Effects of Potassium Deficiency on the Growth of Tea (Camelia Sinensis) and Strategies for Optimizing Potassium Levels in Soil: A Critical Review. Horticulturae 2022, 8, 660. [Google Scholar] [CrossRef]
  10. He, D.; Chen, X.; Zhang, Y.; Huang, Z.; Yin, J.; Weng, X.; Yang, W.; Wu, H.; Zhang, F.; Wu, L. Magnesium Is a Nutritional Tool for the Yield and Quality of Oolong Tea (Camellia sinensis L.) and Reduces Reactive Nitrogen Loss. Sci. Hortic. 2023, 308, 111590. [Google Scholar] [CrossRef]
  11. Sun, L.; Zhang, M.; Liu, X.; Mao, Q.; Shi, C.; Kochian, L.V.; Liao, H. Aluminium Is Essential for Root Growth and Development of Tea Plants (Camellia sinensis). J. Integr. Plant Biol. 2020, 62, 984–997. [Google Scholar] [CrossRef]
  12. Zaman, F.; Zhang, E.; Ihtisham, M.; Ilyas, M.; Khattak, W.A.; Guo, F.; Wang, P.; Wang, M.; Wang, Y.; Ni, D.; et al. Metabolic Profiling, Pigment Component Responses to Foliar Application of Fe, Zn, Cu, and Mn for Tea Plants (Camellia sinensis). Sci. Hortic. 2023, 319, 112149. [Google Scholar] [CrossRef]
  13. Zhang, Y.; Wang, Y.; Ding, Z.; Wang, H.; Song, L.; Jia, S.; Ma, D. Zinc Stress Affects Ionome and Metabolome in Tea Plants. Plant Physiol. Biochem. 2017, 111, 318–328. [Google Scholar] [CrossRef] [PubMed]
  14. Ghosh, P.; Brand, W.A. Stable Isotope Ratio Mass Spectrometry in Global Climate Change Research. Int. J. Mass Spectrom. 2003, 228, 1–33. [Google Scholar] [CrossRef]
  15. Xia, W.; Li, C.; Nie, J.; Shao, S.; Rogers, K.M.; Zhang, Y.; Li, Z.; Yuan, Y. Stable Isotope and Photosynthetic Response of Tea Grown under Different Temperature and Light Conditions. Food Chem. 2022, 368, 130771. [Google Scholar] [CrossRef]
  16. Long, W.; Bai, X.; Wang, S.; Chen, H.; Yin, X.-L.; Gu, H.-W.; Yang, J.; Fu, H. UHPLC-QTOF-MS-Based Untargeted Metabolomics and Mineral Element Analysis Insight into the Geographical Differences of Chrysanthemum Morifolium Ramat Cv. “Hangbaiju” from Different Origins. Food Res. Int. 2022, 163, 112186. [Google Scholar] [CrossRef] [PubMed]
  17. Ning, J.; Cao, Q.; Su, H.; Zhu, X.; Wang, K.; Wan, X.; Zhang, Z. Discrimination of Six Tea Categories Coming from Different Origins Depending on Polyphenols, Caffeine, and Theanine Combined with Different Discriminant Analysis. Int. J. Food Prop. 2017, 20, 1838–1847. [Google Scholar] [CrossRef]
  18. Kanrar, B.; Kundu, S.; Khan, P.; Jain, V. Elemental Profiling for Discrimination of Geographical Origin of Tea (Camellia sinensis) in North-East Region of India by ICP-MS Coupled with Chemometric Techniques. Food Chem. Adv. 2022, 1, 100073. [Google Scholar] [CrossRef]
  19. Liu, Z.; Yuan, Y.; Zhang, Y.; Shi, Y.; Hu, G.; Zhu, J.; Rogers, K.M. Geographical Traceability of Chinese Green Tea Using Stable Isotope and Multi-Element Chemometrics. Rapid Commun. Mass Spectrom. 2019, 33, 778–788. [Google Scholar] [CrossRef]
  20. Xiong, F.; Yuan, Y.; Li, C.; Lyu, C.; Wan, X.; Nie, J.; Li, H.; Yang, J.; Guo, L. Stable Isotopic and Elemental Characteristics with Chemometrics for the Geographical Origin Authentication of Dendrobium Officinale at Two Spatial Scales. LWT 2022, 167, 113871. [Google Scholar] [CrossRef]
  21. Wang, Z.; Gan, S.; Sun, W.; Chen, Z. Quality Characteristics of Oolong Tea Products in Different Regions and the Contribution of Thirteen Phytochemical Components to Its Taste. Horticulturae 2022, 8, 278. [Google Scholar] [CrossRef]
  22. Fang, S.; Huang, W.-J.; Wei, Y.; Tao, M.; Hu, X.; Li, T.; Kalkhajeh, Y.K.; Deng, W.-W.; Ning, J. Geographical Origin Traceability of Keemun Black Tea Based on Its Non-Volatile Composition Combined with Chemometrics. J. Sci. Food Agric. 2019, 99, 6937–6943. [Google Scholar] [CrossRef] [PubMed]
  23. Shao, S.; Xu, M.; Liao, X.; Luo, Q.; Lin, Y.; Wang, P.; Fang, D.; Huang, Y.; Jin, S.; Ye, N. Production Regions Discrimination of Huangguanyin Oolong Tea by Using the Content of Chemical Components and Rare Earth Elements. Food Res. Int. 2023, 165, 112522. [Google Scholar] [CrossRef] [PubMed]
  24. Lou, Y.; Fu, X.; Yu, X.; Ye, Z.; Cui, H.; Zhang, Y. Stable Isotope Ratio and Elemental Profile Combined with Support Vector Machine for Provenance Discrimination of Oolong Tea (Wuyi-Rock Tea). J. Anal. Methods Chem. 2017, 2017, e5454231. [Google Scholar] [CrossRef] [PubMed]
  25. Wang, Y.; Kang, L.; Zhao, Y.; Xiong, F.; Yuan, Y.; Nie, J.; Huang, L.; Yang, J. Stable Isotope and Multi-Element Profiling of Cassiae Semen Tea Combined with Chemometrics for Geographical Discrimination. J. Food Compos. Anal. 2022, 107, 104359. [Google Scholar] [CrossRef]
  26. Sikora, F.J.; Howe, P.S.; Hill, L.E.; Reid, D.C.; Harover, D.E. Comparison of Colorimetric and ICP Determination of Phosphorus in Mehlich3 Soil Extracts. Commun. Soil Sci. Plant Anal. 2005, 36, 875–887. [Google Scholar] [CrossRef]
  27. Cao, Q.-Q.; Fu, Y.-Q.; Liu, Y.-Y.; Qin, Y.; Chen, J.-X.; Yin, J.-F.; Xu, Y.-Q. A Targeted and Nontargeted Metabolomics Study on the Oral Processing of Epicatechins from Green Tea. Food Chem. 2022, 378, 132129. [Google Scholar] [CrossRef]
  28. Pons, J.; Bedmar, À.; Núñez, N.; Saurina, J.; Núñez, O. Tea and Chicory Extract Characterization, Classification and Authentication by Non-Targeted HPLC-UV-FLD Fingerprinting and Chemometrics. Foods 2021, 10, 2935. [Google Scholar] [CrossRef]
  29. Shuai, M.; Peng, C.; Niu, H.; Shao, D.; Hou, R.; Cai, H. Recent Techniques for the Authentication of the Geographical Origin of Tea Leaves from Camellia sinensis: A Review. Food Chem. 2022, 374, 131713. [Google Scholar] [CrossRef]
  30. Vogel, J.C. Fractionation of the Carbon Isotopes During Photosynthesis. In Proceedings of the Fractionation of the Carbon Isotopes during Photosynthesis; Vogel, J.C., Ed.; Springer: Berlin/Heidelberg, Germany, 1980; pp. 5–29. [Google Scholar]
  31. Bateman, A.S.; Kelly, S.D.; Jickells, T.D. Nitrogen Isotope Relationships between Crops and Fertilizer:  Implications for Using Nitrogen Isotope Analysis as an Indicator of Agricultural Regime. J. Agric. Food Chem. 2005, 53, 5760–5765. [Google Scholar] [CrossRef]
  32. Ye, J.; Zhang, Q.; Liu, G.; Lin, L.; Wang, H.; Lin, S.; Wang, Y.; Wang, Y.; Zhang, Q.; Jia, X.; et al. Relationship of Soil PH Value and Soil Pb Bio-Availability and Pb Enrichment in Tea Leaves. J. Sci. Food Agric. 2022, 102, 1137–1145. [Google Scholar] [CrossRef] [PubMed]
  33. Zhou, Z.; Liu, Y.; Zhang, L.; Xu, R.; Liao, H. Soil nutrient status in Wuyi tea region and its effects on tea quality-related constituents. Sci. Agric. Sinca 2019, 52, 1425–1434. [Google Scholar] [CrossRef]
  34. Liu, Z.; Yang, D.; Zhang, G.; Zheng, L.; Chen, C.; Sun, X.; Yu, F. Effects of Soil Physical and Chemical Properties on the Quality of Nanjing “Yuhua” Tea, a Type of Famous Green Tea. Horticulturae 2023, 9, 189. [Google Scholar] [CrossRef]
  35. He, Y.; Sun, Q.; Zhang, X.; Bao, X.; Wang, Y.; Rasheed, M.; Guo, B. Authentication of the Geographical Origin of Maca (Lepidium Meyenii Walp.) at Different Regional Scales Using the Stable Isotope Ratio and Mineral Elemental Fingerprints. Food Chem. 2020, 311, 126058. [Google Scholar] [CrossRef] [PubMed]
  36. Zhao, H.; Yang, Q. Study on Influence Factors and Sources of Mineral Elements in Peanut Kernels for Authenticity. Food Chem. 2022, 382, 132385. [Google Scholar] [CrossRef] [PubMed]
  37. Liu, W.; Chen, Y.; Liao, R.; Zhao, J.; Yang, H.; Wang, F. Authentication of the Geographical Origin of Guizhou Green Tea Using Stable Isotope and Mineral Element Signatures Combined with Chemometric Analysis. Food Control 2021, 125, 107954. [Google Scholar] [CrossRef]
  38. Xin-Li, C.; Mian-Jia, H.; Xing-Yu, J.; Xin-Guo, L.I.; Kai-Bing, Z.; Man-Xi, Z. Effects of Boron Deficiency on the Uptake of Mineral Elements and pH Value of Leaves in Cherry Radish. Acta Hortic. Sin. 2015, 42, 785–790. [Google Scholar] [CrossRef]
  39. Liu, Y.; Dai, M.; Bao, W.Z.; Huang, B.S.; Liu, D.H. Content characteristics of mineral elements and its correlation with soil nutrients and effective components in Chrysanthemum morifolium from different producing areas in Macheng. China J. Chin. Mater. Medica 2021, 46, 281–289. [Google Scholar] [CrossRef]
  40. Kahmen, A.; Sachse, D.; Arndt, S.K.; Tu, K.P.; Farrington, H.; Vitousek, P.M.; Dawson, T.E. Cellulose Δ18O Is an Index of Leaf-to-Air Vapor Pressure Difference (VPD) in Tropical Plants. Proc. Natl. Acad. Sci. USA 2011, 108, 1981–1986. [Google Scholar] [CrossRef] [PubMed]
  41. Gong, H.; Rehman, F.; Li, Z.; Liu, J.; Yang, T.; Liu, J.; Li, H.; Hu, Z.; Ma, Q.; Wu, Z.; et al. Discrimination of Geographical Origins of Wolfberry (Lycium Barbarum L.) Fruits Using Stable Isotopes, Earth Elements, Free Amino Acids, and Saccharides. J. Agric. Food Chem. 2022, 70, 2984–2997. [Google Scholar] [CrossRef]
  42. Park, J.H.; Choi, S.-H.; Bong, Y.-S. Geographical Origin Authentication of Onions Using Stable Isotope Ratio and Compositions of C, H, O, N, and S. Food Control 2019, 101, 121–125. [Google Scholar] [CrossRef]
Figure 1. Analysis of differential white leaf tea origin classification. (A) Principal component analysis score plot for three provinces; (B) partial least squares discriminant analysis score plot for three provinces; (C) orthogonal projections to latent structure-discriminant analysis score plot for three provinces.
Agronomy 13 02526 g001
Figure 2. The variable importance in projection for (A) partial least squares discriminant analysis model, (B) orthogonal projections to latent structure-discriminant analysis model in discriminating white leaf tea from different provinces.
Agronomy 13 02526 g002
Table 1. Mean and standard deviation of the biochemical compositions in white leaf tea samples of different geographical origins.
VariablesDifferent Counties in Zhejiang ProvinceDifferent Province
ZJAJZJSYZJGZHB
GA (mg/g)0.52 ± 0.13 A0.46 ± 0.20 A0.49 ± 0.16 b0.69 ± 0.55 a0.48 ± 0.21 b
5-GA (mg/g)9.36 ± 1.94 A6.05 ± 1.63 B7.98 ± 2.44 a4.96 ± 1.69 c6.67 ± 1.35 b
GC (mg/g)2.69 ± 0.50 B4.28 ± 1.01 A3.35 ± 1.09 a2.70 ± 0.77 b2.65 ± 0.55 b
C (mg/g)16.67 ± 13.25 A28.04 ± 26.10 A21.40 ± 20.21 a8.69 ± 8.06 b10.94 ± 13.44 b
EC (mg/g)7.87 ± 2.05 A8.49 ± 3.36 A8.13 ± 2.66 a5.18 ± 3.56 b8.00 ± 1.69 a
ECG (mg/g)4.62 ± 2.00 A5.71 ± 1.45 A5.07 ± 1.86 a3.71 ± 2.67 b5.32 ± 1.97 a
EGCG (mg/g)77.20 ± 32.24 A76.33 ± 38.73 A76.84 ± 34.70 a48.35 ± 18.70 b50.75 ± 15.62 b
GCG (mg/g)1.00 ± 0.28 B1.86 ± 1.19 A1.35 ± 0.90 a1.14 ± 0.29 a1.26 ± 0.40 a
CAF (mg/g)45.32 ± 12.56 A44.59 ± 14.36 A45.01 ± 13.20 a38.08 ± 8.82 b35.48 ± 6.42 b
EGC (mg/g)11.41 ± 7.82 A16.17 ± 9.22 A13.39 ± 8.66 a14.65 ± 12.16 a14.39 ± 7.56 a
CQI1284.77 ± 975.42 A1073.04 ± 1663.30 A1196.55 ± 1294.64 a1508.58 ± 2077.38 a726.66 ± 760.22 a
CAI5.03 ± 2.12 A4.29 ± 2.21 A4.72 ± 2.16 a5.57 ± 1.98 a5.33 ± 2.19 a
ester catechins (mg/g)81.82 ± 30.62 A82.05 ± 38.30 A81.91 ± 33.64 a52.06 ± 18.06 b56.07 ± 15.27 b
non-galloylated catechins (mg/g)38.63 ± 10.16 B56.98 ± 22.77 A46.28 ± 18.77 a31.23 ± 13.22 b35.98 ± 10.87 b
His (mg/g)0.11 ± 0.05 A0.06 ± 0.05 B0.09 ± 0.06 b0.16 ± 0.11 a0.19 ± 0.11 a
Ser (mg/g)0.76 ± 0.27 A0.43 ± 0.23 B0.62 ± 0.30 b0.86 ± 0.53 a0.86 ± 0.27 a
Gln (mg/g)2.19 ± 1.29 A1.41 ± 0.90 B1.87 ± 1.20 a1.82 ± 1.26 a2.37 ± 1.44 a
Arg (mg/g)0.51 ± 0.57 A0.57 ± 1.02 A0.53 ± 0.78 b0.62 ± 0.73 b2.42 ± 2.11 a
Gly (mg/g)0.08 ± 0.02 A0.06 ± 0.02 B0.07 ± 0.02 b0.09 ± 0.04 b0.11 ± 0.03 a
Asp (mg/g)1.34 ± 0.59 A1.13 ± 0.56 A1.25 ± 0.58 b1.55 ± 0.67 ab1.81 ± 0.73 a
Glu (mg/g)2.23 ± 1.03 A1.18 ± 0.54 B1.79 ± 1.00 b1.72 ± 0.77 b2.49 ± 1.07 a
Thr (mg/g)0.31 ± 0.09 A0.20 ± 0.11 B0.26 ± 0.11 b0.31 ± 0.16 ab0.37 ± 0.09 a
Ala (mg/g)0.43 ± 0.18 A0.23 ± 0.12 B0.34 ± 0.19 b0.40 ± 0.18 ab0.44 ± 0.13 a
GABA (mg/g)0.79 ± 0.55 A0.51 ± 0.50 A0.67 ± 0.54 b0.92 ± 0.68 b1.24 ± 0.64 a
Eth (mg/g)0.28 ± 0.11 A0.18 ± 0.08 B0.24 ± 0.11 b0.20 ± 0.09 b0.32 ± 0.15 a
Thea (mg/g)14.68 ± 4.84 A9.43 ± 4.70 B12.49 ± 5.41 b12.83 ± 5.29 b17.70 ± 5.72 a
Pro (mg/g)0.14 ± 0.06 A0.11 ± 0.08 A0.13 ± 0.07 b0.22 ± 0.19 a0.18 ± 0.10 ab
Cys (mg/g)0.05 ± 0.03 A0.06 ± 0.02 A0.06 ± 0.02 b0.08 ± 0.04 a0.08 ± 0.04 a
Lys (mg/g)0.32 ± 0.11 A0.33 ± 0.19 A0.33 ± 0.15 b0.52 ± 0.39 a0.58 ± 0.26 a
Tyr (mg/g)0.34 ± 0.16 A0.32 ± 0.16 A0.33 ± 0.16 b0.45 ± 0.26 a0.40 ± 0.16 ab
Met (mg/g)0.16 ± 0.09 A0.11 ± 0.08 A0.14 ± 0.09 b0.06 ± 0.07 c0.18 ± 0.09 a
Val (mg/g)0.67 ± 0.22 A0.47 ± 0.29 B0.59 ± 0.26 b0.82 ± 0.33 a0.80 ± 0.31 a
Ile (mg/g)0.17 ± 0.04 A0.16 ± 0.08 A0.17 ± 0.06 b0.25 ± 0.15 a0.24 ± 0.09 a
Leu (mg/g)0.19 ± 0.06 A0.17 ± 0.11 A0.18 ± 0.09 b0.28 ± 0.20 a0.31 ± 0.14 a
Phe (mg/g)0.40 ± 0.23 A0.49 ± 0.31 A0.44 ± 0.27 b0.76 ± 0.71 a0.66 ± 0.38 ab
Umami amino acids (mg/g)3.57 ± 1.59 A2.31 ± 0.98 B3.04 ± 1.49 b3.27 ± 1.37 b4.31 ± 1.69 a
sweet amino acids (mg/g)1.93 ± 0.53 A1.21 ± 0.57 B1.63 ± 0.65 b2.01 ± 0.98 a2.23 ± 0.56 a
bitter amino acids (mg/g)2.71 ± 1.08 A2.57 ± 1.89 A2.65 ± 1.46 c3.85 ± 2.29 b5.62 ± 3.03 a
AA (%)4.99 ± 0.87 A4.86 ± 2.43 A4.94 ± 1.68 a5.20 ± 1.85 a5.60 ± 1.55 a
Note: The values given indicate the mean ± standard deviation (n = 3). Uppercase letters represent significant differences among samples from different counties in Zhejiang Province and lowcase letters represent significant differences among samples in three provinces, at a p = 0.05 confidence level.
Table 2. Mean and standard deviation of the stable isotope ratios and the elemental contents in white leaf tea samples of different geographical origins.
VariablesDifferent Counties in Zhejiang ProvinceDifferent Province
ZJAJZJSYZJGZHB
Al (10 mg/kg)25.27 ± 5.53 B30.03 ± 8.06 A27.25 ± 7.03 b34.53 ± 12.65 a32.86 ± 7.33 a
B (mg/kg)12.84 ± 5.40 A11.15 ± 3.03 A12.14 ± 4.60 a11.73 ± 6.00 ab9.19 ± 4.36 b
Ba (mg/kg)8.56 ± 2.28 A10.44 ± 4.57 A9.34 ± 3.51 c12.96 ± 6.62 b18.75 ± 6.94 a
Ca (102 mg/kg)22.31 ± 3.78 A22.04 ± 4.47 A22.20 ± 4.04 a24.23 ± 5.01 a22.26 ± 5.54 a
Cd (mg/kg)0.13 ± 0.03 A0.12 ± 0.04 A0.13 ± 0.03 b0.16 ± 0.04 a0.15 ± 0.03 a
Co (mg/kg)0.46 ± 0.28 A0.16 ± 0.16 B0.33 ± 0.28 b0.52 ± 0.53 a0.34 ± 0.18 b
Cr (mg/kg)1.52 ± 0.29 B2.13 ± 0.60 A1.78 ± 0.54 a1.65 ± 0.63 a1.80 ± 1.06 a
Cu (mg/kg)11.23 ± 2.24 A10.61 ± 2.74 A10.97 ± 2.45 c13.92 ± 2.89 b17.10 ± 2.22 a
Fe (10 mg/kg)6.37 ± 4.97 A5.62 ± 4.71 A6.05 ± 4.83 a7.81 ± 6.75 a5.84 ± 8.11 a
K (103 mg/kg)18.50 ± 1.03 B19.75 ± 1.10 A19.02 ± 1.21 a18.78 ± 2.63 a18.53 ± 1.02 a
Mg (102 mg/kg)15.88 ± 1.76 A16.54 ± 1.55 A16.15 ± 1.69 a15.88 ± 2.82 a16.25 ± 1.82 a
Mn (10 mg/kg)79.40 ± 32.01 A52.39 ± 29.85 A68.15 ± 33.61 b138.34 ± 56.57 a63.42 ± 34.41 b
Na (mg/kg)23.71 ± 11.88 A16.10 ± 6.54 B20.54 ± 10.61 a18.86 ± 5.37 a19.88 ± 8.29 a
Ni (mg/kg)8.95 ± 1.99 A6.34 ± 1.98 B7.86 ± 2.36 c9.89 ± 3.17 b14.74 ± 4.17 a
P (102 mg/kg)54.23 ± 4.64 A49.00 ± 7.24 B52.05 ± 6.35 a45.40 ± 8.64 b53.07 ± 3.94 a
S (10 mg/kg)53.24 ± 2.09 A52.70 ± 3.56 A53.02 ± 2.78 b54.57 ± 7.98 b57.76 ± 4.50 a
Ti (mg/kg)2.71 ± 0.53 A2.47 ± 0.58 A2.61 ± 0.56 b3.69 ± 1.16 a3.70 ± 1.52 a
V (mg/kg)2.36 ± 2.29 A2.22 ± 1.89 A2.30 ± 2.11 b2.98 ± 2.24 ab4.04 ± 2.19 a
Zn (mg/kg)45.05 ± 5.25 A41.09 ± 7.10 B43.40 ± 6.33 b41.50 ± 7.43 b48.67 ± 4.63 a
Sn (10−1 mg/kg)0.41 ± 0.18 A0.48 ± 0.19 A0.44 ± 0.18 a0.23 ± 0.11 b0.22 ± 0.12 b
Sb (10−2 mg/kg)1.36 ± 1.55 A0.95 ± 0.59 A1.19 ± 1.25 a1.11 ± 0.59 a1.10 ± 0.49 a
Bi (10−1 mg/kg)1.18 ± 0.59 A0.67 ± 0.74 B0.97 ± 0.70 a0.92 ± 0.68 a0.75 ± 0.47 a
TN (%)5.65 ± 0.28 A5.08 ± 0.42 B5.41 ± 0.45 a5.09 ± 0.52 b5.55 ± 0.43 a
TC (%)46.09 ± 1.01 A45.13 ± 1.32 B45.69 ± 1.23 a45.25 ± 0.77 ab44.64 ± 1.59 b
δ 15N (‰)1.87 ± 1.08 A2.08 ± 1.23 A1.96 ± 1.14 b1.92 ± 1.75 b3.45 ± 1.91 a
δ 13C (‰)−29.81 ± 3.57 A-30.14 ± 3.64 A−29.95 ± 3.56 a−29.07 ± 3.21 a-28.66 ± 2.87 a
δ 18O (‰)22.12 ± 3.73 A22.62 ± 3.42 A22.33 ± 3.58 a19.83 ± 5.13 b21.72 ± 2.53 ab
Note: The values given indicate the mean ± standard deviation (n = 3). Uppercase letters represent significant differences among samples from different counties in Zhejiang Province and lowcase letters represent significant differences among samples in three provinces, at p = 0.05 confidence level.
Table 3. Predictive abilities of the partial least squares discriminant analysis and orthogonal projections to latent structure-discriminant analysis models in discriminating white leaf tea from different provinces.
ZJGZHBAccuracy
PLS-DATraining setZJ3800100%
GZ115093.75%
HB0020100%
Total accuracy 93.33%
Testing setZJ1000100%
GZ 40100%
HB005100%
Total accuracy 100%
OPLS-DATraining setZJ3800100%
GZ015193.75%
HB0020100%
Total accuracy 98.65%
Testing setZJ1000100%
GZ040100%
HB005100%
Total accuracy 100%
Disclaimer/Publisher’s Note: The statements, opinions and data contained in all publications are solely those of the individual author(s) and contributor(s) and not of MDPI and/or the editor(s). MDPI and/or the editor(s) disclaim responsibility for any injury to people or property resulting from any ideas, methods, instructions or products referred to in the content.

