Article

Genome-Wide Identification and Expression Analysis of GATA Gene Family under Different Nitrogen Levels in Arachis hypogaea L.

1
College of Agriculture, Nanjing Agricultural University, Nanjing 210095, China
2
Henan Academy of Agricultural Sciences, Zhengzhou 450002, China
*
Authors to whom correspondence should be addressed.
Agronomy 2023, 13(1), 215; https://doi.org/10.3390/agronomy13010215
Submission received: 12 December 2022 / Revised: 6 January 2023 / Accepted: 6 January 2023 / Published: 10 January 2023

Abstract

:
Nitrogen, one of the essential elements, is a key determinant for improving peanut growth and yield. GATA zinc finger transcription factors have been found to be involved in regulation of nitrogen metabolism. However, a systematic characterization of the GATA gene family and patterns of their expression under different nitrogen levels remains elusive. In this study, a total of 45 GATA genes distributed among 17 chromosomes were identified in the peanut genome and classified into three subfamilies I, II and III with 26, 13 and 6 members, respectively, whose physicochemical characteristics, gene structures and conserved motifs were also analyzed. Furthermore, the optimal level of nitrogen fertilizer on the growth of peanut cultivar Yuhua 23 was determined by pod yield and value cost ratio from 2020 to 2022, and the results revealed that 150 kg hm−2 nitrogen was the best for cultivation of peanut Yuhua 23 because of its highest pod yield and relatively higher VCR of more than four. In addition, expression patterns of peanut GATA genes under different nitrogen levels were detected by real-time quantitative PCR and several GATA genes were significantly changed under a nitrogen level of 150 kg hm−2. Overall, the above results would be helpful for further understanding biological functions of the GATA gene family in cultivated peanut.

1. Introduction

GATA transcription factors are an important category of zinc-finger DNA binding proteins in plants, animals, and fungi, which are widely related to multiple biological processes [1]. These proteins can bind to the DNA sequences GATA (A/T) GATA (A/G) and thus be known as GATA transcription factors [2]. GATA transcription factors were originally found in fungi and animals and are often composed of multiple gene family members. Most GATA proteins contain either one or two zinc-finger domains that share the common sequence CX2CX17–18CX2C [2]. GATA transcription factors in animals usually possess two CX2CX17CX2C zinc finger domains, and the C-terminal one could bind to DNA to regulate expression of downstream genes [3]. Most fungal GATA factors have one single CX2CX17CX2C or CX2CX18CX2C domain that is highly similar to zinc-finger domains at the C end of animal GATA factors [4,5]. It was shown that 30 GATA transcription factors were previously found in the Arabidopsis thaliana genome, and these were classified into subfamilies I, II, III and IV [6]. Most plant GATA factors have a single CX2CX18CX2C domain, but some of them have a zinc finger ring with 20 or more amino acid residues in the zinc finger domain [6].
GATA transcription factors have been extensively studied in many animals and fungi. GATA transcription factors in animals play important roles in cell proliferation, differentiation, and development [3]. Fungal GATA transcription factors were involved in regulating light induction, nitrogen metabolism, mating-type switching and lateral body biosynthesis [5]. In Yarrowia lipolytica, nitrogen and lipid metabolism were regulated by GATA transcription factors gzf3 and gzf2 [7]. Moreover, numerous studies have shown that plant GATA transcription factors are related to nitrogen metabolism. The first reported plant GATA protein NTL1 was cloned from tobacco and had been demonstrated as a regulator of nitrogen metabolism [8]. In Oryza sativa, cytokinin-responsive GATA protein Cga1was shown to be involved in plant architecture and chloroplast development under different environmental conditions [9]. Inhibition of the transcription factor GATA4’s expression in Arabidopsis thaliana improved tolerance response to nitrogen deficiency [10]. GATA transcription factors in plants also play critical roles in response to different stresses, flowering, and development, and regulating plant hormone signaling. In Brassica napus, a total of 96 GATA family members were identified and displayed different expression patterns under ABA, salinity, drought and cold stresses [11]. Sixty-four putative GATA factors were detected in the soybean genome and exhibited expression diversity under low nitrogen stress [12]. Transcription factor GATA2 is a key player mediating signaling crosstalk between brassinosteroid and light pathways in Arabidopsis thaliana [13,14]. Furthermore, in Arabidopsis thaliana, GATA transcription factors HANABA TARANU, ZIM and Blue Micropylar End 3 have been revealed to regulate shoot apical meristem development, flower development and seed germination, respectively [15,16,17]. In rice, the GATA transcription factor NECK LEAF 1 modulates organogenesis through regulating several pathways during reproductive development [18]. In Triticum aestivum L., over-expression of a GATA-like transcription factor TaZIM-A1 delayed flowering and resulted in a reduction of thousand-kernel weight [19]. More importantly, conserved GATA motifs have been identified in the promoter regions of several nitrogen metabolism-related genes such as nitrite reductase, nitrate reductase and glutamine synthetase [20,21,22].
Cultivated peanuts (Arachis hypogaea L.), one of the most essential oil crops, are widely cultivated in the tropical and subtropical areas of the world and provide edible oils and proteins for humans [23,24]. Nitrogen is one of the necessary elements for crop growth and development [25]. Nitrogen limitation has a negative impact on peanut growth, accumulation of dry matter and grain yield [26,27]. However, until now, members of the GATA gene family in cultivated peanut have not been systematically characterized and their expression patterns under different nitrogen levels have not yet been studied. In this study, a total of 45 GATA family genes were identified in the cultivated peanut genome and a comprehensive analysis of them including physical characteristics, gene structures, conserved motifs, chromosomal distribution, and phylogenetic classification was performed. Furthermore, expression patterns of the identified GATAs in peanut under different nitrogen levels were also investigated. This study will be valuable for further elucidating the functions of the GATA gene family under different nitrogen applications in cultivated peanut.

2. Materials and Methods

2.1. Identification of GATA Genes in the Arachis hypogaea L. Genome

The annotation files of Arachis hypogaea cv. Tifrunner genome were downloaded from the PeanutBase database (https://peanutbase.org/data/v2/Arachis/hypogaea/annotations/Tifrunner.gnm1.ann1.CCJH/, accessed on 5 May 2022). To identify all genes of the GATA family in Arachis hypogaea L., the GATA zinc finger domain hidden Markov model (HMM) profile (PF00320) was obtained from the Pfam database in the website of the InterPro database (https://www.ebi.ac.uk/interpro/entry/pfam/, accessed on 5 May 2022) [28,29] and the HMMER program (Version 3.3.2) was used for identifying GATA genes among all the annotated protein sequences in the peanut genome at an E-value smaller than 1e−12 [30]. If one gene had two or more protein transcripts (isoforms), the longest one was used for further analysis. Moreover, the identified GATA genes were further confirmed with the Simple Modular Architecture Research Tool (https://smart.embl.de, accessed on 6 June 2022) [31]. In addition, number of amino acids, molecular weight, instability and aliphatic index, theoretical isoelectric point (pI) and grand average of hydropathicity (GRAVY) of all identified GATA proteins were analyzed with the ProtParam tool (https://web.expasy.org/protparam/, accessed on 6 June 2022).

2.2. Phylogenetic Classification of GATA Genes in Arachis hypogaea L.

Based on a previous study, the evolutionary relationship of all the known GATA genes from Arabidopsis thaliana was referenced and employed to classify the members of the GATA family in Arachis hypogaea L. [6]. In brief, multiple sequence alignment of all known GATA members from Arabidopsis thaliana and the identified GATA proteins in Arachis hypogaea L. were performed with the MUSCLE program with default settings [32]. Subsequently, a phylogenetic tree was constructed by MEGA 7.0 using the Neighbor-Joining (NJ) method with a bootstrap value of 1000 replicates [33].

2.3. Analysis of GATA Gene Structures and Conserved Motifs

Gene structures of the identified GATA members in Arachis hypogaea L. were visualized by using the online Gene Structure Display Server (http://gsds.gao-lab.org/, accessed on 6 July 2022) according to genome annotation [34]. The conserved motifs of the identified GATA members in Arachis hypogaea L. were identified and visualized by online Multiple EM for Motif Elicitation (MEME) (Version 5.4.1) (https://meme-suite.org/meme/tools/meme, accessed on 6 July 2022) with the following parameters: motif counts =10 and motif width between 6 and 50 [35]. DNA binding sites in the upstream 2000 bp regions of the promoter for GATA factors were identified by the online PlantPAN3.0 (http://plantpan.itps.ncku.edu.tw/promoter.php, accessed on 5 January 2023) [36].

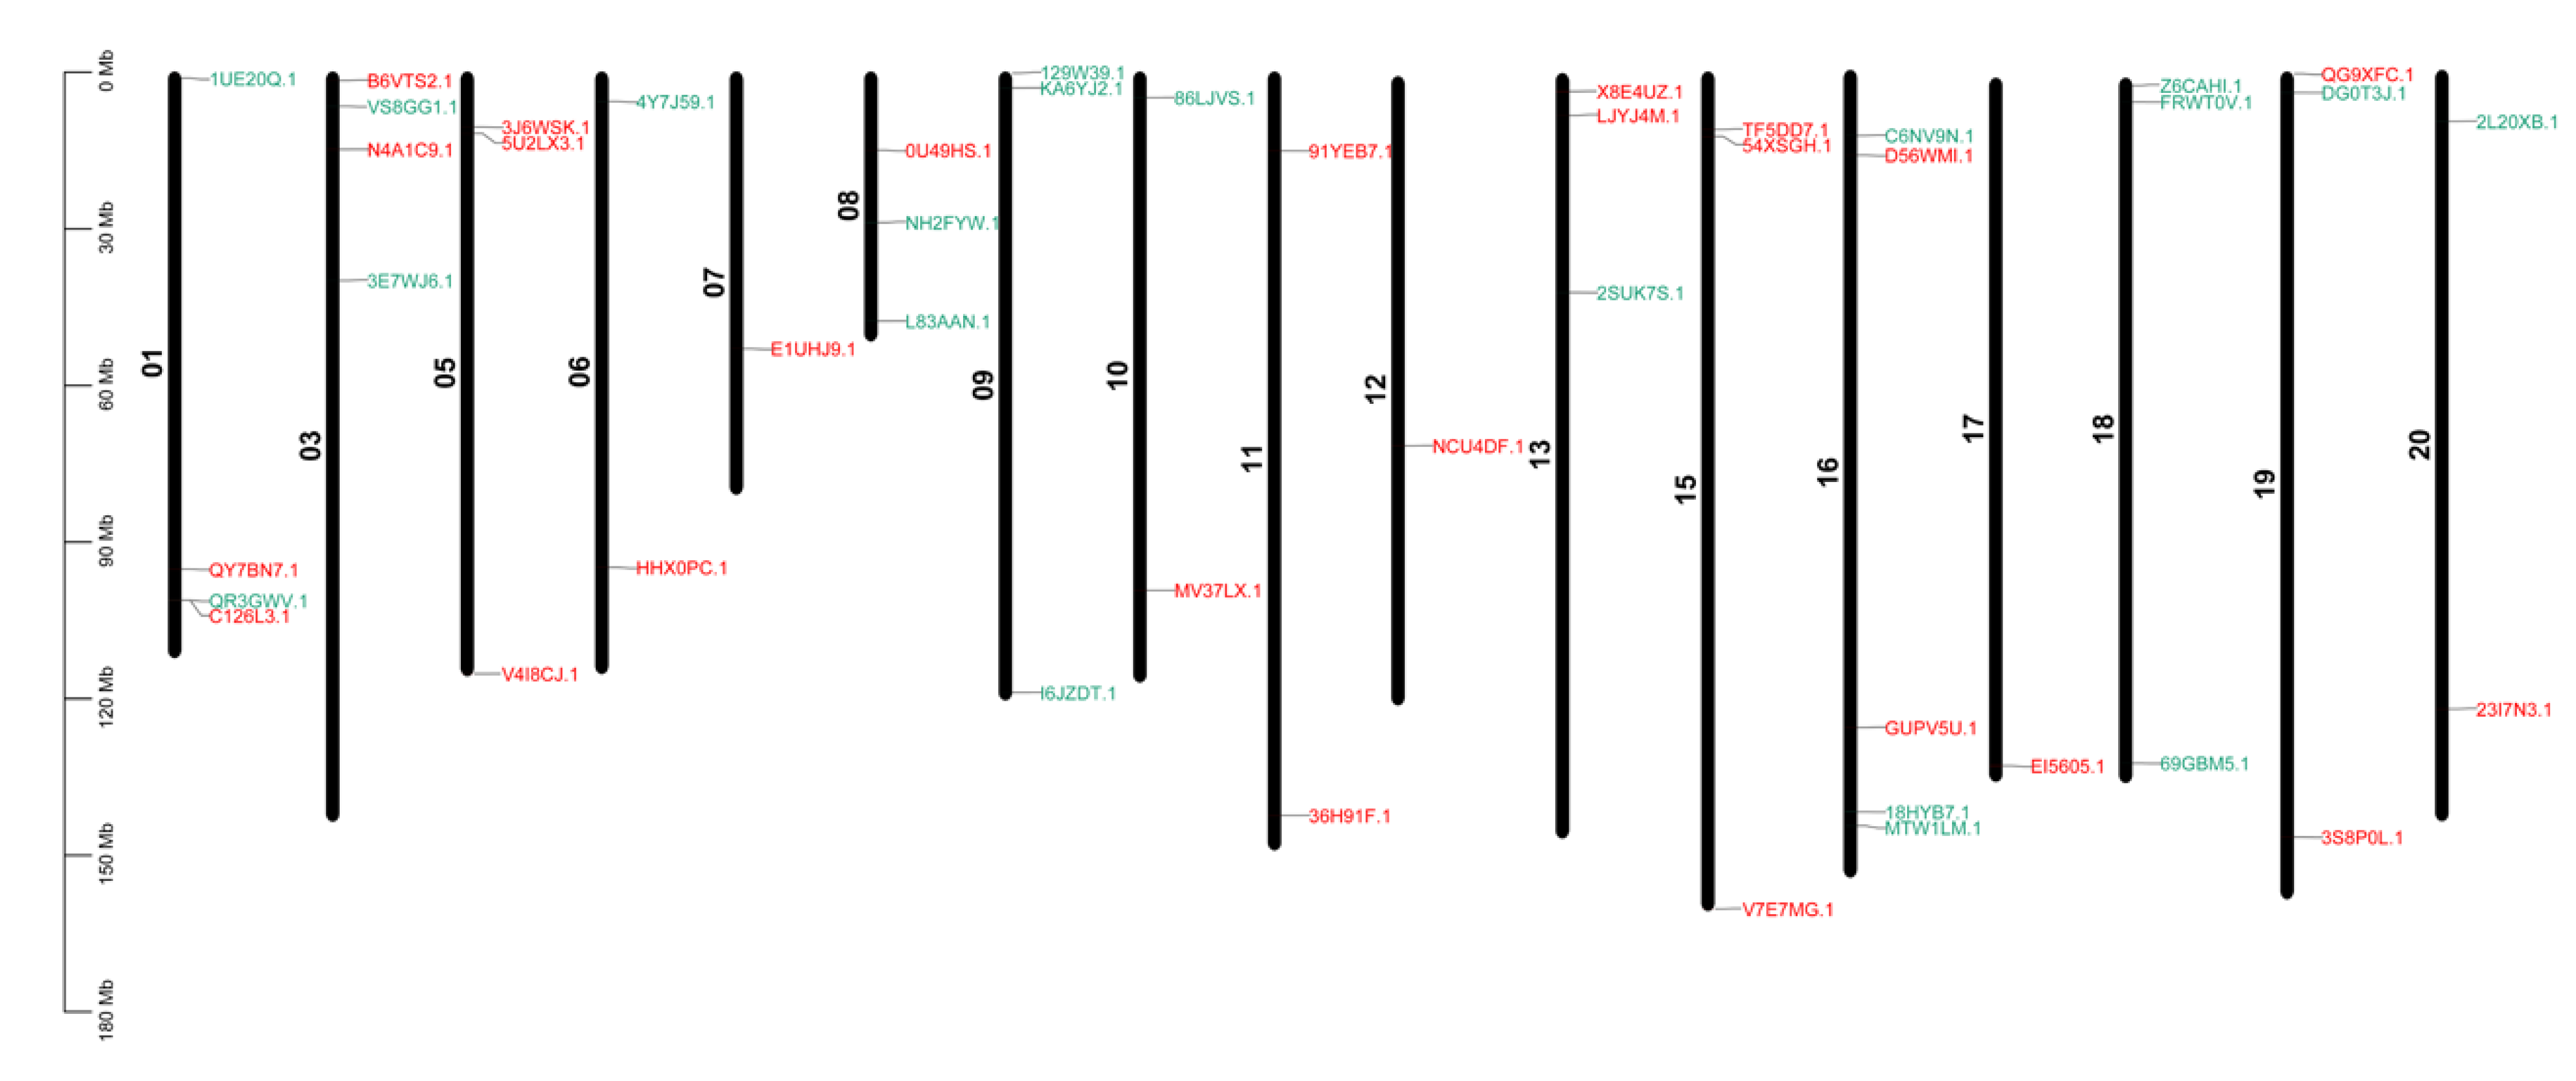
2.4. Chromosomal Distribution of GATAFamilyGenes in Arachis hypogaea L.

The distribution of identified GATA members in Arachis hypogaea L. genome was determined based on genome annotation data and visualized with TBtoolsv1.108 software [37].

2.5. Determination of the Optimal Nitrogen Fertilizer Level for Peanut Growth

The field trials were conducted in the Modern Agricultural Demonstration Garden of Changyuan Branch of Henan Academy of Agricultural Sciences in Changyuan, Henan, China (114°38′ E, 35°08′ N) from 2020 to 2022. The soil parameters in 2020 were as follows: organic matter with 12.8 g/kg, available nitrogen with 108.96 mg/kg, available phosphorus with 14.6 mg/kg and available potassium with 135.4 mg/kg. Urea was selected as nitrogen fertilizer. Seeds of peanut cultivars Yuhua 23 were grown under five nitrogen levels (N0: 0kg hm−2, N1: 75 kg hm−2, N2: 150 kg hm−2, N3: 225 kg hm−2 and N4: 300 kg hm−2) in 30 plots and each plot was 5.6 m × 2.4 m. Seeds were planted 12 cm apart and the distance between rows was 40 cm. Total pods per plant (TPP) were counted manually. Pods were air-dried outdoors until water content was below 9% and economic pods per plant (EPP), weight of pods per plant (PWP) and hundred-pod weight (HPW) were determined after harvesting. Pod dry weight per harvested plot was then weighted and pod yield was calculated as kg per hm2. The value cost ratio (VCR) was computed following the formula: VCR = (Yt − Yc) × P/C, where VCR denotes the value cost ratio of treatment, Yt and Ycare pod yield of treatment and control, respectively, P is price of peanut pod per kg and C is cost of fertilizer per hectare of treatment [38].

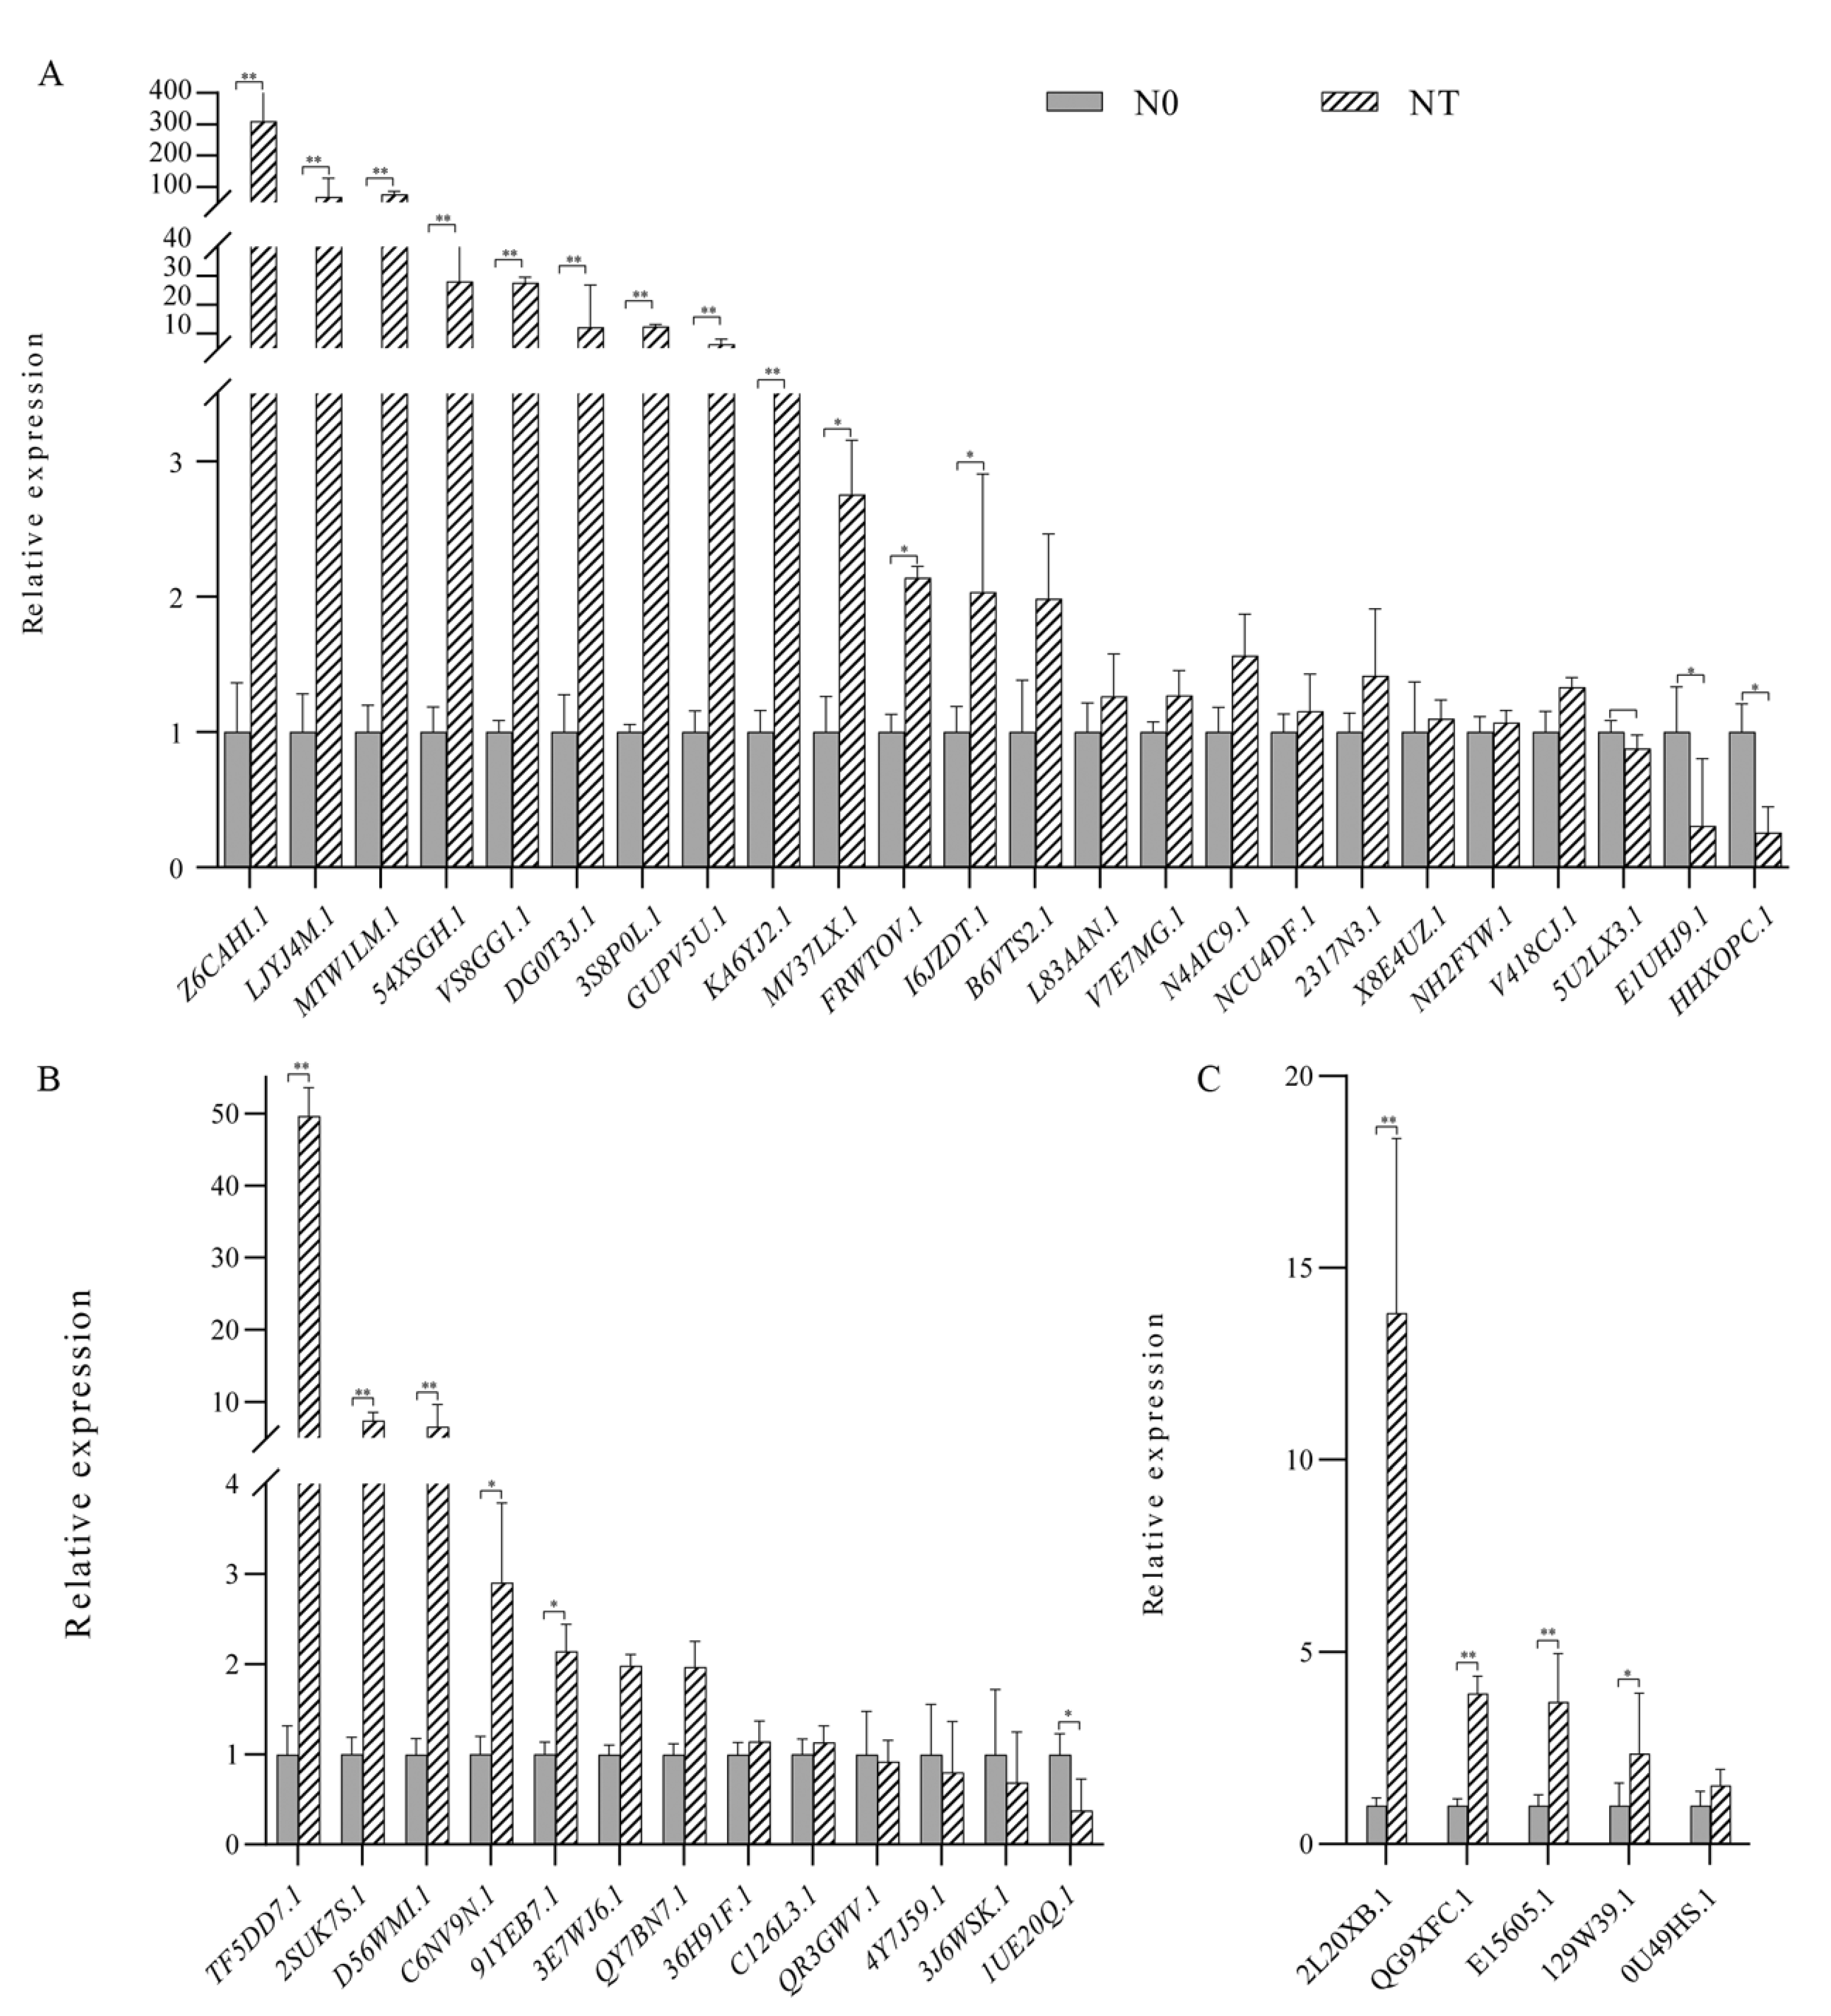
2.6. Expression Analysis of GATA Genes in Arachis hypogaea L. by Quantitative Real-Time PCR (qRT-PCR)

Total RNA was extracted from peanut leaves collected at 50 days after sowing by using a Plant RNAprep Pure Kit (TIANGEN, Beijing, China) with three biological replicates of each sample. FastQuant RT kit (TIANGEN, Beijing, China) was used to synthesizethe first-strand cDNA. A SuperReal PreMix Plus (SYBR Green) kit (TIANGEN, Beijing, China) was used for qRT-PCR amplification. Relative expression levels were determined using the 2−ΔΔCt method and the Ahactin gene was used as the reference gene [39]. Primer sequences used in this study are listed in Table S1.

3. Results

3.1. Genome-Wide Identification and Sequence Characteristics of GATA Gene Family in Arachis hypogaea L.

A total of 45 GATA genes were identified in the Arachis hypogaea L. genome (Table 1). The protein length of the 45 identified GATA members ranged from 108 (C6NV9N.1) to 415 (V4I8CJ.1) amino acids with an average of 294. The theoretical molecular weights of the above-identified GATA proteins varied from 12,119.71 Da to 45,242.82 Da with theoretical isoelectric point in the range of 4.75 (2L20XB.1 and 86LJVS.1) to 10.21 (QR3GWV.1). The instability index of the 44 identified GATA proteins was greater than 40 except 36H91F.1 with 36.84, which demonstrated they are unstable. The aliphatic index of peanut GATA proteins ranged from 28.71 (91YEB7.1) to 71.15 (4Y7J59.1) and the GRAVY index ranged from −1.19 (L83AAN.1) to −0.292 (4Y7J59.1).

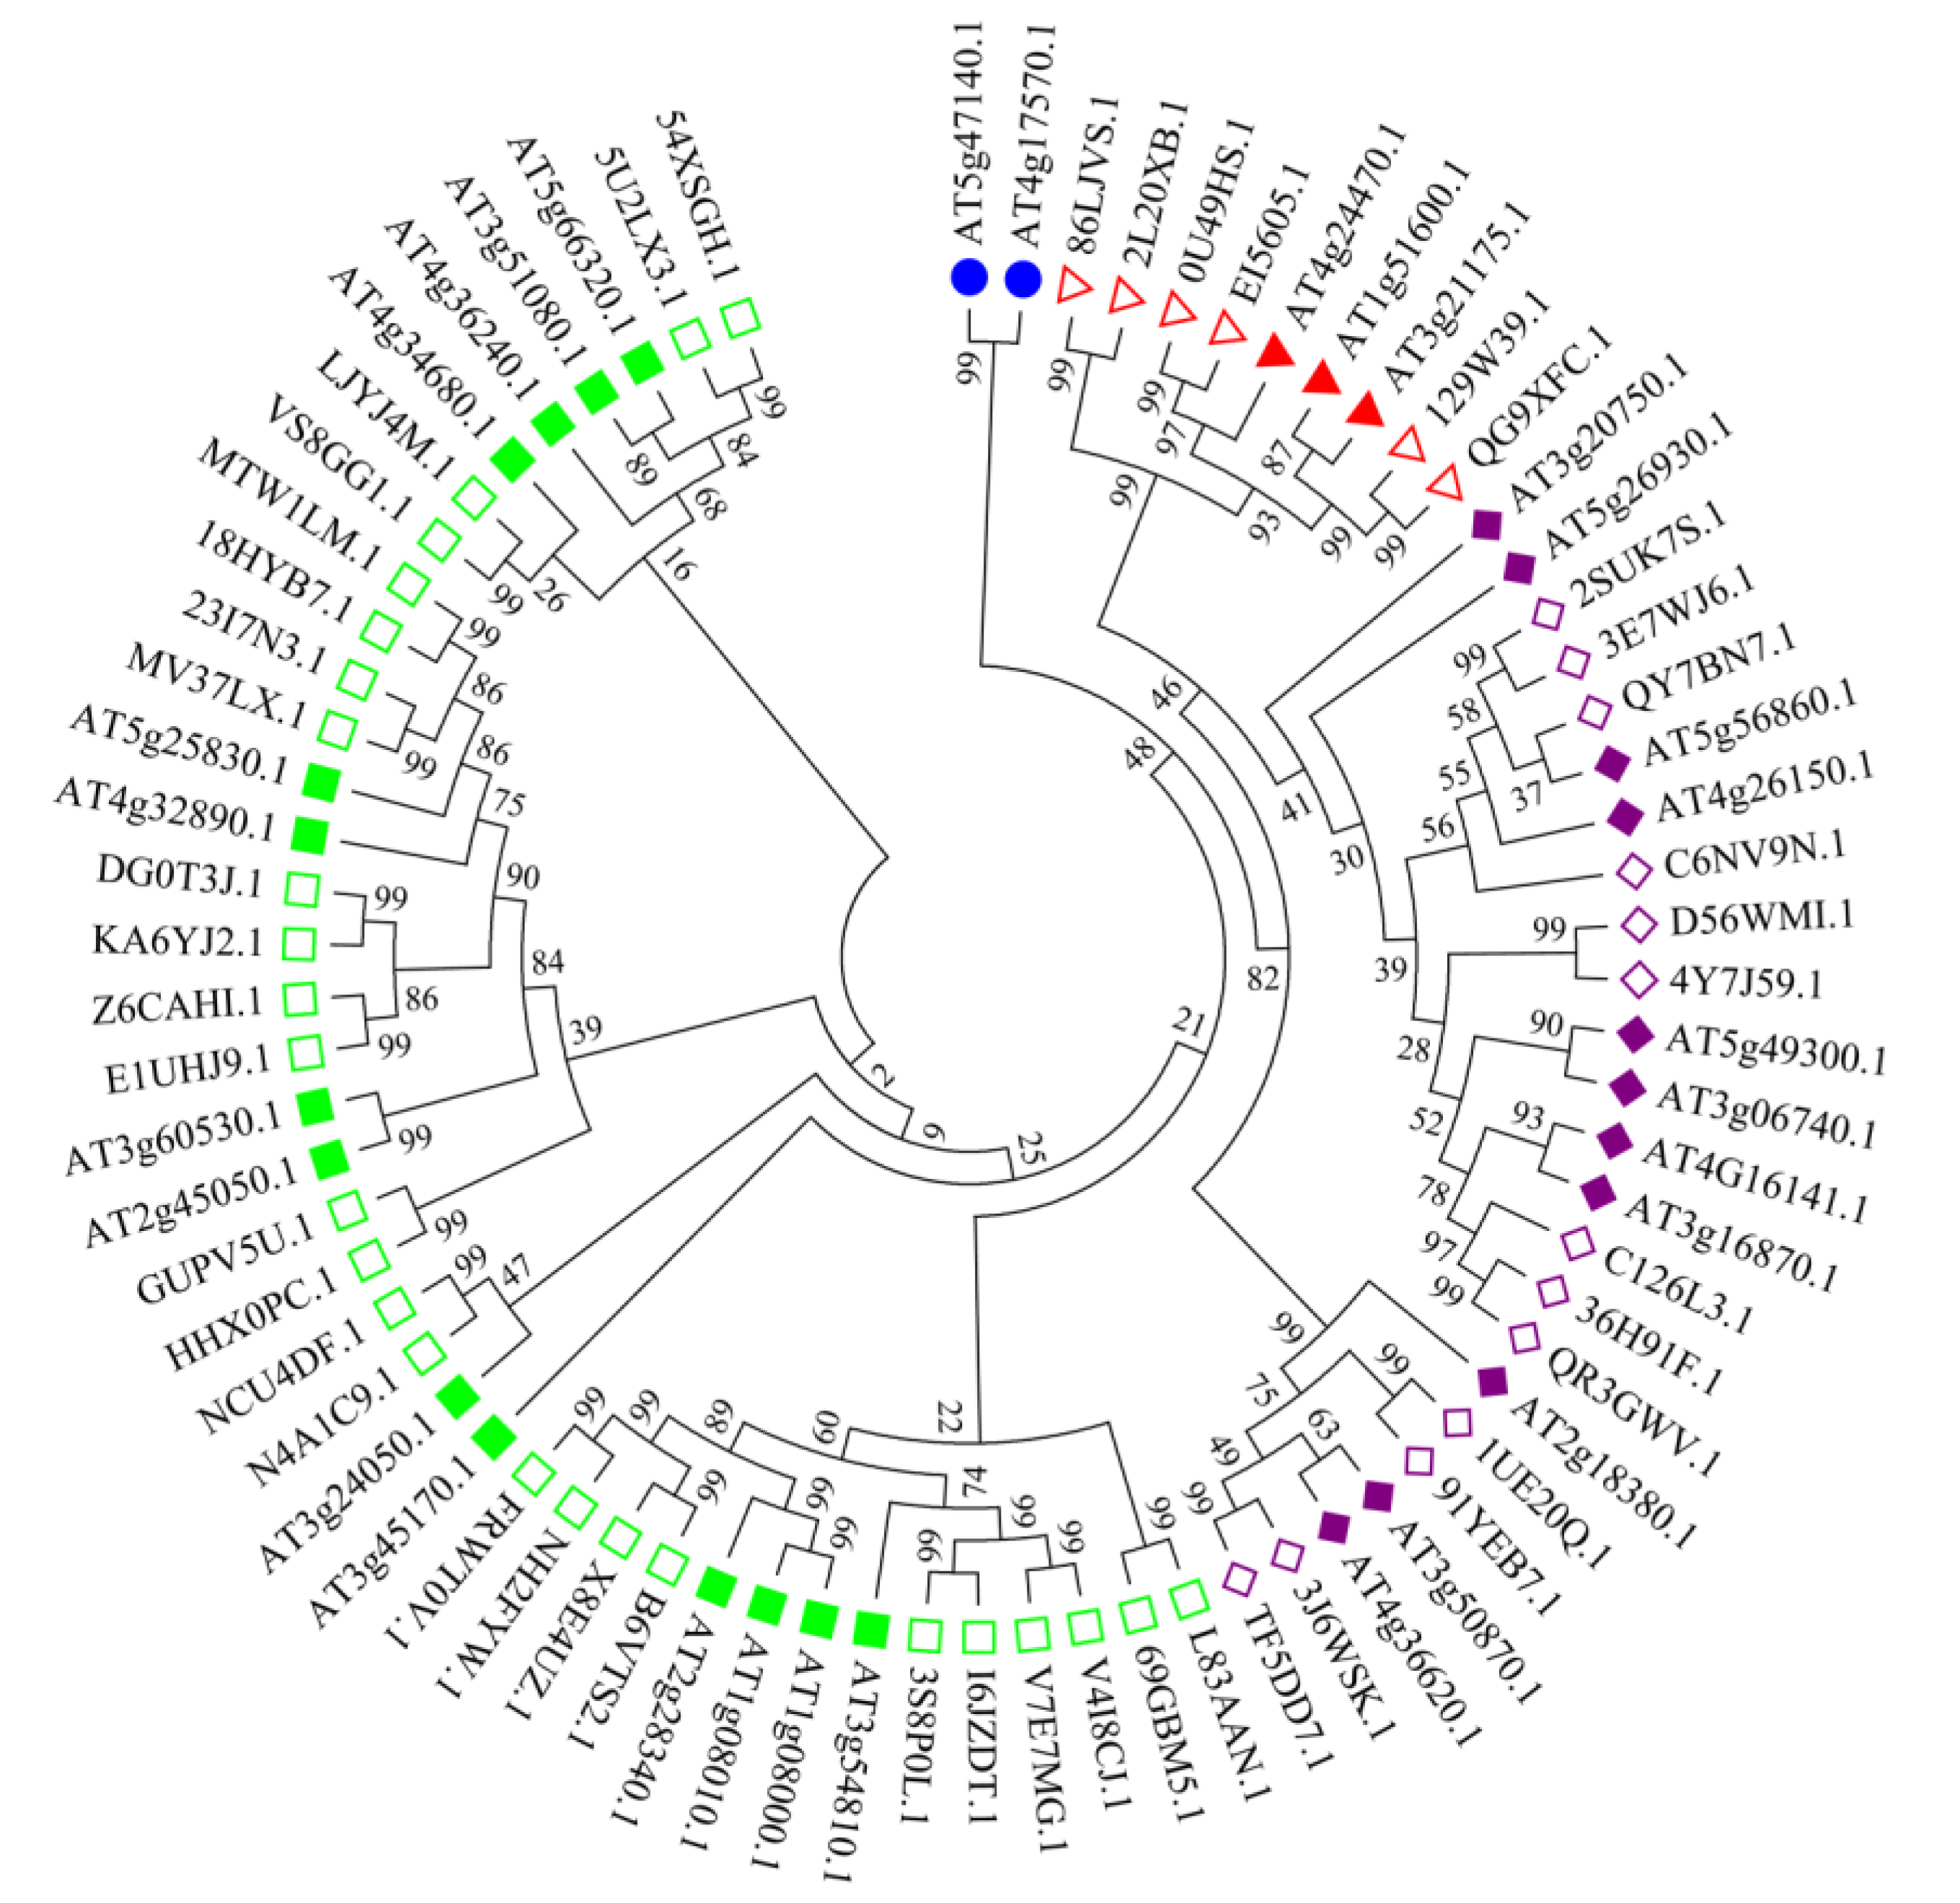
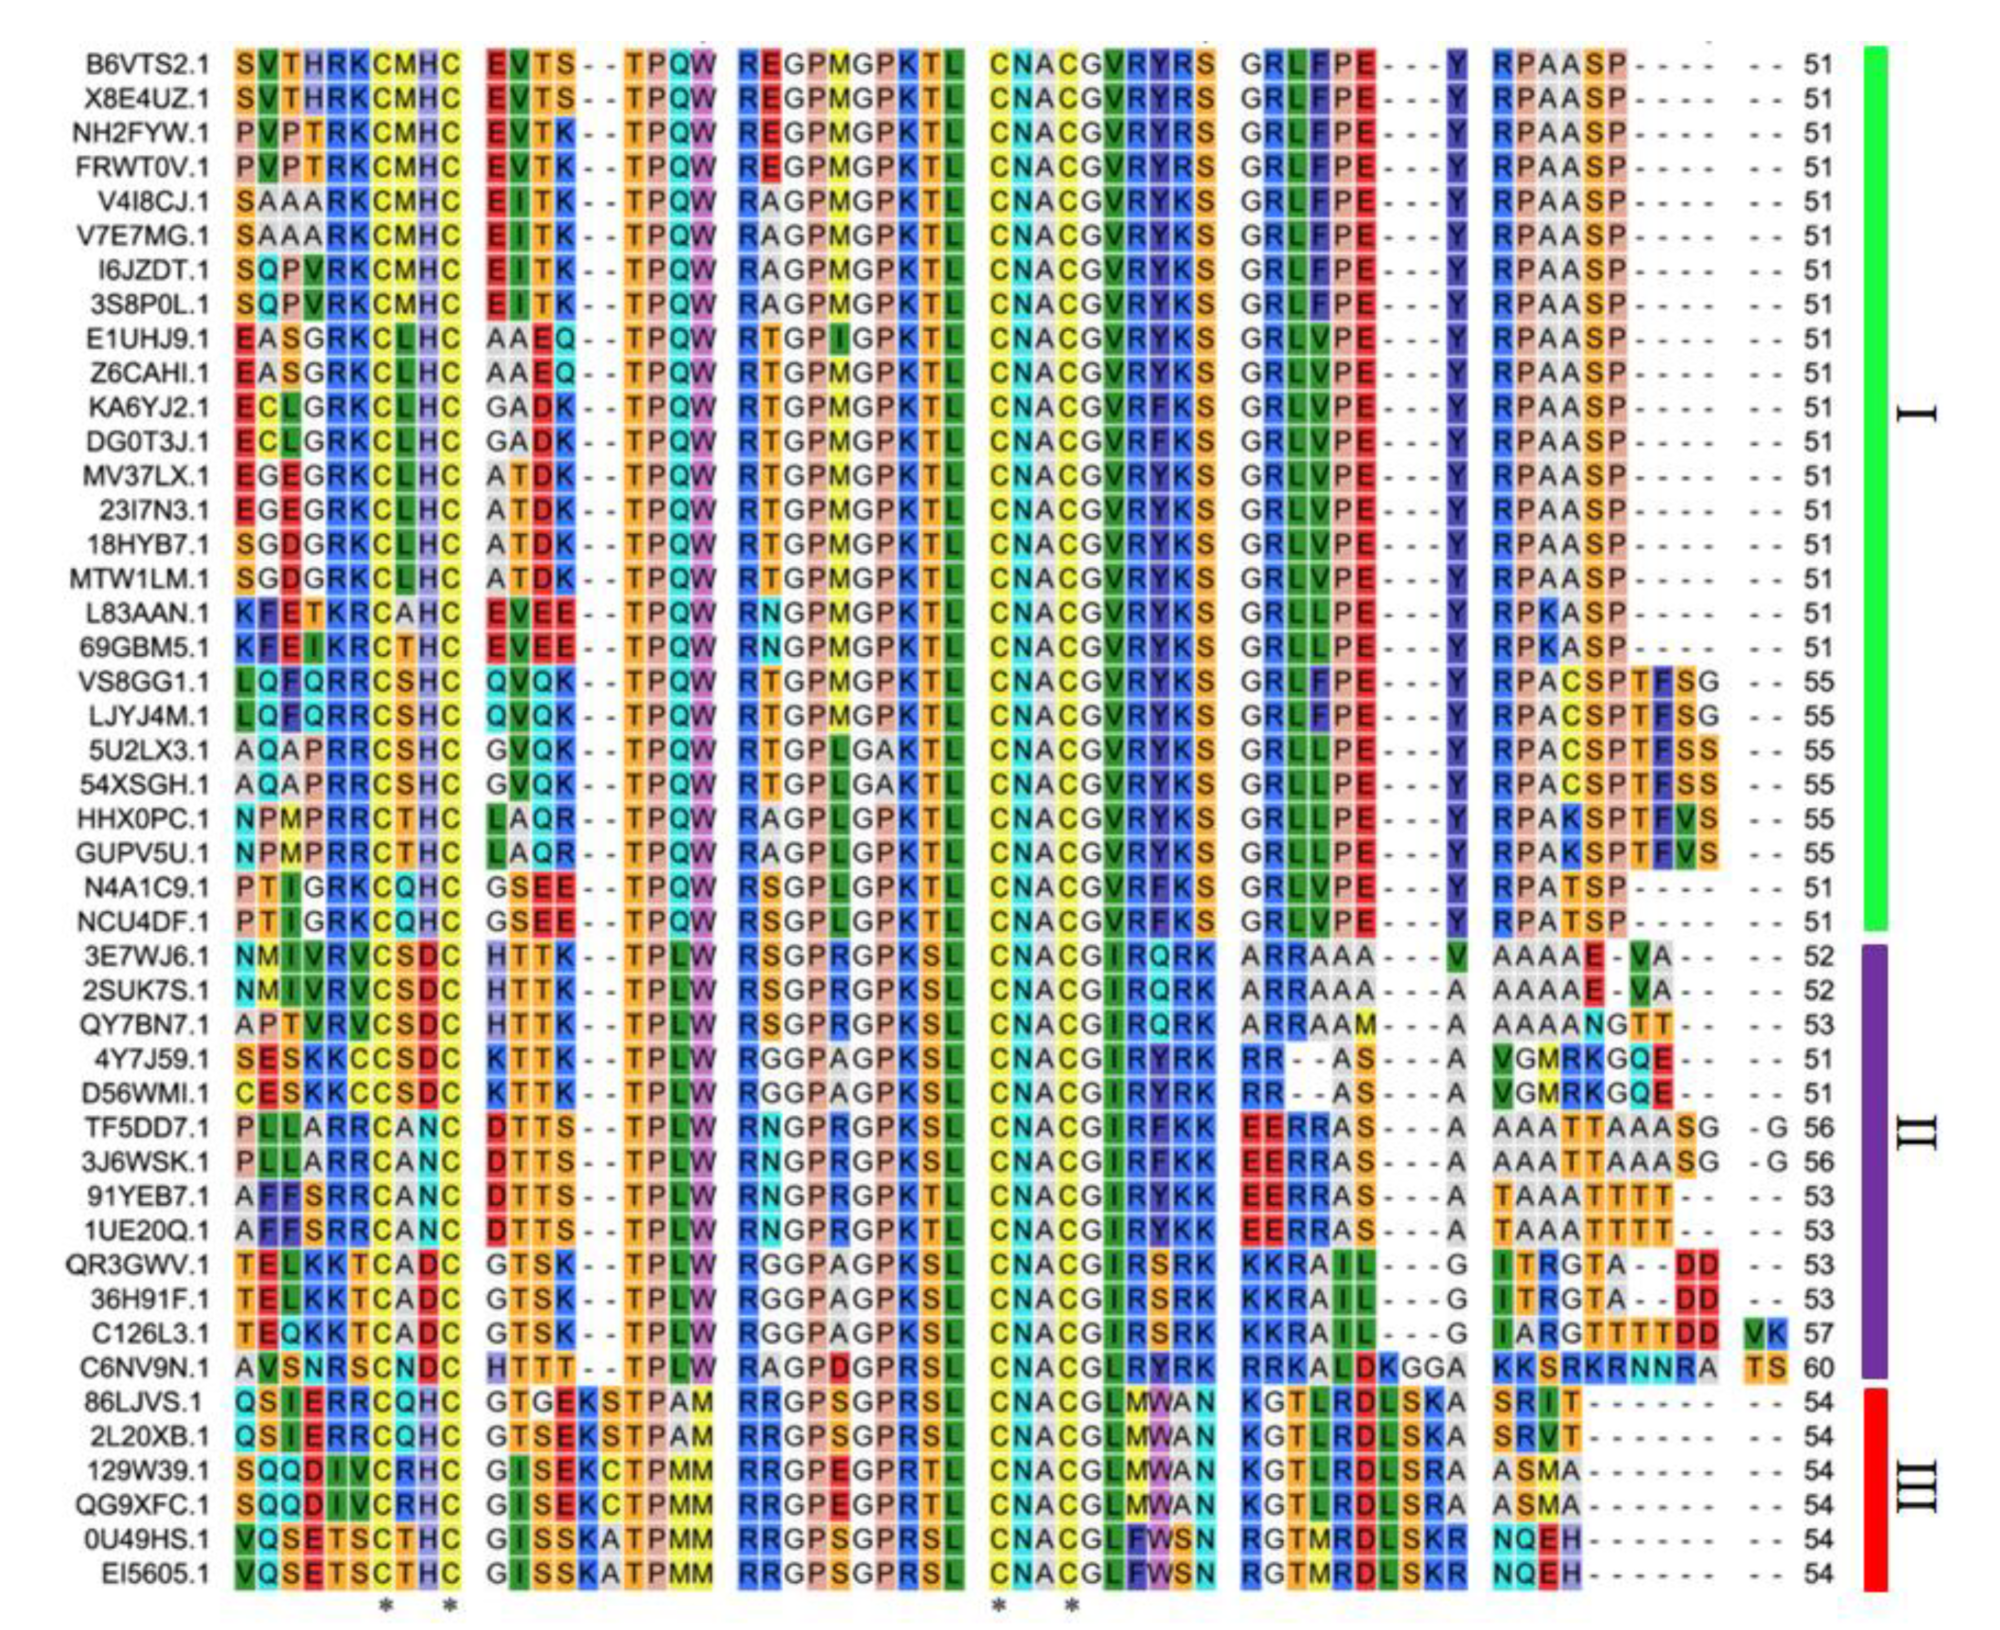
3.2. Sequence Alignment and Phylogenetic Analysis of Peanut GATA Genes

To elucidate the phylogenetic relationships of GATA gene family members between A. hypogaea L. and A. thaliana, protein sequences of the identified GATAs were used for further building a neighbor-joining phylogenetic tree, as shown in Figure 1. According to the classification of the Arabidopsis GATA gene family, GATA members from A. hypogaea L. and A. thaliana cluster into four phylogenetic subfamilies. Of these, 14 A. thaliana GATA members and 26 A. hypogaea L. GATA proteins cluster to subfamily I, harboring the largest number of GATA in both A. thaliana and A. hypogaea L., 11 A. thaliana GATA members and 13 A. hypogaea L. GATA proteins to subfamily Ⅱ, and three A. thaliana GATA members and six A. hypogaea L. GATA proteins to subfamily Ⅲ. Interestingly, there were two A. thaliana GATA members in subfamily IV and it was found that no A. hypogaea L. GATA proteins cluster into subfamily IV. To further analyze the sequence features of 45 identified GATA members in A. hypogaea L., conserved domains of 45 GATA proteins were detected, and the result of protein sequence alignment demonstrated that all of them have only one conserved domain with 18–20 residues among zinc finger loop (C-X2-C-X18–20-CNAC). All 39 A. hypogaea L. GATA members in subfamilies I and Ⅱ harbor the C-X2-C-X18-CNAC conserved domain but the other six members in subfamily Ⅲ have the C-X2-C-X20-CNAC rather than C-X2-C-X18-CNAC domain (Figure 2). Especially, there is a conserved amino acid motif TPQWRXGPXGXKTL between the second and third cysteine residues in the C-X2-C-X18-CNAC zinc finger loop of subfamily I and a conserved amino acid motif TX2TPLWRXGPXGPKXL between the second and third cysteine residues in the C-X2-C-X18-CNAC zinc finger loop of subfamily Ⅱ. In subfamily Ⅲ, there is also a conserved amino acid motif GX3KXTPXMRRGPXGPRXL between the second and third cysteine residues in the C-X2-C-X20-CNAC zinc finger loop (Figure 2).

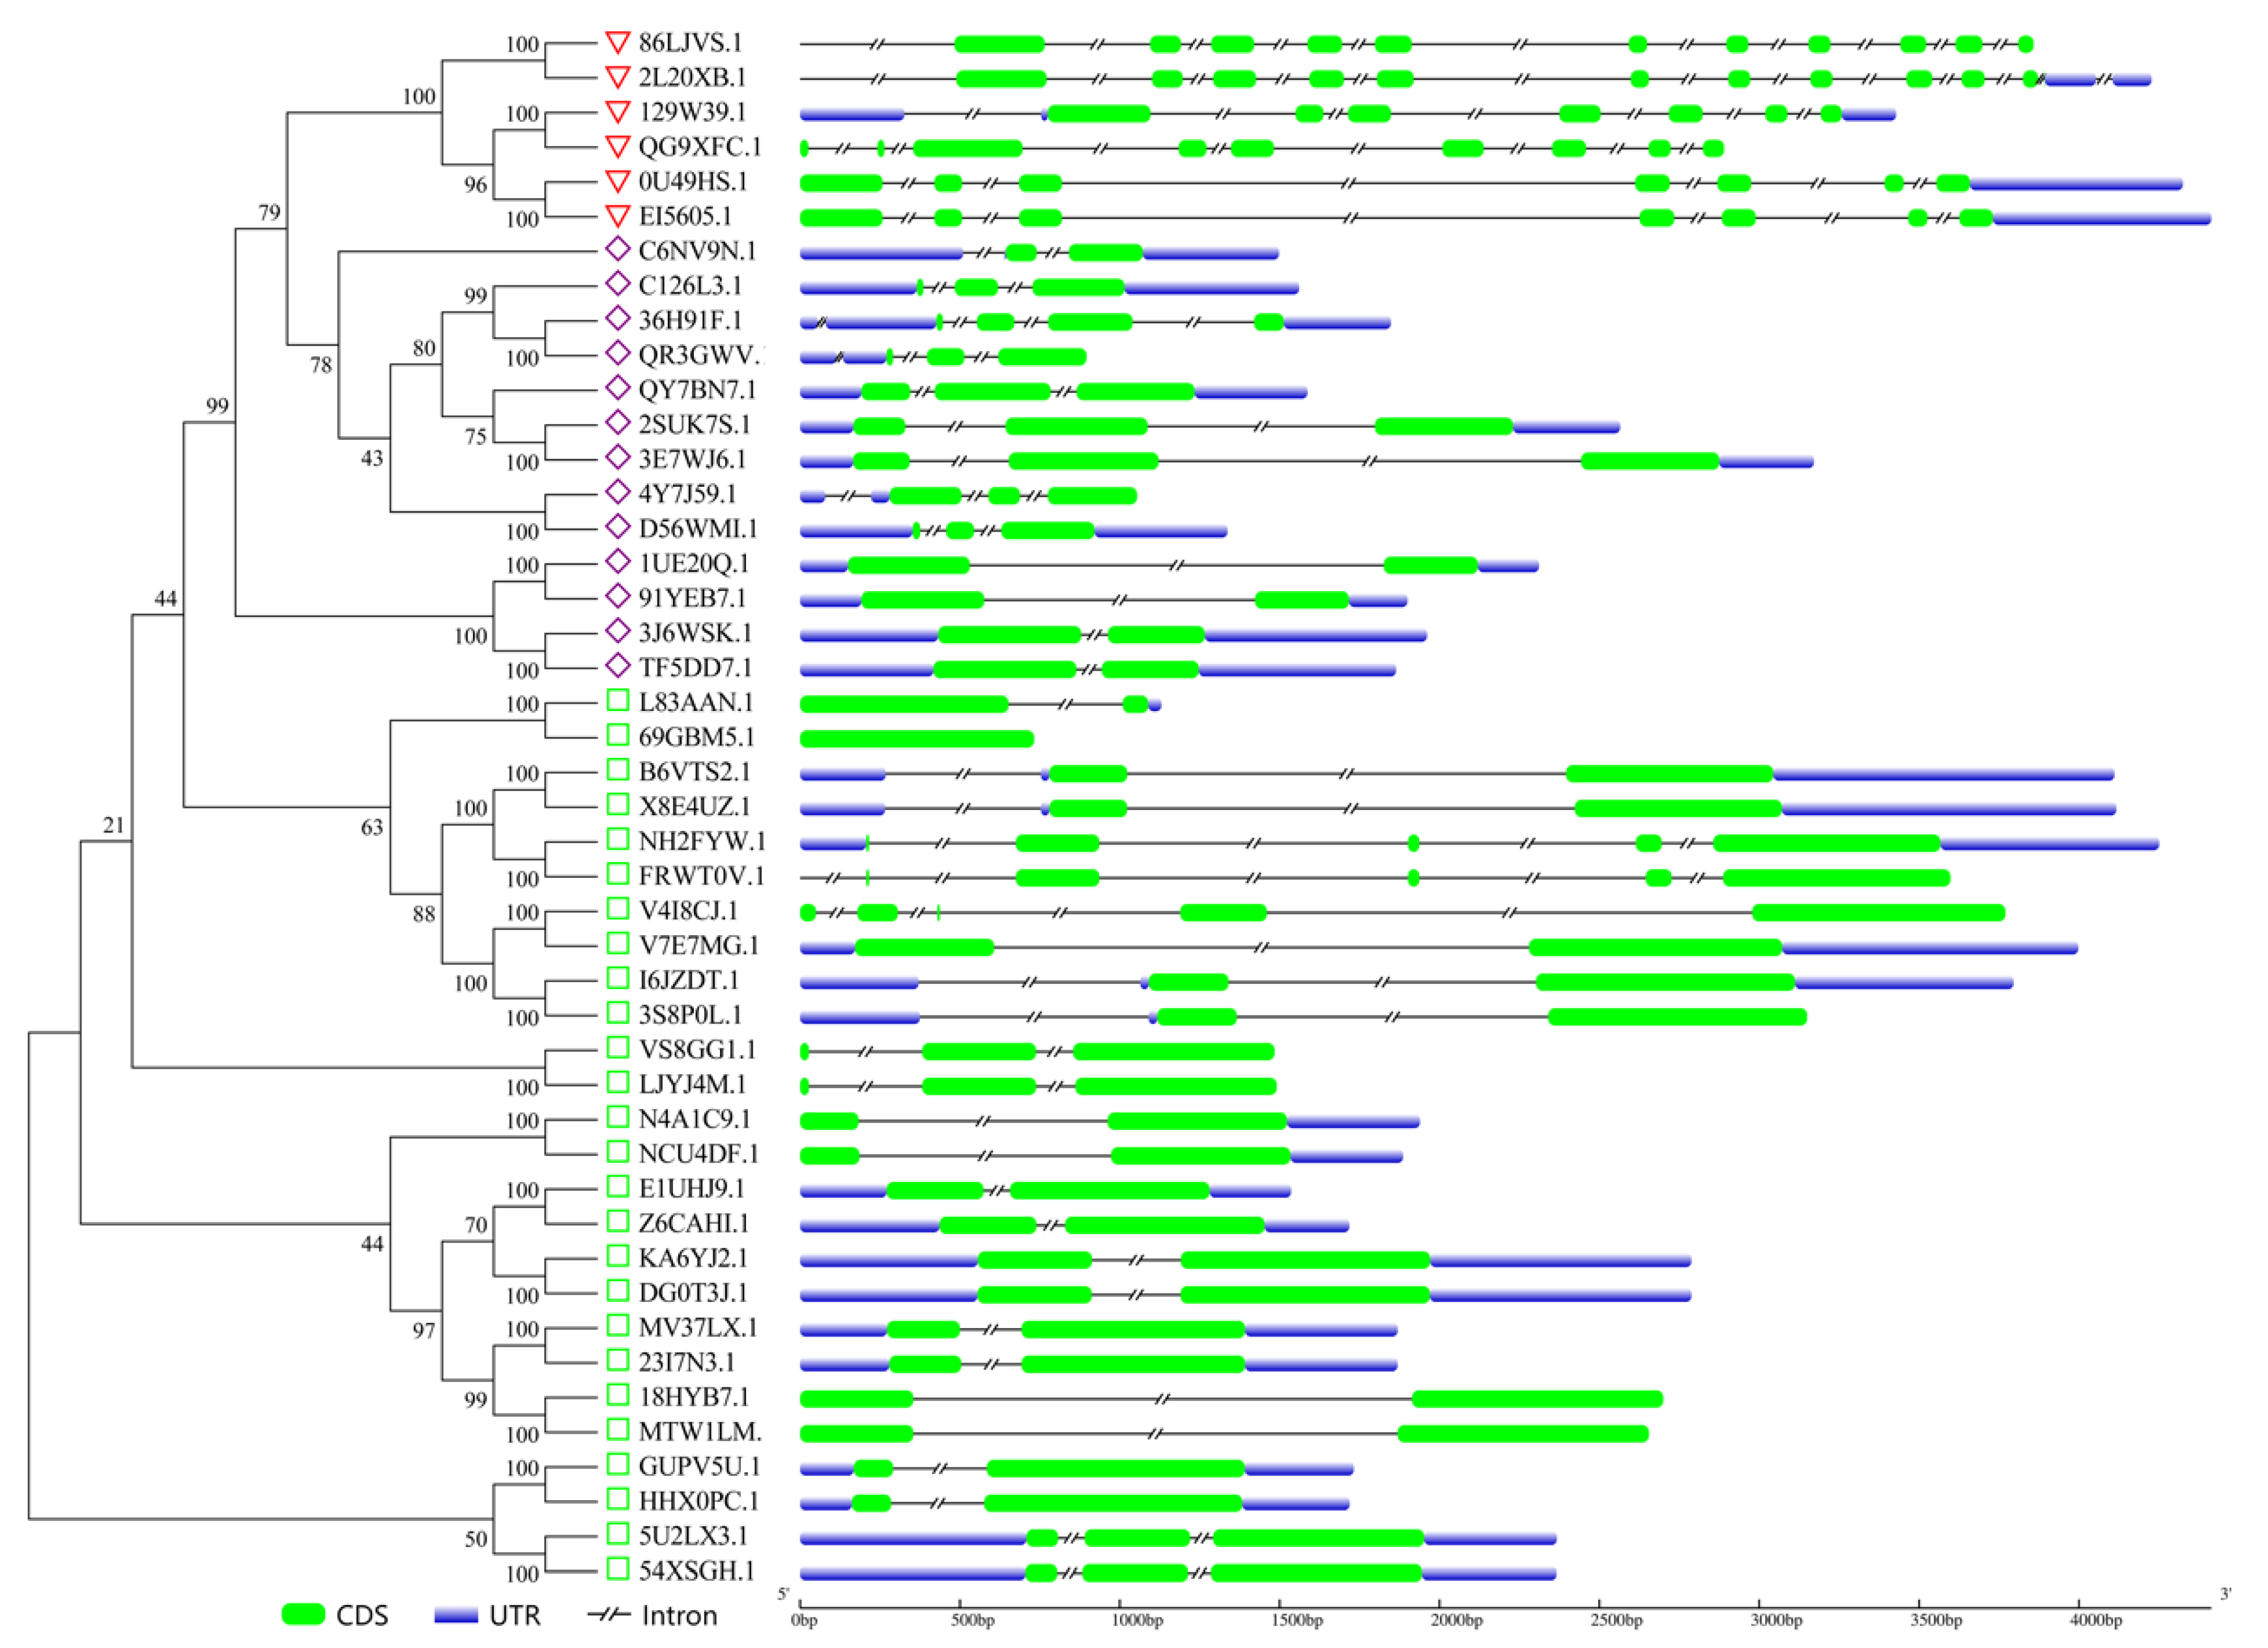
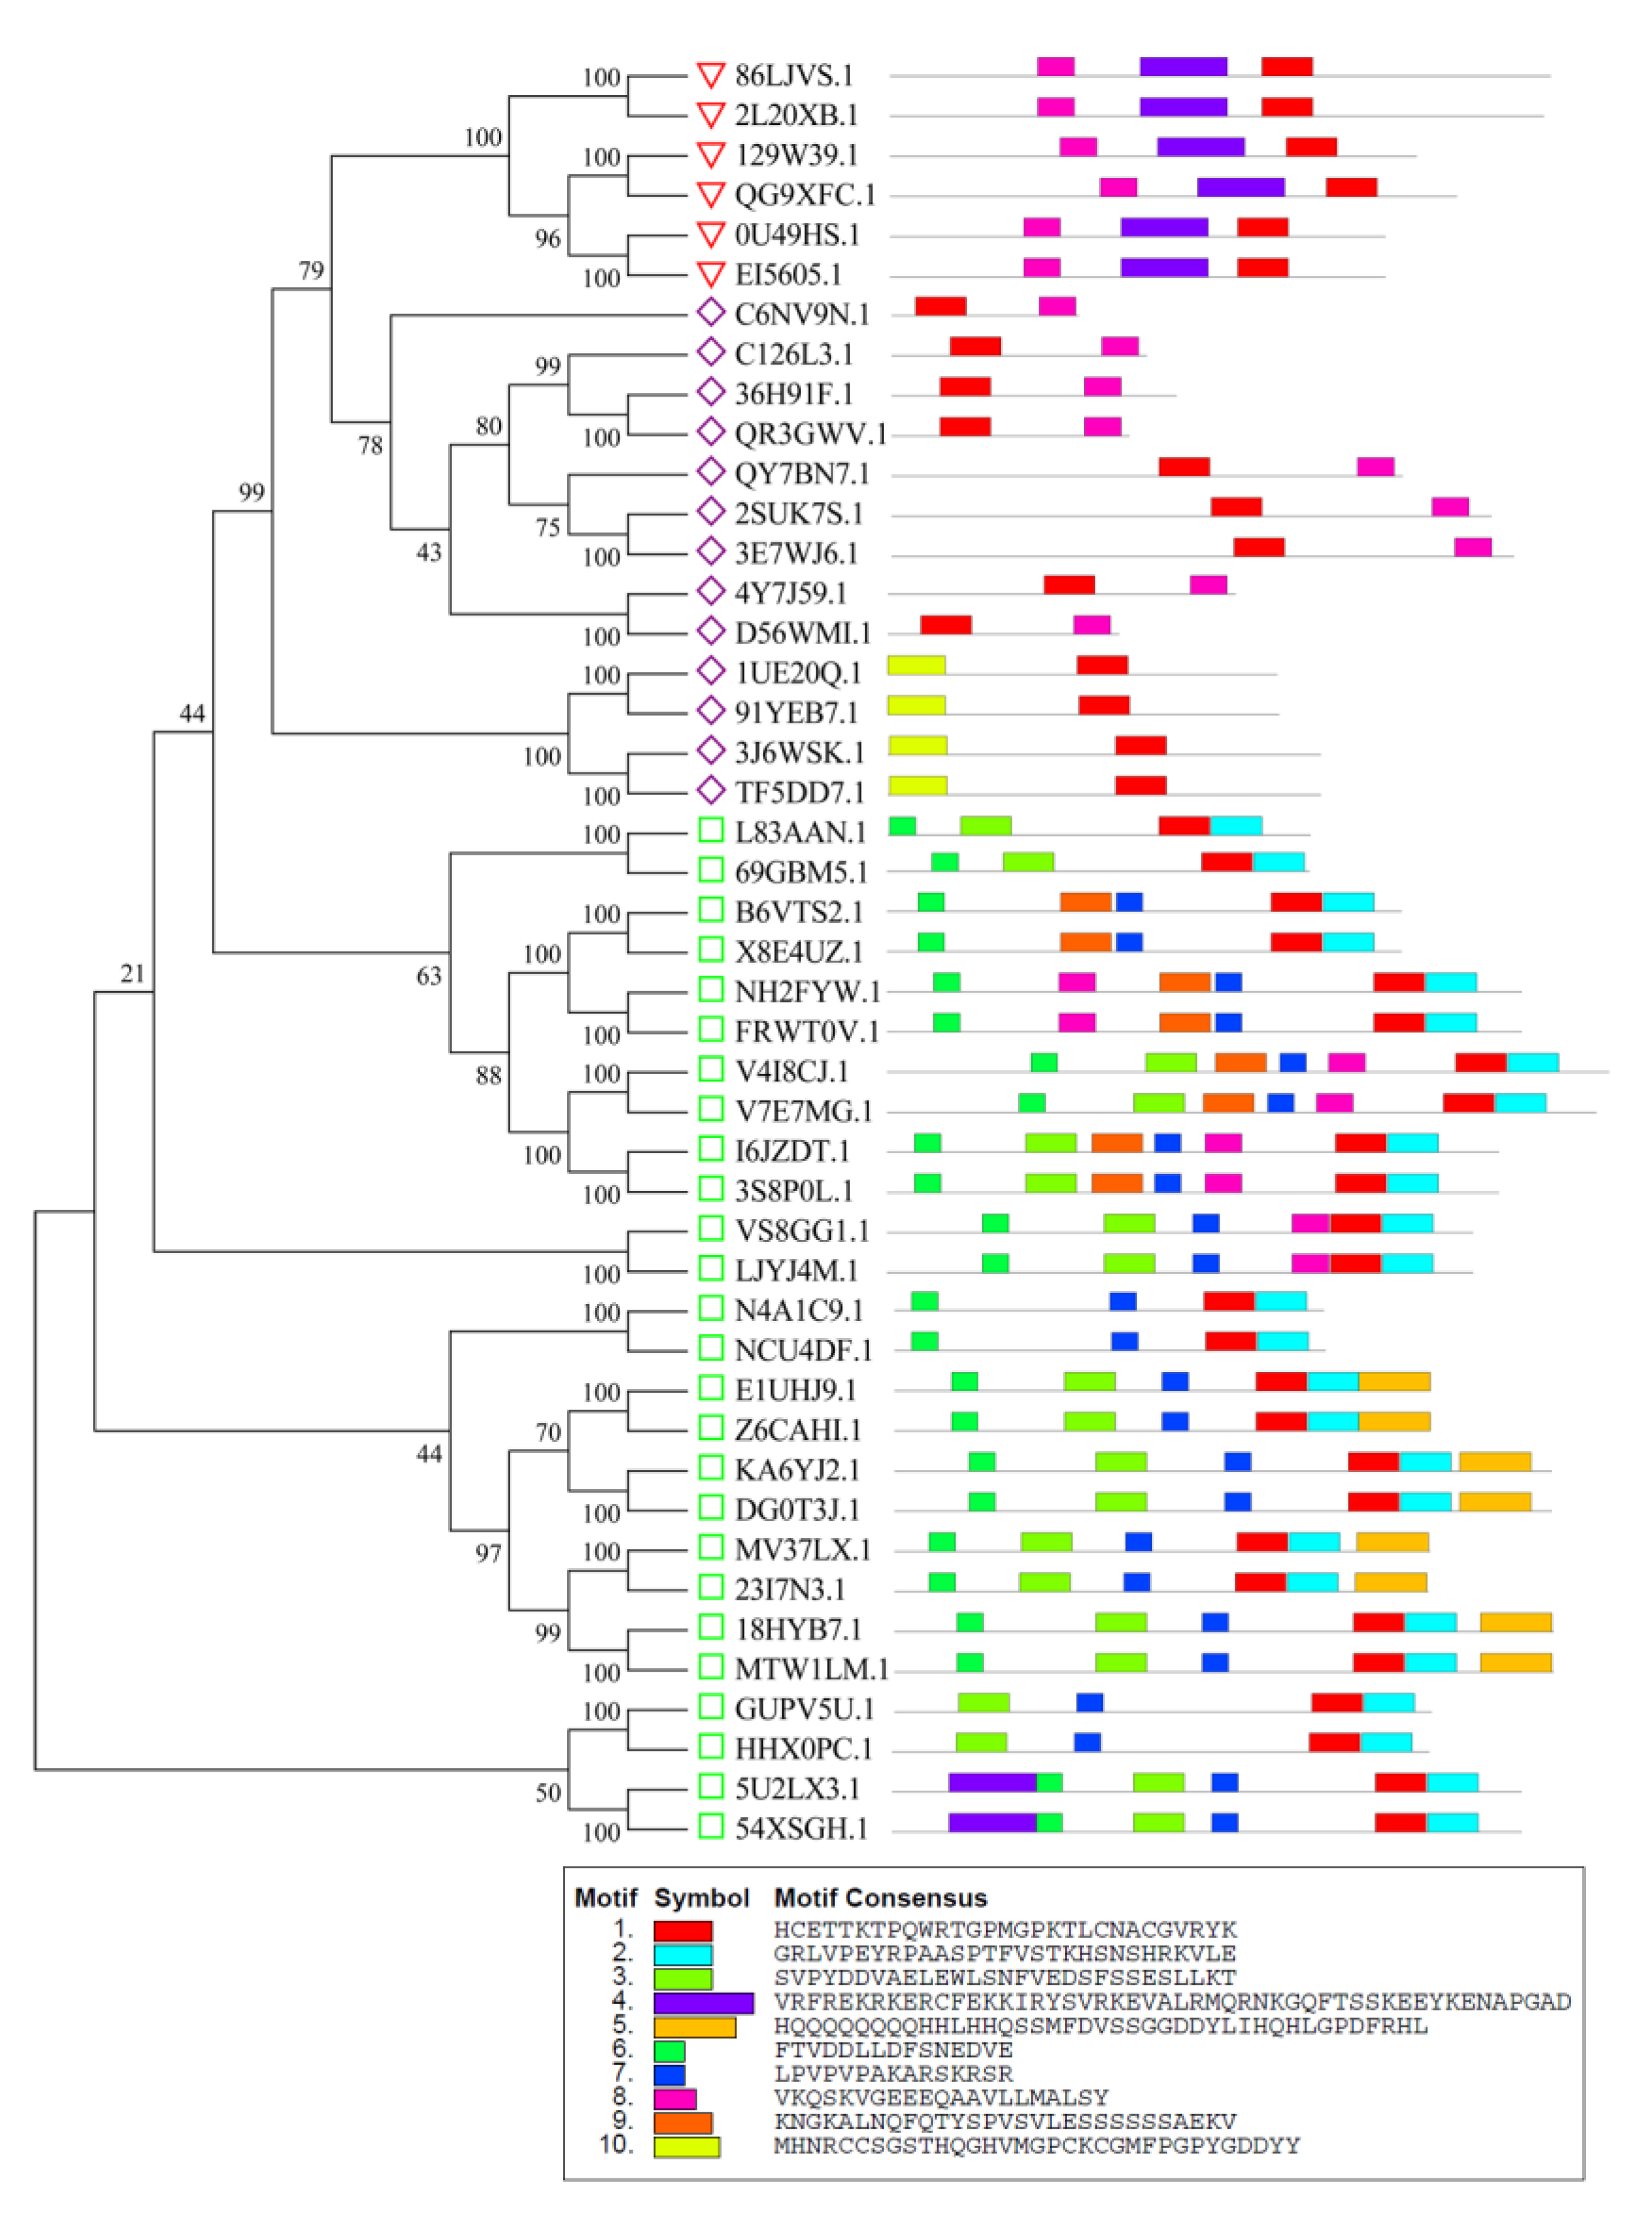
3.3. Analysis of Gene Structures and Conserved Motifs of Peanut GATA Family

A detailed illustration of the 45 identified GATA family gene exon–intron structures was made, and the results demonstrate that the numbers of exons of the identified peanut GATA family members vary from 1 (69GBM5.1) to 11 (2L20XB.1 and 86LJVS.1) and GATA genes in each subfamily display similar exon–intron structures (Figure 3). The most GATA members in the subfamily I and Ⅱ possess two or three exons except for three genes (NH2FYW.1, FRWT0V.1 and V4I8CJ.1) with five exons, one gene (36H91F.1) with four exons and one gene (69GBM5.1) with only one exon. In the subfamily Ⅲ, all six GATA genes comprise more than seven exons with an average of 8.67 exons per gene.
Next, 10 conserved motifs of 45 GATA family proteins were captured by MEME tools and displayed in Figure 4. All peanut GATA family proteins contain motif 1. In subfamily I, all members contain motif 2 and motif 3 except for four genes (B6VTS2.1, X8E4UZ.1, NH2FYW.1 and FRWT0V.1), motif 6 except for two genes (GUPV5U.1 and HHX0PC.1), and motif 7 except for two genes (L83AAN.1 and 69GBM5.1). However, only two members (5U2LX3.1 and 54XSGH.1) have motif 4, eight members (NH2FYW.1, FRWT0V.1, V4I8CJ.1, V7E7MG.1, I6JZDT.1, 3S8P0L.1, VS8GG1.1 and LJYJ4M.1) have motif 8 and eight members (MTW1LM.1, 18HYB7.1, 23I7N3.1, MV37LX.1, DG0T3J.1, KA6YJ2.1, Z6CAHI.1 and E1UHJ9.1) have motif 9. Moreover, motif 10 was also detected in four genes (1UE20Q.1, 91YEB7.1, 3J6WSK.1 and TF5DD7.1) and motif 8 in the other genes of subfamily Ⅱ. For subfamily Ⅲ, all the GATA members harbor motifs 7 and 8. Overall, these results indicate that GATA proteins in each subfamily share similar motif distributions.

3.4. Analysis of Chromosomal Distribution and Gene Duplication of Peanut GATA Genes

As shown in Figure 5, 45 GATA genes are randomly located on 17 of 20 chromosomes except chromosome 02, 04 and 14 in the A. hypogaea L. genome. The number of GATA genes varies among different chromosomes and chromosome 16 harbors the most GATA gene distributions with five members, followed by chromosomes 01 and 03 with four members, respectively. Interestingly, there is only one GATA gene in chromosomes 07, 12 and 17, respectively. To understand the gene duplication patterns of GATA family genes in A. hypogaea L., 22 homologous gene pairs of peanut GATA genes were detected and shown in Table 2. Among them, there were two gene pairs (C126L3.1 and QR3GWV.1, 18HYB7.1 and MTW1LM.1) detected in the same chromosome of 01 and 16, respectively, which may be caused by tandem duplication. Each of the other 20 GATA gene pairs occurred across different chromosomes and the results revealed that segmental duplication was the key driving force for evolution of peanut GATA family genes. However, no duplicated genes of C6NV9N.1 and QY7BN7.1 were identified. Additionally, gene pairs C126L3.1/QR3GWV.1 and 36H91F.1/QR3GWV.1 are both involved in gene QR3GWV.1.

3.5. Optimal Level of Nitrogen Fertilizer on the Growth of Peanut Yuhua 23

The increased application of nitrogen fertilizer significantly improved yield components of peanut, and total pods per plant increased the most, followed by economic pods per plant and hundred-pod weight (Table 3). With increasing level of nitrogen application, the proportion of economic pods to total pods decreased. The increased rates of pod yield in 2020 and 2022 were almost consistent, which were 18.6–19.0%, 33.5–34.6%, 35.9–37.6% and 35.2–37.0% at nitrogen levels of 75 kg hm−2, 150 kg hm−2, 225 kg hm−2 and 300 kg hm−2, respectively. In 2020 and 2022, VCR values were higher than 4 at nitrogen levels of 75 kg hm−2 and 150 kg hm−2 and pod yield increased by 533.6 kg hm−2 and 586.2 kg hm−2, respectively. Pod yield increased by only about 3% at nitrogen levels of 225 kg hm−2 and 300 kg hm−2 compared with the 150 kg hm−2 and the VCR quickly decreased below 2, which indicated that it was not economical to increase nitrogen fertilizer above 150 kg hm−2. However, VCR was still higher than 4 at 225 kg hm−2 nitrogen application in 2021 but the pod yield was lower than that in 2020 and 2022. So, the 150 kg hm−2 nitrogen application could produce relatively higher peanut yield with VCR more than 4.

3.6. Expression Analysis of Peanut GATA Gene Family under Different Nitrogen Levels

To investigate the role of the GATA gene family in improving cultivated peanut growth, expression changes of 42 peanut GATA genes in the early stage of pod development were analyzed under a nitrogen level of 150 kg hm−2 (Figure 6). In detail, 12 members of subfamily I were significantly up-regulated and the top three of them (Z6CAHI.1, LJYJ4M.1 and MTW1LM.1) were remarkably increased 309.14-, 67.13- and 75.63-fold compared with the control, respectively. Only two members (E1UHJ9.1 and HHX0PC.1) were significantly down-regulated and decreased 3.3- and 3.84-fold, respectively. In the subfamily Ⅱ, five genes were significantly up-regulated, especially, the member TF5DD7.1, which was 47 times higher than the control and one gene considerably decreased 2.63-fold compared to the control. Four of five detected subfamily Ⅲ genes were significantly increased with the exception of 0U49HS.1 gene; in particular, the 2L20XB.1 gene had the highest expression and increased 13.82-fold compared to the control.

4. Discussion

The GATA gene family has been reported to play important roles in cell proliferation and development, nitrogen and lipid metabolism, and biotic and abiotic stresses [1,3,7]. Although GATA family members have been identified in several plants including Eucalyptus urophylla [40], Cucumis sativus L. [41], Brassica napus [11], Triticum aestivum L. [42] and Glycine max [12], they have not been systematically identified in cultivated peanuts until now. In this study, a total of 45 GATA family members were found in the Arachis hypogaea L. genome and classified into subfamilies I, Ⅱ and Ⅲ with 26, 13 and 6 members, respectively, which is consistent with GATA subfamily I containing the most members, followed by subfamilies Ⅱ and Ⅲ in Salvia miltiorrhiza [43], Eucalyptus urophylla [40], Cucumis sativus L. [41] and Brassica napus [11]. However, there was no GATA gene of subfamily IV found in the Arachis hypogaea L. genome, which is not consistent with the distribution of GATA families in several previously reported dicotyledons, such as Arabidopsis thaliana [6], Brassica napus [11] and Glycine max [12] and is the first report of GATA genes of subfamily IV not existing in dicotyledons. Interestingly, no GATA members of subfamily IV were identified in monocots moso bamboo and rice [6,44]. Thus, GATA genes of subfamily IV are absent in both dicotyledons and monocots.
Differences in gene structures and conserved motifs among members of the GATA protein family may result in functional divergences. As for gene structure, most (34/39) GATA members of subfamilies I and Ⅱ in cultivated peanut possess two or three exons, which is similar to subfamilies I and Ⅱ in cucumber and rapeseed [11,41]. However, all six members of subfamily Ⅲ have more than seven exons per gene, which was also found in subfamily Ⅲ in cucumber; this is different from members of the subfamily Ⅲ in Brassica napus and Salvia miltiorrhiza, some of which have less than five exons or even only one exon [11,41,45]. Furthermore, the conserved domain of all GATA members in subfamilies I and Ⅱ in cultivated peanut was identified as C-X2-C-X18-CX2C and the conserved domain of six subfamily Ⅲ proteins was C-X2-C-X20-C X2C, which is consistent with previously identified conserved structures in Ophiorrhiza pumila and Fagopyrum tataricum [46,47]. However, two GATA genes of subfamily Ⅱ such as BnGATA2.8 and BnGATA2.26 in Brassica napus harbor the N-X2-C-X18-CX2C domain and one subfamily Ⅱ GATA gene Csa4G286370 in Cucumis sativus L. possesses the C-X4-C-X18-C-X2-C domain instead of the C-X2-C-X18-CX2C conserved domain [11,41]. In addition, there were three conserved amino acid motifs TPQWRXGPXGXKTL, TX2TPLWRXGPXGPKXL and GX3KXTPXMRRGPXGPRXL found in the peanut GATA subfamilies I, Ⅱ and Ⅲ, respectively. The analysis of gene structures and conserved motifs demonstrates that GATA members of the same subfamily show relatively high conservation in different species and GATA genes between subfamilies have their own special characteristics.
The supply of nitrogen, one of the essential nutrient elements, is a key determinant for peanut growth and yield [48]. Pod yield of peanut cultivar Yuhua 23 increased by 48.8% and 108.6% with nitrogen level of 30 kg ha−1 and 60 kg ha−1, respectively [49]. In this study, increased nitrogen application from 75 kg hm−2 to 300 kg hm−2 continued to increase peanut pod yield, while it increased by only about 3% under 225 kg hm−2 and 300 kg hm−2, compared to a 150 kg hm−2 nitrogen level. Importantly, VCR values were higher than four at nitrogen levels of 75 kg hm−2 to 150 kg hm−2 from 2020 and 2022 but VCR quickly decreased below 2 at nitrogen levels of 225 kg hm−2 and 300 kg hm−2. Although VCR was still higher than 4 at 225 kg hm−2 nitrogen level in 2021, peanut pod yield was not as high as in 2020 and 2022, possibly due to heavy rain during peanut growth stages. A VCR of 2 means 100% return on the cost of purchasing fertilizer [50] and VCR ≥ 4 was regarded as more appropriate to ensure fertilizer cost [51]. So, it is worth noticing that 150 kg hm−2 nitrogen application was the best treatment suitable for peanut Yuhua 23 growth because of its highest pod yield and relatively better VCR of more than four.
GATA transcription factors have been shown to participate in nitrogen metabolism in fungi and plants [8,9,12,52,53]. For example, heterologous expression of a putative GATA gene DhGZF3 in Saccharomyces cerevisiae was found to regulate nitrogen metabolic genes [54]. Overexpression of poplar GATA transcription factor PdGNC in Arabidopsis thaliana had pronounced effects on growth rate, chloroplast ultrastructure and photosynthetic capacity under low nitrogen levels [53]. Two soybean GATA members GmGATA44 and GmGATA58 were found to potentially regulate nitrogen metabolism [12]. In our study, most members of the GATA family in cultivated peanut were up-regulated and very few members are down-regulated under a 150 kg hm−2 nitrogen level. In particular, the expression level of several GATA genes including Z6CAHI.1, LJYJ4M.1, MTW1LM.1 and TF5DD7.1 was induced more than 40-fold compared to the control and thus it could be speculated that they are involved in nitrogen metabolism regulation because the promoter regions of eight nitrogen metabolism-related genes in the cultivated genome, including two nitrite reductase genes (X7K798 and AXQD4Y), two nitrate reductase genes (7L21K7 and B2KMHD) and four glutamine synthetase genes (0KDC5W, HA9E1Y, PJ2I0S and 9W4G6J), harbored several DNA binding sites for GATA transcription factors (Table S2).

5. Conclusions

Taken together, a systematic characterization of the GATA gene family and patterns of their expression under different nitrogen levels in Arachis hypogaea L. was performed and the results provide valuable information for further understanding functional differences in GATA transcription factors’ response to nitrogen application in cultivated peanut.

Supplementary Materials

The following supporting information can be downloaded at: https://www.mdpi.com/article/10.3390/agronomy13010215/s1, Table S1. Primers used in this study; Table S2. DNA binding sites identified for GATA factors of 8 nitrogen metabolism-related genes in the cultivated genome by PlantPAN3.0.

Author Contributions

Conceptualization, X.L.; X.D. and S.H.; methodology, X.L.; X.D. and S.H.; formal analysis, X.L.; writing—original draft preparation, X.L.; writing—review and editing, X.Z. and T.D.; funding acquisition, X.Z. All authors have read and agreed to the published version of the manuscript.

Funding

This study was supported by the China Agriculture Research System of MOF and MARA (CARS-13).

Data Availability Statement

No new data available.

Acknowledgments

We would like to thank Xiuping Wang and Wen Xu (Henan Academy of Agricultural Sciences) for their support and advice.

Conflicts of Interest

The authors declare no conflict of interest.

References

  1. Schwechheimer, C.; Schroder, P.M.; Blaby-Haas, C.E. Plant GATA Factors: Their Biology, Phylogeny, and Phylogenomics. Annu. Rev. Plant Biol. 2022, 73, 123–148. [Google Scholar] [CrossRef] [PubMed]
  2. Lowry, J.A.; Atchley, W.R. Molecular evolution of the GATA family of transcription factors: Conservation within the DNA-binding domain. J. Mol. Evol. 2000, 50, 103–115. [Google Scholar] [CrossRef] [PubMed]
  3. Patient, R.K.; McGhee, J.D. The GATA family (vertebrates and invertebrates). Curr. Opin. Genet. Dev. 2002, 12, 416–422. [Google Scholar] [CrossRef] [PubMed]
  4. Teakle, G.R.; Gilmartin, P.M. Two forms of type IV zinc-finger motif and their kingdom-specific distribution between the flora, fauna and fungi. Trends Biochem. Sci. 1998, 23, 100–102. [Google Scholar] [CrossRef]
  5. Scazzocchio, C. The fungal GATA factors. Curr. Opin. Microbiol. 2000, 3, 126–131. [Google Scholar] [CrossRef]
  6. Reyes, J.C.; Muro-Pastor, M.I.; Florencio, F.J. The GATA family of transcription factors in Arabidopsis and rice. Plant Physiol. 2004, 134, 1718–1732. [Google Scholar] [CrossRef] [Green Version]
  7. Pomraning, K.R.; Bredeweg, E.L.; Baker, S.E. Regulation of Nitrogen Metabolism by GATA Zinc Finger Transcription Factors in Yarrowia lipolytica. mSphere 2017, 2, e00038-17. [Google Scholar] [CrossRef] [Green Version]
  8. Daniel-Vedele, F.; Caboche, M. A tobacco cDNA clone encoding a GATA-1 zinc finger protein homologous to regulators of nitrogen metabolism in fungi. Mol. Gen. Genet. MGG 1993, 240, 365–373. [Google Scholar] [CrossRef]
  9. Hudson, D.; Guevara, D.R.; Hand, A.J.; Xu, Z.; Hao, L.; Chen, X.; Zhu, T.; Bi, Y.M.; Rothstein, S.J. Rice cytokinin GATA transcription Factor1 regulates chloroplast development and plant architecture. Plant Physiol 2013, 162, 132–144. [Google Scholar] [CrossRef] [Green Version]
  10. Shin, J.M.; Chung, K.; Sakamoto, S.; Kojima, S.; Yeh, C.M.; Ikeda, M.; Mitsuda, N.; Ohme-Takagi, M. The chimeric repressor for the GATA4 transcription factor improves tolerance to nitrogen deficiency in Arabidopsis. Plant Biotechnol. 2017, 34, 151–158. [Google Scholar] [CrossRef] [Green Version]
  11. Zhu, W.; Guo, Y.; Chen, Y.; Wu, D.; Jiang, L. Genome-wide identification, phylogenetic and expression pattern analysis of GATA family genes in Brassica napus. BMC Plant Biol. 2020, 20, 543. [Google Scholar] [CrossRef]
  12. Zhang, C.; Hou, Y.; Hao, Q.; Chen, H.; Chen, L.; Yuan, S.; Shan, Z.; Zhang, X.; Yang, Z.; Qiu, D.; et al. Genome-wide survey of the soybean GATA transcription factor gene family and expression analysis under low nitrogen stress. PLoS ONE 2015, 10, e0125174. [Google Scholar] [CrossRef] [Green Version]
  13. Luo, X.M.; Lin, W.H.; Zhu, S.; Zhu, J.Y.; Sun, Y.; Fan, X.Y.; Cheng, M.; Hao, Y.; Oh, E.; Tian, M.; et al. Integration of light- and brassinosteroid-signaling pathways by a GATA transcription factor in Arabidopsis. Dev. Cell 2010, 19, 872–883. [Google Scholar] [CrossRef] [Green Version]
  14. Jeong, M.J.; Shih, M.C. Interaction of a GATA factor with cis-acting elements involved in light regulation of nuclear genes encoding chloroplast glyceraldehyde-3-phosphate dehydrogenase in Arabidopsis. Biochem. Biophys. Res. Commun. 2003, 300, 555–562. [Google Scholar] [CrossRef]
  15. Zhao, Y.; Medrano, L.; Ohashi, K.; Fletcher, J.C.; Yu, H.; Sakai, H.; Meyerowitz, E.M. HANABA TARANU is a GATA transcription factor that regulates shoot apical meristem and flower development in Arabidopsis. Plant Cell 2004, 16, 2586–2600. [Google Scholar] [CrossRef] [Green Version]
  16. Nishii, A.; Takemura, M.; Fujita, H.; Shikata, M.; Yokota, A.; Kohchi, T. Characterization of a novel gene encoding a putative single zinc-finger protein, ZIM, expressed during the reproductive phase in Arabidopsis thaliana. Biosci. Biotechnol. Biochem. 2000, 64, 1402–1409. [Google Scholar] [CrossRef] [Green Version]
  17. Liu, P.P.; Koizuka, N.; Martin, R.C.; Nonogaki, H. The BME3 (Blue Micropylar End 3) GATA zinc finger transcription factor is a positive regulator of Arabidopsis seed germination. Plant J. Cell Mol. Biol. 2005, 44, 960–971. [Google Scholar] [CrossRef]
  18. Wang, L.; Yin, H.; Qian, Q.; Yang, J.; Huang, C.; Hu, X.; Luo, D. NECK LEAF 1, a GATA type transcription factor, modulates organogenesis by regulating the expression of multiple regulatory genes during reproductive development in rice. Cell Res. 2009, 19, 598–611. [Google Scholar] [CrossRef] [Green Version]
  19. Liu, H.; Li, T.; Wang, Y.; Zheng, J.; Li, H.; Hao, C.; Zhang, X. TaZIM-A1 negatively regulates flowering time in common wheat (Triticum aestivum L.). J. Integr. Plant Biol. 2019, 61, 359–376. [Google Scholar] [CrossRef] [Green Version]
  20. Warning, H.O.; Hachtel, W. Functional analysis of a nitrite reductase promoter from birch in transgenic tobacco. Plant Sci. 2000, 155, 141–151. [Google Scholar] [CrossRef]
  21. Rastogi, R.; Bate, N.J.; Sivasankar, S.; Rothstein, S.J. Footprinting of the spinach nitrite reductase gene promoter reveals the preservation of nitrate regulatory elements between fungi and higher plants. Plant Mol. Biol. 1997, 34, 465–476. [Google Scholar] [CrossRef]
  22. Oliveira, I.C.; Coruzzi, G.M. Carbon and amino acids reciprocally modulate the expression of glutamine synthetase in Arabidopsis. Plant Physiol. 1999, 121, 301–310. [Google Scholar] [CrossRef] [Green Version]
  23. Krishna, G.; Singh, B.K.; Kim, E.K.; Morya, V.K.; Ramteke, P.W. Progress in genetic engineering of peanut (Arachis hypogaea L.)—A review. Plant Biotechnol. J. 2015, 13, 147–162. [Google Scholar] [CrossRef]
  24. Luo, H.; Ren, X.; Li, Z.; Xu, Z.; Li, X.; Huang, L.; Zhou, X.; Chen, Y.; Chen, W.; Lei, Y.; et al. Co-localization of major quantitative trait loci for pod size and weight to a 3.7 cM interval on chromosome A05 in cultivated peanut (Arachis hypogaea L.). BMC Genom. 2017, 18, 58. [Google Scholar] [CrossRef] [Green Version]
  25. Tegeder, M.; Masclaux-Daubresse, C. Source and sink mechanisms of nitrogen transport and use. New Phytol 2018, 217, 35–53. [Google Scholar] [CrossRef] [PubMed] [Green Version]
  26. Sarah, E.C. Nitrogen limitation of rhizoma peanut growth. J. Plant Nutr. 2013, 36, 311–328. [Google Scholar] [CrossRef]
  27. Hubick, K.T. Effects of Nitrogen Source and Water Limitation on Growth, Transpiration Efficiency and Carbon-Isotope Discrimination in Peanut Cultivars. Funct. Plant Biol. 1990, 17, 413–430. [Google Scholar] [CrossRef]
  28. Finn, R.D.; Coggill, P.; Eberhardt, R.Y.; Eddy, S.R.; Mistry, J.; Mitchell, A.L.; Potter, S.C.; Punta, M.; Qureshi, M.; Sangrador-Vegas, A.; et al. The Pfam protein families database: Towards a more sustainable future. Nucleic Acids Res. 2016, 44, D279–D285. [Google Scholar] [CrossRef] [PubMed]
  29. Paysan-Lafosse, T.; Blum, M.; Chuguransky, S.; Grego, T.; Pinto, B.L.; Salazar, G.A.; Bileschi, M.L.; Bork, P.; Bridge, A.; Colwell, L.; et al. InterPro in 2022. Nucleic Acids Res. 2022, 51, D418–D427. [Google Scholar] [CrossRef]
  30. Eddy, S.R. Accelerated Profile HMM Searches. PLoS Comput. Biol. 2011, 7, e1002195. [Google Scholar] [CrossRef] [Green Version]
  31. Letunic, I.; Khedkar, S.; Bork, P. SMART: Recent updates, new developments and status in 2020. Nucleic Acids Res. 2021, 49, D458–D460. [Google Scholar] [CrossRef]
  32. Edgar, R.C. MUSCLE: Multiple sequence alignment with high accuracy and high throughput. Nucleic Acids Res. 2004, 32, 1792–1797. [Google Scholar] [CrossRef] [Green Version]
  33. Kumar, S.; Stecher, G.; Tamura, K. MEGA7: Molecular Evolutionary Genetics Analysis Version 7.0 for Bigger Datasets. Mol. Biol. Evol. 2016, 33, 1870–1874. [Google Scholar] [CrossRef] [Green Version]
  34. Hu, B.; Jin, J.; Guo, A.Y.; Zhang, H.; Luo, J.; Gao, G. GSDS 2.0: An upgraded gene feature visualization server. Bioinformatics 2015, 31, 1296–1297. [Google Scholar] [CrossRef] [Green Version]
  35. Bailey, T.L.; Boden, M.; Buske, F.A.; Frith, M.; Grant, C.E.; Clementi, L.; Ren, J.; Li, W.W.; Noble, W.S. MEME SUITE: Tools for motif discovery and searching. Nucleic Acids Res. 2009, 37, W202–W208. [Google Scholar] [CrossRef]
  36. Chow, C.N.; Lee, T.Y.; Hung, Y.C.; Li, G.Z.; Tseng, K.C.; Liu, Y.H.; Kuo, P.L.; Zheng, H.Q.; Chang, W.C. PlantPAN3.0: A new and updated resource for reconstructing transcriptional regulatory networks from ChIP-seq experiments in plants. Nucleic Acids Res. 2019, 47, D1155–D1163. [Google Scholar] [CrossRef] [Green Version]
  37. Chen, C.; Chen, H.; Zhang, Y.; Thomas, H.R.; Frank, M.H.; He, Y.; Xia, R. TBtools: An Integrative Toolkit Developed for Interactive Analyses of Big Biological Data. Mol. Plant 2020, 13, 1194–1202. [Google Scholar] [CrossRef]
  38. Abdalla, E.A.; Osman, A.K.; Maki, M.A.; Nur, F.M.; Ali, S.B.; Aune, J.B. The Response of Sorghum, Groundnut, Sesame, and Cowpea to Seed Priming and Fertilizer Micro-Dosing in South Kordofan State, Sudan. Agronomy 2015, 5, 476–490. [Google Scholar] [CrossRef] [Green Version]
  39. Jiang, C.; Li, X.; Zou, J.; Ren, J.; Jin, C.; Zhang, H.; Yu, H.; Jin, H. Comparative transcriptome analysis of genes involved in the drought stress response of two peanut (Arachis hypogaea L.) varieties. BMC Plant Biol. 2021, 21, 64. [Google Scholar] [CrossRef]
  40. Du, K.; Xia, Y.; Zhan, D.; Xu, T.; Lu, T.; Yang, J.; Kang, X. Genome-Wide Identification of the Eucalyptus urophylla GATA Gene Family and Its Diverse Roles in Chlorophyll Biosynthesis. Int. J. Mol. Sci. 2022, 23, 5251. [Google Scholar] [CrossRef]
  41. Zhang, K.; Jia, L.; Yang, D.; Hu, Y.; Njogu, M.K.; Wang, P.; Lu, X.; Yan, C. Genome-Wide Identification, Phylogenetic and Expression Pattern Analysis of GATA Family Genes in Cucumber (Cucumis sativus L.). Plants 2021, 10, 1626. [Google Scholar] [CrossRef] [PubMed]
  42. Du, X.; Lu, Y.; Sun, H.; Duan, W.; Hu, Y.; Yan, Y. Genome-Wide Analysis of Wheat GATA Transcription Factor Genes Reveals Their Molecular Evolutionary Characteristics and Involvement in Salt and Drought Tolerance. Int. J. Mol. Sci. 2023, 24, 27. [Google Scholar] [CrossRef] [PubMed]
  43. Wang, T.; Yang, Y.; Lou, S.; Wei, W.; Zhao, Z.; Ren, Y.; Lin, C.; Ma, L. Genome-Wide Characterization and Gene Expression Analyses of GATA Transcription Factors in Moso Bamboo (Phyllostachys edulis). Int. J. Mol. Sci. 2019, 21, 14. [Google Scholar] [CrossRef] [PubMed] [Green Version]
  44. Li, H.; Liu, T.; Wang, B.; Li, H. Genome-Wide Characterization and Expression Analysis of GATA Transcription Factors in Response to Methyl Jasmonate in Salvia miltiorrhiza. Genes 2022, 13, 822. [Google Scholar] [CrossRef] [PubMed]
  45. Shi, M.; Huang, Q.; Wang, Y.; Wang, C.; Zhu, R.; Zhang, S.; Kai, G. Genome-wide survey of the GATA gene family in camptothecin-producing plant Ophiorrhiza pumila. BMC Genom. 2022, 23, 256. [Google Scholar] [CrossRef]
  46. Yao, X.; Zhou, M.; Ruan, J.; He, A.; Ma, C.; Wu, W.; Lai, D.; Fan, Y.; Gao, A.; Weng, W.; et al. Genome-Wide Identification, Evolution, and Expression Pattern Analysis of the GATA Gene Family in Tartary Buckwheat (Fagopyrum tataricum). Int. J. Mol. Sci. 2022, 23, 12434. [Google Scholar] [CrossRef]
  47. Mondal, M.; Skalicky, M.; Garai, S.; Hossain, A.; Sarkar, S.; Banerjee, H.; Kundu, R.; Brestic, M.; Barutcular, C.; Erman, M.; et al. Supplementing Nitrogen in Combination with Rhizobium Inoculation and Soil Mulch in Peanut (Arachis hypogaea L.) Production System: Part II. Effect on Phenology, Growth, Yield Attributes, Pod Quality, Profitability and Nitrogen Use Efficiency. Agronomy 2020, 10, 1513. [Google Scholar] [CrossRef]
  48. Xin, C.; Qing-wei, Y.; Jia-lin, S.; Shuang, X.; Fu-chun, X.; Ya-jun, C. Research Progress on Nitrogen Use and Plant Growth. J. Northeast Agric. Univ. 2014, 21, 68–74. [Google Scholar] [CrossRef]
  49. Kihara, J.; Huising, J.; Nziguheba, G.; Waswa, B.S.; Njoroge, S.; Kabambe, V.; Iwuafor, E.; Kibunja, C.; Esilaba, A.O.; Coulibaly, A. Maize response to macronutrients and potential for profitability in sub-Saharan Africa. Nutr. Cycl. Agroecosyst. 2016, 105, 171–181. [Google Scholar] [CrossRef] [Green Version]
  50. Kiwia, A.; Kimani, D.; Harawa, R.; Jama, B.; Sileshi, G.W. Fertiliser use efficiency, production risks and profitability of maize on smallholder farms in East Africa. Exp. Agric. 2022, 58, e22. [Google Scholar] [CrossRef]
  51. Fu, Y.H.; Marzluf, G.A. nit-2, the major nitrogen regulatory gene of Neurospora crassa, encodes a protein with a putative zinc finger DNA-binding domain. Mol. Cell. Biol. 1990, 10, 1056–1065. [Google Scholar] [CrossRef]
  52. An, Y.; Han, X.; Tang, S.; Xia, X.; Yin, W. Poplar GATA transcription factor PdGNC is capable of regulating chloroplast ultrastructure, photosynthesis, and vegetative growth in Arabidopsis under varying nitrogen levels. Plant Cell Tissue Organ Cult. (PCTOC) 2014, 119, 313–327. [Google Scholar] [CrossRef]
  53. Garcia-Salcedo, R.; Casamayor, A.; Ruiz, A.; Gonzalez, A.; Prista, C.; Loureiro-Dias, M.C.; Ramos, J.; Arino, J. Heterologous expression implicates a GATA factor in regulation of nitrogen metabolic genes and ion homeostasis in the halotolerant yeast Debaryomyces hansenii. Eukaryot Cell 2006, 5, 1388–1398. [Google Scholar] [CrossRef] [Green Version]
  54. Bitter, G.A.; Egan, K.M. Expression of heterologous genes in Saccharomyces cerevisiae from vectors utilizing the glyceraldehyde-3-phosphate dehydrogenase gene promoter. Gene 1984, 32, 263–274. [Google Scholar] [CrossRef]
Figure 1. Phylogenetic relationships of GATA proteins from A. thaliana and A. hypogaea L. Green indicates subfamily Ⅰ. Purple indicates subfamily Ⅱ. Red indicates subfamily Ⅲ. Blue indicates subfamily Ⅳ. Solid and hollow represent GATA family members in A. thaliana and A. hypogaea L., respectively.
Agronomy 13 00215 g001
Figure 2. Alignments of GATA domains of all identified GATA family members in A. hypogaea L. The positions of highly conserved amino acids are marked with asterisk on the bottom.
Agronomy 13 00215 g002
Figure 3. Gene structures of all identified GATA family members in A. hypogaea L.
Agronomy 13 00215 g003
Figure 4. Conserved motifs of all identified GATA family members in A. hypogaea L.
Agronomy 13 00215 g004
Figure 5. Chromosome distribution of all identified GATA family members in A. hypogaea L. Red and green indicate gene located on the plus and minus strand of chromosome, respectively.
Agronomy 13 00215 g005
Figure 6. Quantitative real-time PCR detection of all identified GATA family members under different nitrogen levels. N0 and NT indicate the control and nitrogen level of 150 kg hm−2, respectively. (AC) indicate expression patterns of peanut subfamilies Ⅰ, Ⅱ and Ⅲ GATA genes, respectively. Asterisks indicate significant differences (Student’s t-test). ** and * indicated significant differences with p-values smaller than 0.01 and 0.05, respectively.
Agronomy 13 00215 g006
Table 1. Characteristics of 45 GATA gene family members in the Arachis hypogaea L. genome.
IDsNumber of Amino AcidMolecular WeightTheoretical pIInstability IndexAliphatic IndexGrand Average of Hydropathicity (GRAVY)
1UE20Q.122425,348.526.8241.7929.69−1.135
QY7BN7.129433,214.559.0656.0665.78−0.937
C126L3.114715,730.6610.0255.4247.28−0.849
QR3GWV.113714,504.5810.2143.3259.93−0.669
B6VTS2.129632,708.738.7456.564.46−0.606
VS8GG1.133737,006.445.6258.4962.2−0.603
N4A1C9.124727,876.68.6357.3766.68−0.619
3E7WJ6.135840,639.28.9645.5258.1−1.146
3J6WSK.124927,685.518.5657.4841.61−0.788
5U2LX3.136239,790.76.0269.2657.38−0.602
V4I8CJ.141545,242.826.1955.0365.4−0.422
4Y7J59.120022,493.019.1956.6671.15−0.292
HHX0PC.130934,119.056.9551.2263.07−0.771
E1UHJ9.130834,070.786.2251.8861.46−0.636
0U49HS.128530,839.986.0749.6255.12−0.704
NH2FYW.136540,879.047.6153.8767.51−0.585
L83AAN.124328,861.036.2645.4650.91−1.19
129W39.130333,350.89642.6156.63−0.846
KA6YJ2.137840,996.296.6454.1954.23−0.733
I6JZDT.135238,037.746.1956.4759.32−0.504
86LJVS.138042,318.544.7554.5558.82−0.828
MV37LX.130834,852.796.656.8159.58−0.836
91YEB7.122525,302.446.7841.8228.71−1.091
36H91F.116417,331.9310.1936.8467.32−0.502
NCU4DF.124827,988.738.4257.468.35−0.598
X8E4UZ.129632,718.728.5358.0565.14−0.622
LJYJ4M.133736,989.375.459.7161.9−0.611
2SUK7S.134538,773.258.9847.3160.58−1.069
TF5DD7.124927,663.468.3657.1841.61−0.789
54XSGH.136239,784.736.0270.1659.53−0.581
V7E7MG.140845,052.887.1954.6667.94−0.425
C6NV9N.110812,119.71954.7756.11−0.849
D56WMI.113314,754.159.3356.1860.9−0.55
GUPV5U.130934,092.036.9551.362.46−0.78
18HYB7.137941,754.296.3441.0357.84−0.676
MTW1LM.137941,924.556.3441.3457.57−0.687
EI5605.128530,839.986.0749.6255.12−0.704
Z6CAHI.130834,178.926.3751.3560.19−0.679
FRWT0V.136540,728.877.5952.7966.44−0.556
69GBM5.124329,025.265.9554.1447.28−1.137
QG9XFC.132636,002.16641.9659.51−0.703
DG0T3J.137841,109.546.6153.6552.94−0.731
3S8P0L.135237,994.676.0156.1259.32−0.496
2L20XB.137641,855.974.7553.8760.74−0.84
23I7N3.130734,739.636.4657.1759.45−0.842
Table 2. Paralogs of GATA family genes in Arachis hypogaea L.
ChromosomeGene IDsStartEndStrandChromosomeGene IDsStartEndStrandProtein Identity (%)
Chr01C126L3.1101,123,945101,125,505+Chr01QR3GWV.1101,126,574101,128,26275.781
Chr132SUK7S.141,897,73241,900,296Chr033E7WJ6.139,900,00139,903,17192.265
Chr064Y7J59.15,609,8025,611,267Chr16D56WMI.116,199,51116,200,847+93.431
Chr08L83AAN.147,690,36247,691,491Chr1869GBM5.1131,169,543131,170,27494.47
Chr1618HYB7.1142,009,810142,012,509Chr16MTW1LM.1144,667,753144,670,40795.778
Chr011UE20Q.11,145,9841,148,294Chr1191YEB7.115,059,03115,060,930+96.444
Chr05V4I8CJ.1115,242,703115,246,472+Chr15V7E7MG.1160,303,681160,307,678+96.448
Chr1086LJVS.14,866,4114,870,550Chr202L20XB.19,721,3459,725,57197.368
Chr08NH2FYW.128,796,52228,800,772Chr18FRWT0V.14,511,3914,515,67097.534
Chr1136H91F.1142,387,755142,389,602+Chr01QR3GWV.1101,126,574101,128,26297.81
Chr03N4A1C9.114,791,31714,793,255+Chr12NCU4DF.170,664,81470,666,699+97.984
Chr09KA6YJ2.13,033,6913,036,478Chr19DG0T3J.13,908,6993,911,48698.148
Chr07E1UHJ9.152,962,21052,963,745+Chr18Z6CAHI.11,344,5421,346,25998.701
Chr10MV37LX.199,237,01399,238,881+Chr2023I7N3.1122,307,538122,309,406+98.701
Chr16GUPV5U.1125,861,212125,862,943+Chr06HHX0PC.194,867,24194,868,959+98.706
Chr03B6VTS2.11,591,6081,595,718+Chr13X8E4UZ.13,376,9123,381,028+98.986
Chr03VS8GG1.16,552,3966,554,643Chr13LJYJ4M.17,985,6297,987,892+99.11
Chr09I6JZDT.1118,856,896118,860,690Chr193S8P0L.1146,525,935146,529,609+99.148
Chr055U2LX3.111,738,07211,740,438+Chr1554XSGH.112,325,12912,327,494+99.448
Chr053J6WSK.110,491,80110,493,761+Chr15TF5DD7.110,965,22610,967,089+99.598
Chr09129W39.1210,176213,603Chr19QG9XFC.1277,509280,578+99.67
Chr080U49HS.114,943,75714,948,081+Chr17EI5605.1131,669,993131,674,406+100
Note: + and − indicate the plus and minus strand of chromosome, respectively.
Table 3. Effects of different nitrogen levels on TPP, EPP, HPW, Pod Yield and VCR.
YearNitrogen Levels
(kg hm−2)
TPPEPPHPW (g)Pod Yield
(kg hm−2)
VCR
2020021.0 ± 1.3 d10.6 ± 0.3 c179.1 ± 3.5 c3595.8 ± 29.8 d/
7526.8 ± 2.3 c12.2 ± 0.4 b184.6 ± 6.5 bc4265.7 ± 24.2 c15.0 ± 0.7 a
15035.2 ± 1.6 b13.3 ± 0.3 a190.0 ± 3.4 ab4799.3 ± 25.2 b11.9 ± 0.8 a
22541.8 ± 1.4 a13.6 ± 0.4 a192.0 ± 4.9 a4886.1 ± 20.2 a1.9 ± 0.5 b
30043.7 ± 1.4 a13.3 ± 0.4 a194.7 ± 5.6 a4860.4 ± 22.8 a−0.6 ± 0.7 b
2021019.5 ± 1.4 d9.7 ± 0.3 b157.0 ± 5.6 b2884.0 ± 24.2 d/
7525.6 ± 2.7 c11.7 ± 1.5 a158.9 ± 20.6 ab3489.8 ± 36.1 c13.2 ± 0.8 a
15032.7 ± 2.1 b12.4 ± 0.1 a167.4 ± 1.1 ab3927.9 ± 16.1 b9.5 ± 0.5 ab
22540.6 ± 1.4 a12.6 ± 0.3 a173.2 ± 3.4 a4144.0 ± 19.9 a4.7 ± 0.1 bc
30042.1 ± 1.9 a12.6 ± 0.6 a172.5 ± 9.0 ab4137.8 ± 23.1 a−0.1 ± 0.7 c
2022023.4 ± 1.6 d10.7 ± 0.2 d185.1 ± 3.3 b3763.7 ± 9.6 d/
7529.3 ± 0.8 c12.6 ± 0.1 c187.4 ± 2.1 b4478.1 ± 22.6 c11.8 ± 0.3 a
15037.1 ± 4.2 b13.2 ± 0.5 b202.9 ± 7.3 a5064.3 ± 32.0 b9.7 ± 0.2 a
22542.9 ± 3.0 a13.6 ± 0.3 a202.8 ± 4.2 a5178.6 ± 15.7 a1.9 ± 0.6 b
30045.2 ± 2.5 a13.4 ± 0.4 ab206.1 ± 6.2 a5155.0 ± 26.0 a−0.4 ± 0.3 b
ANOVA
N558.16 *70.05 *13.56 *6681.25 *717.70 *
Y4.69 *18.76 *96.46 *9627.63 *6.89 *
N×Y0.280.270.4318.10 *7.44 *
Note: data are Mean ± SD; Different letters (a, b, c and d) in the same column indicate significant difference at p values < 0.05 level. * indicates significant difference at 0.05 probability level.
Disclaimer/Publisher’s Note: The statements, opinions and data contained in all publications are solely those of the individual author(s) and contributor(s) and not of MDPI and/or the editor(s). MDPI and/or the editor(s) disclaim responsibility for any injury to people or property resulting from any ideas, methods, instructions or products referred to in the content.

