Article

BSA-Seq Approach Identified Candidate Region and Diagnostic Marker for Chilling Tolerance of High Oleic Acid Peanut at Germination Stage

1
College of Agronomy, Shenyang Agricultural University, Shenyang 110161, China
2
Institute of Sandy Land Management and Utilization of Liaoning, Fuxin 123000, China
3
Henan Academy of Crop Molecular Breeding, Henan Academy of Agricultural Science, Zhengzhou 450002, China
*
Authors to whom correspondence should be addressed.
Agronomy 2023, 13(1), 18; https://doi.org/10.3390/agronomy13010018
Submission received: 19 November 2022 / Revised: 12 December 2022 / Accepted: 13 December 2022 / Published: 21 December 2022

Abstract

:
High oleic acid peanut (HOAP) is extensively embraced in China because of its high nutritional value and enhanced oxidative stability. However, its dissemination has been severely constrained in high altitude and high latitude areas due to chilling stress during sowing, resulting in significant yield loss in these regions. Despite the lack of understanding of the molecular mechanisms underlying low temperature germination (LTG) in HOAP, discovering the quantitative trait loci (QTL) that confer this trait will undoubtedly benefit breeding efforts. In the present study, we identified putative genomic regions and single nucleotide polymorphisms (SNPs) that govern LTG tolerance of HOAP in an F2 population derived from the cross of chilling-tolerant YH65 and chilling-sensitive FL14 using bulk segregant analysis (BSA). Analysis of ΔSNP-index and Euclidean distance (ED) value association pinpointed the overlapped region to a 2.29 Mb interval on chromosome A05. The candidate interval showed that 122 genes were significantly related to response to abiotic stress and plant–pathogen interaction. Furthermore, an SNP site associated with LTG tolerance was discovered. The SNP site was employed as a Kompetitive Allele Specific PCR (KASP) marker and validated in a universal peanut panel. These findings may provide valuable insight into the molecular mechanism underpinning LTG tolerance and facilitate marker-assisted selective breeding in HOAP.

1. Introduction

Peanut (Arachis hypogaea L.) is a globally important economic crop and a valuable source of vegetable oil and protein for human consumption [1]. It originated from tropical and subtropical regions and is cultivated in more than 100 countries, with a total production of 53.6 million tons of pods (with shell) from a global planting area of 31.6 million hectares in 2020 (FAOSTAT). The quality and nutritional value of peanuts are largely determined by their fatty acid composition, especially the percentage of oleic acid. Oleic acid accounts for 48~54% of total fatty acids in conventional peanuts, while it can reach up to 80% in a high oleic acid peanut (HOAP) germplasm that contains two recessive alleles, ahFAD2A on linkage group A09 and ahFAD2B on linkage group A19 [2,3]. Compared with conventional peanut, HOAP and its processed products are endowed with stronger antioxidant capacity and reduced potential for rancidification, which results in prolonging shelf life for storage. HOAP is also preferred for its human health benefits, which include selectively reducing low-density lipoprotein and preventing atherosclerotic cardiovascular and cerebrovascular diseases [4,5]. The term “HOAP” was coined by Norden et al. in 1987, when the natural high-oleic peanut mutant line, F435, was identified, which was then incorporated into the first HOAP breeding line named SunOleic95R in the United States and rapidly spread worldwide [6,7]. HOAP breeding in China began relatively late; since the self-selected HOAP cultivar Huayu32, 187 HOAP cultivars were bred in China by July 2021 [4]. Despite the fact that numerous HOAP cultivars have been established, the majority of them were derived from high-oleic parents that come from a very small genetic pool through hybridization and pedigree selection [8]. It is undeniable that HOAP breeding has been severely hampered by the constraints imposed by the narrow genetic grounds of the current breeding stocks. Recent years have seen a surge in breeding efforts aimed at selecting for elite HOAP germplasms by introgression of genes imparting favorable traits, such as stress resilience and high yield, in response to rising consumer awareness of the health benefits of high-oleic peanuts and the demands of food manufacturers for longer shelf-life peanut products [9,10].
Peanuts are sensitive to a variety of abiotic stresses, but low temperatures (non-freezing) are particularly problematic since they adversely affect peanut development and limit the planting range [11]. Due to adjustment in crop structure and rising consumer demand, there is an impetus to expand peanut growth to high latitude and high altitude regions [12]. As a result, low temperature has become a common constraint for peanut production in these areas, which is exacerbated by global climate change [13]. As a thermophilic crop, peanut requires warm soil environment throughout its development, especially during the germination phase. The storage lipids, or seed oil, are naturally intended energy reserve for seed germination, and their amount and fatty acid composition may have a substantial impact in regulating germination rate and vigor in response to environmental challenges, particularly low temperature [14]. Jungman and Schubert found that at low temperatures, the germination rate of high-oleic peanut is lower than that of conventional peanut with normal oleic acid content [15]. It has been reported that the optimal stable soil temperature at 5 cm underground needs to be at least 18–19 °C for sowing HOAP peanuts, in contrast to 12 °C for Spanish market type and 15 °C for Virginia market type, both with normal oleic acid content [16]. The introduction of HOAP varieties to the peanut producing regions in the northeast provinces of China, where the soil temperatures in spring are considerably lower than in northern China, has been met with concerns about severe cold stress and chilling injury during spring sowing seasons, resulting in seed rot, germination delay, low seedling emergence, and eventual dwindling in nut yield [17,18]. Therefore, compared with the control measures including later sowing, use of seed coating agents, and film-covering, developing new HOAP cultivars with the trait of low temperature germination (LTG) represents a sustainable and environmentally friendly strategy for peanut industry development in the northeast provinces in China.
Understanding the molecular mechanisms and responsive pathways for LTG is a prerequisite for genetic improvement of peanut chilling tolerance. Multiple intricate mechanisms and metabolic pathways are known to be involved in the modulation and regulation of cold stress in plants [19,20]. Significant efforts have been made in peanut, including germplasm screening and evaluation, physiology and metabolite verification, genetic marker development, and modulated expression analysis of numerous candidate regulatory genes [16,17,21,22,23,24,25]. According to these findings, cold stress alters the membrane lipid phase and enzyme activity in the cells of the imbibed peanut seeds, resulting in electrolyte leakage, reactive oxygen species (ROS) accumulation, protein denaturation, and significant disturbance in metabolic homeostasis. In response, peanut plants develop an eclectic set of cold-induced protection mechanisms that involve transcriptional modulation and cell structure remodeling, such as activation of Ca2+-related protein kinase pathways and the expression of the cold-regulated (COR) gene induced by CBF/DREB, along with the excessive accumulation of specific amino acids, antioxidants, and plant hormones (abscisic acid and gibberellins). Nevertheless, these investigations focused on the effect of low temperatures on conventional peanut seedlings. Given the dramatic alteration in fatty acid composition in HOAP seed oil, it is expected that cellular membrane fluidity and dynamics at LTG would be potentially distinct from those of conventional peanut varieties; therefore, research into the specific molecular responses to cold stress in HOAP during seed germination is warranted. Furthermore, cold tolerance is a complex quantitative feature regulated by multiple genes. As a result, investigating candidate genes and diagnostic markers of cold tolerance, with specific reference to LTG, in HOAP is tremendously relevant in the era of genomics-assisted breeding (GAB).
Bulk segregant analysis (BSA), pioneered in lettuce and tomato, is an elegant method for swiftly identifying DNA markers that are tightly linked to the causal gene of a specific phenotype in polyploid crops [26,27]. With significant advancements in next-generation sequencing (NGS), the BSA-Seq can be more effective in rapidly locating the candidate genomic regions and underlying genes based on the sequence data of extreme bulks and parental genotypes, taking advantage of the drastically reduced sequencing cost [28,29]. This approach has been successfully deployed in locating resistance genes in several crops, including rice, cucumber, and soybean [30,31,32]. Cultivated peanut is an allotetraploid oilseed crop (AABB, 2n = 4× = 40), with a large genome size and highly repetitive DNA, rendering the positional cloning of target genes difficult [33]. Benefiting from the publication of the complete genome sequence of the cultivated peanut, the discovery of candidate genes and markers by leveraging BSA has become more accurate and reliable [34,35]. Quantitative trait loci (QTLs) of bacterial wilt resistance, testa color, and nodulation factors have been mapped in peanut using BSA-Seq [36,37,38]. To our knowledge, genomic regions and diagnostic markers controlling LTG tolerance of HOAP have hitherto not been reported.
In the present study, high-throughput BSA-Seq was performed in an F2 segregation population with 503 individuals, which was derived from a cross between two HOAP cultivars with a high level of phenotypic heterogeneity in LTG. Candidate genomic regions affecting the LTG of HOAP were identified and diagnostic markers with linked characteristics were verified in natural populations, which aimed to contribute to a better understanding of the molecular mechanisms that underpin HOAP’s cold response and provide the chassis for future efforts to breed HOAP with increased cold tolerance.

2. Materials and Methods

2.1. Plant Materials

An F2 population consisting of 503 individuals was derived from a cross between cold-tolerant female parent Yuhua65 (YH65) and cold-sensitive male parent FuL14 (FL14) in 2019. YH65 is a high-oleic cultivar with 75.30% oleic acid and an LTG rate of 80%, which was released by Henan Academy of Agricultural Science in 2018. FuL14 is a high-oleic breeding line selected by the Institute of Sandy Land Management and Utilization of Liaoning, with 76.50% oleic acid and an LTG rate of 45% [16]. Furthermore, the F2 population was obtained via the self-pollinated of F1. Single plants of parents and F2 population were used for phenotyping. A verification group encompassing 46 different peanut germplasms was used to ensure the accuracy of the diagnostic markers (Table S1) [39].

2.2. Evaluation of Chilling Tolerance at Germination Stage

The phenotypic evaluation experiment was conducted in the Peanut Key Laboratory of the Liaoning Institute of Sandy Land Management and Utilization. Both the F2 population and the two parents had their seeds incubated at 38 °C for 24 h to break dormancy and then the seeds were surface-sterilized with 1% sodium hypochlorite and rinsed three times with sterile deionized water. Simulating low temperature stress was accomplished in a constant temperature incubator (2 °C, in the dark), whereas rapid germination and control cultures were conducted in other incubators (28 °C or 25 °C, in the dark).
After soaking in sterile water at 28 °C for 12 h, all the imbibed seeds of F2 individuals and their two parents were numbered, sown in seed trays, and kept at 2 °C for 6 days before being transferred to 25 °C incubator for rewarming to begin the germination process. LTG tolerance was assessed on the 7th day (7 d). In the process, water was regularly replenished to prevent seed dehydration. According to Yang et al. [40], the appraisal of LTG tolerance for individual plants was performed based on seed germination rate using a scale from 1 to 5, where 1 = seed normal germination with no damage and radicle length > 2 cm; 2 = seed relatively inhibited germination and radicle length > 1 cm; 3 = germination inhibited, but the tip of radicle ruptured the seed coat > 0.2 cm; 4 = without radicle emergence, but morphology normal; 5 = nonviable seeds turning soft, even rot.
The parental seeds incubated at 25 °C rewarming for 7 d were scanned using the high-resolution plant tomography system CTporTable 160.90 (Fraunhofer EZRT, Waischenfeld, Germany) to observe the internal structure of seeds.
A total of 25 mature, uniform kernels from each accession in the verification group were spread out on moist filter papers in a petri dish and subjected to the same chilling treatment described above; germination at 25 °C served as a control. In order to eliminate the potential influence of genotypic variation, the relative germination energy (RGE) was calculated. At day 2 of resuming germination, the RGE of the verification group was evaluated [17]. RGE (%) = germinated seeds mean value of 2 °C/germinated seeds mean value of 25 °C *100%. Each treatment was repeated three times.

2.3. Construction of Segregating Pools

Genomic DNA was extracted from the seeds using the CTAB method [41], and the quality of the DNA samples was assessed using a Qubit 4.0 fluorometer in conjunction with NGS™ ds DNA HS Assay Kit (Thermo Fisher Scientific, Waltham, MA, USA) and 1.2% agarose gel electrophoresis. Tolerant bulk (HT) and sensitive bulk (HS) were developed from 30 cold-tolerant and 30 cold-sensitive individuals, respectively, based on phenotyping results from the F2 population. Equal amounts of DNA from 30 individuals were then mixed to generate the two distinct bulks, HT and HS. Further, DNA samples of the parents, YH65 and FL14, were also prepared.

2.4. Bulked Segregant Analysis (BSA)

Sequencing libraries were constructed using the DNA samples prepared from HT, HS, YH65, and FL14, with 400 bp insert sizes, by the TruSeq DNA PCR-free prep kit (Illumina, San Diego, CA, USA). The quality control of the DNA libraries was reconfirmed with an Agilent Technologies 2100 Bioanalyzer (Agilent Technologies, Palo Alto, CA, USA). These four paired-end libraries were then sequenced with the Illumina NovaSeq 6000 NGS platform (Illumina) by Personal Biotechnology Co., Ltd. (Shanghai, China). Raw data were processed to obtain high-quality clean reads by removing low-quality and short reads with the sliding-window method of fastp (v0.20.0) [42]. The DNA samples of the two parents were re-sequenced for 20× coverage, and two extreme progeny pools were re-sequenced for 30× coverage. Trimmed reads were aligned to the reference genome of Arachis hypogaea L. var. Tifrunner version 2 (https://peanutbase.org/peanut_genome, accessed on 15 November 2022) using the MEM tools in BWA software (v0.7.12) [43]. The PCR and optical duplicates were eliminated using the MarkDuplicates program in Picard (http://sourceforge.net/projects/picard/, accessed on 15 November 2022). SNPs and Insertions/Deletions (InDels) were detected for variant calling with the mutation analysis software GATK [44]. SNPs were strictly filtered with proper standards: Fisher test of strand bias (FS) > 60, Mapping Quality (MQ) < 40, Quality Depth (QD) < 2, and the variation sites were annotated for genes and functions with ANNOVAR [45].
SNP index (at a position) is the ratio of the number of aligned reads with an alternate base to the total number of reads. Any SNP positions with a read depth < 5 and a SNP index < 0.3 in either of the bulks were removed. SNPs with homozygous alleles in the two parents’ pools were selected for ΔSNP-index calculation, and ΔSNP-index statistics were used to identify statistically significant differences in genotype frequencies between HT and HS [46]. The Euclidean distance (ED) algorithm was performed to evaluate candidate regions associated with LTG tolerance [47]. The overlapping intervals identified by the two aforementioned approaches were deemed the final genomic regions of interest.

2.5. Candidate Region Gene Function Annotation

The putative protein-coding genes were annotated via the BLAST software from multiple databases [48]. Gene Ontology (GO) and Kyoto Encyclopedia of Genes and Genomes (KEGG) enrichment analyses were performed on all genes present in the candidate interval to identify critical biological processes and metabolic pathways involved in the LTG process of HOAP, as previously described [30].

2.6. KASP Marker Development and Validation

KASP markers were designed based on polymorphic SNPs between the two parents in the target candidate region [49]. The FAM, HEX, and general PCR primers were synthesized by LGC Biosearch Technologies (Hoddesdon, UK). The KASP genotyping assay of the verification group was performed on the SNPline LGC platform (LGC) [50].

2.7. Statistical Analysis of Experimental Data

Phenotypic statistics were calculated with Microsoft Excel 2010 and SAS v9.1, and the data was fitted and plotted using the R package function ggplot2 and Origin 2021.

3. Results

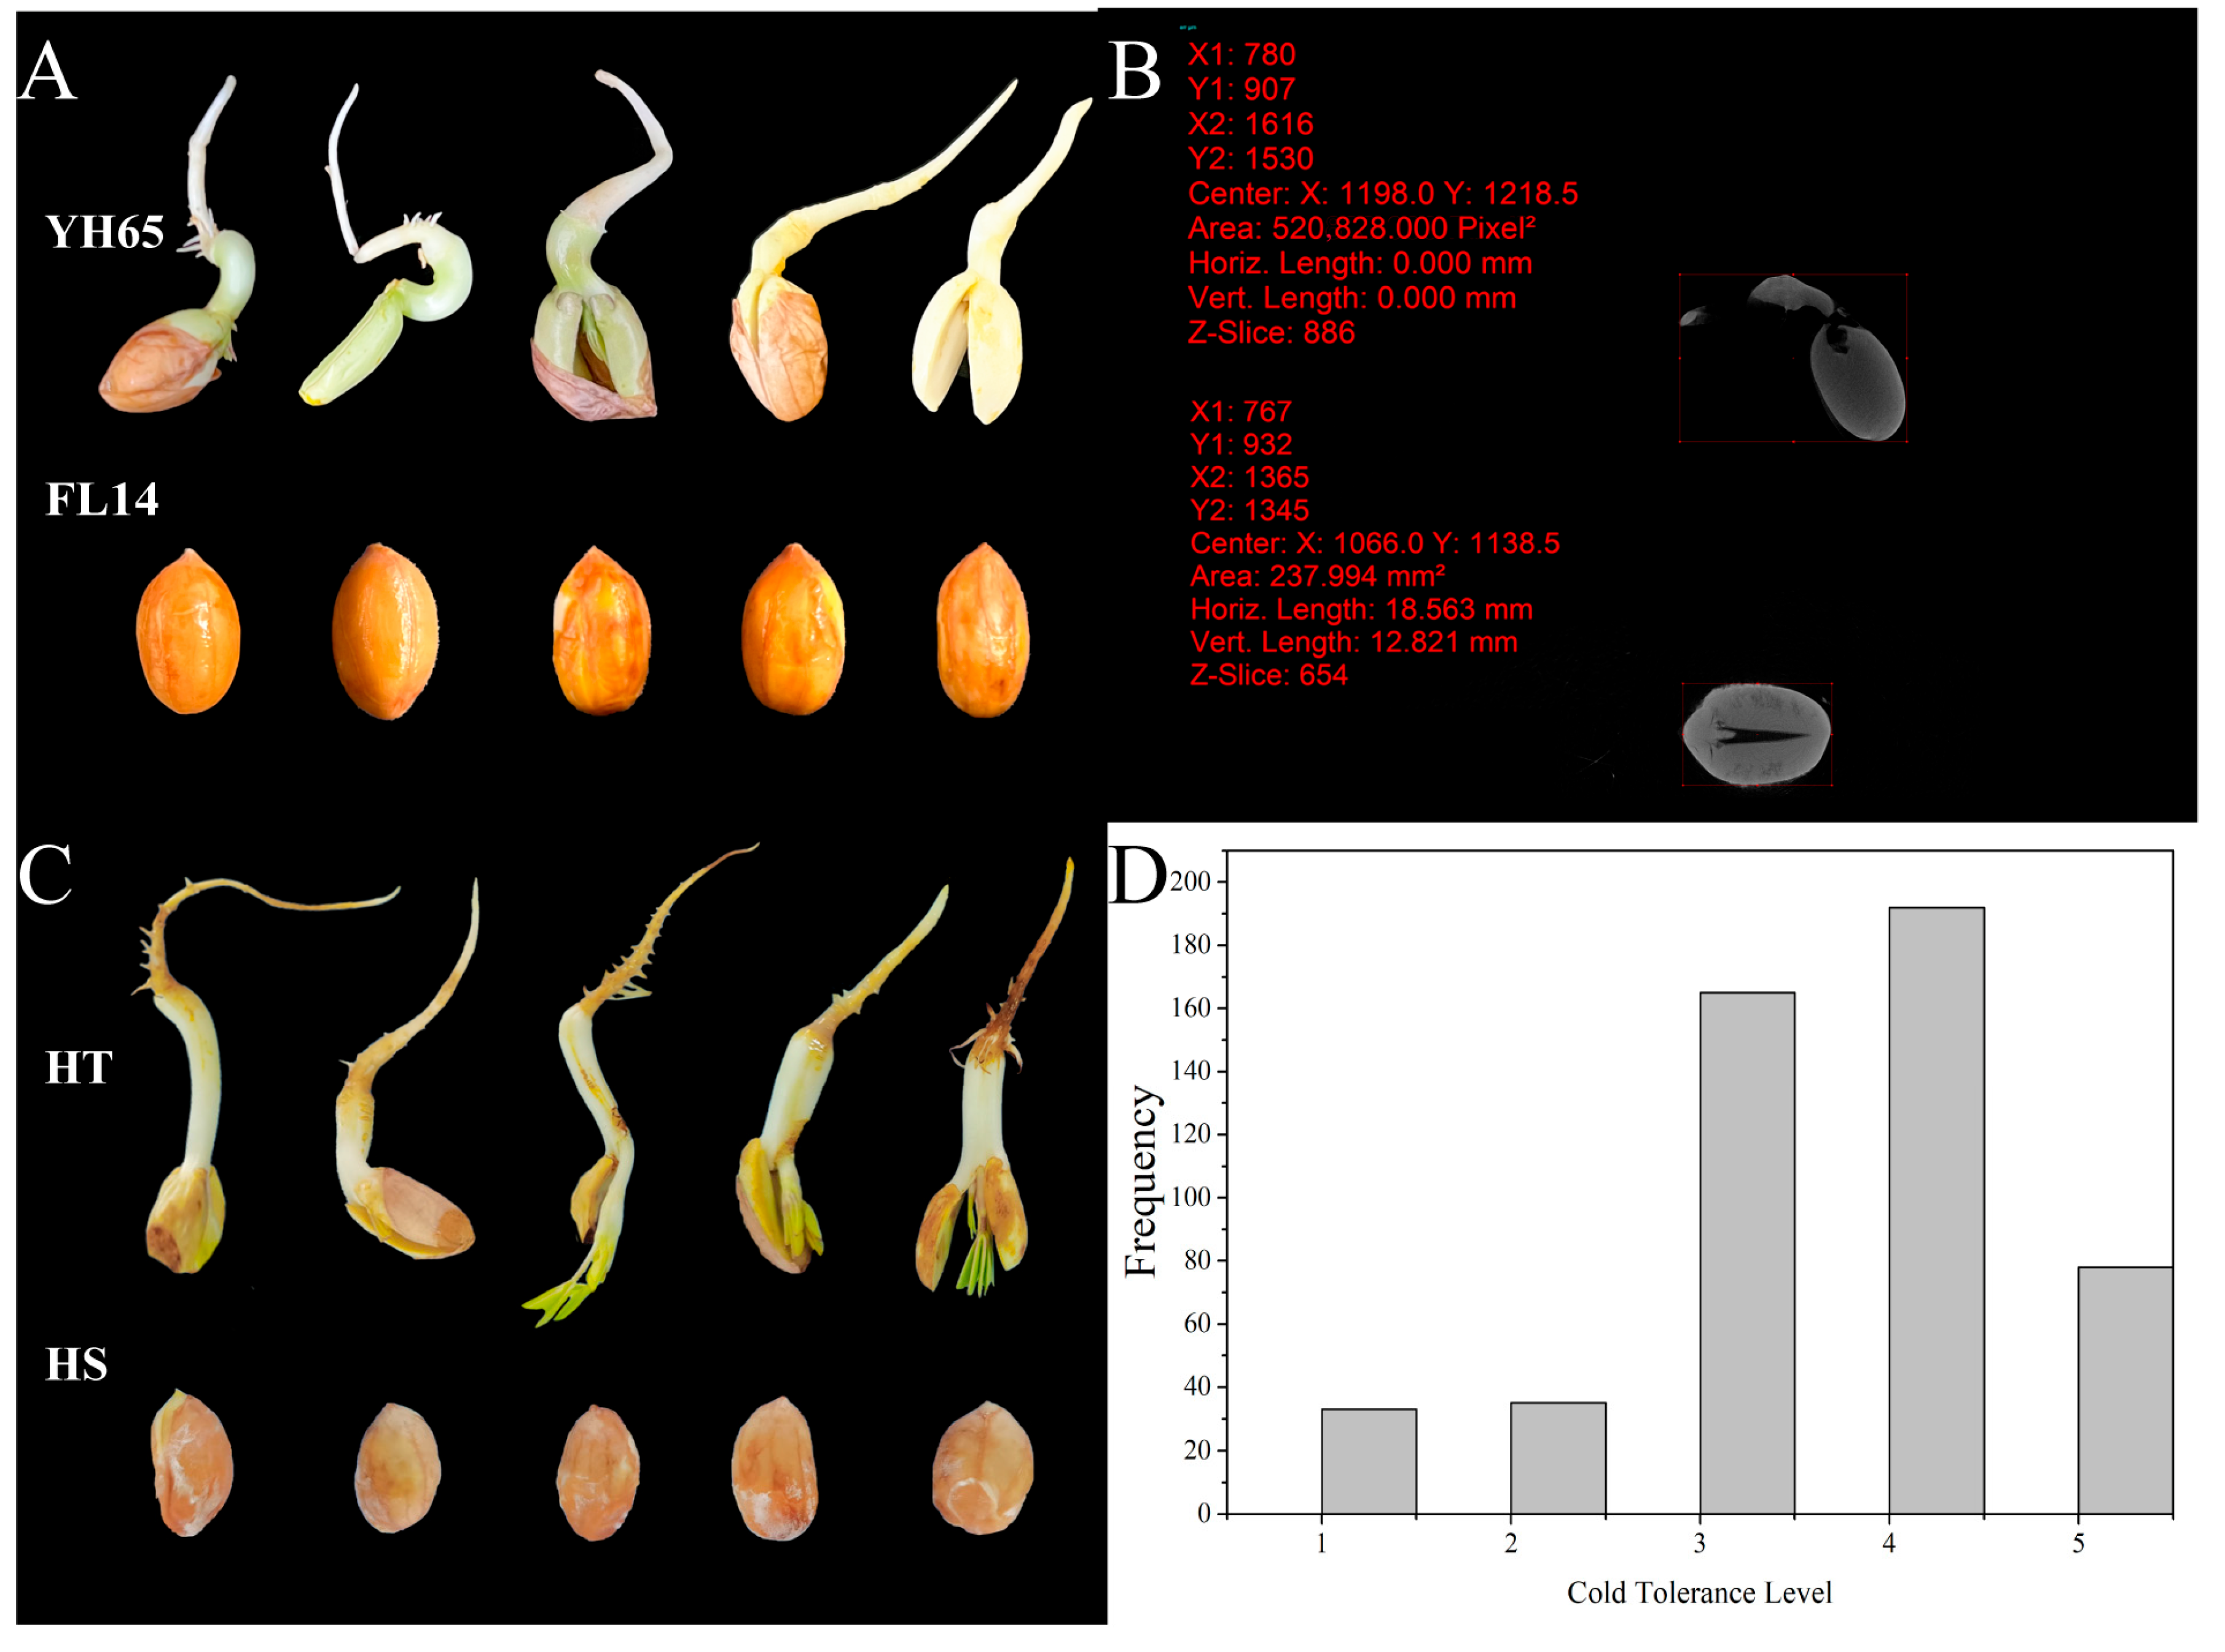
3.1. Phenotypic Analysis of the Parents and F2 Population

Parental cultivars and their derivative F2 population were evaluated for LTG tolerance at the 7 d of rewarming germination. As is evident in Figure 1A and Table 1, the cold-tolerant parent YH65 exhibited greater LTG tolerance than the cold-sensitive parent FL14. This is well in line with a previous study that reported a significant difference in germination rate between these two varieties after early sowing [16]. The plant tomography system Ctportable scan of internal structure revealed no sign of embryo germination, not even slight enlargement of cotyledons after 7 d of rewarming germination of FL14, which is in stark contrast to YH65, whose hypocotyls stretched to longer than the length of the seed itself (Figure 1B).
In the F2 population, bud length following chilling treatment varied continuously from 0.0 cm to 8.3 cm with mean value of 0.34 cm. The coefficient of variation (CV) and stander deviation (SD) of bud length was 2.681% and 0.923, respectively. The LTG scale ranged from 1 to 5 and corresponded to a normal distribution with a skew towards chilling sensitivity (Figure 1C,D, Table 1 and Table S2). Consequently, 30 individuals with scale 1 and 30 individuals with scale 5 were chosen for the HT-pool and HS-pool, respectively (Figure 1D).

3.2. Whole-Genome Resequencing and Identification of SNPs

Whole-genome resequencing data were acquired by the BSA-Seq approach and the Illumina NovaSeq high-throughput platform. In total, 55.04, 53.77, 79.26, and 81.00 Gb raw data were generated for YH65, FL14, HT, and HS sequencing libraries, with subsequent filtering yielding 332 684 456, 344 017 168, 508 218 616, 494 885 654 clean reads, respectively. The clean reads of these four samples were aligned to the reference genome of Tifrunner 2.0 with a mean mapping proportion of 99.93%, resulting in 98.95% genome coverage and 19.38× average coverage depth (Figure S1A,B). The depth was higher in extreme bulks than the parents, which corroborated the accuracy of the BSA-Seq. The Q30 (base recognition accuracy ratio > 99.9%) value ranged from 88.2% to 92.58%, and the GC content was over 37.58%. In light of these findings, it was determined that the sequencing data were of sufficient quality for further analysis (Table 2).
Four sample pools generated 532,123 SNPs and 165,692 Indels in total. SNP spectrum analysis showed that T:A > C:G and C:G > T:A were major variation types (Figure S1C). InDel type analysis indicated that small fragment insertion was the major variation (Figure S1D). Further filtering parental homozygous and polymorphic site revealed 157,470 SNPs and 37,625 InDels of which 3007 SNPs and 310 InDels were identified in exon regions, including 1960 nonsynonymous SNPs and 195 frameshift InDels (Tables S3 and S4).

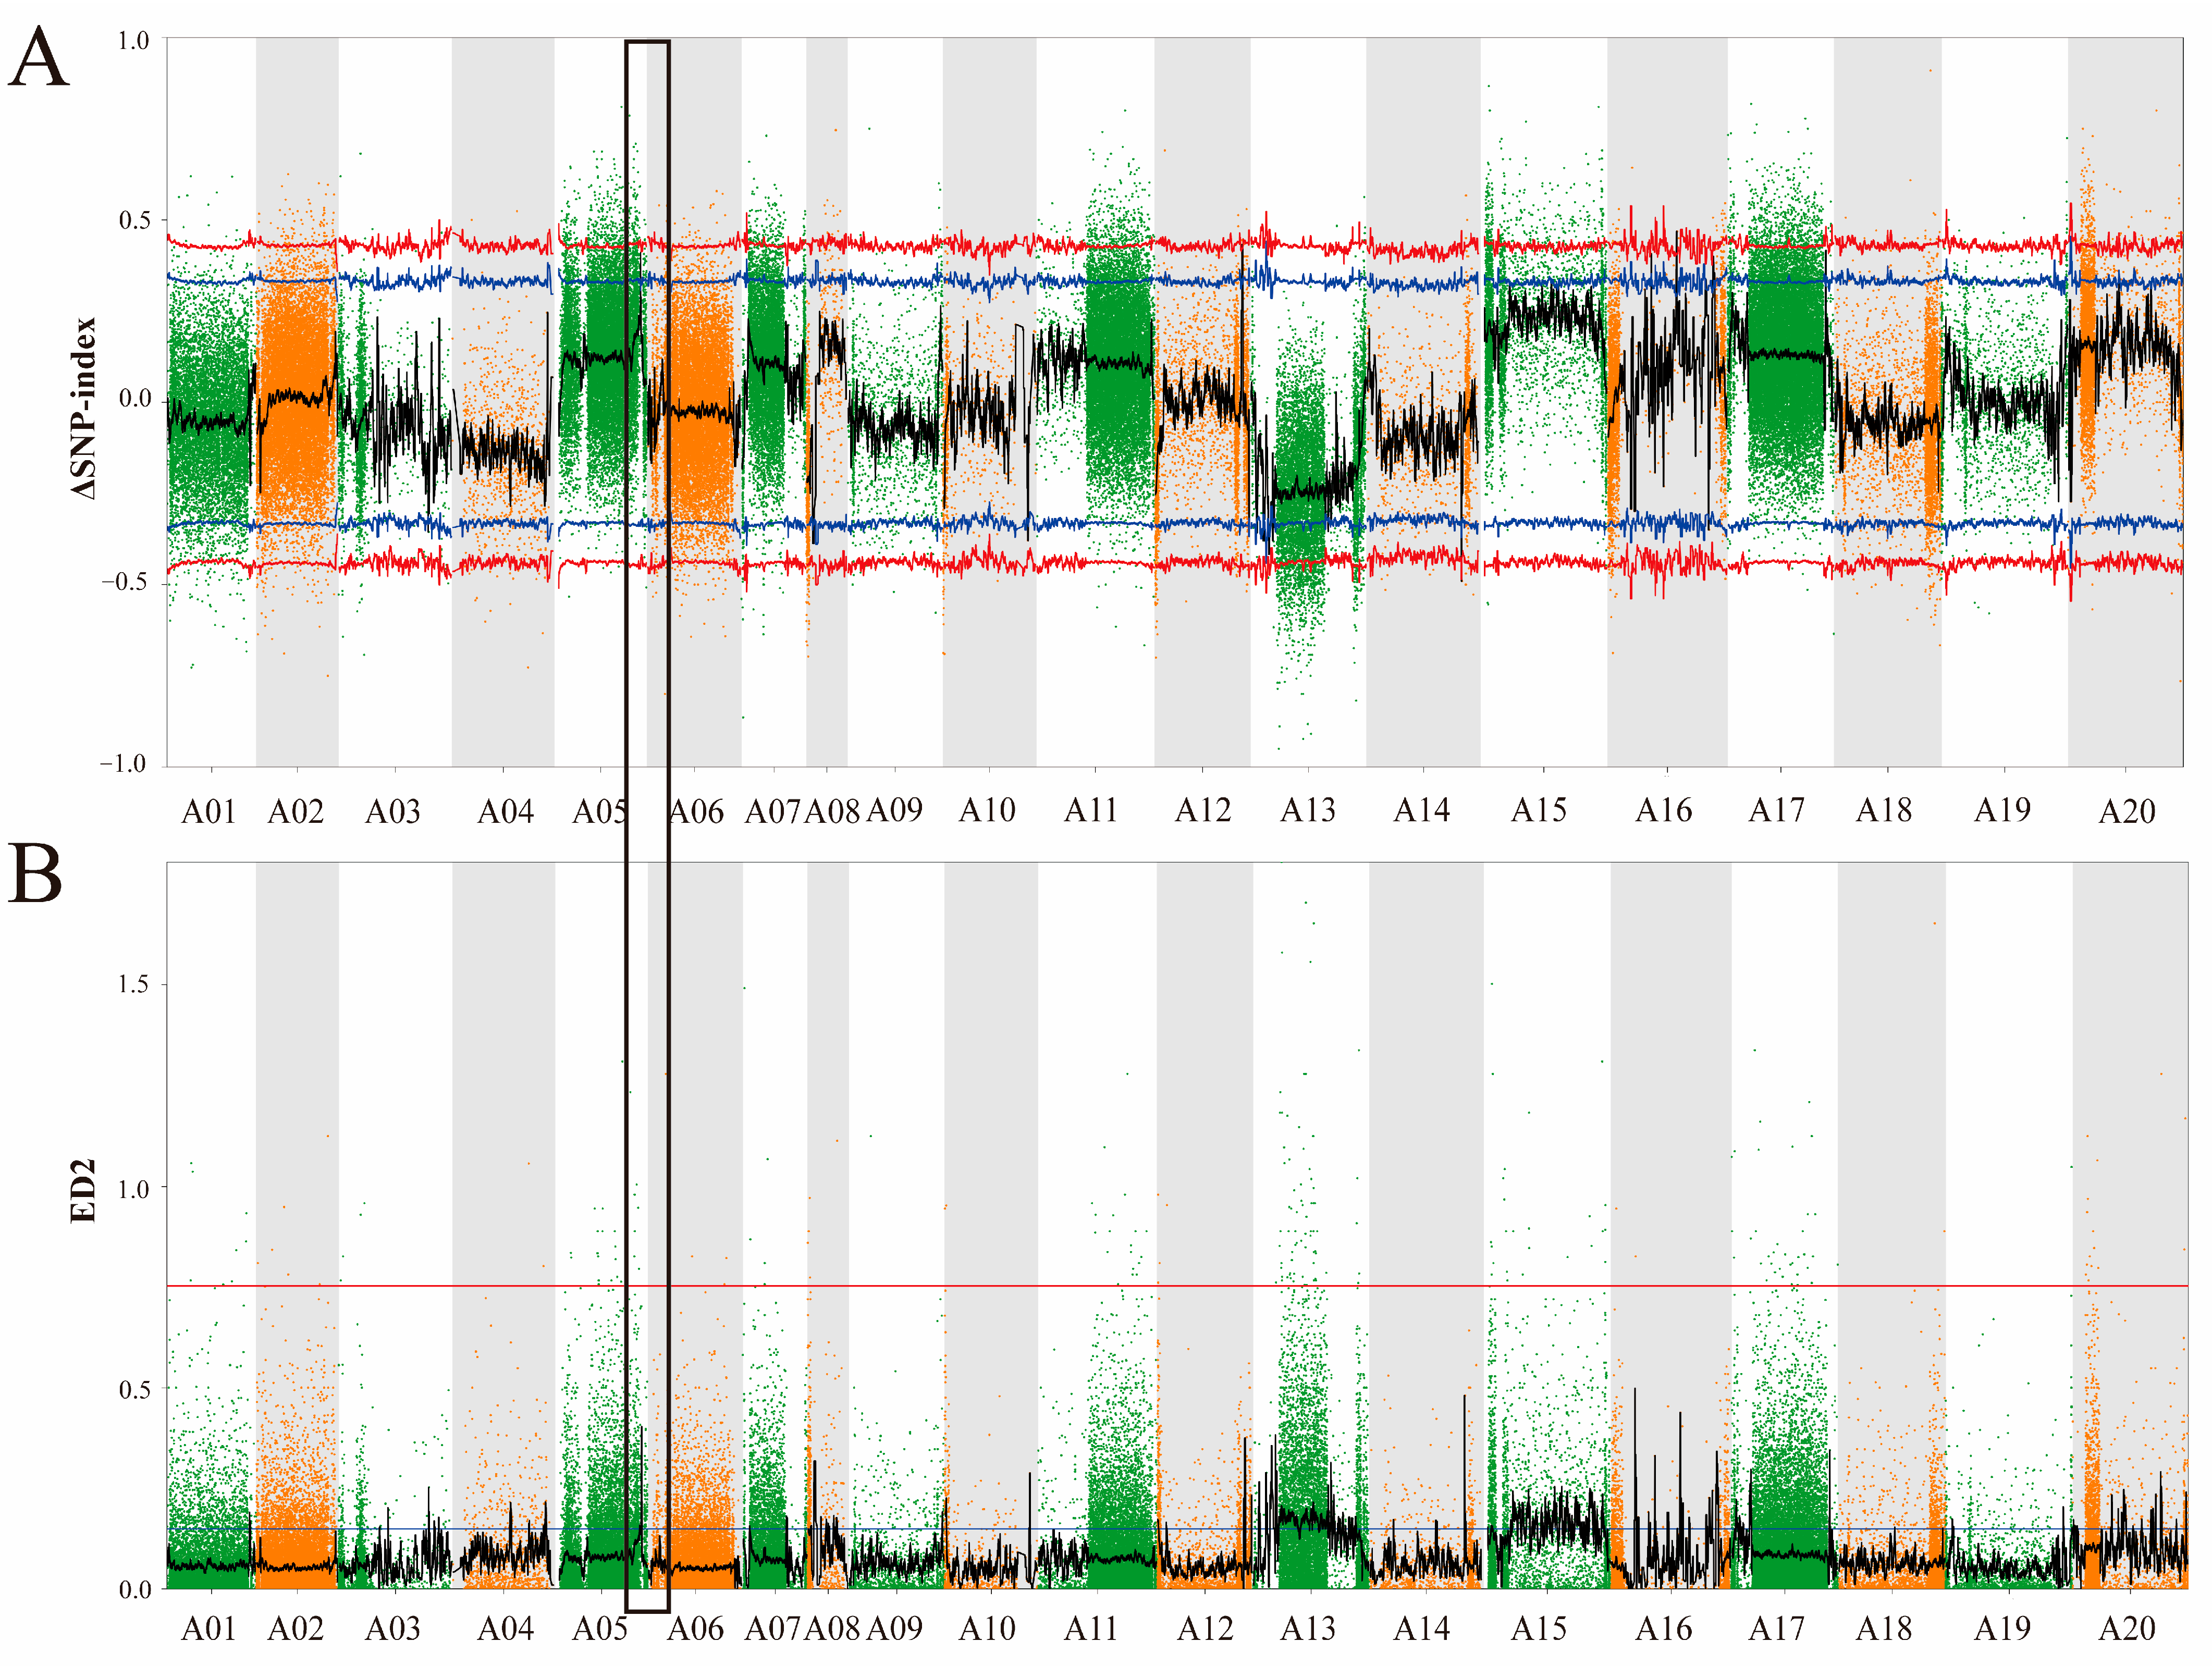
3.3. Identification of Candidate Genomic Regions for LTG Tolerance

To identify the genomic region controlling the LTG tolerance, the correlation algorithm of ΔSNP-index and ED was performed between the two extreme bulks using high-quality allele segregation SNPs (Tables S5 and S6). ΔSNP-index plots with a 95% confidence interval were analyzed using Sliding window (2 Mb interval and 50 kb increment) analysis (Figure 2A), and the median of all locus fitting values was used for ED association analysis with a 99% confidence interval (Figure 2B). As a result, seven putative overlapping regions for LTG tolerance were located on chromosomes 05, 12, 13, 14, 16, and 17, using these two different methods. By virtue of the number of high-quality SNPs and peak value, a final association interval was identified on Chr.05 (107.3~109.6 Mb) with an overall size of 2.29 Mb, containing a total of 122 genes (Table 3).

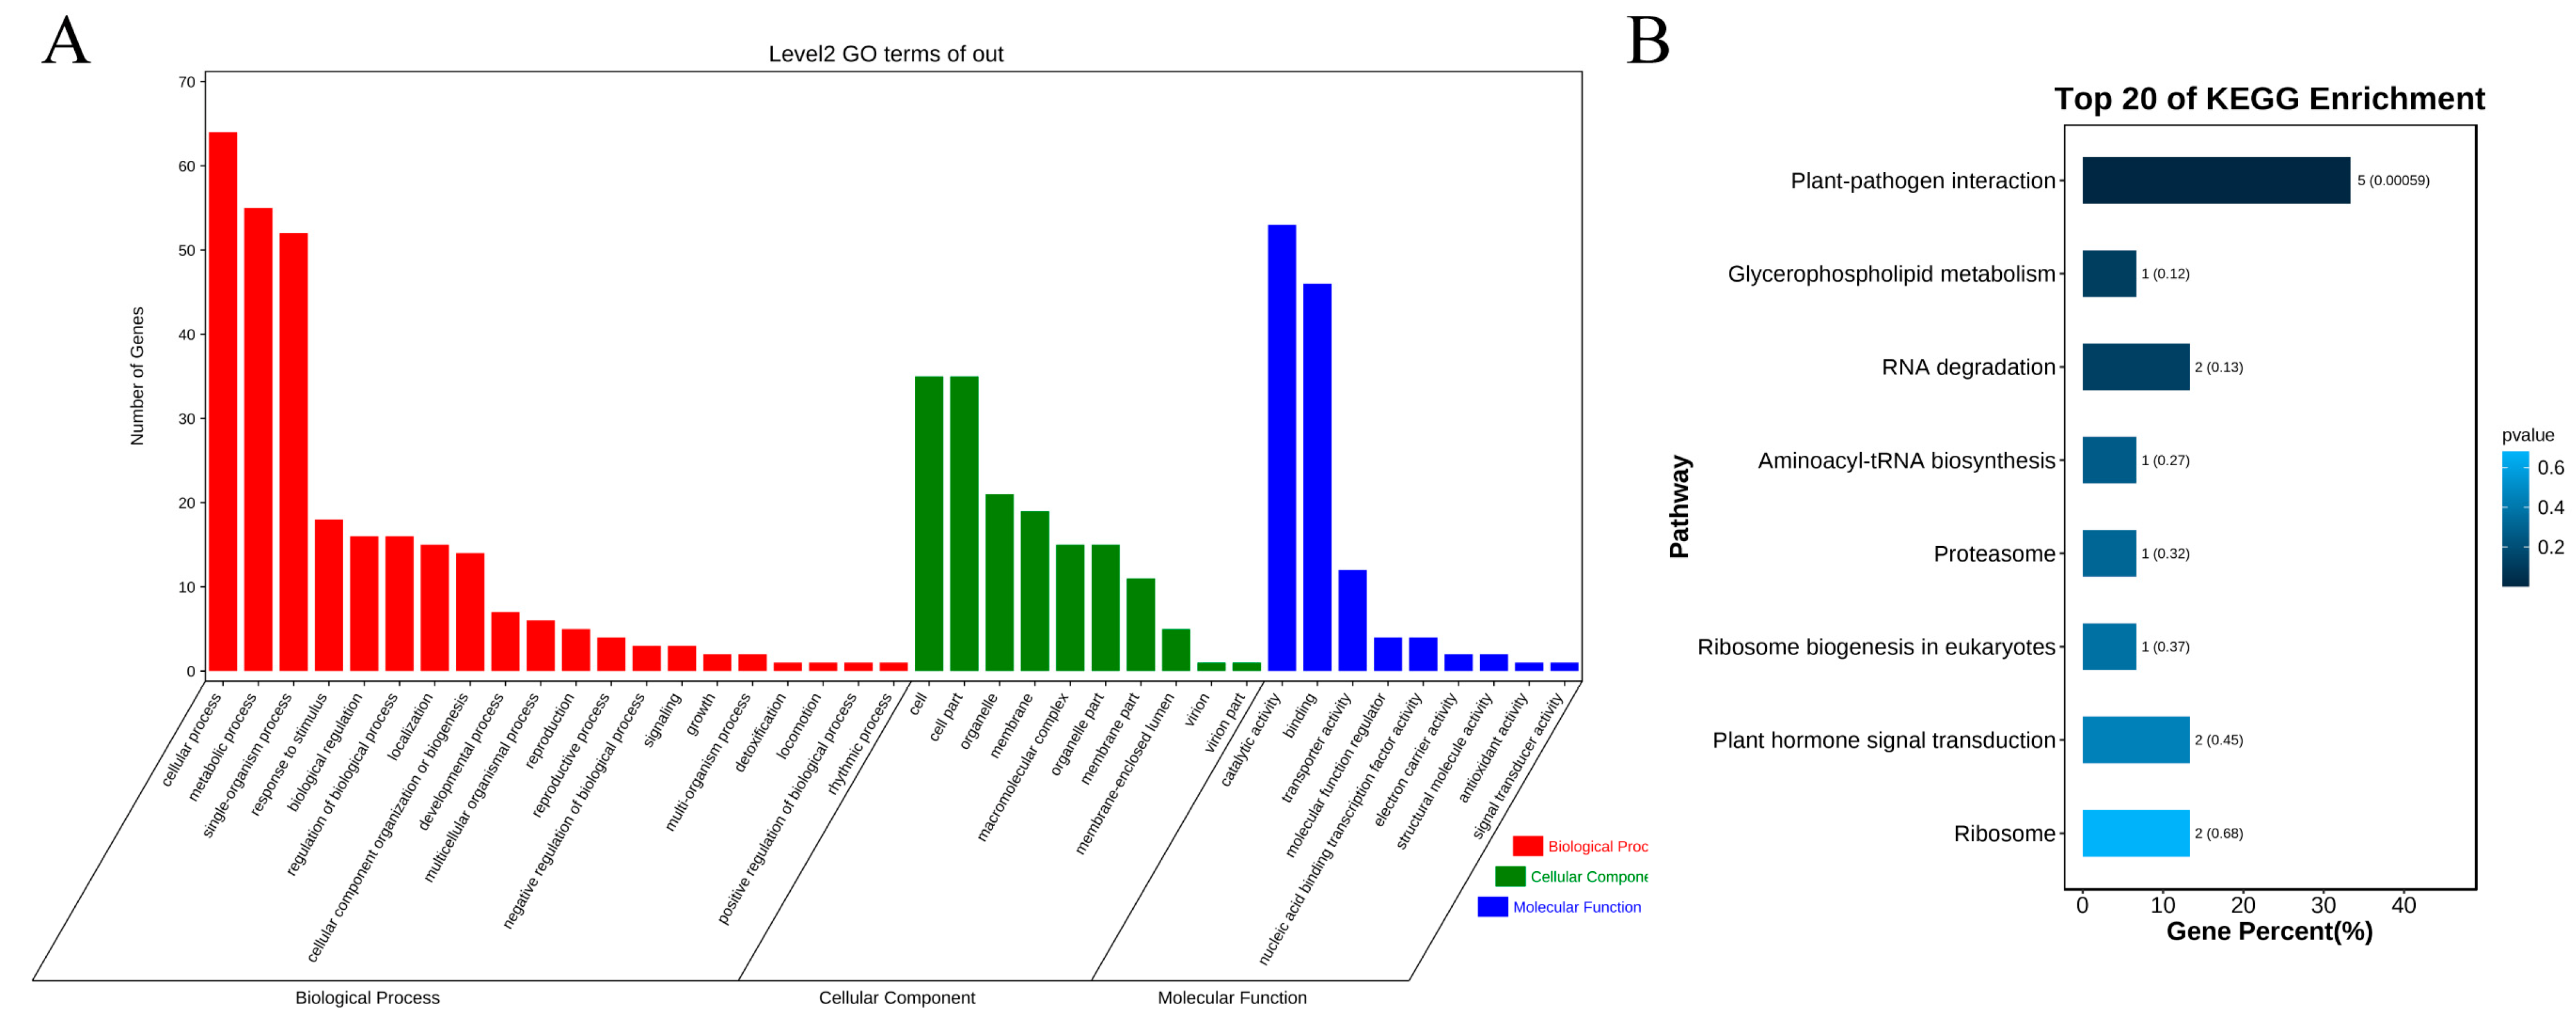
3.4. Functional Enrichment Analysis of Genes in Candidate Region

Using the BLAST (v2.2.23) algorithm, all encoding genes in the candidate genomic interval were aligned with the NR, Swissprot, GO, and KEGG databases. NR and Swissprot databases yielded 120 and 90 annotated genes, respectively (Table S7). GO classification analysis revealed that 87 annotated genes were siloed into 39 known GO terms, including 20 “biological process”, ten “cellular component”, and 9 “molecular function” categories (Table S8 and Figure 3A). Similar to previous findings, the significantly enriched terms in three categories included cellular process, metabolic process, response to stimulus, catalytic activity, antioxidant activity, cell, and membrane [30,51,52]. Furthermore, among the “response stimulus” terms, four genes were identified as trehalose phosphate synthase (Arahy.PWAA2D), DNAJ heat shock N-terminal domain-containing protein (Arahy.10ECP5), ubiquitin-protein ligase cullin 4 (Arahy.LN6NXX), and betaine aldehyde dehydrogenase (Arahy.QCS9HL) all of which have been reportedly associated with plant tolerance to abiotic stresses, including chilling [53,54,55,56].
A total of 15 annotated genes were subjected to KEGG pathway enrichment analysis in order to gain more insight into the metabolic processes involved in cold stress regulation during peanut seed germination (Table S9 and Figure 3B). The significantly enriched pathway “plant-pathogen interaction” has been known as an important pathway involved in chilling response mechanisms of peanut and other crops [12,57,58,59]. Four genes in this pathway, encoding calcium-dependent protein kinase 1 (Arahy.961PRY) and three enhanced disease susceptibility proteins (Arahy.A0TJ2P, Arahy.R5RNX8, Arahy.VGZ3RK), were upregulated by cold stress [60,61]. Nevertheless, it remains to be determined to what extent these genes and pathways may contribute to peanut LTG tolerance.

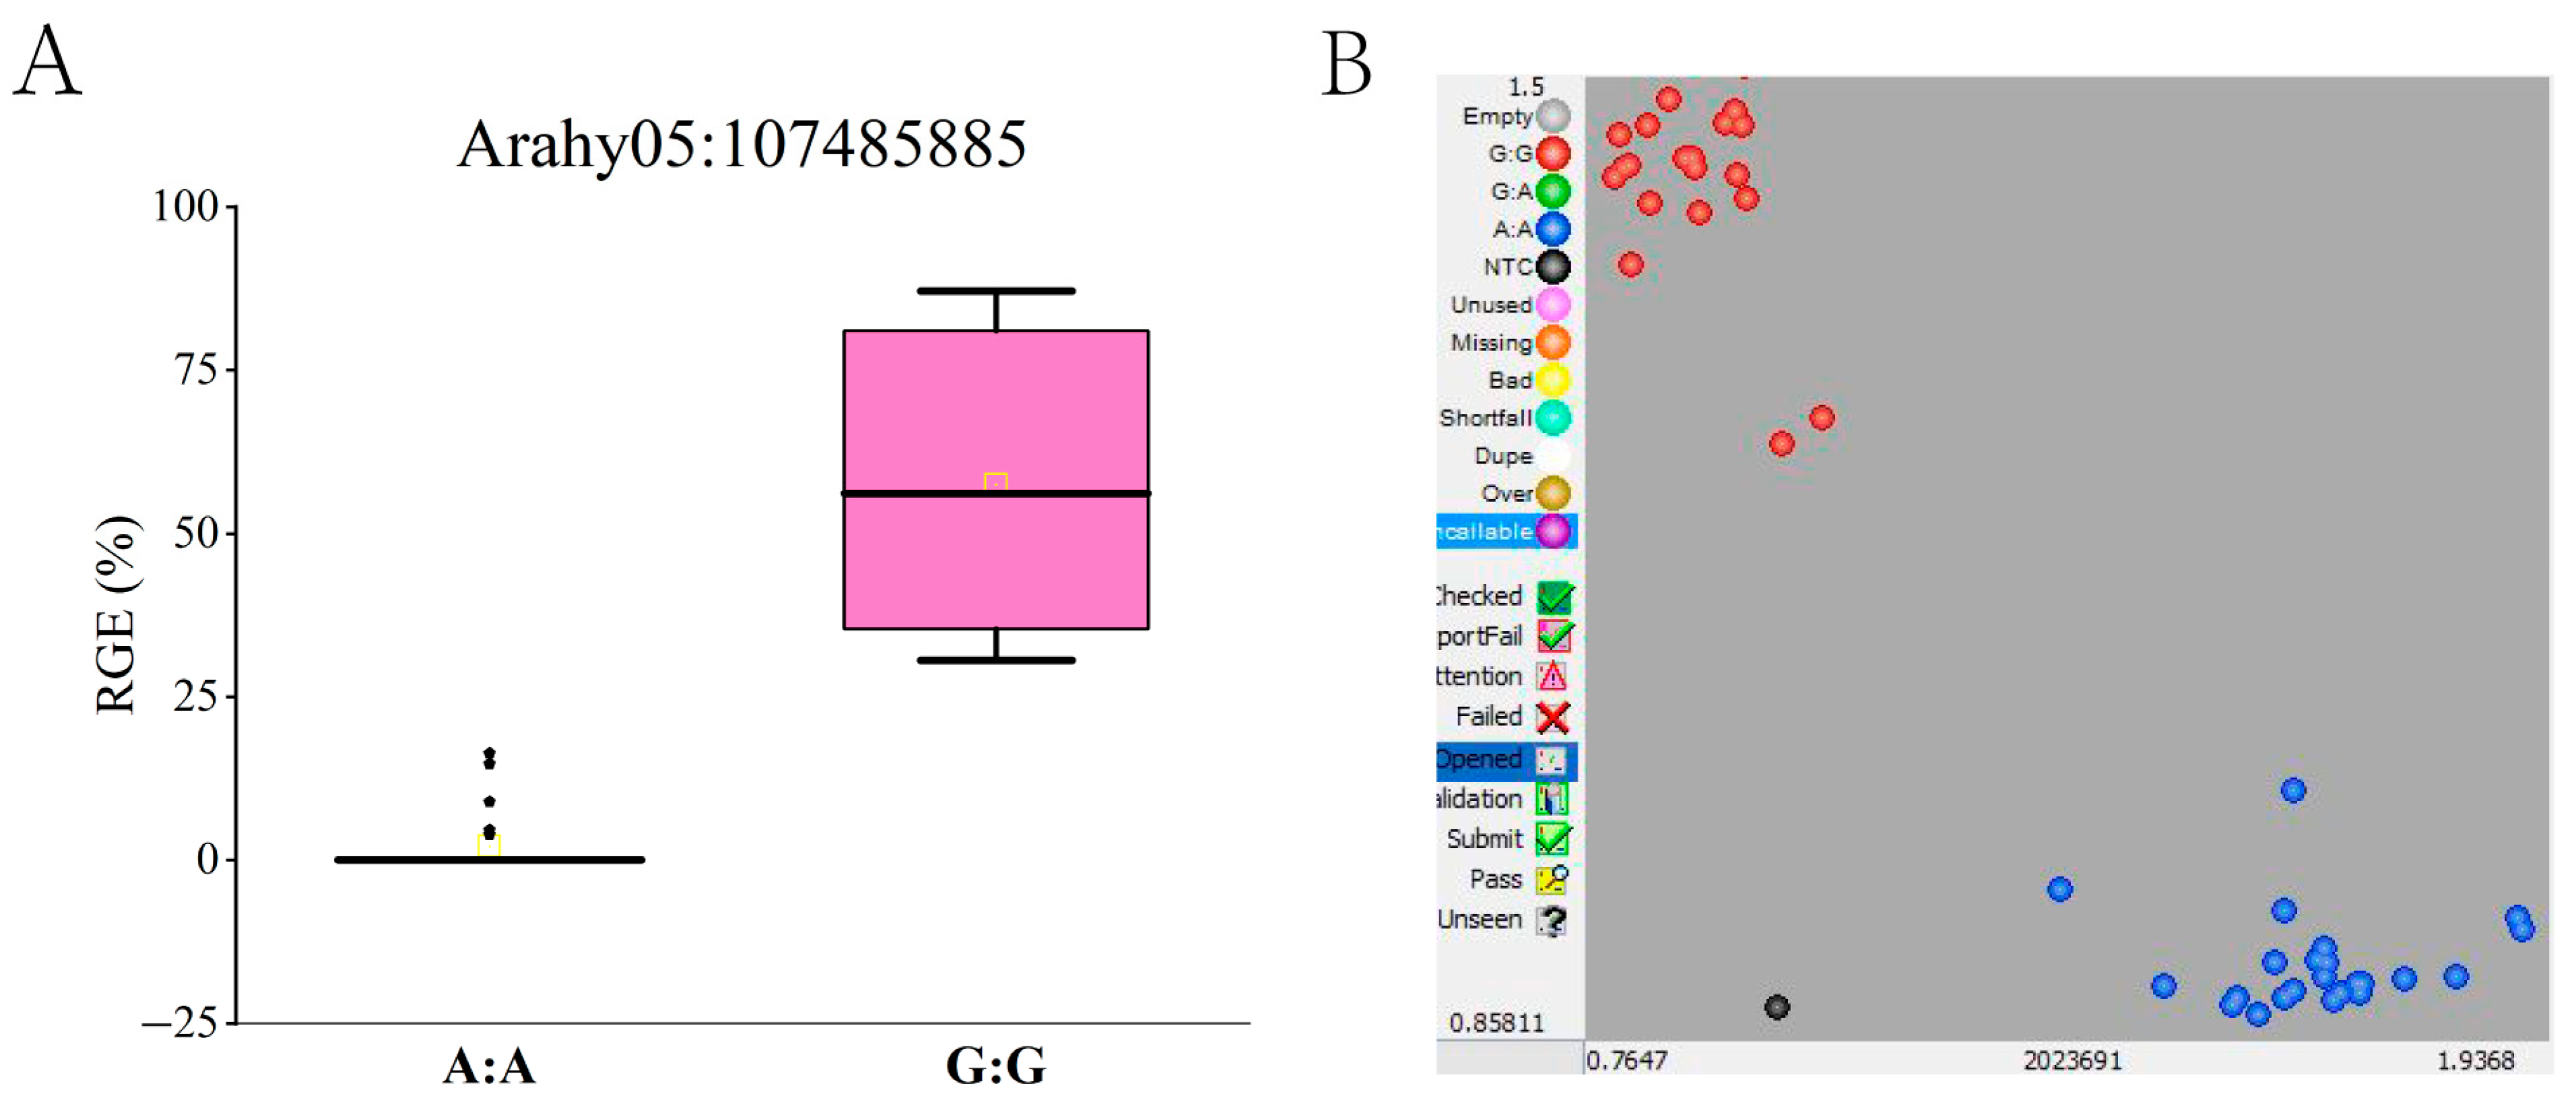
3.5. Validation of SNPs in Candidate Region with Different Germplasm Resources

To validate the putative genomic region for cold tolerance in HOAP, we investigated the polymorphism of high-quality SNPs between two parents in the genomic interval covering Arahy.A05:107340001 and Arahy.A05:109630000 using resequencing data (Table S10). Two SNPs (Arahy.A05:107485885 and Arahy.A05:108044810) with the highest ΔSNP-index and ED value were chosen as candidate SNPs for the development of KASP markers (Table 4). Using the newly developed KASP markers, we genotyped 46 peanut germplasms from the verification group, which included 2 BSA-Seq parents with contrasting LTG tolerances. The genotypes were classified into two types, G:G (YH65 type) and A:A (FL14 type) represented the genotypes at Arahy.A05:107485885, C:C (YH65 type) and T:T (FL14 type) represented the genotypes at Arahy.A05:108044810 (Table 4). The mean RGE for the verification lines carrying G was 57.5%, which was significantly greater than that for those carrying A with a RGE of 2.1% at Arahy.A05:107485885, while most verification lines carrying C and the mean RGE of them were 35.2% at Arahy.A05:108044810, (Table S1). According to the phenotypic and genotypic results of the verification group, Arahy.A05:107485885 was shown to be significantly associated with LTG tolerance and may therefore be used as the diagnostic marker to predict cold tolerance (Figure 4A,B). The candidate SNP site was located in the intergenic region between the genes Arahy.PWAA2D and Arahy.470PAV, which encode trehalose phosphate synthase and receptor-like kinase 1, respectively (Table S7). In addition, the marker-trait association verified the validity of the identified candidate genomic region harboring the governing alleles for LTG tolerance.

4. Discussion

Peanuts with high oleic acid content are preferred by both the seed industry and consumers. One of the most prominent peanut breeding goals worldwide has been to increase the oleic acid content of peanuts in pursuit of greater antioxidant capability and improved nutritional properties [14]. Chilling injury occurrences in the spring sowing season have been frequently observed in northeast China over the past few years [62]; therefore, in-depth research on specific mechanisms regulating LTG tolerance is particularly important for maintaining HOAP productivity and quality for overall popularization at high latitudes. Owing to the fact that germination is the most vulnerable period in plant development, research has been done to identify peanut germplasm with cold tolerance at the germination stage [17,21,63,64,65,66]. However, in comparison to other agronomic traits, chilling tolerance is an excessively complex trait, making its characterization more challenging. Furthermore, most studies on low temperature stress have focused on the seed imbibition period, but the cold tolerance shown between imbibition and germination has greater practical significance. In the present study, peanut seeds were exposed to cold stress after being soaked at 28 °C for 12 h, which better simulates the field conditions when an unexpected and abrupt temperature drop occurs in peanut production during sowing season. In our indoor investigation of the F2 population and the verification group, the cold stress treatment was 2 °C, which was proved to be reliable through consistency with prior studies [57]. This allowed us to apply the more stringent selection pressure needed for screening the extreme phenotype. In addition, there were few studies on HOAP chilling tolerance, and only a small number of germplasms have been examined for cold tolerance. In this study, we developed a large enough population with HOAP parents to accurately identify LTG-tolerant genotypes, hence laying a solid foundation for BSA-Seq.
GAB is a perfect integration of genomics tools and conventional breeding approaches; thus, it would be the ideal option to accelerate genetic gains and the breeding process for developing elite cultivars with desirable attributes [67,68]. GAB can be used to develop peanut cultivars with enhanced tolerance to abiotic stresses more efficiently than conventional breeding alone since it requires less labor and budgetary resources. Notably, effective GAB involves the identification of QTLs that are closely associated with the trait(s) of interest. However, the cultivated peanut’s allotetraploid nature coupled with narrow genetic variation has severely hindered QTL mapping for desirable features. In particular, the current limited number of released HOAP cultivars is the outcome of targeted breeding, which has narrowed their genetic background [69]. With the currently available QTLs, it is technically difficult to perform cold tolerance GAB in HOAP. Consequently, the identification of pertinent QTLs is a prerequisite for GAB deployment in plant breeding [70]. BSA-Seq is an efficient breeding approach for rapid mapping of candidate regions by whole-genome resequencing, as compared to traditional QTL analysis dependent on advanced generation [71]. Because this approach analyzes the genetic segregation of DNA pools with extreme traits, it is both cost-effective as it requires fewer samples for resequencing and time-efficient as peanuts have a low reproduction coefficient. At present, an eclectic array of NGS-based BSA+ strategies (BSA-seq, BSR-seq, MutMup, etc.) have been effectively established in a variety of crops in order to select candidate intervals and improve the efficiency of gene mapping [30,36,72].
In order to locate the major QTLs of LTG tolerance in HOAP, BSA-Seq was performed by leveraging a 503-individual F2 population to screen 30 strictly differential phenotypes for each bulk (HT and HS), prediction intervals were identified by two bioinformatic approaches, ΔSNP-index and ED, to improve reliability, and one overlapping significant peak was identified on chromosome A05 with a span of 2.29 Mb, which has been linked to cold tolerance at the germination stage. Moreover, the number of individual samples in the two pools for comparison was higher in our research than in previous studies [73,74]. Increasing the number of samples for pooling can improve the accuracy of SNP predictions, indicating that the findings of this research are credible. To our knowledge, this study represents the first report on the identification of a genomic region associated with LTG tolerance in HOAP, highlighting the molecular mechanism underlying cold tolerance during seed germination.
Numerous studies have shown that genes and transcription factors (TFs) involved in cold tolerance can be dichotomized into two distinct types: signaling components for stress responses and regulatory pathway participants for defense against cold stress [75]. The aforementioned genes and TFs interact to form intricate networks of systemic metabolism. In our result of gene functional enrichment analysis, it seemed that after sustaining a chilling injury, the HOAP defense system may respond to abiotic stress stimuli by enhancing catalytic and antioxidant activities and remodeling cell and membrane structure, in order to improve cold tolerance. Three putative GST-encoding genes (Arahy.41Y8SN, Arahy.06EJ88, and Arahy.28J7Y2) may be the hub genes controlling peanut seedling cold tolerance [24]. Although equivalent genes were not found in our candidate region, numerous genes have been implicated in cold tolerance in other crop species (Table S7). For instance, (1) Arahy.PWAA2D encodes trehalose phosphate synthase. Trehalose serves as a protector of the osmolyte and membrane system, which is extensively used to improve plant tolerance to multiple abiotic stresses [76]. It has been demonstrated that exogenous trehalose bolsters cold tolerance in rapeseed seedlings via modulating antioxidant and osmotic homeostasis [53]. (2) Arahy.470PAV encodes receptor-like kinase 1, which has been validated by RT-PCR as a differentially abundant membrane protein triggered by cold in the early phase of plant development in Dajiao [77]. (3) Arahy.QW591P encodes a cytochrome P450 protein that imparts cold tolerance in rice via a MYBS3-dependent pathway [78]. Interestingly, these three cold-related genes were found adjacent to each other on chromosome A05, spanning nucleotides 107,455,962 and 107,507,715. Therefore, a KASP marker was developed from an SNP site in this interval and successfully genotyped for a universal verification group comprised of vastly distinct peanut germplasms with LTG tolerance. Given the quantitative nature of cold tolerance, it is not possible to attribute a discrete cold-tolerant phenotype to a single SNP, which warrants further exploration for additional molecular markers.

5. Conclusions

Chilling injury during spring sowing has become the most significant barrier to widespread adoption of HOAP in northeast China. Through BSA-Seq, we were able to identify a large candidate genomic region for LTG tolerance in HOAP, and one SNP (Arahy.05:107485885) site within this region was chosen to develop the KASP marker, which was validated through genotyping in the verification group. These findings hold promise for further research towards genetically improving LTG tolerance via GAB in HOAP.

Supplementary Materials

The following supporting information can be downloaded at: https://www.mdpi.com/article/10.3390/agronomy13010018/s1, Figure S1: Overview of the BSA-Seq data; Table S1: The details of verification group used in validation of KASP markers for LTG tolerance; Table S2: Germination evaluation of parents and F2 population with cold treatment; Table S3: Statistics of SNP annotation information in four libraries based on resequencing data; Table S4: Statistics of InDel annotation information in four libraries based on resequencing data; Table S5: Candidate regions identified for LTG tolerance by ΔSNP-index; Table S6: Candidate regions identified for LTG tolerance by ED; Table S7: Gene annotation of the candidate region for LTG tolerance; Table S8: GO enrichment analysis of genes in the candidate region for LTG tolerance; Table S9: KEGG pathway analysis of genes in the candidate region for LTG tolerance; Table S10: Statistics of high-quality SNPs variation in candidate region.

Author Contributions

Conceptualization, X.Z. and G.Y.; investigation, L.R., S.Y. and Y.W.; formal analysis, F.Q. and S.H.; resources, H.W. and B.H.; validation, Z.S. and P.S.; writing—original draft, H.S.; writing—review and editing, H.S. and X.Z. All authors contributed to the article and approved the submitted version. All authors have read and agreed to the published version of the manuscript.

Funding

This research was funded by China Agriculture Research System of MOF and MARA (CARS-13), Liaoning BaiQianWan Talents Program (2021921070); Henan Provincial Agriculture Research System, China (S2012-5); Major Science and Technology Projects of Henan Province (161100111000); and President’s Youth Foundation of Liaoning Academy of Agricultural Sciences (2021QN2009).

Institutional Review Board Statement

Not applicable.

Informed Consent Statement

Not applicable.

Data Availability Statement

In this section, all raw data can be accessed through the following link: https://dataview.ncbi.nlm.nih.gov/object/PRJNA911913?archive=sra (accessed on 15 November 2022).

Conflicts of Interest

The authors declare no conflict of interest.

References

  1. Varshney, R.; Mohan, S.; Gaur, P.; Gangarao, N.; Pandey, M.; Bohra, A.; Sawargaonkar, S.; Chitikineni, A.; Kimurto, P.; Janila, P.; et al. Achievements and prospects of genomics-assisted breeding in three legume crops of the semi-arid tropics. Biotechnol. Adv. 2013, 31, 1120–1134. [Google Scholar] [CrossRef] [Green Version]
  2. Huang, B.; Qi, F.; Sun, Z.; Miao, L.; Zhang, Z.; Liu, H.; Fang, Y.; Dong, W.; Tang, F.; Zheng, Z.; et al. Marker-assisted backcrossing to improve seed oleic acid content in four elite and popular peanut (Arachis hypogaea L.) cultivars with high oil content. Breed Sci. 2019, 69, 234–243. [Google Scholar] [CrossRef] [Green Version]
  3. Barkley, N.; Isleib, T.; Wang, M.; Pittman, R. Genotypic effect of ahFAD2 on fatty acid profiles in six segregating peanut (Arachis hypogaea L.) populations. BMC Genet. 2013, 14, 62. [Google Scholar] [CrossRef] [PubMed] [Green Version]
  4. Wang, C.; Yu, S.; Zhu, L. High Oleic Acid Peanuts in China, 1st ed.; Shanghai Scientific and Technical Publishers: Shanghai, China, 2021; pp. 19–27. [Google Scholar]
  5. Liu, H.; Li, H.; Gu, J.; Deng, L.; Ren, L.; Hong, Y.; Lu, Q.; Chen, X.; Liang, X. Identification of the candidate proteins related to oleic acid accumulation during peanut (Arachis hypogaea L.) seed development through comparative proteome analysis. Int. J. Mol. Sci. 2018, 19, 1235. [Google Scholar] [CrossRef] [PubMed] [Green Version]
  6. Norden, A.; Corbet, D.; Knauft, D.; Young, C. Variability in oil quality among peanut genotypes in the Florida breeding program. Peanut Sci. 1987, 14, 7–11. [Google Scholar] [CrossRef]
  7. Gorbet, D.; Knauft, D. Registration of ‘SunOleic 95R’ peanut. Crop Sci. 1997, 37, 1392. [Google Scholar] [CrossRef]
  8. Chu, Y.; Ramos, L.; Holbrook, C. Ozias-Akins P: Frequency of a loss-of-function mutation in oleoyl-PC desaturase (ahFAD2A) in the mini-core of the US peanut germplasm collection. Crop Sci. 2007, 47, 2372–2378. [Google Scholar] [CrossRef] [Green Version]
  9. Huang, B.; Qi, F.; Sun, Z.; Miao, L.; Fang, Y.; Zheng, Z.; Shi, L.; Zhang, Z.; Liu, H.; Dong, W.; et al. Improvement of oleic acid content in peanut (Arachis hypogaea L.) by marker assisted successive backcross and agronomic evaluation of derived lines [EB/OL]. Acta Agron. Sin. 2019, 45, 546–555. [Google Scholar] [CrossRef]
  10. Wang, X.; Tang, Y.; Wu, Q.; Sun, X.; Wang, Y.; Hu, D.; Wang, C. Characterization of high-oleic peanut natural mutants derived from an intersectional cross. Grasas Aceites 2015, 66, e091. [Google Scholar] [CrossRef] [Green Version]
  11. Zhang, H.; Dong, J.; Zhao, X.; Zhang, Y.; Ren, J.; Xing, L.; Jiang, C.; Wang, X.; Wang, J.; Zhao, S.; et al. Research progress in membrane lipid metabolism and molecular mechanism in peanut cold tolerance. Front. Plant Sci. 2019, 10, 838. [Google Scholar] [CrossRef]
  12. Jiang, C.; Zhang, H.; Ren, J.; Dong, J.; Zhao, X.; Wang, X.; Wang, J.; Zhong, C.; Zhao, S.; Liu, X.; et al. Comparative Transcriptome-Based Mining and Expression Profiling of Transcription Factors Related to Cold Tolerance in Peanut. Int. J. Mol. Sci. 2020, 21, 1921. [Google Scholar] [CrossRef] [Green Version]
  13. Zhang, Y.; Zhao, Y.; Sun, Q.; Chen, S. Negative effects of heat stress on maize yield were compensated by increasing thermal time and declining cold stress in northeast China. Int. J. Biometeorol. 2022, 66, 2395–2403. [Google Scholar] [CrossRef]
  14. Bera, S.; Kamdar, J.; Kasundra, S.; Patel, S.; Jasani, M.; Maurya, A.; Dash, P.; Chandrashekar, A.; Rani, K.; Manivannan, N.; et al. Steady expression of high oleic acid in peanut bred by marker-assisted backcrossing for fatty acid desaturase mutant alleles and its effect on seed germination along with other seedling traits. PLoS ONE 2019, 14, 12. [Google Scholar] [CrossRef] [Green Version]
  15. Jungman, B.; Schubert, A. The effect of fatty acid profiles on peanut seed germination at low soil temperatures. Proc. Am. Peanut Res. Educ. Soc. 2000, 32, 36. [Google Scholar]
  16. Sun, H.; Yu, S.; Ren, L.; Zhang, J.; Yu, B. Field Identification of Cold Tolerance of High Oleic Acid Peanut at Germination Stage and Verification of Physiological Indices. In Proceedings of the Fourth International Conference on Biological Information and Biomedical Engineering, Chengdu, China, 21–23 July 2020. [Google Scholar]
  17. Sun, D.; Bian, N.; Wang, X.; Xing, X.; Shen, Y.; Xu, Z.; Qi, Y.; Wang, X. Comprehensive evaluation of cold tolerance and germplasm screening of high oleic acid peanut at germination stage. Acta Agric. Nucl. Sin. 2021, 35, 1263–1272. [Google Scholar]
  18. Wang, X.; Zou, B.; Shao, Q.; Cui, Y.; Lu, S.; Zhang, Y.; Huang, Q.; Huang, J.; Hua, J. Natural variation reveals that OsSAP16 controls low-temperature germination in rice. J. Exp. Bot. 2018, 69, 413–421. [Google Scholar] [CrossRef]
  19. Ding, Y.L.; Shi, Y.; Yang, S. Molecular regulation of plant responses to environmental temperatures. Mol. Plant 2020, 13, 544–564. [Google Scholar] [CrossRef]
  20. Zhang, M.; Zhang, S. Mitogen-activated protein kinase cascades in plant signaling. J. Integr. Plant Biol. 2022, 64, 301–341. [Google Scholar] [CrossRef]
  21. Ntare, B.; Williams, J.; Dougbedji, F. Evaluation of groundnut genotypes for tolerance under fifield conditions in a sahelian environment using a simple physiological model for yield. J. Agric. Sci. 2001, 136, 81–88. [Google Scholar] [CrossRef] [Green Version]
  22. Wang, X.; Liu, Y.; Han, Z.; Chen, Y.; Huai, D.; Kang, Y.; Wang, Z.; Yan, L.; Jiang, H.; Lei, Y.; et al. Integrated transcriptomics and metabolomics analysis reveal Key metabolism pathways contributing to cold tolerance in peanut. Front. Plant Sci. 2021, 12, 752474. [Google Scholar] [CrossRef]
  23. Zhang, X.; Ren, C.; Xue, Y.; Tian, Y.; Zhang, H.; Li, N.; Sheng, C.; Jiang, H.; Bai, D. Small RNA and Degradome deep sequencing reveals the roles of microRNAs in peanut (Arachis hypogaea L.) cold response. Front. Plant Sci. 2022, 13, 920195. [Google Scholar] [CrossRef] [PubMed]
  24. Zhang, H.; Jiang, C.; Lei, J.; Dong, J.; Ren, J.; Shi, X.; Zhong, C.; Wang, X.; Zhao, X.; Yu, H. Comparative physiological and transcriptomic analyses reveal key regulatory networks and potential hub genes controlling peanut chilling tolerance. Genomics 2022, 114, 110285. [Google Scholar] [CrossRef]
  25. Raza, A.; Sharif, Y.; Chen, K.; Wang, L.; Fu, H.; Zhuang, Y.; Chitikineni, A.; Chen, H.; Zhang, C.; Varshney, R.; et al. Genome-wide characterization of ascorbate peroxidase gene family in peanut (Arachis hypogea L.) revealed their crucial role in growth and multiple stress tolerance. Front. Plant Sci. 2022, 13, 962182. [Google Scholar] [CrossRef] [PubMed]
  26. Giovannoni, J.; Wing, R.; Ganal, M.; Tanksley, S. Isolation of molecular markers from specific chromosome intervals using DNA pools from existing mapping populations. Nucleic Acids Res. 1991, 19, 6553–6558. [Google Scholar] [CrossRef] [Green Version]
  27. Michelmore, R.; Paran, I.; Kesseli, R. Identification of markers linked to disease resistance genes by bulked segregant analysis: A rapid method to detect markers in specific genomic regions by using segregating populations. Proc. Natl Acad. Sci. USA 1991, 88, 9828–9832. [Google Scholar] [CrossRef] [PubMed] [Green Version]
  28. Varshney, R.; Terauchi, R.; McCouch, S. Harvesting the promising fruits of genomics: Applying genome sequencing technologies to crop breeding. PLoS Biol. 2014, 12, e1001883. [Google Scholar] [CrossRef] [Green Version]
  29. Li, Z.; Xu, Y. Bulk segregation analysis in the NGS era: A review of its teenage years. Plant J. 2022, 109, 1355–1374. [Google Scholar] [CrossRef]
  30. Guo, Z.; Cai, L.; Chen, Z.; Wang, R.; Zhang, L.; Guan, S.; Zhang, S.; Ma, W.; Liu, C.; Pan, G. Identification of candidate genes controlling chilling tolerance of rice in the cold region at the booting stage by BSA-Seq and RNA-Seq. R. Soc. Open Sci. 2020, 7, 201081. [Google Scholar] [CrossRef]
  31. Zhang, K.; Wang, X.; Zhu, W.; Qin, X.; Xu, J.; Cheng, C.; Lou, Q.; Li, J.; Chen, J. Complete resistance to powdery mildew and partial resistance to downy mildew in a Cucumis hystrix introgression line of cucumber were controlled by a co-localized locus. Theor. Appl. Genet. 2018, 131, 2229–2243. [Google Scholar] [CrossRef]
  32. Zhong, C.; Sun, S.L.; Li, Y.P.; Duan, C.X.; Zhu, Z. Next-generation sequencing to identify candidate genes and develop diagnostic markers for a novel phytophthora resistance gene, RpsHC18, in soybean. Theor. Appl. Genet. 2018, 131, 525–538. [Google Scholar] [CrossRef]
  33. Luo, H.; Pandey, M.; Khan, A.; Guo, J.; Wu, B.; Cai, Y.; Huang, L.; Zhou, X.; Chen, Y.; Chen, W.; et al. Discovery of genomic regions and candidate genes controlling shelling percentage using QTL-seq approach in cultivated peanut (Arachis hypogaea L.). Plant Biotechnol. J. 2019, 7, 1248–1260. [Google Scholar] [CrossRef] [Green Version]
  34. Bertioli, D.; Jenkins, J.; Clevenger, J.; Dudchenko, O.; Gao, D.; Seijo, G.; Bertioli, S.; Ren, L.; Farmer, A.; Pandey, M.; et al. The genome sequence of segmental allotetraploid peanut Arachis hypogaea. Nat. Genet. 2019, 51, 877–884. [Google Scholar] [CrossRef]
  35. Zhuang, W.; Chen, H.; Yang, M.; Wang, J.; Pandey, M.; Zhang, C.; Chang, W.; Zhang, L.; Zhang, X.; Tang, R.; et al. The genome of cultivated peanut provides insight into legume karyotypes, polyploid evolution and crop domestication. Nat. Genet. 2019, 51, 865–876. [Google Scholar] [CrossRef] [Green Version]
  36. Luo, H.; Pandey, M.; Zhi, Y.; Zhang, H.; Xu, S.; Guo, J.; Wu, B.; Chen, H.; Ren, X.; Zhou, X.; et al. Discovery of two novel and adjacent QTLs on chromosome B02 controlling resistance against bacterial wilt in peanut variety Zhonghua 6. Theor. Appl. Genet. 2020, 133, 1133–1148. [Google Scholar] [CrossRef] [Green Version]
  37. Zhao, Y.; Ma, J.; Li, M.; Deng, L.; Li, G.; Xia, H.; Zhao, S.; Hou, L.; Li, P.; Ma, C.; et al. Whole-genome resequencing-based QTL-seq identifified AhTc1 gene encoding a R2R3-MYB transcription factor controlling peanut purple testa colour. Plant Biotechnol. J. 2020, 18, 96–105. [Google Scholar] [CrossRef] [Green Version]
  38. Peng, Z.; Chen, H.; Tan, L.; Shu, H.; Varshney, R.; Zhou, Z.; Zhao, Z.; Luo, Z.; Chitikineni, A.; Wang, L.; et al. Natural polymorphisms in a pair of NSP2 homoeologs can cause loss of nodulation in peanut. J. Exp. Bot. 2021, 72, 1104–1118. [Google Scholar] [CrossRef]
  39. Zheng, Z.; Sun, Z.; Fang, Y.; Qi, F.; Liu, H.; Miao, L.; Du, P.; Shi, L.; Gao, W.; Han, S.; et al. Genetic Diversity, Population Structure, and Botanical Variety of 320 Global Peanut Accessions Revealed Through Tunable Genotyping-by-Sequencing. Sci. Rep. 2018, 8, 14500. [Google Scholar] [CrossRef] [Green Version]
  40. Yang, L.; Lei, L.; Li, P.; Wang, J.; Wang, C.; Yang, F.; Chen, J.; Liu, H.; Zheng, H.; Xin, W.; et al. Identification of Candidate Genes Conferring Cold Tolerance to Rice (Oryza sativa L.) at the Bud-Bursting Stage Using Bulk Segregant Analysis Sequencing and Linkage Mapping. Front. Plant Sci. 2021, 12, 647239. [Google Scholar] [CrossRef] [PubMed]
  41. Doyle, J. Isolation of plant DNA from fresh tissue. Focus 1900, 12, 13–15. [Google Scholar]
  42. Chen, S.; Zhou, Y.; Chen, Y.; Gu, J. fastp: An ultra-fast all-in-one FASTQ preprocessor. Bioinformatics 2018, 34, i884–i890. [Google Scholar] [CrossRef]
  43. Li, H.; Durbin, R. Fast and accurate short read alignment with Burrows-Wheeler transform. Bioinformatics 2009, 25, 1754–1760. [Google Scholar] [CrossRef] [Green Version]
  44. McKenna, A.; Hanna, M.; Banks, E.; Sivachenko, A.; Cibulskis, K.; Kernytsky, A.; Garimella, K.; Altshuler, D.; Gabriel, S.; Daly, M. The Genome Analysis Toolkit: A MapReduce framework for analyzing next-generation DNA sequencing data. Genome Res. 2010, 20, 1297–1303. [Google Scholar] [CrossRef] [PubMed] [Green Version]
  45. Wang, X.; Li, W.; Zhao, D.; Liu, B.; Shi, Y.; Chen, B.; Yang, H.; Guo, P.; Geng, X.; Shang, Z.; et al. Caenorhabditis elegans transthyretin-like protein TTR-52 mediates recognition of apoptotic cells by the CED-1 phagocyte receptor. Nat. Cell Biol. 2010, 12, 655–664. [Google Scholar] [CrossRef]
  46. Takagi, H.; Abe, A.; Yoshida, K.; Kosugi, S.; Natsume, S.; Mitsuoka, C.; Uemura, A.; Utsushi, H.; Tamiru, M.; Takuno, S.; et al. QTL-seq: Rapid mapping of quantitative trait loci in rice by whole genome resequencing of DNA from two bulked populations. Plant J. 2013, 74, 174–183. [Google Scholar] [CrossRef] [PubMed]
  47. Hill, J.; Demarest, B.; Bisgrove, B.; Gorsi, B.; Su, Y.; Yost, H. MMAPPR: Mutation mapping analysis pipeline for pooled RNA-seq. Genome Res. 2013, 23, 687–697. [Google Scholar] [CrossRef] [Green Version]
  48. Altschul, S.; Madden, T.; Schäffer, A.; Zhang, J.; Zhang, Z.; Miller, W.; Lipman, D. Gapped BLAST and PSI-BLAST: A New Generation of Protein Database Search Programs; Oxford University Press: Oxford, UK, 1997; Volume 25. [Google Scholar]
  49. Rasheed, A.; He, Z.; Gao, F.; Zhai, S.; Jin, H.; Liu, J.; Guo, Q.; Zhang, Y.; Dreisigacker, S.; Xia, X.; et al. Development and validation of KASP assays for genes underpinning key economic traits in bread wheat. Theor. Appl. Genet. 2016, 129, 1843–1860. [Google Scholar] [CrossRef]
  50. Semagn, K.; Babu, R.; Hearne, S. Single nucleotide polymorphism genotyping using Kompetitive Allele Specific PCR (KASP): Overview of the technology and its application in crop improvement. Mol. Breed. 2014, 33, 1–14. [Google Scholar] [CrossRef]
  51. Pan, Y.; Liang, H.; Gao, L.; Dai, G.; Chen, W.; Yang, X.; Qing, D.; Gao, J.; Wu, H.; Huang, J.; et al. Transcriptomic profiling of germinating seeds under cold stress and characterization of the cold-tolerant gene LTG5 in rice. BMC Plant Biol. 2020, 20, 371. [Google Scholar] [CrossRef]
  52. Gao, C.; Mumtaz, M.; Zhou, Y.; Yang, Z.; Shu, H.; Zhu, J.; Bao, W.; Cheng, S.; Yin, L.; Huang, J.; et al. Integrated transcriptomic and metabolomic analyses of cold-tolerant and cold-sensitive pepper species reveal key genes and essential metabolic pathways involved in response to cold stress. Int. J. Mol. Sci. 2022, 23, 6683. [Google Scholar] [CrossRef]
  53. Raza, A.; Su, W.; Jia, Z.; Luo, D.; Zhang, Y.; Gao, A.; Hussain, M.; Mehmood, S.; Cheng, Y.; Lv, Y.; et al. Mechanistic insights into trehalose-mediated cold stress tolerance in rapeseed (Brassica napus L.) seedlings. Front. Plant Sci. 2022, 13, 857980. [Google Scholar] [CrossRef]
  54. Yousefi, S.; Marchese, A.; Salami, S.; Benny, J.; Giovino, A.; Perrone, A.; Caruso, T.; Gholami, M.; Sarikhani, H.; Buti, M.; et al. Identifying conserved genes involved in crop tolerance to cold stress. Funct. Plant Biol. 2022, 49, 861–873. [Google Scholar] [CrossRef] [PubMed]
  55. Kim, S.; Woo, O.; Jang, H.; Lee, J. Characterization and comparative expression analysis of CUL1 genes in rice. Genes Genom. 2018, 40, 233–241. [Google Scholar] [CrossRef]
  56. Pan, W.; Tao, J.; Cheng, T.; Shen, M.; Ma, J.; Zhang, W.; Lin, Q.; Ma, B.; Chen, S.; Zhang, J. Soybean NIMA-related kinase1 promotes plant growth and improves salt and cold tolerance. Plant Cell Physiol. 2017, 58, 1268–1278. [Google Scholar] [CrossRef]
  57. Zhang, G.; Yu, S.; Wang, H.; Wang, X. Transcriptome profiling of high oleic peanut under low temperatureduring germination. Yi Chuan 2019, 41, 1050–1059. [Google Scholar]
  58. He, X.; Ni, X.; Xie, P.; Liu, W.; Yao, M.; Kang, Y.; Qin, L.; Hua, W. Comparative transcriptome analyses revealed conserved and novel responses to cold and freezing stress in Brassica napus L. G3 Genes Genomes Genet. 2019, 9, 2723–2737. [Google Scholar] [CrossRef]
  59. Feng, Q.; Yang, S.; Wang, Y.; Lu, L.; Sun, M.; He, C.; Wang, J.; Li, Y.; Yu, X.; Li, Q.; et al. Physiological and molecular mechanisms of ABA and CaCl2 regulating chilling tolerance of cucumber seedlings. Plants 2021, 10, 2746. [Google Scholar] [CrossRef]
  60. Dubrovina, A.; Kiselev, K.; Khristenko, V.; Aleynova, O. VaCPK20, a calcium-dependent protein kinase gene of wild grapevine vitis amurensis Rupr.; mediates cold and drought stress tolerance. J. Plant Physiol. 2015, 185, 1–12. [Google Scholar] [CrossRef]
  61. Chen, Q.; Xu, L.; Tan, W.; Chen, L.; Qi, H.; Xie, L.; Chen, M.; Liu, B.; Yu, L.; Yao, N.; et al. Disruption of the arabidopsis defense regulator genes SAG101, EDS1, and PAD4 confers enhanced freezing tolerance. Mol. Plant 2015, 8, 1536–1549. [Google Scholar] [CrossRef] [Green Version]
  62. Shen, X.; Liu, B.; Xue, Z.; Jiang, M.; Lu, X.; Zhang, Q. Spatiotemporal variation in vegetation spring phenology and its response to climate change in freshwater marshes of Northeast China. Sci. Total Environ. 2019, 666, 1169–1177. [Google Scholar] [CrossRef]
  63. Upadhyaya, H.; Reddy, L.; Dwivedi, S.; Gowda, C.; Singh, S. Phenotypic diversity in cold-tolerant peanut (Arachis hypogaea L.) germplasm. Euphytica 2009, 2, 279–291. [Google Scholar] [CrossRef] [Green Version]
  64. Sun, M.; Spears, J.; Isleib, T.; Jordan, D.; Penny, B.; Johnson, D.; Copeland, S. Effect of production environment on seed quality of normal and high-oleate large seeded Virginia-type peanut (Arachis hypogaea L.). Peanut Sci. 2014, 41, 90–99. [Google Scholar] [CrossRef]
  65. Tang, Y.; Wang, C.; Gao, H.; Feng, T.; Zhang, S.; Wang, X.; Zhang, J.; Yu, S. Low temperature tolerance during seed imbibition and its relationship to main quality traits in peanut. J. Nucl. Agric. Sci. 2011, 25, 436–442. [Google Scholar]
  66. Chang, B.; Zhong, P.; Liu, J.; Tang, Z.; Gao, Y.; Yu, H.; Guo, W. Effect of low-temperature stress and gibberellin on seed germination and seed-ling physiological responses in peanut. Acta Agron. Sin. 2019, 45, 118–130. [Google Scholar] [CrossRef]
  67. Varshney, R.; Pandey, M.; Bohra, A.; Singh, V.; Thudi, M. Toward the sequence-based breeding in legumes in the post-genome sequencing era. Theor. Appl. Genet. 2018, 17, 1–20. [Google Scholar] [CrossRef] [PubMed] [Green Version]
  68. Varshney, R.; Thudi, M.; Pandey, M.; Tardieu, F.; Ojiewo, C.; Vadez, V.; Whitbread, A.; Siddique, K.; Nguyen, H.; Carberry, P.; et al. Accelerating genetic gains in legumes for the development of prosperous smallholder agriculture: Integrating genomics, phenotyping, systems modelling and agronomy. J. Exp. Bot. 2018, 69, 3293–3312. [Google Scholar] [CrossRef]
  69. Nawade, B.; Bosamia, T.; Thankappan, R.; Rathnakumar, A.; Kumar, A.; Dobaria, J.; Kundu, R.; Mishra, G. Insights into the indian peanut genotypes for ahFAD2 gene polymorphism regulating its oleic and linoleic acid fluxes. Front. Plant Sci. 2016, 7, 1271. [Google Scholar] [CrossRef] [Green Version]
  70. Zhang, M.; Zeng, Q.; Liu, H.; Qi, F.; Sun, Z.; Miao, L.; Li, X.; Li, C.; Liu, D.; Guo, J.; et al. Identification of a stable major QTL for fresh-seed germination on chromosome Arahy.04 in cultivated peanut (Arachis hypogaea L.). Crop J. 2022; in press. [Google Scholar] [CrossRef]
  71. Kumar, R.; Janila, P.; Vishwakarma, M.; Khan, A.; Manohar, S.; Gangurde, S.; Variath, M.; Shasidhar, Y.; Pandey, M.; Varshney, R. Whole-genome resequencing-based QTL-seq identified candidate genes and molecular markers for fresh seed dormancy in groundnut. Plant Biotechnol. J. 2020, 18, 992–1003. [Google Scholar] [CrossRef] [Green Version]
  72. Steuernagel, B.; Periyannan, S.; Hernandez-Pinzon, I.; Witek, K.; Rouse, M.; Yu, G.; Hatta, A.; Ayliffe, M.; Bariana, H.; Jones, J.; et al. Rapid cloning of disease-resistance genes in plants using mutagenesis and sequence capture. Nat. Biol. 2016, 34, 652–655. [Google Scholar] [CrossRef]
  73. Das, S.; Upadhyaya, H.; Bajaj, D.; Kujur, A.; Badoni, S.; Kumar, V.; Tripathi, S.; Gowda, C.; Sharma, S.; Singh, S.; et al. Deploying QTL-seq for rapid delineation of a potential candidate gene underlying major trait-associated QTL in chickpea. DNA Res. 2015, 22, 193–203. [Google Scholar] [CrossRef]
  74. Singh, V.; Khan, A.; Saxena, R.; Kumar, V.; Kale, S.; Sinha, P.; Chitikineni, A.; Pazhamala, L.; Garg, V.; Sharma, M.; et al. Next-generation sequencing for identification of candidate genes for Fusarium wilt and sterility mosaic disease in pigeonpea (Cajanus cajan). Plant Biotechnol. J. 2016, 14, 1183–1194. [Google Scholar] [CrossRef] [Green Version]
  75. Huang, G.; Ma, S.; Bai, L.; Zhang, L.; Ma, H.; Jia, P.; Liu, J.; Zhong, M.; Guo, Z. Signal transduction during cold, salt, and drought stresses in plants. Mol. Biol. Rep. 2012, 39, 969–987. [Google Scholar] [CrossRef] [PubMed]
  76. Iordachescu, M.; Imai, R. Trehalose biosynthesis in response to abiotic stresses. J. Integr. Plant Biol. 2008, 50, 1223–1229. [Google Scholar] [CrossRef]
  77. He, W.; Gao, J.; Dou, T.; Shao, X.; Bi, F.; Sheng, O.; Deng, G.; Li, C.; Hu, C.; Liu, J.; et al. Early cold-induced peroxidases and aquaporins are associated with high cold tolerance in Dajiao (Musaspp. ‘Dajiao’). Front. Plant Sci. 2018, 9, 282. [Google Scholar] [CrossRef] [Green Version]
  78. Su, C.; Wang, Y.; Hsieh, T.; Lu, C.A.; Tseng, T.; Yu, S. A novel MYBS3-dependent pathway confers cold tolerance in rice. Plant Physiol. 2010, 153, 145–158. [Google Scholar] [CrossRef]
Figure 1. Phenotypic analysis of LTG at 7 d of rewarming germination. (A), The performance of two parental lines, YH65 and FL14. (B), Plant tomography system Ctportable scan image of seed internal structure of two parents. (C), The performance of extreme individuals, HT and HS. (D), Frequency distribution for LTG tolerance showing phenotypic variation in F2 population.
Agronomy 13 00018 g001
Figure 2. Mapping of genomic regions associated with LTG tolerance based on BSA-Seq fitting and plotting by Ggplot2. (A), Manhattan plot analysis on distribution of ΔSNP-index on chromosomes. (B), The Manhattan plot analysis on distribution of the square of the ED on the chromosomes. The abscissa indicates the chromosome number, the blue and red lines represent 95% and 99% confidence intervals, respectively. The candidate association region for LTG tolerance is framed. The data was fitted and plotted by Ggplot2.
Agronomy 13 00018 g002
Figure 3. Enrichment analysis of 122 genes in candidate region for LTG tolerance. (A), GO classification. (B), KEGG pathway enrichment analysis.
Agronomy 13 00018 g003
Figure 4. Validation of markers for LTG tolerance. (A), Relative germination energy difference between two genotypes in verification group at the Arahy05:107485885. The boxplots were drawn using software of Origin 2021. (B), KASP marker genotyping for the candidate SNP site.
Agronomy 13 00018 g004
Table 1. Phenotypic variation analysis of parents and F2 population.
ItemParentsF2 Population
YH65FL14MeanRangeSDSkewnessKurtosisCV (%)
LTG scale153.491–51.050.1090.2170.300
Bud length (cm)5.100.000.340.00–8.300.9230.1090.2172.681
Table 2. Summary of Illumina sequencing of parental lines and bulks for LTG tolerance.
SampleTotal Data (bp)High-Quality ReadsMapping (%)GC (%)Q30 (%)Average Depth (×)Genome Coverage (%)
YU6555,039,185,600332,684,45699.9639.6488.2215.2398.87
FuL1453,770,119,000344,017,16899.8840.6992.4616.2698.24
HT79,259,289,000508,218,61699.9437.7092.5823.8499.35
HS80,996,380,200494,885,65499.9737.5888.6622.299.35
Table 3. Analysis of candidate regions associated with LTG tolerance.
ChromosomeOverlapping Region (bp)Size (Mb)HQ_SNPNo. of Gene
05107,340,001~109,630,0002.299122
12109,310,001~111,950,0002.646135
1321,530,001~24,620,0003.095116
14118,310,001~120,570,0002.26284
1654,260,001~56,260,0002.0017
1685,540,001~88,220,0002.68213
17122,360,001~124,460,0002.106
Table 4. Nucleotide types of candidate SNP and KASP primer sequences.
IDBSA-Seq DataPrimer TypePrimer SequenceAlleleParent
Arahy.A05_107485885ΔSNP-index0.3272Allele-specific (HEX)GAAGGTGACCAAGTTCATGCTGGTCAGTAATCAAGCTAGAATAAAAATTGGGYH65
ED0.2141Allele-specific (FAM)GAAGGTCGGAGTCAACGGATTGTCAGTAATCAAGCTAGAATAAAAATTGAAFL14
CommonATTATCCTGGCAATATAATTCTTTGTAGTATTTC
Arahy.A05_108044810ΔSNP-index0.5926Allele-specific (HEX)GAAGGTGACCAAGTTCATGCTGATGGATTGATTTTTATTTTTTGTCCYH65
ED0.7023Allele-specific (FAM)GAAGGTCGGAGTCAACGGATTGATGGATTGATTTTTATTTTTTGTTTFL14
CommonTTAAGCCAATTTTTTTTGCTAATGATATCAT
Disclaimer/Publisher’s Note: The statements, opinions and data contained in all publications are solely those of the individual author(s) and contributor(s) and not of MDPI and/or the editor(s). MDPI and/or the editor(s) disclaim responsibility for any injury to people or property resulting from any ideas, methods, instructions or products referred to in the content.

