Article

Comprehensive Analysis of GASA Family Members in the Peanut Genome: Identification, Characterization, and Their Expressions in Response to Pod Development

1
School of Life Sciences, Zhengzhou University, Zhengzhou 450001, China
2
Henan Academy of Crop Molecular Breeding, Zhengzhou 450002, China
3
State Industrial Innovation Center of Biological Breeding, Zhengzhou 450002, China
4
Key Laboratory of Oil Crops in Huang-Huai-Hai Plains, Ministry of Agriculture, Zhengzhou 450002, China
5
Henan Provincial Key Laboratory for Oil Crops Improvement, Zhengzhou 450002, China
6
Shennong Laboratory, Henan Academy of Crop Molecular Breeding, Zhengzhou 450002, China
*
Authors to whom correspondence should be addressed.
These authors contributed equally to this work.
Agronomy 2022, 12(12), 3067; https://doi.org/10.3390/agronomy12123067
Submission received: 20 October 2022 / Revised: 29 November 2022 / Accepted: 1 December 2022 / Published: 3 December 2022

Abstract

:
The gibberellic acid-stimulated Arabidopsis (GASA) gene family is essential for plant growth and development, hormone level control, and phytohormone signal transmission. Different plants have been shown to contain numerous GASA homologs. However, there is no knowledge about these proteins in peanuts. In the current study, we performed a thorough bioinformatics and expression analysis and found 20, 22, and 40 GASA genes by genome-wide analyses of A. hypogaea L., A. duranensis, and A. ipaensis, respectively. We analyzed and predicted the physical properties of these genes. Based on the results of our phylogenetic analysis, the evolutionary tree constructed from the 40 AhGASA proteins was divided into seven categories, forming a total of 14 gene pairs. According to our observations, tandem duplication is a significant factor in the expansion of the GASA gene family. AhGASA was unevenly distributed on 20 chromosomes, and 17 tandem duplicated genes were identified. A co-lineage analysis with the A/B subgenome identified 69 linear/parallel homologous gene pairs. A cis-element analysis revealed that the AhGASA protein is crucial for hormone responsiveness. In materials with different size traits at various stages of peanut pod development, transcriptomics and RT-qPCR analyses revealed that AhGASA genes are expressed at various levels and are tissue-specific. This finding suggests that some AhGASA genes may be involved in controlling peanut pod size. This study suggests that GASA genes are crucial for controlling the development of peanut pods and provides the first systematic identification and analysis of GASA genes in peanut. These findings will help future research into the function of the GASA gene in the cultivated peanut.

1. Introduction

The GASA (gibberellic acid stimulated Arabidopsis) gene family is vital among plants; the expression of its members is induced by gibberellin. According to [1,2,3], GASA genes are involved in the regulation of growth and development processes as well as hormone levels in plants and phytohormone signal transduction.
First discovered in a tomato mutant in 1992 [4], GASA proteins have since been found in Arabidopsis thaliana [1,5], Moso Bamboo [6], apple [3], rice [7], wheat [8], Glycine max [9], Solanum tuberosum [10], grapevine [11], Sorghum bicolor [12], and cotton [13]. The majority of the tiny, cysteine-rich proteins that GASAs encode are found on the cell wall. An N-terminal signal peptide and a conserved C-terminal region with 12 cysteine residues are two common features of GASA proteins. According to Sun’s research, crucial peptide residues that are deleted or altered may result in the loss of biological functions [14]. This shows that the C-terminal domain has undergone very little change during its history and has significant biological functions.
GASA proteins have an impact on seed development, flower and root growth, and blooming period. For instance, AtGASA2/3/5 and AtGASA14 are implicated in Arabidopsis flower induction and ABA signaling [1]. AtGASA4 promotes blooming in Arabidopsis, but AtGASA5 represses or delays flowering. Similarly, GEG (the gerbera homolog of GASA 1 gene) slows petal development, whereas PRGL (proline-rich and GASA-like) stimulates gerbera petal development. More significantly, the overexpression of the AtGASA4 gene increased the size, weight, and yield of seeds in Arabidopsis. Additionally, VvGASA2/7 is involved in the development of grapevine (Vitis vinifera L.) seeds [11], TaGASR7 is linked to grain length in wheat [15], and OsGASA increases rice grain size and length [7]. These findings demonstrate that GASA has enormous potential to contribute to the growth of fruits and increase crop breeding yield. Considering that this gene family may be heavily involved in the regulation of phytohormone signal transduction networks, the GASA protein also influences phytohormone response, which is primarily regulated by gibberellin and is also involved in the regulation of phytohormones such as BR, auxin, and abscisic acid [16,17,18]. Phytohormones are crucial for managing seed development, size, and quality in agriculture [19,20]. Gibberellin, a vital regulator of the growth and development of plants, is mainly found in vigorous growth sites and is involved in the lengthening of stems, the germination of seeds, the lengthening of hypocotyls, the ripening of fruits, the expansion of leaves, and the transition of plants from vegetative growth to flowering [21,22]. The placement of genes within the cell can also reveal information about their function. As with OsGASR1 and OsGASR2, the majority of the discovered GASA proteins are found in the cell wall or apoptosome and have important roles in protein trafficking and localization [18,23,24]. Similar to AtGASA4 and AtGASA6, they relocate to the nucleus in the absence of a signal peptide, where they are often detected at the cell periphery [16].
The cultivated peanut (Arachis hypogaea L.) is a significant source of edible oil and protein and is one of the most important cash crops [25,26,27]. The seed oil and protein from peanuts are important in fighting malnutrition and ensuring food security. In recent years, numerous peanut gene families, such as small auxin-upregulated RNAs (SAURs) [28], late embryogenesis abundant proteins (LEA) [29], the WRKY gene family [30], and the phytochrome-interacting factors (PIFs) gene family [31], have been described and investigated. One of the key agronomic characteristics of crops is their seed size. Larger seeds typically produce larger plants which are better able to compete for nutrients and light and to withstand stress [32]. In our comprehensive time-series comparative transcriptome analysis, we focused on the important roles of gibberellin, auxin, brassinolide, cytokinin, and abscisic acid in regulating seed size development in peanut and initially constructed regulatory networks for key factors [33]. The enrichment results disclosed a large number of genes in the gibberellin regulatory pathway, particularly the GASA gene family. However, to our knowledge, there is no report of a bioinformatics analysis of the GASA gene family at the genome-wide level. There is no information regarding the GASA gene family in peanut studies, despite the fact that GASA genes play significant roles as plant growth regulators, especially in seed size and weight. Overall, research on peanut seed size is still in its infancy, and there is a lack of new genes with important utilization value at present. Determining the members of the peanut GASA family and their possible roles will thus surely be helpful.
Therefore, in this study, GASA family genes are identified from the genomes of A. hypogaea L., A. duranensis, and A. ipaensis, and the distribution of each gene on chromosomes, the structural characteristics of the genes, and differences between cultivated and wild peanuts as well as phylogenetic relationships are analyzed. The possible functions of some AhGASA genes were inferred by a bioinformatics analysis and temporal transcriptomics with differences in pod size traits, combined with RT-qPCR assays of peanut shells and seeds at different developmental periods and using different tissues. To the best of our knowledge, this research is the first comprehensive analysis of cultivated peanut GASA genes. Rarely have reports of this gene family in oilseed crops been made. The results of this study will serve as the basis for more in-depth research on the peanut GASA gene and the identification of important genes involved in the control of peanut pod size.

2. Materials and Methods

2.1. Screening and Identification of the GASA Family in the Peanut

To determine the GASA gene family members, as well as the Arachis hypogaea cv. Tifrunner protein, CDS, and genome sequences, Tifrunner was downloaded from PeanutBase (https://peanutbase.org/data/v2/Arachis/hypogaea/) (accessed on 15 March 2022), a database of peanut-related information. The reported GASA protein sequences of Arabidopsis were downloaded from TAIR (https://www.arabidopsis.org/) (accessed on 15 March 2022), and then, the local cultivar peanut genome database was constructed for a BlastP search with the Arabidopsis GASA protein sequences as the query object. The threshold E ≤ 1e−5 was set, number of hits ≥ 500, and num of hits ≥ 250. In order to identify the conserved domain and eliminate genes that lack the GASA domain, the genomic, CDS, protein, and 1.5 kb upstream promoter areas of the GASA genes were extracted and subjected to a query to the NCBI database. Based on the conserved structural domains of GASA proteins, further analysis was performed using the Pfam database. The physicochemical properties of the AhGASA gene, such as protein isoelectric point (PI) and molecular weight (MW), were analyzed using the online tool Expasy-Protparam (https://web.expasy.org/compute_pi/) (accessed on 20 March 2022). We used the online prediction tool WOLF-PSORT (https://wolfpsort.hgc.jp/) (accessed on 20 March 2022) to study the subcellular distribution of SNAT proteins. Using ExPASy (http://web.expasy.org/protparam/) (accessed on 25 March 2022), AhGASA protein sequence properties are predicted.

2.2. Phylogenetic Analysis of GASA Proteins

To further investigate the evolutionary relationships of the cultivated peanut GASA genes, we constructed an evolutionary tree of cultivated peanut-intraspecific GASA genes. To investigate the evolutionary relationships among AhGASA genes, the protein sequences of cultivated peanut AhGASA were entered into MEGA7 [34] and multiple sequence alignment analysis was performed using ClustalW. The intraspecific evolutionary tree was constructed using the maximum likelihood method with the following parameters: bootstrap replication: 1000; model and method: JTT model + G + I; Missing Data Treatment: partial deletion. The resulting phylogenetic tree was illustrated using the website Evolview [35].

2.3. Conserved Motif and Gene Structure Analyses

Using the entire genome annotation file of the domesticated peanut retrieved from PeanutBase, the gene structure of AhGASA members was ascertained. The online MEME predicts the motifs of the genes [36]. Using the Gene Structure Display Server (GSDS) program [37], we mapped the exon/intron structures of exons/introns using the CDS and genome sequences of the cultivated peanut genome. The evolutionary relationships, gene structure, and motif composition of GASA were mapped using TBtools [38].

2.4. Chromosome Localization, Duplications, and Evolutionary Analysis of AhGASAs

The physical location of the chromosome positions of two peanut wild species and one peanut cultivar variety were mapped using TBtools software. We downloaded the genome-wide annotation files of A. hypogaea L., A. duranensis, A. ipaensis, Medicago truncatula L., and Glycine max L., and used MCScanX to identify node and tandem repeat gene pairs in the cultivated peanut genome and genomic co-linear gene pairs. We used TBtools software to visualize chromosomal location and gene duplication for members of five species of GASAs.

2.5. Promoter Analysis of AhGASAs

Approximately 2000 bp upstream sequences of AhGASAs were used to better understand the potential functions of the promoters. PlantCARE [39] was used to identify cis-regulatory elements present in the promoters of genes associated with stress responses and hormonal effects. We predicted cis-acting elements in the AhGASA gene’s promoter region using the PlantCARE website.

2.6. Plant Materials

In this study, we determined the gene transcript levels in the following varieties: the large-grain variety YH15 with different pod length and width, seed length and width, and 100-seed weight phenotypes; the small-grain variety W1202; the long-pedigree line S181523; and the short-pedigree line S181517 from the RIL population, obtained by crossing them. Pods at the early stage of development and shells and seeds at mid- and late pod development were sampled separately; these five samples are subsequently referred to as Pod-25, Shell-35, Seed-35, Shell-45, and Seed45. The sampling was performed three times and samples were immediately frozen in liquid nitrogen and stored at −80 °C until further use. The raw data for RNA-seq were downloaded from NCBI (SRA accession number: PRJNA847769).

2.7. Gene Expression Analysis and Functional Annotation of AhGASAs

The output obtained after the comparison was processed by featureCounts [40] and the count values were converted into FPKM. The DEGseq2 [41] method was used to identify DEGs, and the screening criteria were set as p-value < 0.05 and|log2 (foldchange)| >1. To analyze the potential functions of genes, Kyoto Encyclopedia of Genes and Genomes (KEGG) databases were used. The KEGG enrichment analysis was performed using the OmicShare (https://www.omicshare.com/tools/) (accessed on 15 April 2022), and the Phyper of R version 3.6.3 was used to determine the p-value. Significant enrichment was defined as functional when p-value < 0.05.

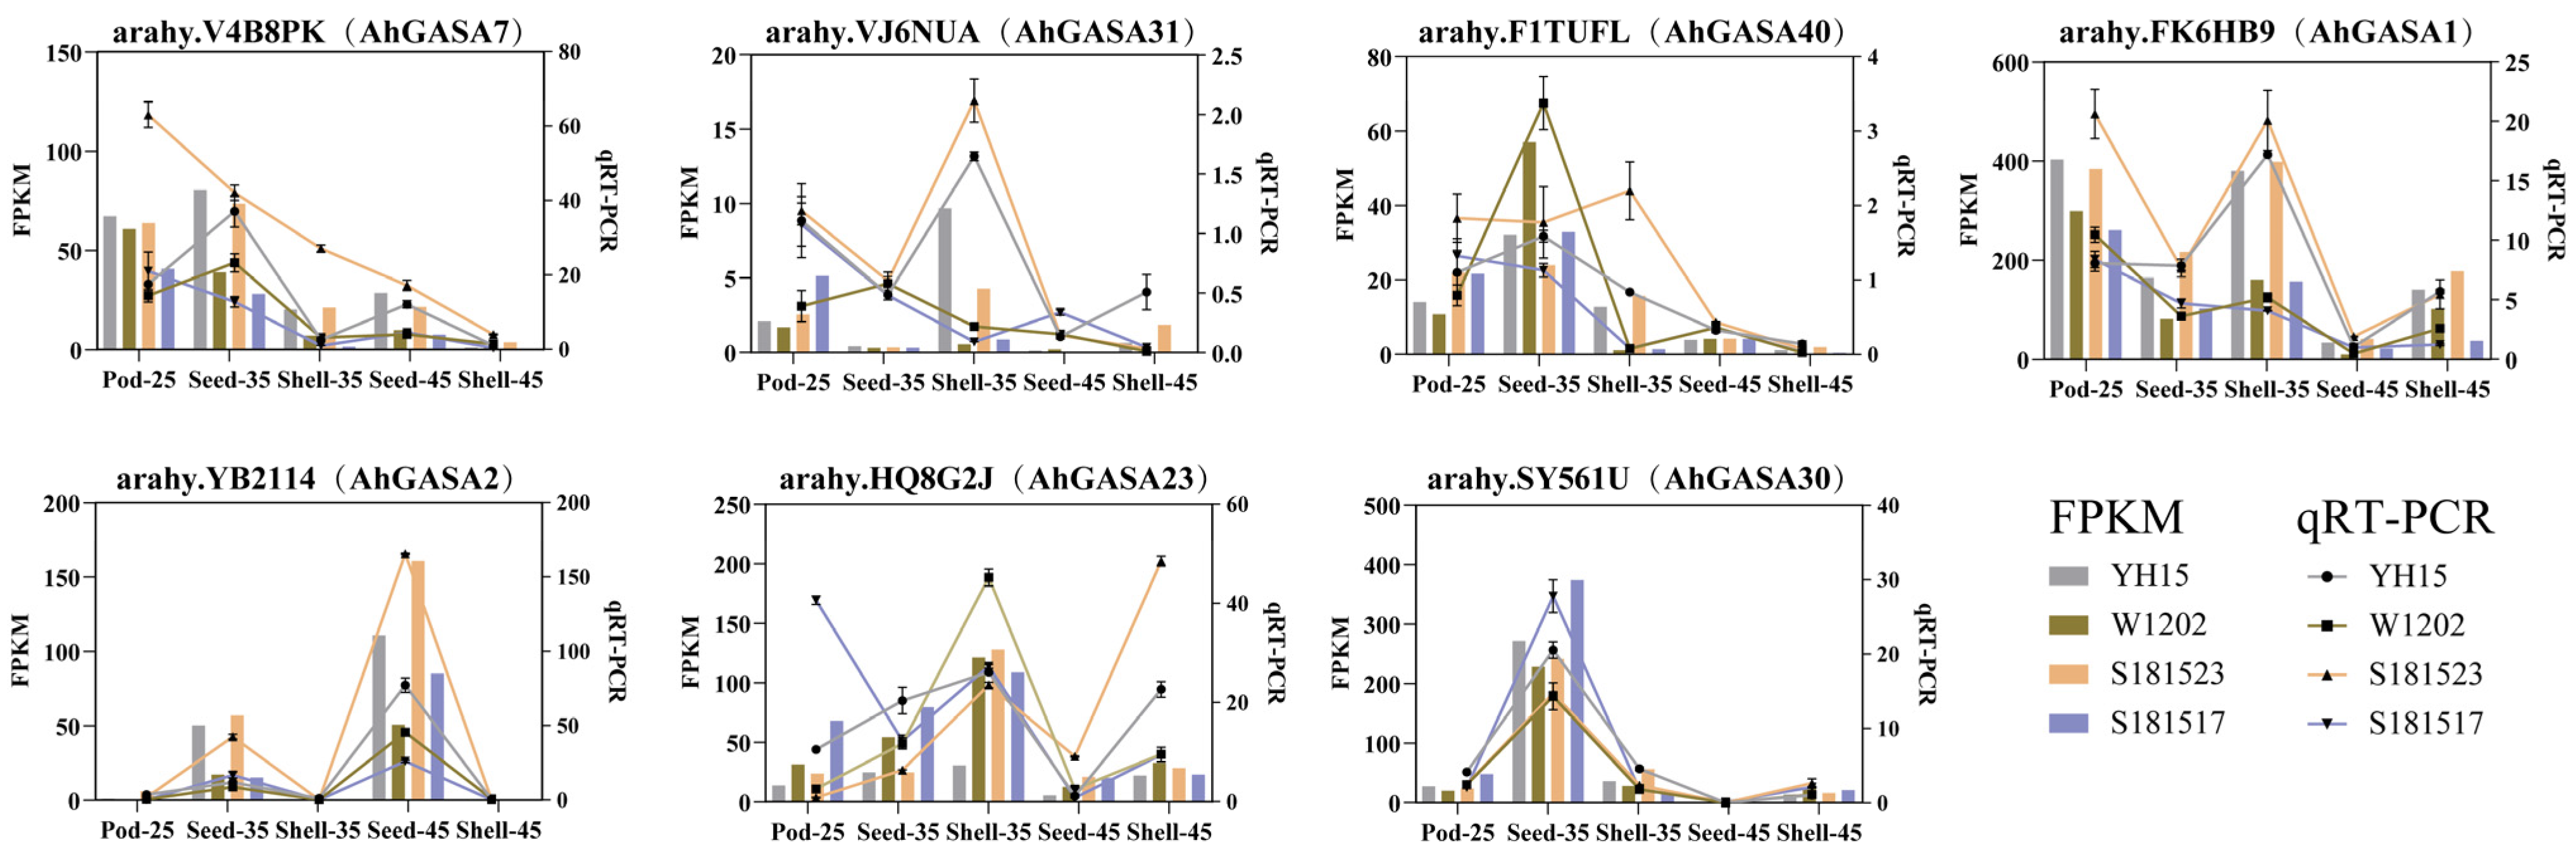
2.8. Validation of Gene Expression

To further verify the reliability of AhGASA expression in transcriptome data, the mRNA expression levels of seven genes selected from AhGASAs were measured by RT-qPCR using the same batch of tissue samples. First, the total RNA was extracted using the TaKaRa MiniBEST Plant RNA Extraction Kit (Takara Bio Inc., Kusatsu, Shiga, Japan). Then, the RNA extracted from the pods was reverse-transcribed using the PrimeScript™ II 1st Strand cDNA Synthesis Kit to cDNA (TaKaRa). Primers were designed using Oligo7 and checked for primer specificity using Primer-BLAST (https://www.ncbi.nlm.nih.gov/tools/primer-blast/) (accessed on 1 May 2022). Gene-specific primers for RT-qPCR were synthesized at BGI (Beijing, China), were listed in Table S1. Subsequently, RT-qPCR was performed using the ABI QS5 RT-qPCR detection system (Applied Biosystems, USA) and Power UpTM SYBRTM Green Master Mix (A25742, Applied Biosystems, Foster City, CA, USA). The reaction system was configured using 5 µL 2X PowerUp SYBR Green Master Mix, 0.5 µL forward primer, 0.5 µL reverse primer, and 100 μg cDNA for RT-qPCR experiments. An ABI QS5 RT-qPCR system was used under the following procedure: 95 °C for 2 min, followed by 40 cycles of 95 °C for 15 s, and 60 °C for 1 min in a 10 µL volume. At least three technical duplicates were run for each gene in each pool, and the entire sample preparation was conducted under cover and on ice. ADH3 was used as the reference gene. Gene expression differences among samples were calculated by the 2−ΔΔCt method, and a correlation analysis was performed using GraphPad Prism 8 to assess the agreement between RT-qPCR results and RNA-seq data [42].

3. Results

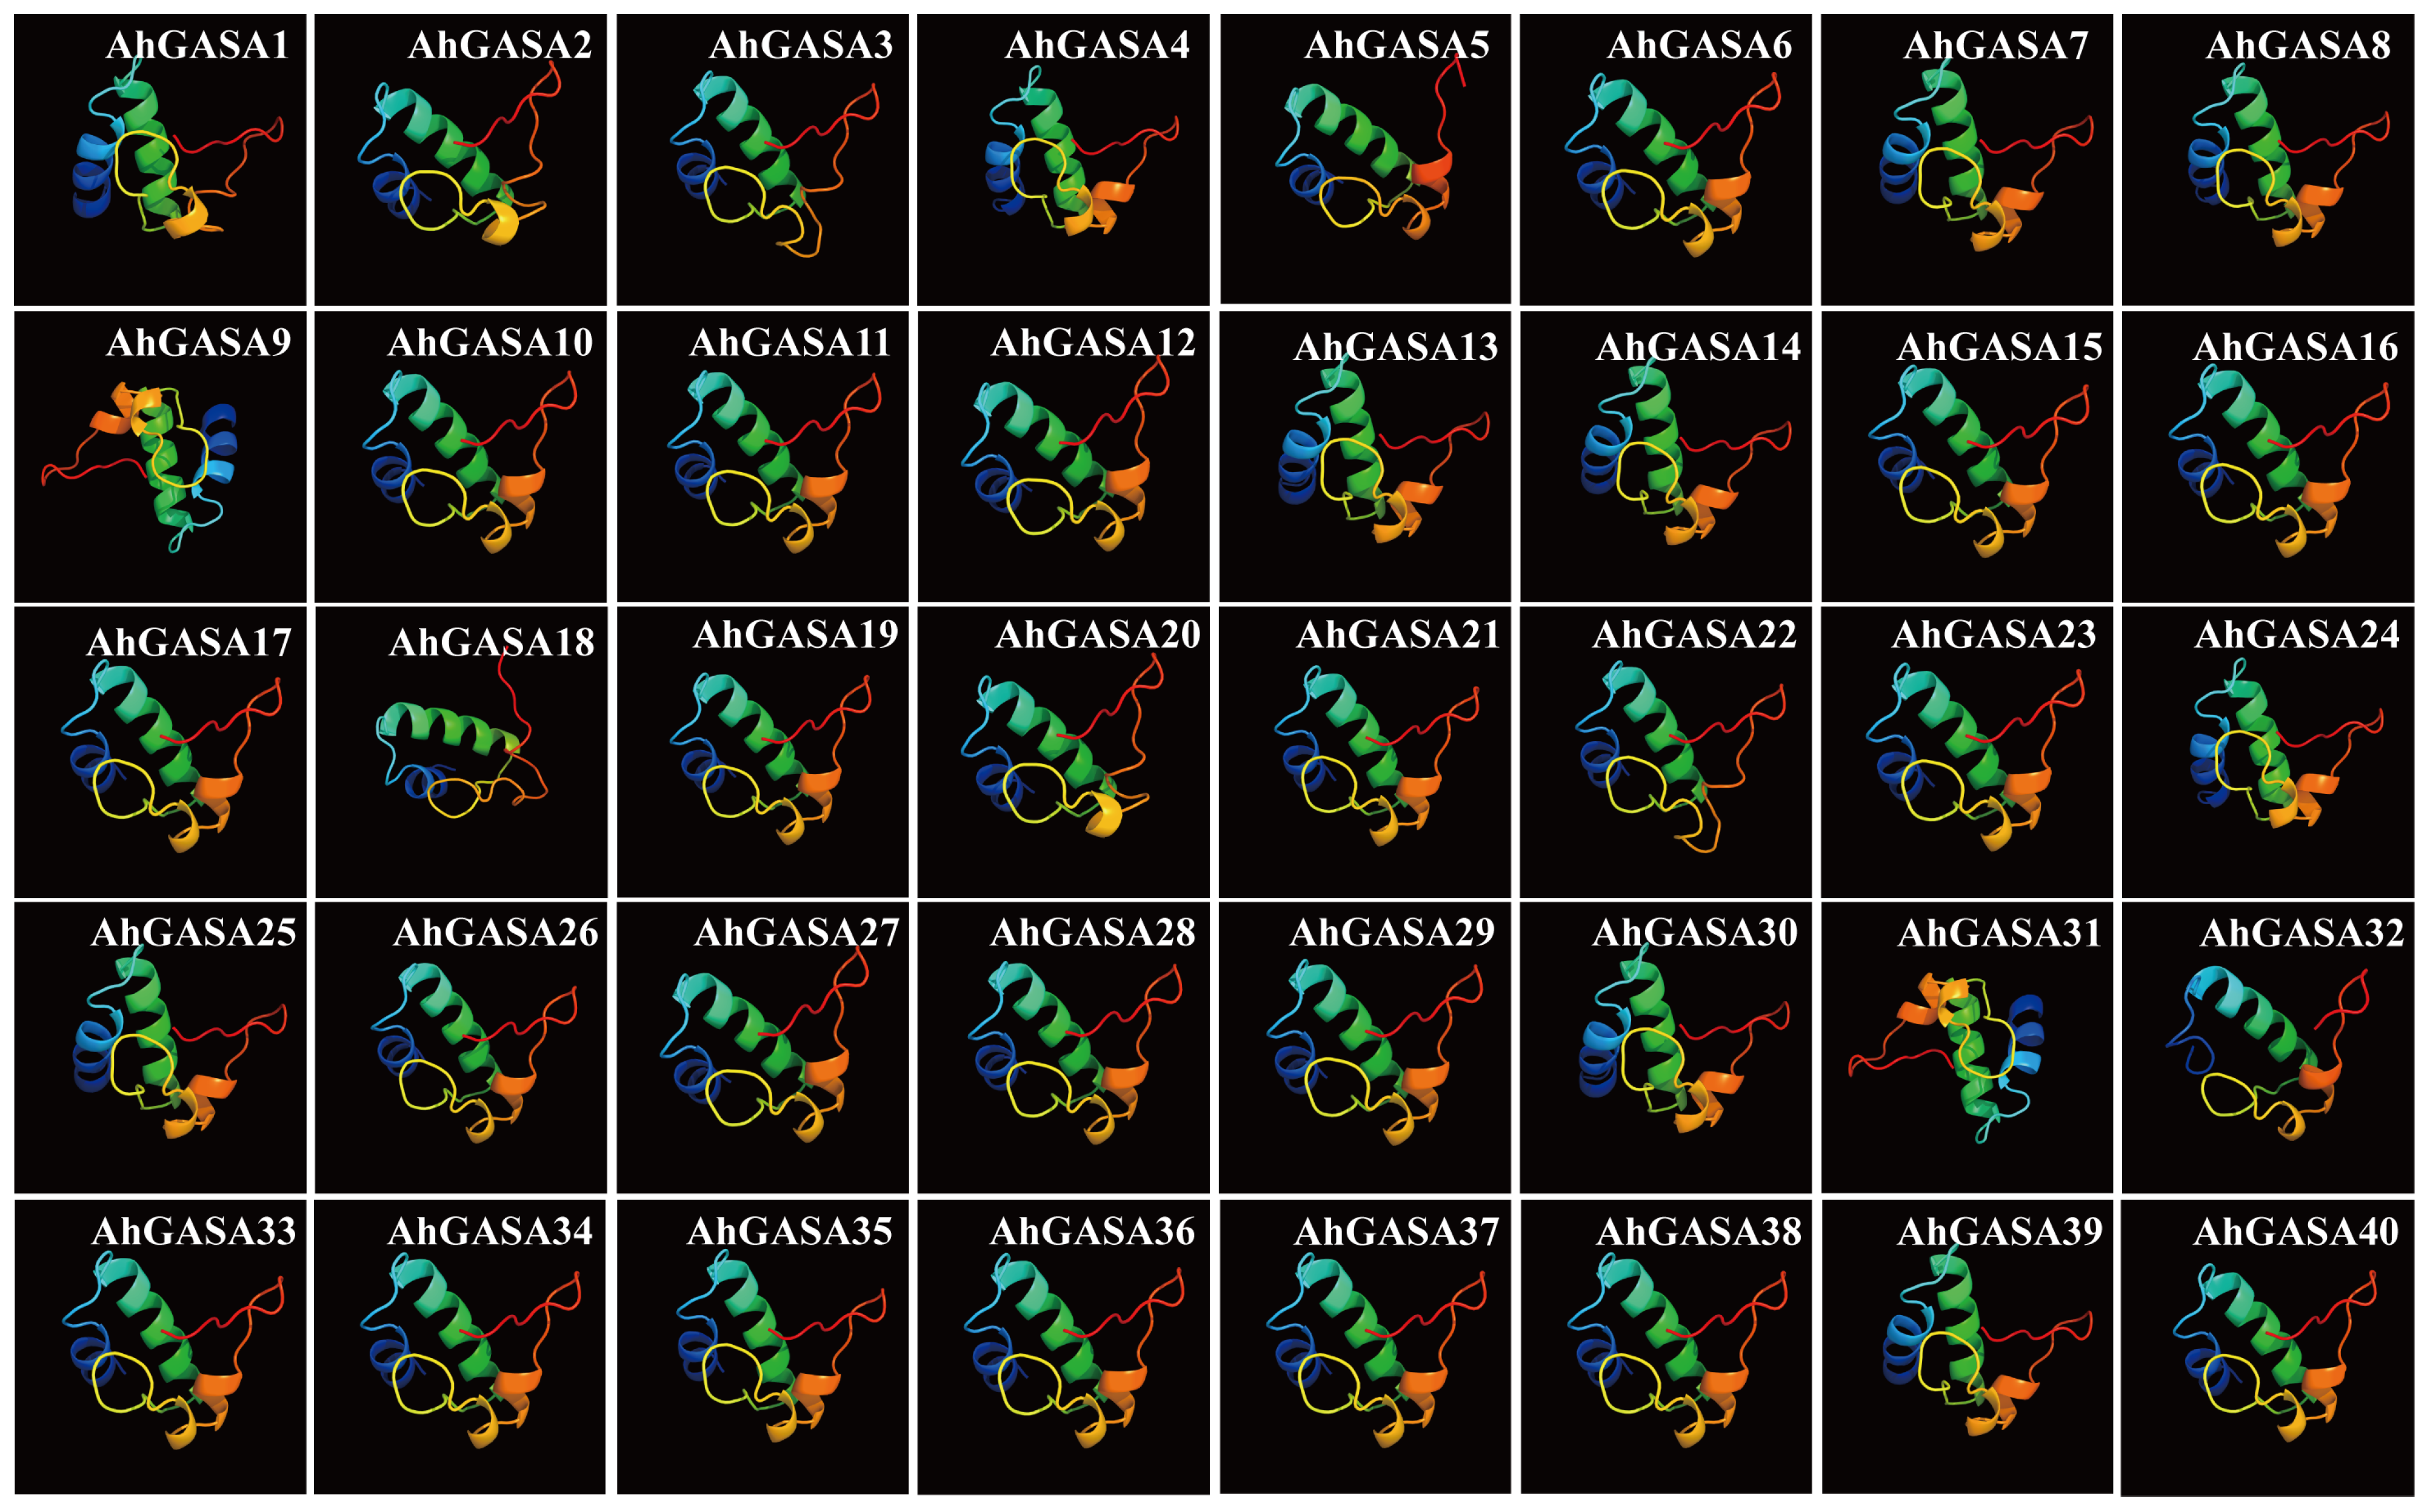
3.1. Composition and Protein Characteristics of the Peanut GASA-Gene Family

Fifteen AtGASA protein sequences were used as search criteria to search for GASA genes in the genomes of A. hypogaea L., A. duranensis, and A. ipaensis. After a homologous gene search and the elimination of protein sequences without conserved structural domains using Pfam, 20 members of the AdGASA-like family were identified in the AA subgenome, 22 members of the AiGASA-like family were identified in the BB subgenome, and 40 members of the AhGASA-like family were identified in cultivars. We simplified the gene names to AdGASA1AdGASA20, AiGASA1AiGASA22, and AhGASA1AhGASA40, according to their positions on the chromosomes. The number of AhGASA genes was higher in this study compared to those reported in Arabidopsis, apple, potato, and soybean. Among all members of the AhGASA family, the C-terminus was found to consist of 50 amino acids (11 of which are cysteine residues) that form a conserved structural domain. In a multiple sequence comparison of the core structural domain of cultivated peanut, 13 amino acids were extremely conserved, 13 amino acids were extremely conserved in apple, 18 amino acids were extremely conserved in soybean, and 20 amino acids were extremely conserved in Trichoderma (Figure S1).
The physical characteristics of these genes, such as Gene ID, isoelectric point, protein molecular weight, protein length, and subcellular localization, were then examined and predicted (Table S2). AhGASA proteins have an isoelectric point between 6.06 (AhGASA18) and 9.70 (AhGASA22). All proteins have more positively charged amino acids than negatively charged amino acids, so the isoelectric point is almost always greater than 8. Protein lengths range between 60 (AhGASA5) and 202 (AhGASA22) amino acids, with AhGASA22 and AhGASA3 proteins having 202 and 198 amino acids, respectively, which differ significantly from other proteins. Most AhGASA proteins are stable, but AhGASA5 has an instability index as high as 94.88. Studies have shown that this stability is closely related to the lifetime of proteins involved in cellular enzymatic reactions. The aliphatic index ranged between 27.67 (AhGASA5) and 100.57 (AhGASA18), and most of the proteins were hydrophilic; only three were hydrophobic. Subcellular localization predicts 36 genes in the cell wall, 2 genes in the nucleus, 1 gene in the chloroplast, and 1 gene in the endoplasmic reticulum. The predicted tertiary structure of AhGASA protein was found to be mainly composed of 2-4 α-helix and 2-3 random coils (Figure 1). Combined with the classification of the phylogenetic tree, the tertiary structure of the proteins in its III. IV. V clusters is more consistent and differs significantly from the tertiary structure of the proteins in its I. II. VI.VII clusters in terms of α-helices. In addition, this protein family’s preponderance of random coils contributes to its structural flexibility.

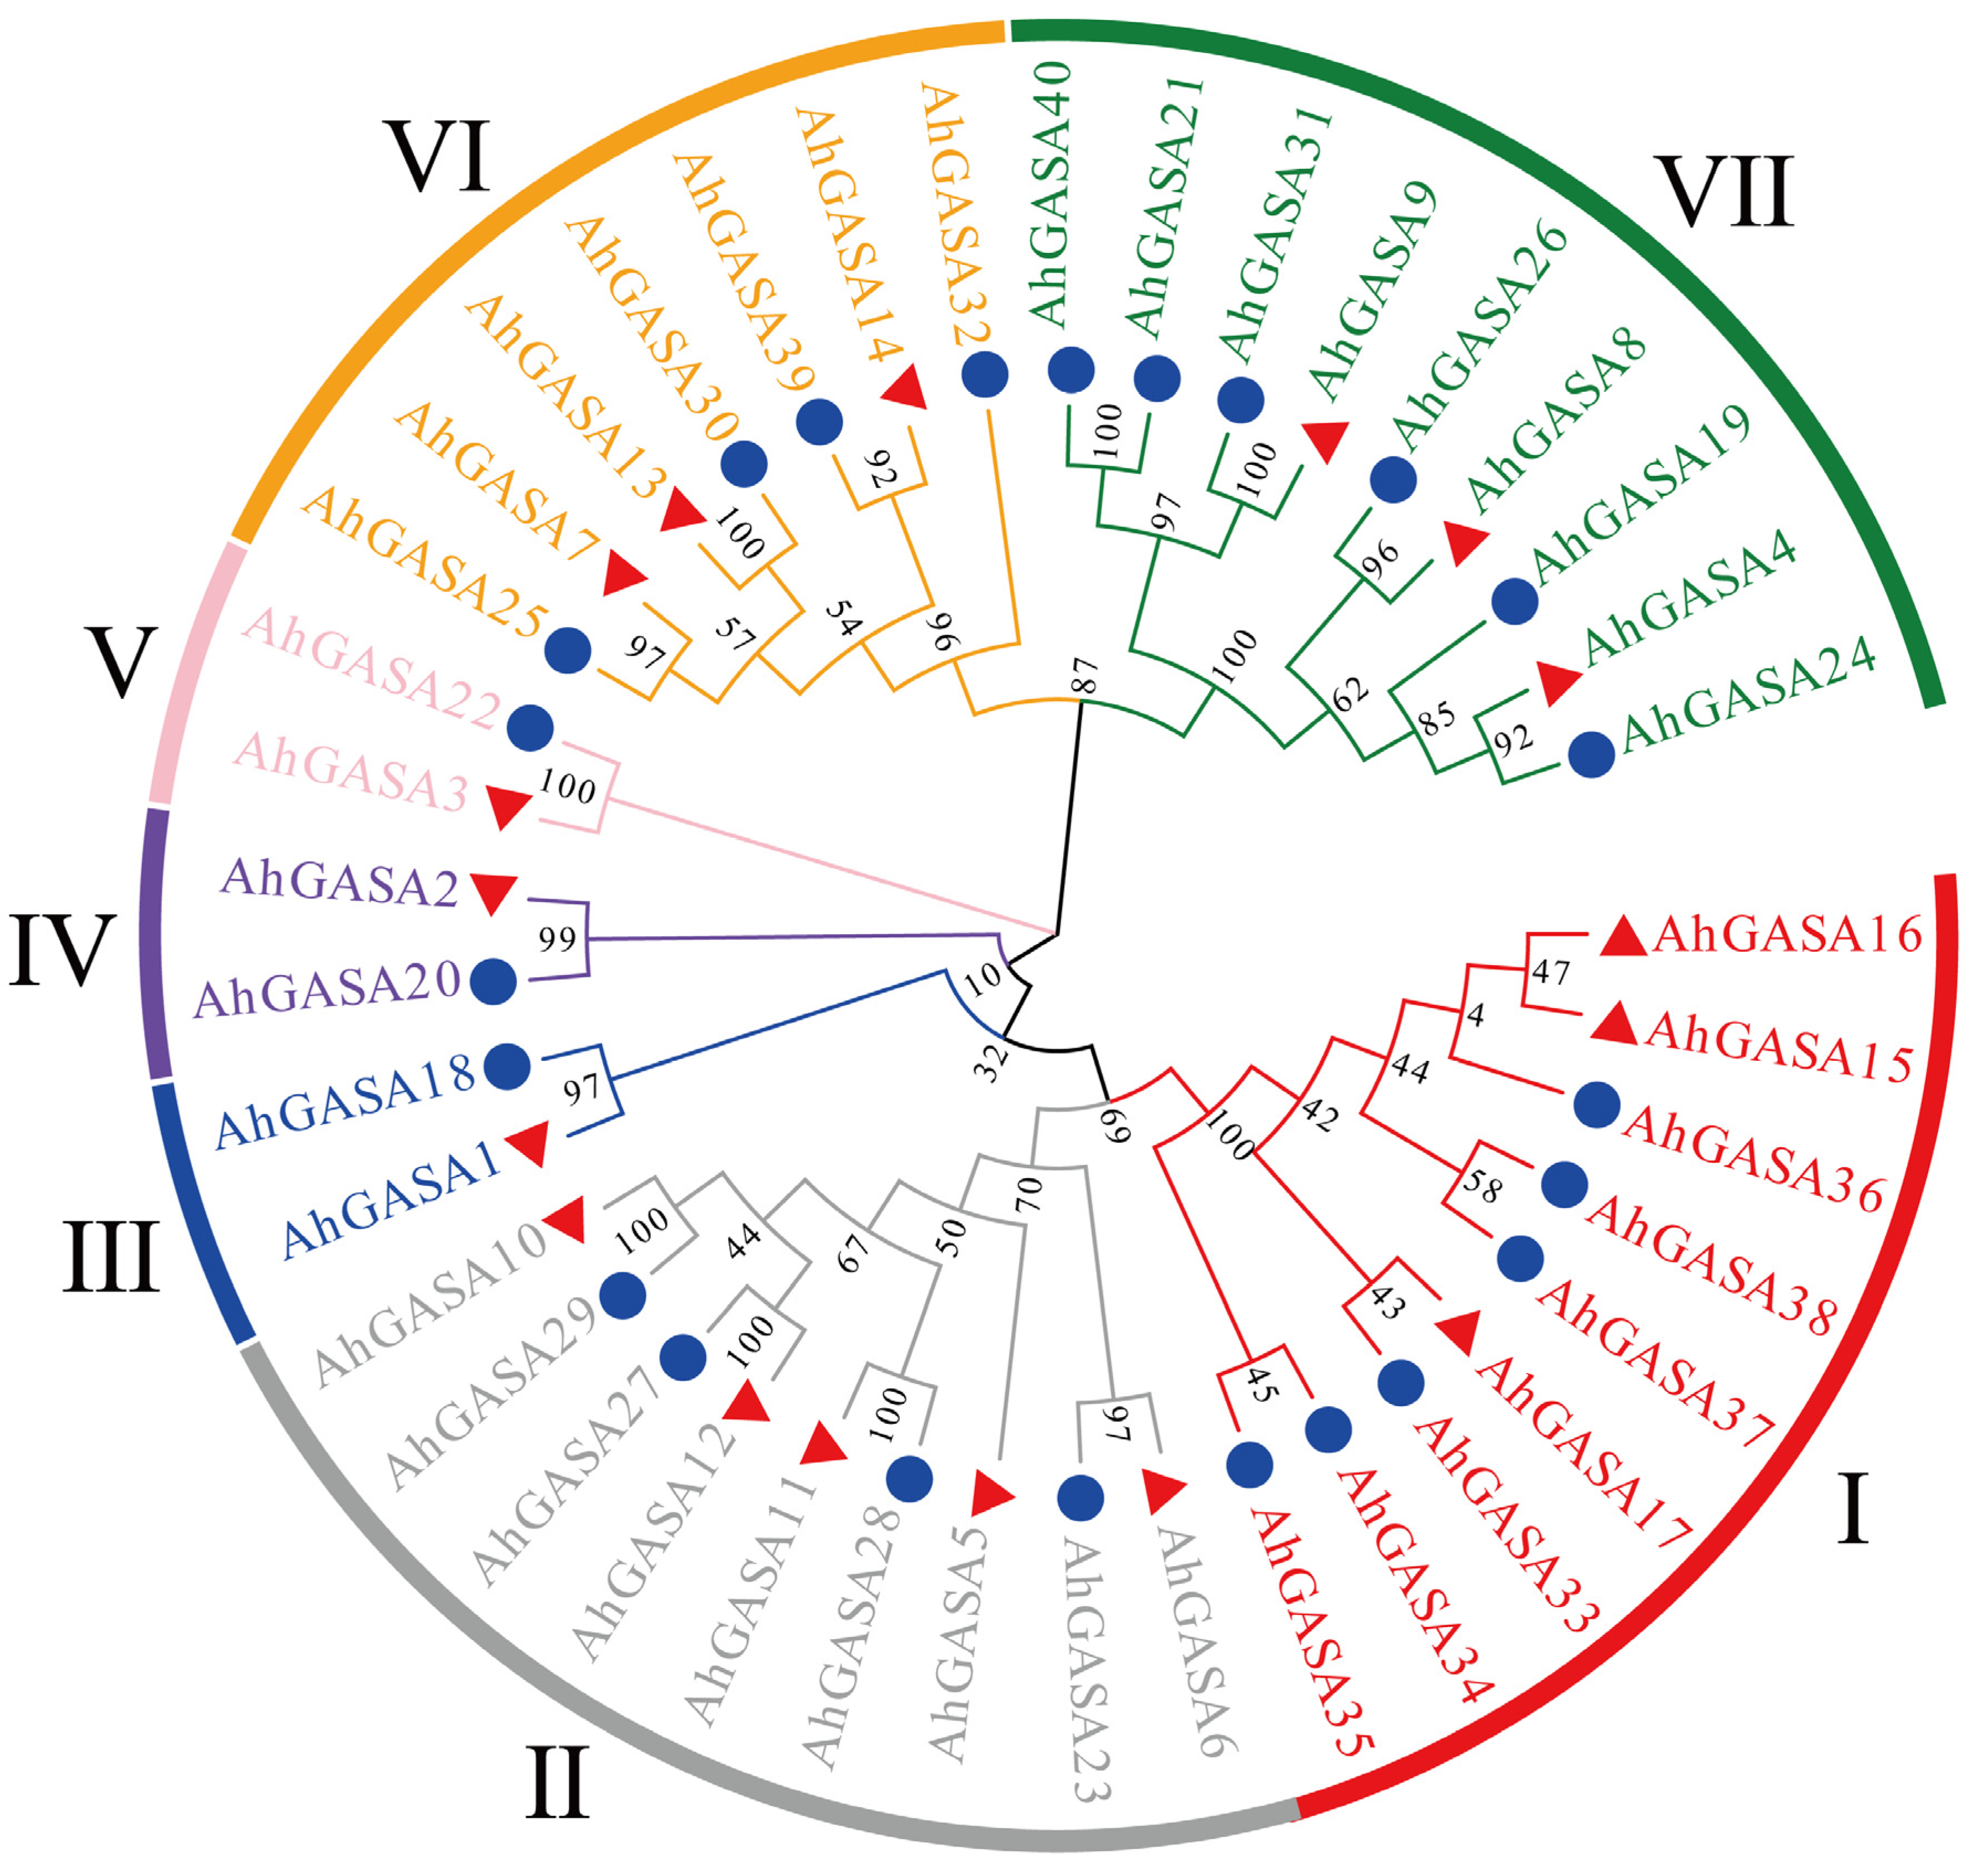
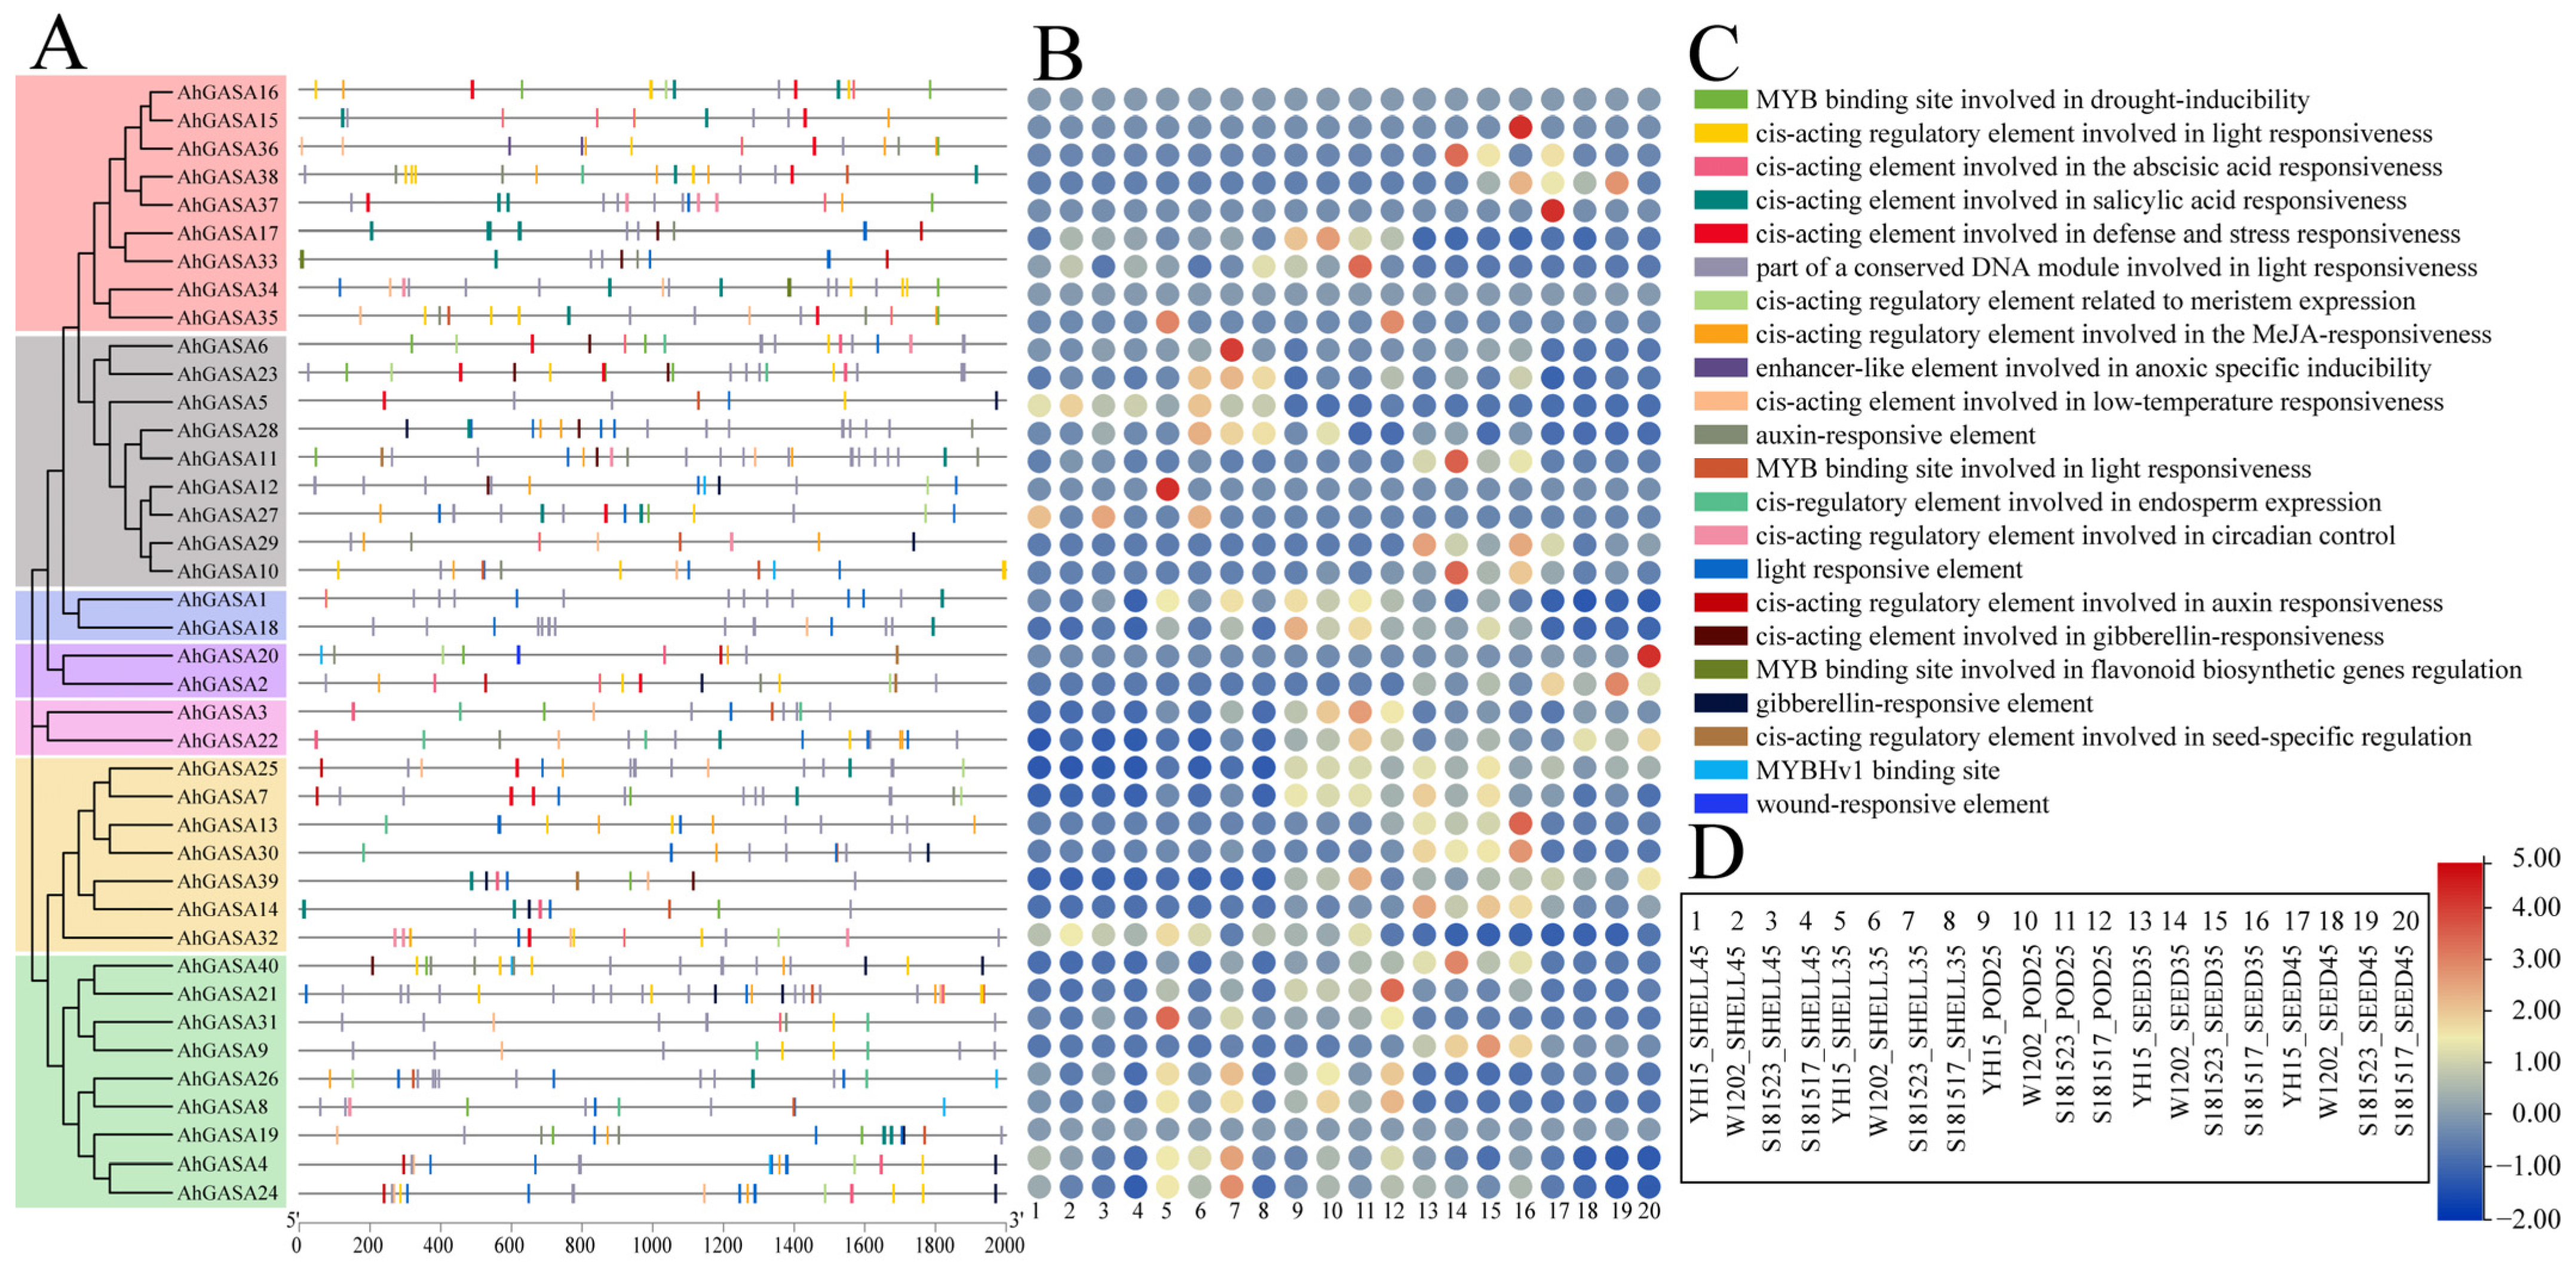
3.2. Phylogenetic Analysis of GASAs

To further investigate the evolutionary relationships of the AhGASA gene family, we constructed an intraspecific evolutionary tree of AhGASA genes (Figure 2). According to the evolutionary relationships of genes and protein structural features, cultivated peanut GASA genes can be divided into seven branches. Branches I, II, and VII contained nine AhGASAs; branches III, IV, and V contained two AhGASAs; and branch VI contained seven AhGASAs. In the phylogenetic tree, two genes were clustered together to form gene pairs, forming a total of 14 gene pairs. In each pair, one gene is from the A subgenome and one is from the B subgenome. AhGASA tends to occur in clusters with AdGASA and AiGASA, laterally indicating that A. duranensis and A. ipaensis, as ancestors of tetraploid cultivars, are closely linked in their genetic evolution.

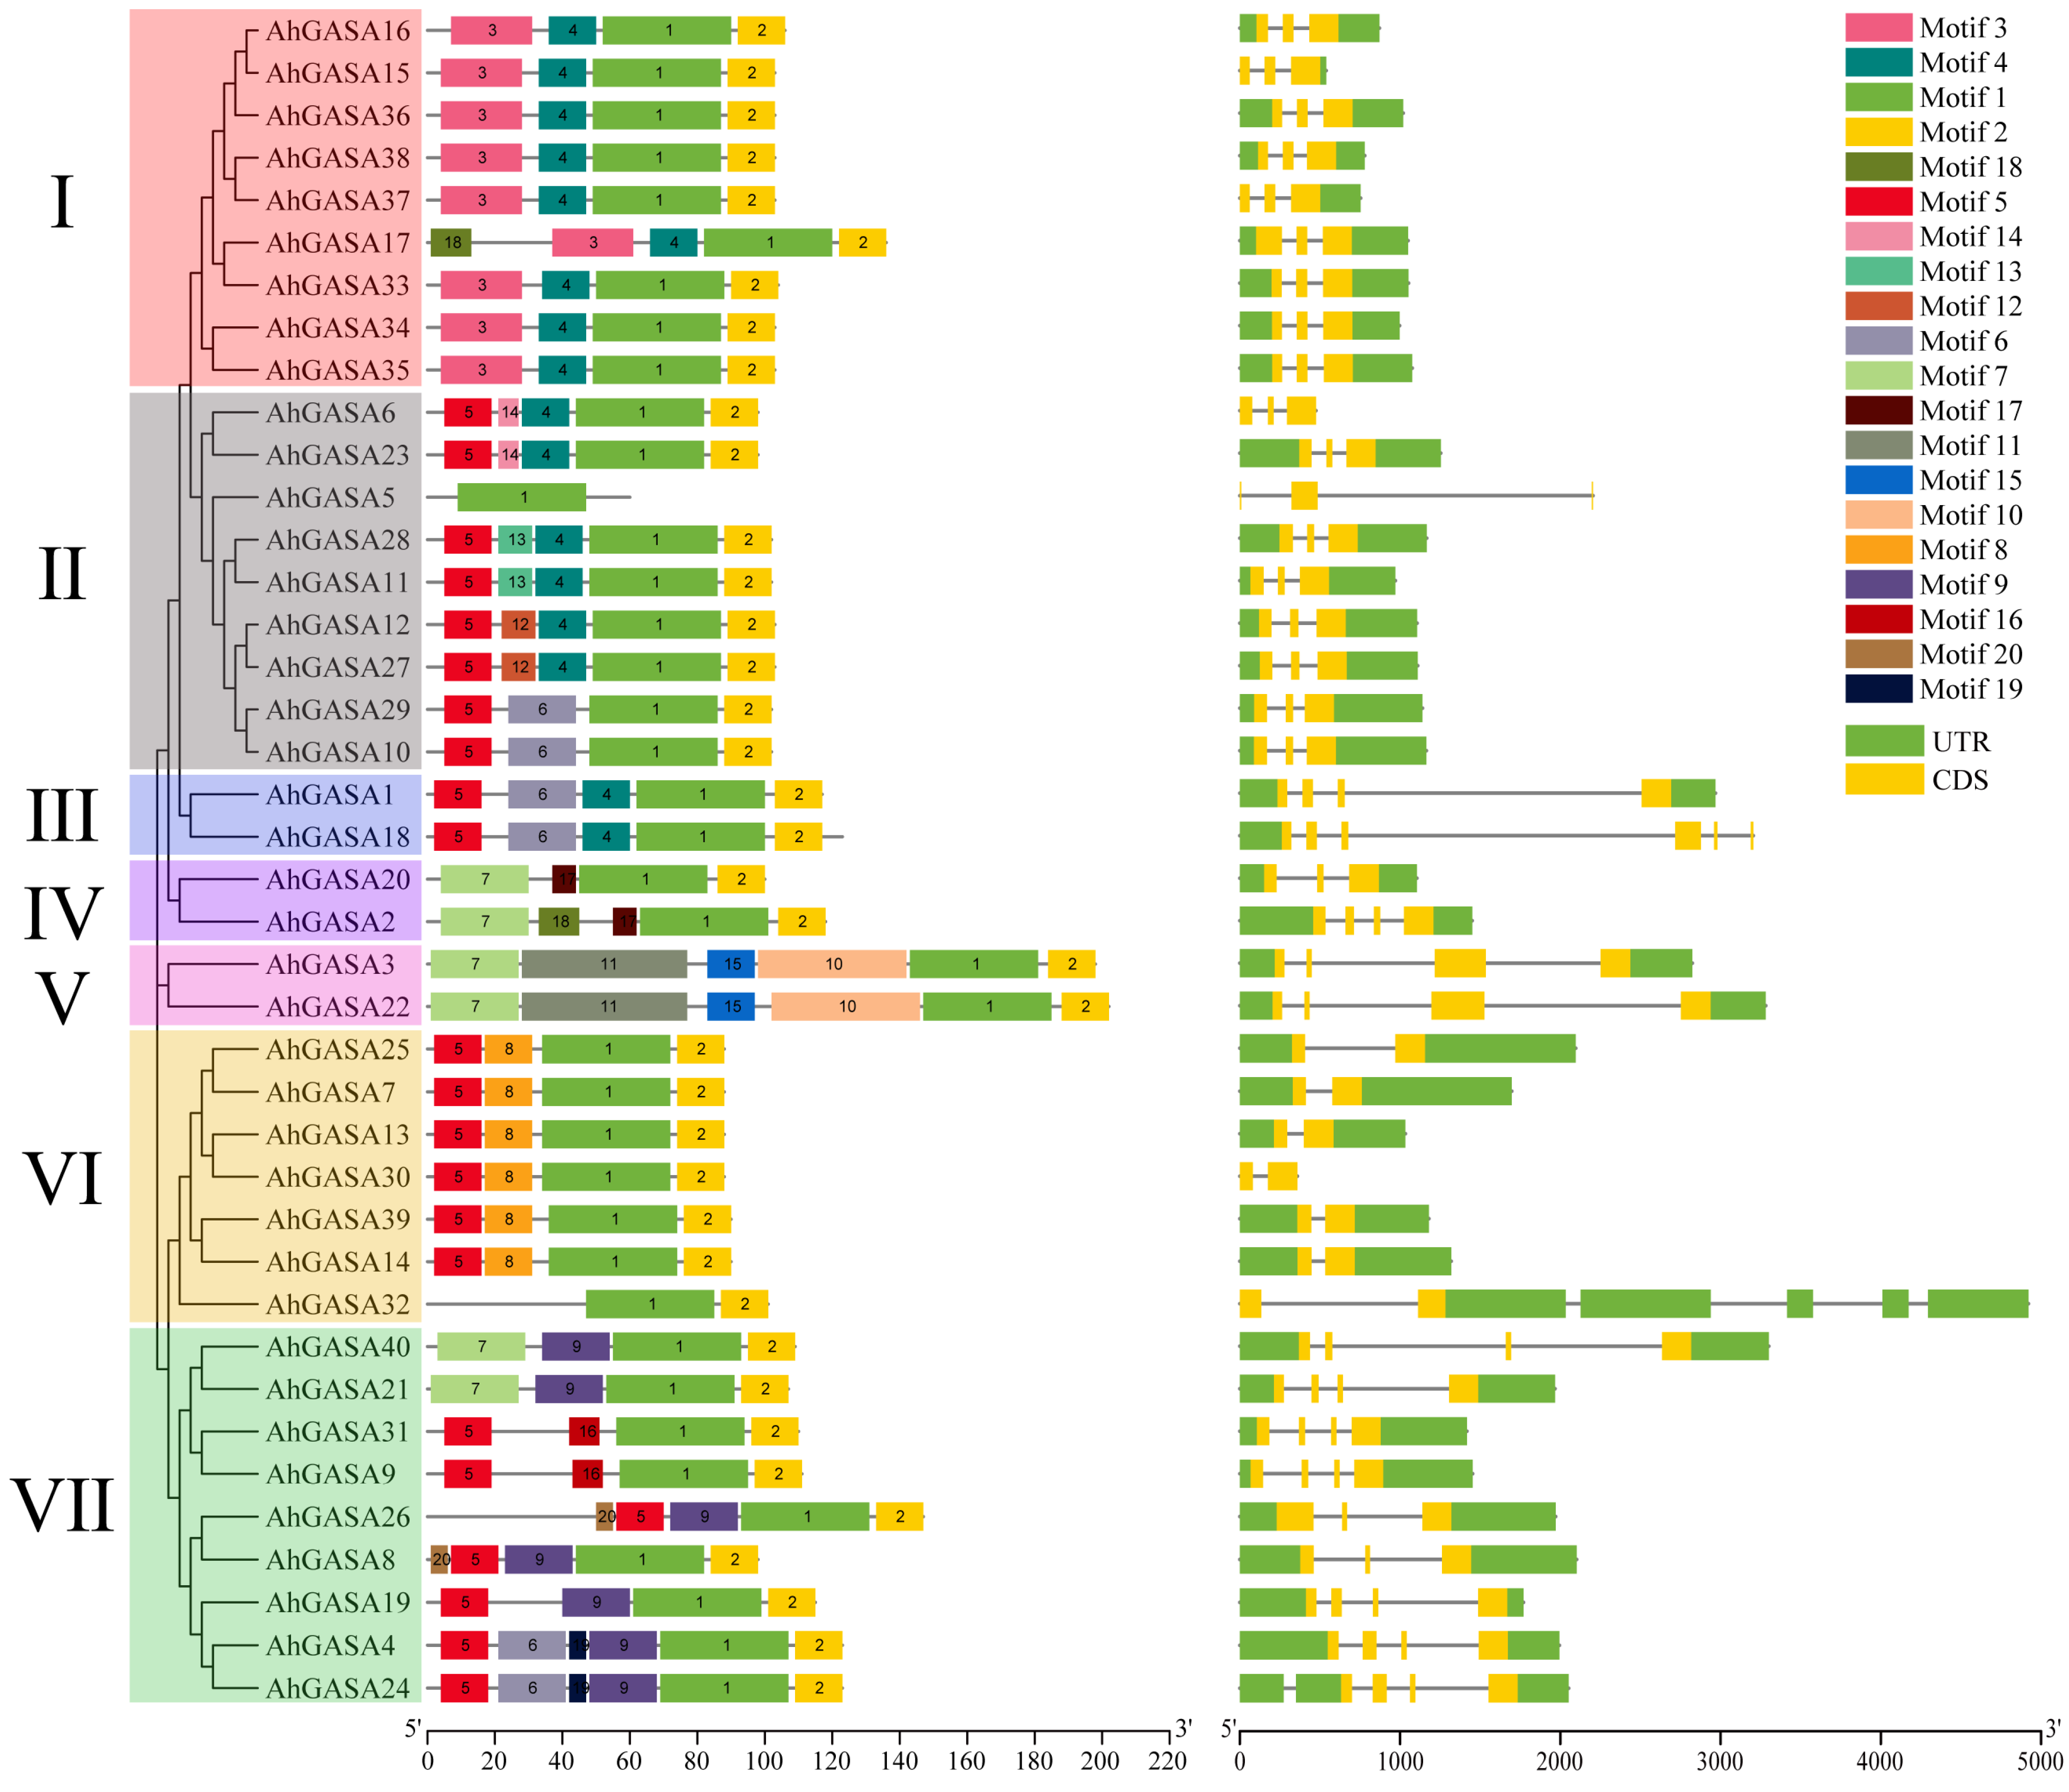
3.3. Correlation Analysis of AhGASA Gene Structure and Motif Composition

To further understand the possible structural evolution of AhGASA, we constructed a phylogenetic tree and analyzed the gene structure and motif association of AhGASA members. For clear labeling, each phylogenetic group is shown in a different color (Figure 3). We can see that related genes are grouped in the same set of phylogenetic trees based on the gene structure and phylogenetic tree results. The number of exons of each gene is one to six. In most cases, two genes in the gene pair had similar exon–intron structures and lengths, such as AhGASA34/35 and AhGASA12/27, while some gene pairs differed in structure, such as AhGASA1/18. AhGASA6, AhGASA5, and AhGASA30 which had only one exon. In contrast, AhGASA18 had six exons. The number of exons varied by branch; however, most AhGASA members in the same branch had the same exon–intron structure. On an evolutionary basis, we discovered that the AhGASA gene structure is closely related to phylogeny. The motifs of each protein ranged from 1 to 20. The predicted sequences of AhGASA proteins were mainly concentrated in the C-terminal of GASA proteins. In addition, two genes in most gene pairs had the same motif composition, which implies that they function similarly at the protein level. Additionally, most AhGASA proteins contained Motif1 and Motif2, a conserved structural domain shared by the AhGASA gene family. Clade I consisted mainly of motifs 1, 2, 3, and 4, and AhGASA17 in branch I also contained motif 16. Clade II consisted mainly of motifs 1, 2, and 5, and also contained motifs 4, 6, 12, 13, and 14, but all had motif 1. Clade III, IV, and V consisted of three gene pairs, and the gene pair motifs were similar in structure; additionally, all contained motifs 1 and 2. Clade VI had a more conservative motif composition, consisting of motifs 1, 2, 5, and 8, and differed only in AhGASA32. Most AhGASA motifs in Clade VII were irregular in composition, and the structure was similar between gene pairs, consisting mainly of motifs 1, 2, 5, and 9. Motifs 3, 5, and 7 were located in the N-terminal of the protein and contained a large amount of the hydrophobic amino acid leucine. Interestingly, the AhGASA5 and AhGASA32 genes differed not only in gene structure from other protein sequences in the same branch, but also in motif composition. It is speculated that it may have undergone mutations during the evolutionary process, resulting in changes in gene structure and function.

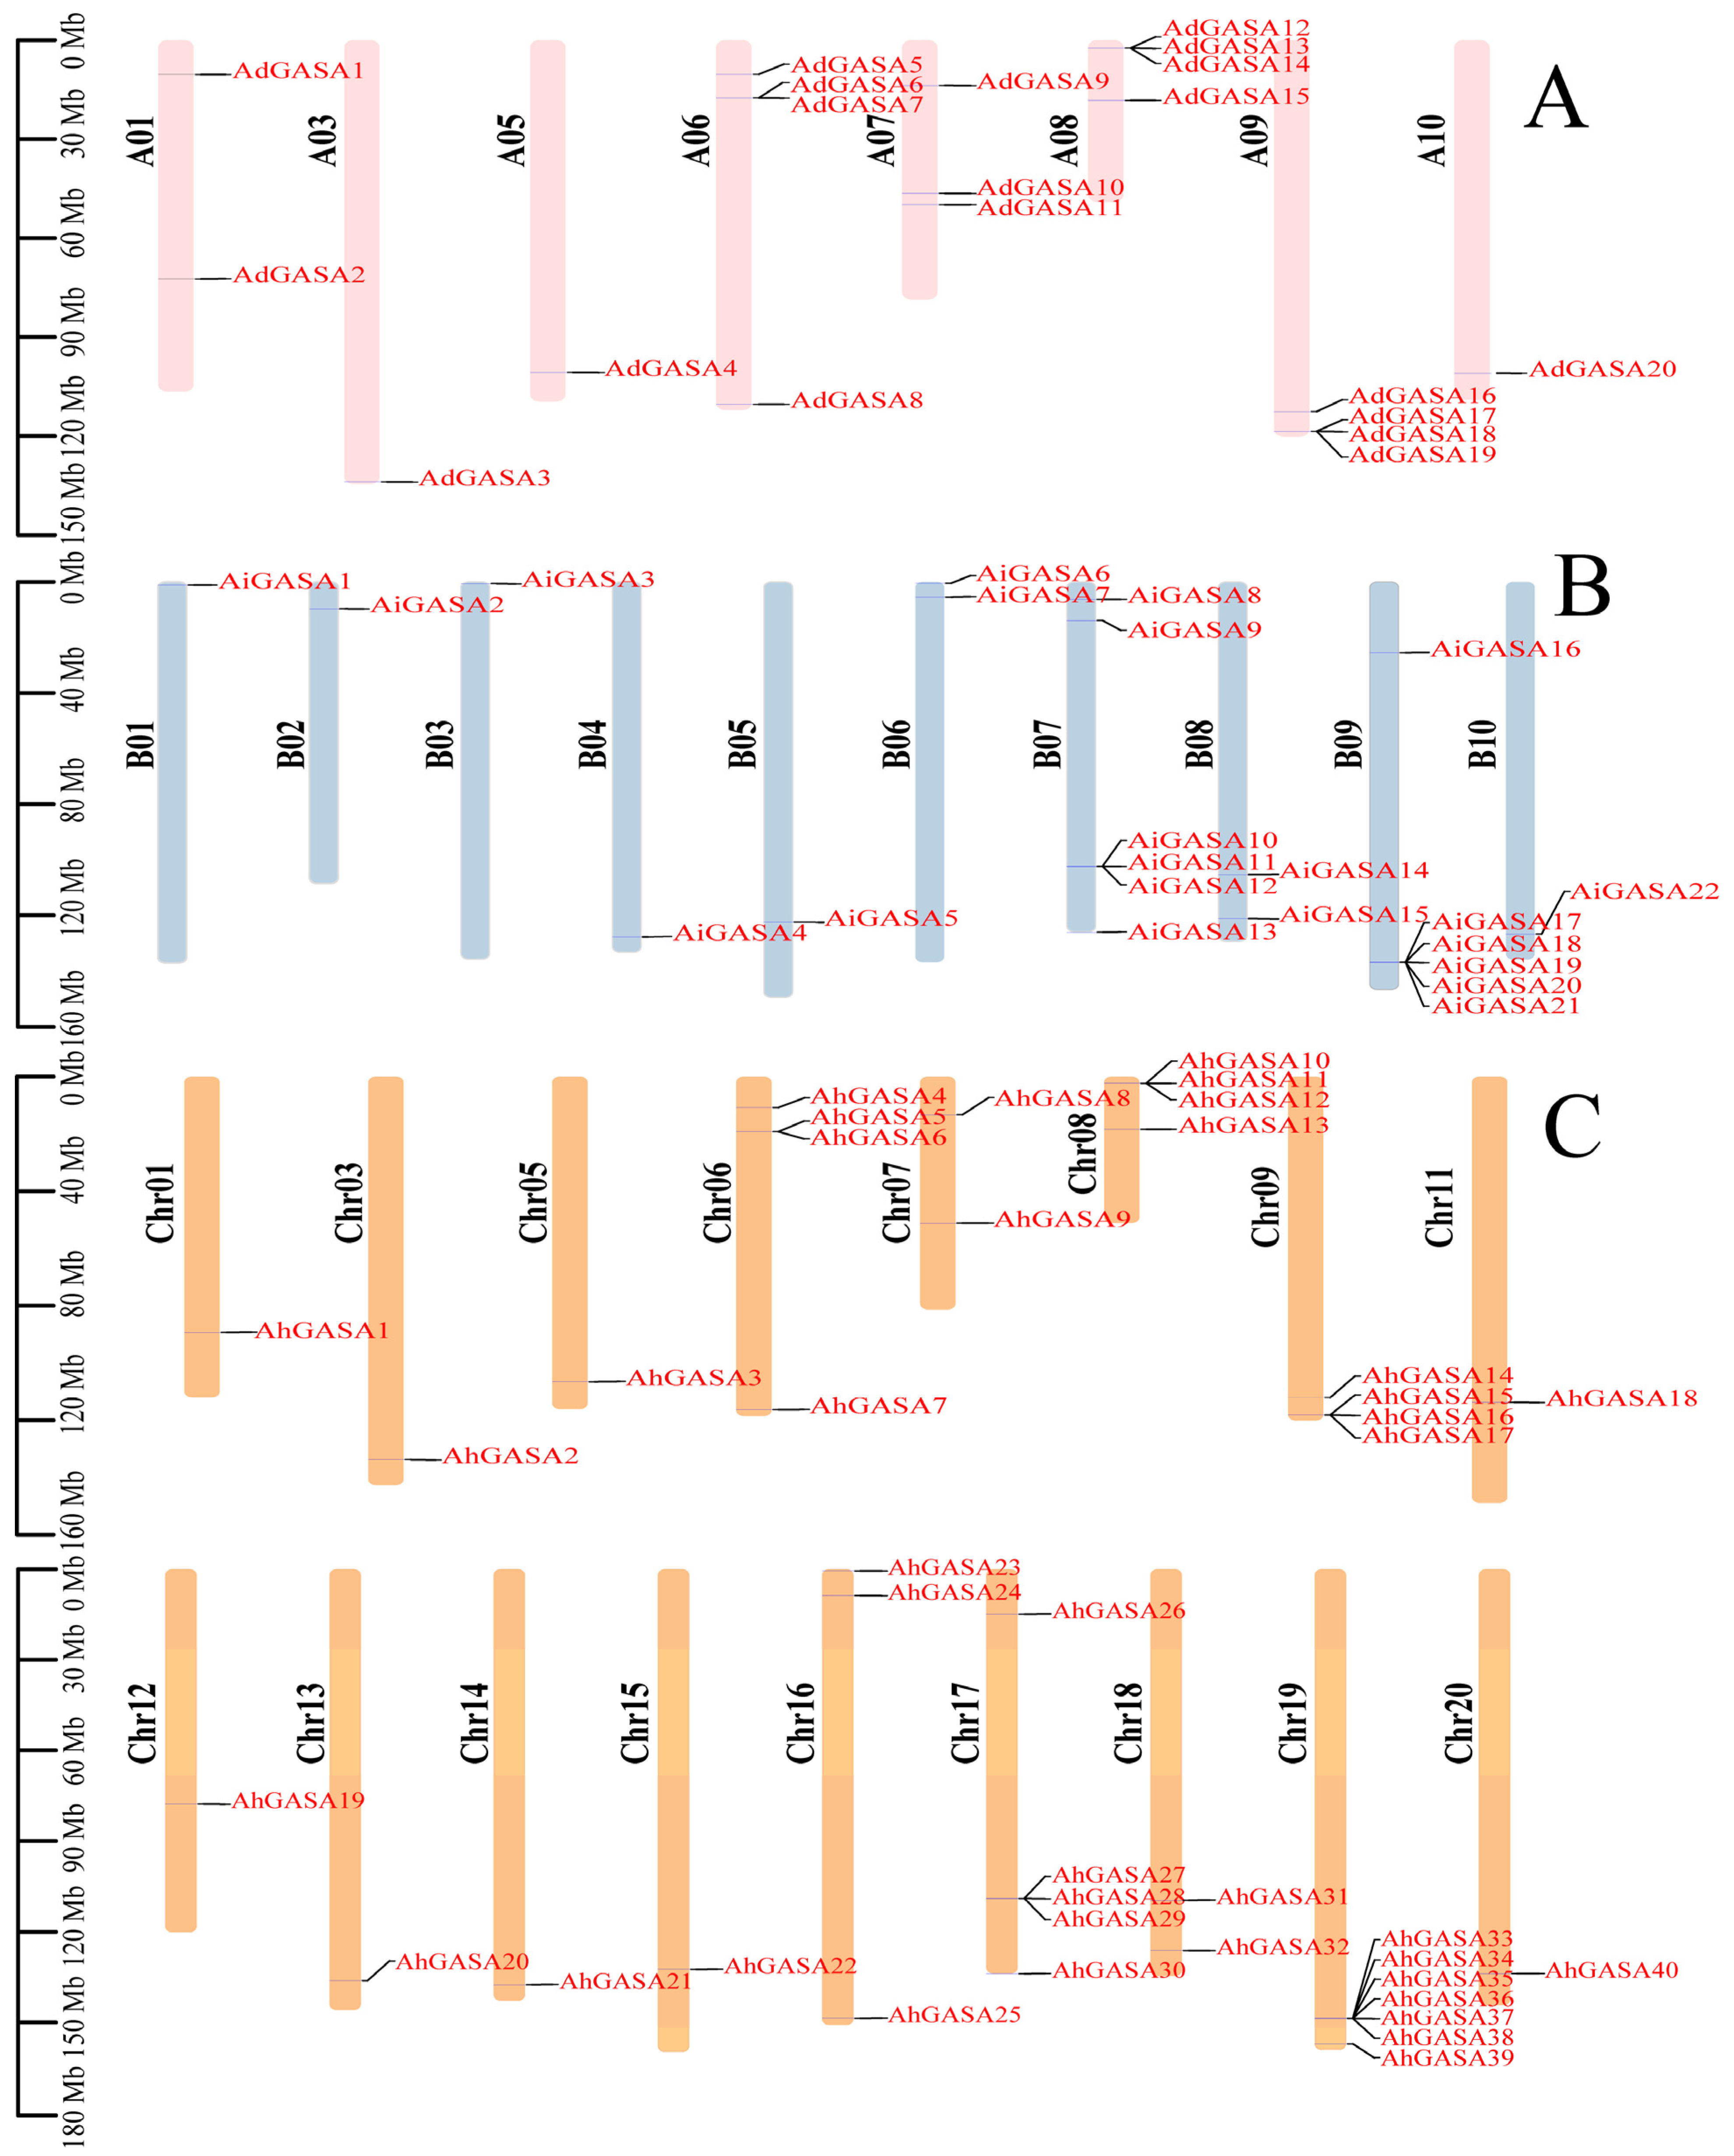
3.4. Chromosome Location and Gene Duplication of GASAs

To investigate the chromosomal distribution and gene duplication of GASA gene family members, we mapped the physical location of these genes on the chromosomes of cultivated peanut versus wild peanuts. The A subgenome of the cultivated peanut is derived from A. duranensis, with 20 genes localized on eight chromosomes and the number of GASA genes on each chromosome ranging from 1 to 4. The absence of GASAs on chromosomes A02 and A04 suggests that gene loss may have contributed to species evolution. A. duranensis had two tandem replications on chromosome A06, three tandem replications on chromosome A08, and three tandem replications on chromosome A09 (Figure 4A). The B subgenome of the cultivated peanut from A. ipaensis, with 22 genes localized on 10 chromosomes, was unevenly distributed, with the number of GASA genes on each chromosome ranging from 1 to 6. A. ipaensis had three tandem replications on chromosome B07 and five tandem replications on chromosome B09 (Figure 4B).
Tandem and segmental replication contribute to the generation of gene families during evolution. In A. hypogaea L., 40 genes were localized on 17 chromosomes, with the number of AhGASA genes on each chromosome in the range of 1–7, 17 genes in the A subgenome, and 23 genes in the B subgenome. The amount of GASA in the A/B subgenome varied, as did the placement of genes on the chromosomes. Interestingly, the majority of members were scattered on both chromosomal ends. Chromosomes chr02, chr04, and chr10 had no AhGASA (Figure 4C). Chromosomes chr03/A03, chr05/A05, chr06/A06, chr08/A08, chr09/A09, chr11/B01, chr12/B02, chr13/B03, chr14/B04, chr15/B05, chr18/B08, and chr20/B10 had the same number of genes, while the number of genes on the other A/B chromosomes differed, probably due to duplication or loss of GASA members during evolution. Similar to the wild diploid ancestor, tandem duplications occurred on chr06, chr08, chr09, chr17, and chr19, and a total of 17 tandem duplicated genes were found, forming five gene clusters and corresponding to physical locations on the chromosomes.

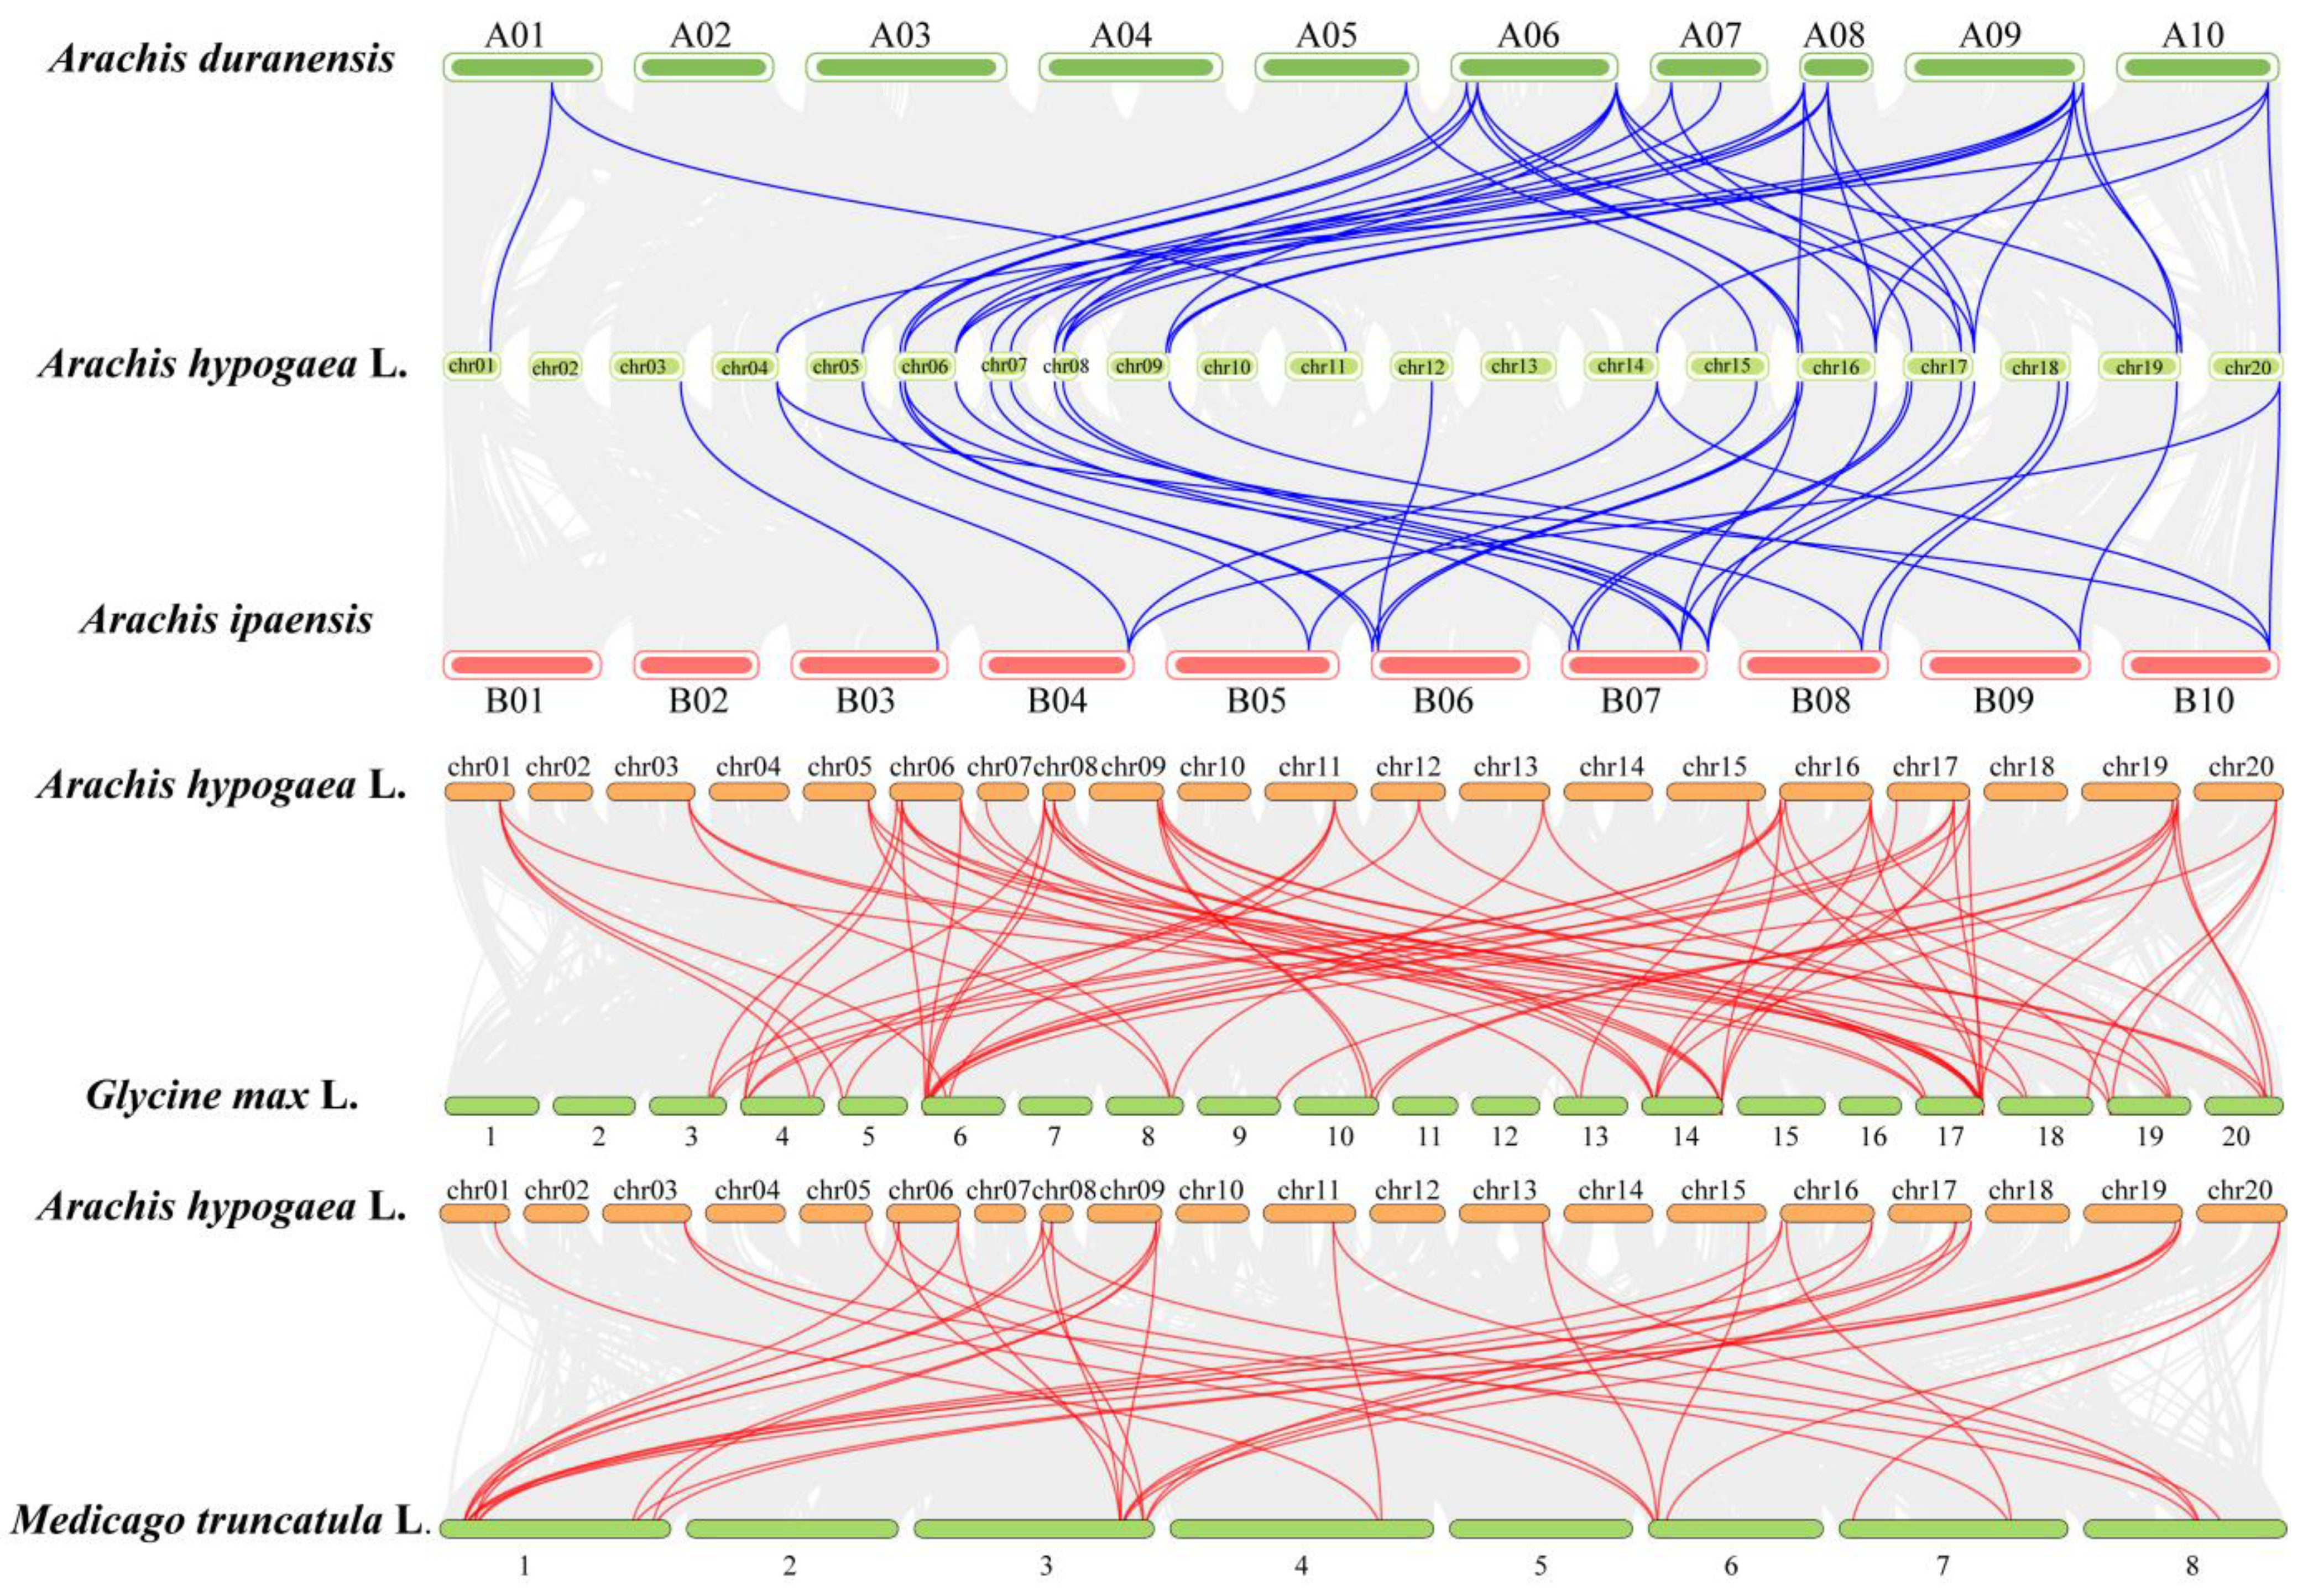
3.5. Duplication Events of GASAs and Collinearity Analysis

In plant species, the expansion and evolution of gene families is significantly influenced by the occurrence of gene duplication events, also known as segmentation or crosstalk. The majority of plants have experienced ancient whole-genome duplication events or polyploidy, and whole-genome duplication results in duplicated regions in which all genes are often reproduced on a vast scale, as opposed to single genes or multiple genes. Large-scale whole-genome duplication (WGD) and small-scale tandem and fragmental duplication between species can be identified from co-linear fragments and can be used as data for tree species inference. Homology analysis of GASA genes between the cultivated peanut and wild peanut (A. hypogaea L., A. duranensis, and A. ipaensis) was performed to visualize the locus relationships of the three peanut GASA genes (Figure 5).
Comparing the peanut genome and the A/B subgenome, a total of 69 linear/parallel homologous gene pairs were identified, and the number of common linear gene pairs between A. duranensis and A. ipaensis was 39 and 30, respectively (Table S3). As shown in Figure 5, the co-linear gene pairs between A. hypogaea L. and A. duranensis were unevenly distributed on all 20 chromosomes, and there were no co-linear gene pairs on chromosomes A02, A03, and A04. In addition, the number of co-linear gene pairs between peanut and A. ipaensis was smaller than that of A. hypogaea and A. duranensis, and no co-linear gene pairs were seen on chromosomes B01 and B02. The covariance results indicated the presence of several highly conserved loci in the A and B subgenomes of tetraploid cultivated peanut, which also resulted from the cross between two tetraploids and two diploids. In addition, comparative synteny analysis was performed between A. hypogaea L., M. truncatula L., and Glycine max L. in order to define the evolutionary trend of GASA genes in legume species. A total of 72 (Table S4) and 38 (Table S5) homologous gene pairs were identified in A. hypogaea L., Medicago truncatula L., and Glycine max L.

3.6. Analysis of Cis-Acting Elements in AhGASA Promoters

Promoters can regulate the onset and level of gene expression by interacting with transcription factors. Cis-acting elements are found in the gene’s promoter region and can be used as a guide for tissue specificity and stress response in various situations. Therefore, the analysis of the AhGASA promoter region can help to explore the potential functions of the gene. To explore the role played by gibberellin in peanut growth and development, we analyzed the cis-acting elements in the upstream sequence of the promoter. Cis-acting elements play an important role in developmental regulation. Members of the GASA gene family respond primarily to light and, to a lesser extent, to gibberellin. These promoters also contain hormone-response components for low temperature, defense, and stress, in addition to response components for abscisic acid, growth hormone, methyl jasmonate, and salicylic acid, which are connected to plant growth and development. The results show that a large number of cis-acting elements were detected in the promoter region, and 22 cis-acting elements associated with phytohormones, light response, tissue-specific expression, and abiotic stresses were selected for further analysis (Table S6 and Figure 6A,C). It is worth noting that the cis-acting elements associated with plant hormones are the cis-acting element involved in the abscisic acid responsiveness, cis-acting element involved in salicylic acid responsiveness, cis-acting element involved in gibberellin-responsiveness, and cis-acting regulatory element involved in auxin responsiveness, etc. AhGASA, as gibberellin-stimulating proteins, is a class of cysteine-rich polypeptides that play a role in gibberellin regulation and interact with other plant hormones.
More than half of the hormone receptor genes had abscisic acid response elements, 15 genes contained growth hormone response elements, 13 contained gibberellin response elements, and 18 contained salicylic acid response elements. It has been shown that the gibberellin MYB protein is a positive regulator of the gibberellin signaling cascade response, as we found in the AhGASA promoter region that MYB binding site, involved in drought-inducibility, the MYB binding site, involved in flavonoid biosynthetic genes regulation, and the MYB binding site, involved in light responsiveness, consistent with previous studies. There are three elements associated with light response and more than half of the genes are involved in light response elements. The cis-acting elements associated with tissue specificity are: cis-acting regulatory element involved in seed-specific regulation, cis-regulatory element involved in endosperm expression and cis-regulatory element involved in endosperm expression. AhGASA20, AhGASA2, and AhGASA39 were found to contain cis-acting regulatory elements involved in seed-specific regulation, with AhGASA20 and AhGASA2 in the same gene pair on the evolutionary tree. It is noteworthy that the AhGASA gene family plays a significant role in controlling the growth and development of peanut pods, which will be further explained by gene expression levels. Furthermore, abiotic stress response elements include defense- and stress-response elements, injury-response elements, drought-induced elements, and low-temperature response elements. The cis-acting elements associated with abiotic stress are: cis-acting element involved in low-temperature responsiveness, MYB binding site involved in drought-inducibility and cis-acting element involved in defense and stress responsiveness.

3.7. Expression Analysis of AhGASAs under Different Developmental Stages of Peanut Pod Using RNA-seq

Currently, the expression pattern of the GASA gene family in seeds is relatively clear in Arabidopsis, but the expression of the AhGASA gene family in peanut pods is unknown. To determine the expression of FPKM of the AhGASA gene family at each developmental pod stage (early, middle, and mid-late stages) and construct a gene expression heat map (Figure 6B,D), we used the large-fruited variety YH15 and the small-fruited variety W1202, which have different phenotypes of pod and seed size, length, and width, as well as the long-grained extreme family S181523 and the short-grained extreme family S181517 in the RIL population (obtained by crossing them) to perform a comparative transcriptome analysis. To exclude the interference caused by background noise during the analysis, the DEGs obtained by comparing both S181523 and S181517 with those obtained by comparing both YH15 and W1202 at the same period of down-regulated DEGs were taken as intersection sets, and 1788, 763, 827, 325, and 457 differentially expressed genes (DEGs) were obtained at shell-35, shell45, pod-25, seed35, and seed45 periods, respectively. Among them, arahy.V4B8PK (AhGASA7), arahy.VES4LD (AhGASA25), arahy.F1TUFL (AhGASA40), arahy.FJ610L (AhGASA21), and arahy.VJ6NUA (AhGASA31) of the AhGASA gene family were included.
Further analysis of the expression patterns of the 40 AhGASAs gene families revealed that 14 genes were not expressed at all time points, suggesting that they may be pseudogenes or not expressed in pod organ development. Excluding the 14 unexpressed genes, most of the 26 genes were expressed at the highest level at the Pod-25. Among them, during the Pod-25 period, the expression of large-grain genes in AhGASA6, AhGASA4, AhGASA23, AhGASA24, AhGASA26, and AhGASA8 was lower than that of the small-grain type, while the expression patterns of AhGASA18, AhGASA1, AhGASA14, and AhGASA7 showed the opposite trend. During seed maturation, the expression of the AhGASA gene family as a whole tended to decline. Among them, the expression of genes in AhGASA18, AhGASA1, AhGASA14, AhGASA7 and AhGASA2 was higher in the large- than the small-grain type, while AhGASA6 and AhGASA23 showed the opposite trend. Similar to the seed tissue development pattern, the AhGASA gene family had a declining tendency in expression from the shell-35 to the shell-45 period. Except for AhGASA5, gene expression was higher in the large- than in the small-grain type, especially AhGASA1, AhGASA6 and AhGASA18. The KEGG enrichment results show that 16 AhGASA genes were significantly enriched to metabolic pathways (ko01100), and 12 genes were significantly enriched in the Glycosylphosphatidylinositol (GPI)-anchor biosynthesis (ko00563) pathway (Table S7).

3.8. Expression Analysis of AhGASAs under Different Developmental Stages of Peanut Pod Using RNA-seq

For a better understanding of the possible regulatory roles of the AhGASA family genes in the peanut regulation of pod growth, seven representative genes from YH15, W1202, S181523, and S181517 were selected to verify whether their expression levels could be induced under different materials and developmental stages by RT-qPCR. The PCR expressions were consistent with the RNA-seq data (Figure 7). The results of the RT-qPCR analysis validated the findings obtained from the RNA-seq data.

4. Discussion

GASA genes play an important role in a variety of physiological and developmental processes in plants, including seed formation, floral organ development, phytohormone signaling, stress response, and pathogen defense [43]. Notably, the members of the GASA gene family have a variety of crucial roles in the growth and development of plants seed. For example, the overexpression of the AtGASA4 gene increases seed size in Arabidopsis [1], TaGASR7 has been associated with grain length in wheat [15], and OsGASA was shown to increase grain size and length in rice [7]. In bioinformatic analyses of the GASA gene family, changes in expression patterns at various seed developmental stages have received little attention. Such changes have only been investigated in grapes and have not been documented in peanut or oilseed crops. To address peanut yield enhancement, it is necessary to increase peanut yields, as seed size is a key agronomic feature and a key factor influencing output. We conducted systematic bioinformatics to thoroughly investigate and track GASA gene family characterization, intergenic evolution, and tissue-specific transcriptomic changes in pod development in light of the significance of the GASA gene family to plant growth and development. The genomes of Wild diploidx [44] and cultivated allotetraploid species [26,27,45] have been published, providing more accurate data for the whole-genome analysis of peanut gene family.

4.1. Genome-Wide Identification and Characteristics of GASA Gene Families in Cultivated Species

Based on the BLASTP search method, we identified 40 GASA genes in cultivated peanut using the Arabidopsis GASA gene as a query; the number of AhGASA genes was higher than the wild species ancestral species AdGASA and AiGASA and higher than GmGASA, OsGASA, VvGASA, PtGASA, GhGASA, MdGASA, and StGASA [7,9,10,11,13,46]. A conservative sequence analysis confirmed that the identified AhGASA contained 12 cysteine residues at the C-terminus (Figure 3) [5,16,47].
This study examined the many properties of the GASA protein family, including molecular weight, isoelectric point, and number of exons and introns. Low-molecular-weight proteins were found in the newly discovered AhGASA genes, supporting previous investigations that have shown that GASA genes can produce proteins with reduced molecular weights. The C-terminal region of conserved amino acid sequences keeps all 12 cysteine residues which are essential to changing their protein structure and biological function. This led us to hypothesize that redox-active cysteines significantly influence how well GASA proteins protect against reactive oxygen species [48,49]. The AhGASA protein was discovered to have a comparable structure and motif (motif 1), which is in line with earlier discoveries about GmGASA and GhGASA. Further investigation revealed that most genes belonging to the same group share the same exon–intron composition, indicating a connection between the genetic makeup of the GASA domain and its evolutionary history. It was shown that 40 AhGASA genes were present on 17 A. hypogaea chromosomes (Figure 4C), while no copies of any AhGASA genes were present on three A. hypogaea chromosomes, Chr02, Chr04, and Chr10. Similar results were reported in Malus domestica, Glycine max, rice, Vitis vinifera L., Populus trichocarpa, and cotton, with the irregular allocation of GASA genes.

4.2. Evolutionary and Syntenic Relationships among GASA Genes

The phylogenetic and covariance relationships among GASA genes were analyzed. First, we constructed a phylogenetic tree of GASA protein sequences in the cultivated peanut (Figure 2). The GASA gene family in cotton, Populus trichocarpa, Grapevine, rice, Glycine max, and Malus domestica was divided into three subgroups, and we performed a more detailed division of the identified AhGASA genes into seven subgroups (I~VII) based on the phylogenetic analysis of the GASA genes. On an evolutionary basis, we discovered that the AhGASA gene structure is closely related to phylogeny. The two genes that make up the majority of gene pairs were shown to share the same motif composition, which suggests that their functions at the protein level are comparable. In addition, the majority of AhGASA proteins had the conserved structural domains Motif1 and Motif2, which are shared by all members of the AhGASA gene family. There is a possibility that the specific functions of the AhGASA gene family can be deduced from the conserved nature of the genes that make up each branch of the AhGASA gene family.
Changes in gene amplification may be caused by functional variety, and the discovery and characterization of new genes, which, in turn, may trigger evolutionary processes. However, evolutionary diversity among groups may not always represent functional differences. In rice, OsGASA4 and OsGASA6 are clustered into different subgroups, although they have similar physiological functions such as GA induction and ABA and SA repression [7]. The same has been found in strawberry, where FaGAST1 and FaGAST2 have different expression patterns but similar physiological functions, although they belong to different branches of the developmental tree [50]. However, gene function in the AhGASA gene family is associated with phylogenetic diversity. For example, AhGASA4, AhGASA9, and AhGASA31, which belong to the same branch in the developmental evolutionary tree, are jointly annotated to AtGASA6, whose overexpression advances flowering time in Arabidopsis and whose expression is positively regulated by growth hormone, BR, cytokinin, and GA and negatively regulated by ABA [51]. AhGASA3, AhGASA20, and AhGASA22 are jointly annotated to AtGASA14, which exert the same biological function by regulating ROS accumulation to regulate leaf expansion and abiotic stress resistance [14]. Thus, we discovered that clusters of AhGASA genes in the same branch may have some homology in evolutionary processes and specific functional associations; phylogenetic diversity does not always imply functional differences, and closely related individuals of AhGASA genes in branches of the evolutionary tree may have a common ancestor. According to the data provided by chromosomal localization, the origin of A. duranensis and A. ipaensis as cultivated peanut is extremely similar to that of A. hypogaea L. Moreover, tandem duplication was an important factor in the expansion of the AhGASA gene family, and 17 tandem duplicated genes were identified.

4.3. AhGASA Gene Expression Profiles and Potential Functions

It has been demonstrated that the GASA gene family, which is controlled by gibberellin, participates in the phytohormone signaling process, as well as being engaged in the regulation of growth and development [1,2,3]. Plant hormones such as BR, growth hormone, and abscisic acid, in addition to gibberellin, also control the expression of the GASA gene, indicating that this gene family may be heavily involved in controlling plant hormone signal transduction networks.
Based on transcriptome sequencing data and RT-qPCR results, we investigated the expression patterns of the AhGASA gene family in the large-grain peanut variety YH15 and the small-grain peanut W1202, and the extreme families S181523 and S181517 in the RIL population constructed with both as parents, at different developmental stages [52]. The RT-qPCR and transcriptome sequencing data showed slight differences in expression levels, but the results were largely in agreement (Figure 7). The expression of the AhGASA gene family in branch I was small at all periods of peanut pod development, implying that it does not play an important function in pod development. However, the expression patterns of AhGASA6, AhGASA23, and AhGASA5 are still worth discussing. AhGASA6, AhGASA23, and AhGASA5 are genetically evolutionarily related, with expression rising and then falling during seed development and gradually rising during shell development, annotated to AtGASA1 and AtGASA11, respectively. It has been shown that GASA1 is responsible for seed size in the development of almond seeds [33], and GASA11 are highly expressed during all stages of seed development in seeded cultivars compared to seedless cultivars [11]. Interestingly, the expression of AhGASA1 and AhGASA18 in branch III was higher in the large-grain than in the small-grain peanut at all periods of pod development, presumably playing an important role in pod development. Both AhGASA1 and AhGASA18 were annotated to the gibberellin-stimulated-like protein SN2 (snakin-2) gene, which plays a regulatory role in tuber shoot growth by regulating lignin biosynthesis and peroxide accumulation; however, a role in legume seed development has not been reported. The expression patterns of AhGASA2 and AhGASA20 in branch IV differed widely, i.e., AhGASA2 expression gradually increased with seed development and was higher in the large-grain than in the small-grain peanut at the seed-35 and seed-45 periods. The expression of most genes in branch VI increased and then decreased from the pod-25 to the seed-35 periods, differing by a gradual decrease in expression during shell development. Looking at branch seven revealed that similar evolutionary tree branches had similar expression patterns. For example, AhGASA8 and AhGASA26, which are expressed at higher levels during the pod-25 period and are significantly more expressed in large-grain material than in small-grain material during shell development, were annotated to RSI-1, which is a member of the GASA gene family that includes regulators involved in cell and organ elongation; RSI-1 has been identified as a regulator of lateral root development [53]. The expression of AhGASA4 and AhGASA24 rises with seed maturation and gradually decreases with hull development. The cis-elements present in the respective promoters of the AhGASA genes were investigated in order to further investigate whether the expression of AhGASA genes is controlled by a variety of hormones or signals. We found that the majority of GASA promoters featured hormone-responsive elements that are commonly connected with plant growth and development. These elements may be involved in the complex regulatory mechanisms that regulate gene expression.

5. Conclusions

A total of 40 AhGASA, 20 AdGASA, and 22 AiGASA genes were discovered, and AhGASA genes were shown to contain a conserved GASA structural domain. Most AhGASA proteins are stable, have similar physical and chemical properties, and have a protein tertiary structure consisting of an α-helix and random coils. According to our phylogenetic analysis, AhGASA genes can be divided into seven classes, with each containing 14 gene pairs from the A/B subgenome. Through gene structure and evolutionary research, tandem duplication was identified as a crucial element in the expansion of the GASA gene family. AhGASA is dispersed unevenly over 20 chromosomes containing 17 tandem duplication genes. An analysis of cis-acting elements indicated that the AhGASA protein is crucial for hormone regulation. In addition, in materials with different size traits at various stages of peanut pod development, transcriptomics and RT-qPCR analyses revealed that AhGASA genes are expressed at various levels and are tissue-specific. Overall, the whole genome-wide level discovery of the GASA gene in cultivated- and wild-peanut provides comprehensive information for future studies. The data presented in this paper may contribute to our understanding of the molecular mechanisms of GASA in peanut and other oilseed crops and help to elucidate the key role it plays in pod development, an important trait.

Supplementary Materials

The following supporting information can be downloaded at: https://www.mdpi.com/article/10.3390/agronomy12123067/s1. Figure S1: Sequence logo analysis of the conserved AhGASA domains. Each stack represents their amino acids. Table S1: RT-qPCR primers for validation of RNA-Seq data. Table S2: The physical properties of AhGASA genes, including Gene_ID, sequences, theoretical pI, molecular weight, length, instability index, aliphatic index, grand average of hydropathicity, and subcellular localization. Table S3: The common linear gene pairs between A. duranensis and A. ipaensis. Table S4: The common linear gene pairs between A. hypogaea L., and Glycine max L. Table S5: The common linear gene pairs between A. hypogaea L., and M. truncatula L. Table S6: There are 21 cis-acting elements linked to phytohormones, light response, and tissue-specific expression. Table S7: Results of the KEGG enrichment analysis.

Author Contributions

Formal analysis, Y.W., Z.S. and F.Q.; Data curation, Y.W. and Z.S.; validation, Y.W. and M.Z.; writing—original draft preparation, Y.W.; writing—review and editing, W.D. and B.H.; supervision, Z.Z. and X.Z. All authors have read and agreed to the published version of the manuscript.

Funding

This study was supported by the Shennong Seed Industry Laboratory First-class Subject Project (SN01-2022-03), the National Key R&D Program Project (2022YFD1200400), the Special Project for National Supercomputing Zhengzhou Center Innovation Ecosystem Construction (201400210600), Major Science and Technology Projects of Henan Province (201300111000), China Agriculture Research System (CARS-13), Henan Provincial Agriculture Research System, China (S2012-5), and Henan Provincial R&D Projects of Inter-regional Cooperation for Local Scientific and Technological Development Guided by Central Government (YDZX20214100004191).

Data Availability Statement

Not applicable.

Conflicts of Interest

The authors declare that the research was conducted in the absence of any commercial or financial relationships that could be construed as a potential conflict of interest.

References

  1. Roxrud, I.; Lid, S.E.; Fletcher, J.C.; Schmidt, E.D.L.; Opsahl-Sorteberg, H.G. GASA4, One of the 14-Member Arabidopsis GASA Family of Small Polypeptides, Regulates Flowering and Seed Development. Plant Cell Physiol. 2007, 48, 471–483. [Google Scholar] [CrossRef] [PubMed]
  2. Trapalis, M.; Li, S.F.; Parish, R.W. The Arabidopsis GASA10 gene encodes a cell wall protein strongly expressed in developing anthers and seeds. Plant Sci. 2017, 260, 71–79. [Google Scholar] [CrossRef] [PubMed]
  3. Fan, S.; Zhang, D.; Zhang, L.; Gao, C.; Xin, M.; Tahir, M.M.; Li, Y.; Ma, J.; Han, M. Comprehensive analysis of GASA family members in the Malus domestica genome: Identification, characterization, and their expressions in response to apple flower induction. BMC Genom. 2017, 18, 827. [Google Scholar] [CrossRef] [PubMed]
  4. Shi, L.; Gast, R.T.; Gopalraj, M.; Olszewski, N.E. Characterization of a shoot-specific, GA3- and ABA-regulated gene from tomato. Plant J. 1992, 2, 153–159. [Google Scholar] [PubMed]
  5. Aubert, D.; Chevillard, M.; Dorne, A.M.; Arlaud, G.; Herzog, M. Expression patterns of GASA genes in Arabidopsis thaliana: The GASA4 gene is up-regulated by gibberellins in meristematic regions. Plant Mol. Biol. 1998, 36, 871–883. [Google Scholar] [CrossRef]
  6. Hou, D.; Bai, Q.; Li, J.; Xie, L.; Li, X.; Cheng, Z.; Gao, J. The Gibberellic Acid-Stimulated Transcript Gene Family in Moso Bamboo: A Genome-Wide Survey and Expression Profiling During Development and Abiotic Stresses. J. Plant Growth Regul. 2018, 37, 1135–1147. [Google Scholar] [CrossRef]
  7. Muhammad, I.; Li, W.; Jing, X.; Zhou, M.; Shalmani, A.; Ali, M.; Wei, X.; Sharif, R.; Liu, W.; Chen, K. A systematic in silico prediction of gibberellic acid stimulated GASA family members: A novel small peptide contributes to floral architecture and transcriptomic changes induced by external stimuli in rice. J. Plant Physiol. 2019, 234–235, 117–132. [Google Scholar] [CrossRef]
  8. Lü, L.; Chen, X.; Zhang, Y.; Liu, Q.; Wang, L.; Ma, L.; Li, H. Bioinformatics Identification of GASA Gene Family Expression Profiles in Wheat. Crops 2018, 34, 58. [Google Scholar]
  9. Ahmad, M.Z.; Sana, A.; Jamil, A.; Nasir, J.A.; Ahmed, S.; Hameed, M.U.; Abdullah. A genome-wide approach to the comprehensive analysis of GASA gene family in Glycine max. Plant Mol. Biol. 2019, 100, 607–620. [Google Scholar] [CrossRef]
  10. Nahirñak, V.; Rivarola, M.; Gonzalez De Urreta, M.; Paniego, N.; Hopp, H.E.; Almasia, N.I.; Vazquez-Rovere, C. Genome-wide Analysis of the Snakin/GASA Gene Family in Solanum tuberosum cv. Kennebec. Am. J. Potato Res. 2016, 93, 172–188. [Google Scholar] [CrossRef]
  11. Ahmad, B.; Yao, J.; Zhang, S.; Li, X.; Zhang, X.; Yadav, V.; Wang, X. Genome-Wide Characterization and Expression Profiling of GASA Genes during Different Stages of Seed Development in Grapevine (Vitis vinifera L.) Predict Their Involvement in Seed Development. Int. J. Mol. Sci. 2020, 21, 1088. [Google Scholar] [CrossRef] [PubMed]
  12. Filiz, E.; Kurt, F. Antimicrobial peptides Snakin/GASA gene family in sorghum (Sorghum bicolor): Genome-wide identification and bioinformatics analyses. Gene Rep. 2020, 20, 100766. [Google Scholar] [CrossRef]
  13. Qiao, K.; Ma, C.; Lv, J.; Zhang, C.; Ma, Q.; Fan, S. Identification, characterization, and expression profiles of the GASA genes in cotton. J. Cotton Res. 2021, 4, 7. [Google Scholar] [CrossRef]
  14. Sun, S.; Wang, H.; Yu, H.; Zhong, C.; Zhang, X.; Peng, J.; Wang, X. GASA14 regulates leaf expansion and abiotic stress resistance by modulating reactive oxygen species accumulation. J. Exp. Bot. 2013, 64, 1637–1647. [Google Scholar] [CrossRef] [Green Version]
  15. Dong, L.; Wang, F.; Liu, T.; Dong, Z.; Li, A.; Jing, R.; Mao, L.; Li, Y.; Liu, X.; Zhang, K.; et al. Natural variation of TaGASR7-A1 affects grain length in common wheat under multiple cultivation conditions. Mol. Breed. 2014, 34, 937–947. [Google Scholar] [CrossRef]
  16. Zhang, S.; Wang, X. Expression pattern of GASA, downstream genes of DELLA, in Arabidopsis. Sci. Bull. 2008, 53, 3839–3846. [Google Scholar] [CrossRef] [Green Version]
  17. Li, K.; Bai, X.; Li, Y.; Cai, H.; Ji, W.; Tang, L.; Wen, Y.; Zhu, Y. GsGASA1 mediated root growth inhibition in response to chronic cold stress is marked by the accumulation of DELLAs. J. Plant Physiol. 2011, 168, 2153–2160. [Google Scholar] [CrossRef]
  18. Furukawa, T.; Sakaguchi, N.; Shimada, H. Two OsGASR genes, rice GAST homologue genes that are abundant in proliferating tissues, show different expression patterns in developing panicles. Genes Genet. Syst. 2006, 81, 171–180. [Google Scholar] [CrossRef] [Green Version]
  19. Li, N.; Xu, R.; Li, Y. Molecular Networks of Seed Size Control in Plants. Annu. Rev. Plant Biol. 2019, 70, 435–463. [Google Scholar] [CrossRef]
  20. Shu, K.; Liu, X.D.; Xie, Q.; He, Z.H. Two Faces of One Seed: Hormonal Regulation of Dormancy and Germination. Mol. Plant. 2016, 9, 34–45. [Google Scholar] [CrossRef] [Green Version]
  21. Nohales, M.A.; Kay, S.A. GIGANTEA gates gibberellin signaling through stabilization of the DELLA proteins in Arabidopsis. Proc. Natl. Acad. Sci. USA 2019, 116, 21893–21899. [Google Scholar] [CrossRef] [PubMed]
  22. Pimenta Lange, M.J.; Lange, T. Gibberellin Biosynthesis and the Regulation of Plant Development. Plant Biol. 2006, 8, 281–290. [Google Scholar] [CrossRef] [PubMed]
  23. Ben-Nissan, G.; Lee, J.; Borohov, A.; Weiss, D. GIP, a Petunia hybrida GA-induced cysteine-rich protein: A possible role in shoot elongation and transition to flowering. Plant J. 2004, 37, 229–238. [Google Scholar] [CrossRef] [PubMed]
  24. Zhang, S.; Yang, C.; Peng, J.; Sun, S.; Wang, X. GASA5, a regulator of flowering time and stem growth in Arabidopsis thaliana. Plant Mol.Biol. 2009, 69, 745–759. [Google Scholar] [CrossRef] [PubMed]
  25. Zheng, Z.; Sun, Z.; Fang, Y.; Qi, F.; Liu, H.; Miao, L.; Du, P.; Shi, L.; Gao, W.; Han, S.; et al. Genetic Diversity, Population Structure, and Botanical Variety of 320 Global Peanut Accessions Revealed through Tunable Genotyping-by-Sequencing. Sci Rep 2018, 8, 14500. [Google Scholar] [CrossRef] [PubMed] [Green Version]
  26. Bertioli, D.J.; Jenkins, J.; Clevenger, J.; Dudchenko, O.; Gao, D.; Seijo, G.; Leal-Bertioli, S.C.M.; Ren, L.; Farmer, A.D.; Pandey, M.K.; et al. The genome sequence of segmental allotetraploid peanut Arachis hypogaea. Nature Genet. 2019, 51, 877–884. [Google Scholar] [CrossRef] [PubMed] [Green Version]
  27. Zhuang, W.; Chen, H.; Yang, M.; Wang, J.; Pandey, M.K.; Zhang, C.; Chang, W.; Zhang, L.; Zhang, X.; Tang, R.; et al. The genome of cultivated peanut provides insight into legume karyotypes, polyploid evolution and crop domestication. Nature Genet. 2019, 51, 865–876. [Google Scholar] [CrossRef] [Green Version]
  28. Liu, Y.; Xiao, L.; Chi, J.; Li, R.; Han, Y.; Cui, F.; Peng, Z.; Wan, S.; Li, G. Genome-wide identification and expression of SAUR gene family in peanut (Arachis hypogaea L.) and functional identification of AhSAUR3 in drought tolerance. BMC Plant Biol. 2022, 22, 178. [Google Scholar] [CrossRef]
  29. Huang, R.; Xiao, D.; Wang, X.; Zhan, J.; Wang, A.; He, L. Genome-wide identification, evolutionary and expression analyses of LEA gene family in peanut (Arachis hypogaea L.). Bmc Plant Biol. 2022, 22, 155. [Google Scholar] [CrossRef]
  30. Zhao, N.; He, M.; Li, L.; Cui, S.; Hou, M.; Wang, L.; Mu, G.; Liu, L.; Yang, X. Identification and expression analysis of WRKY gene family under drought stress in peanut (Arachis hypogaea L.). PLoS ONE 2020, 15, e231396. [Google Scholar] [CrossRef] [Green Version]
  31. Wang, X.; Liu, Y.; Huai, D.; Chen, Y.; Jiang, Y.; Ding, Y.; Kang, Y.; Wang, Z.; Yan, L.; Jiang, H.; et al. Genome-wide identification of peanut PIF family genes and their potential roles in early pod development. Gene 2021, 781, 145539. [Google Scholar] [CrossRef] [PubMed]
  32. Lv, M.; Wan, W.; Yu, F.; Meng, L. New Insights into the Molecular Mechanism Underlying Seed Size Control under Drought Stress. J. Agric. Food Chem. 2019, 67, 9697–9704. [Google Scholar] [CrossRef] [PubMed]
  33. Wu, Y.; Sun, Z.; Qi, F.; Tian, M.; Wang, J.; Zhao, R.; Wang, X.; Wu, X.; Shi, X.; Liu, H.; et al. Comparative transcriptomics analysis of developing peanut (Arachis hypogaea L.) pods reveals candidate genes affecting peanut seed size. Front. Plant Sci. 2022, 13, 958808. [Google Scholar] [CrossRef]
  34. Kumar, S.; Stecher, G.; Tamura, K. MEGA7: Molecular Evolutionary Genetics Analysis Version 7.0 for Bigger Datasets. Mol. Biol. Evol. 2016, 33, 1870–1874. [Google Scholar] [CrossRef] [PubMed] [Green Version]
  35. He, Z.; Zhang, H.; Gao, S.; Lercher, M.J.; Chen, W.H.; Hu, S. Evolview v2: An online visualization and management tool for customized and annotated phylogenetic trees. Nucleic Acids Res. 2016, 44, W236–W241. [Google Scholar] [CrossRef] [PubMed]
  36. Bailey, T.L.; Johnson, J.; Grant, C.E.; Noble, W.S. The MEME Suite. Nucleic Acids Res. 2015, 43, W39–W49. [Google Scholar] [CrossRef] [PubMed] [Green Version]
  37. Hu, B.; Jin, J.; Guo, A.; Zhang, H.; Luo, J.; Gao, G. GSDS 2.0: An upgraded gene feature visualization server. Bioinformatics 2014, 31, 1296–1297. [Google Scholar] [CrossRef] [PubMed] [Green Version]
  38. Chen, C.; Chen, H.; Zhang, Y.; Thomas, H.R.; Frank, M.H.; He, Y.; Xia, R. TBtools: An Integrative Toolkit Developed for Interactive Analyses of Big Biological Data. Mol. Plant. 2020, 13, 1194–1202. [Google Scholar] [CrossRef]
  39. Lescot, M.; Dehais, P.; Thijs, G.; Marchal, K.; Moreau, Y.; Van de Peer, Y.; Rouze, P.; Rombauts, S. PlantCARE, a database of plant cis-acting regulatory elements and a portal to tools for in silico analysis of promoter sequences. Nucleic Acids Res. 2002, 30, 325–327. [Google Scholar] [CrossRef]
  40. Liao, Y.; Smyth, G.K.; Shi, W. featureCounts: An efficient general purpose program for assigning sequence reads to genomic features. Bioinformatics 2014, 30, 923–930. [Google Scholar] [CrossRef] [Green Version]
  41. Love, M.I.; Huber, W.; Anders, S. Moderated estimation of fold change and dispersion for RNA-seq data with DESeq2. Genome Biol. 2014, 15. [Google Scholar] [CrossRef] [PubMed]
  42. Livak, K.J.; Schmittgen, T.D. Analysis of relative gene expression data using real-time quantitative PCR and the 2-ΔΔCt Method. Methods 2001, 25, 402–408. [Google Scholar] [CrossRef] [PubMed]
  43. Zhang, S.; Wang, X. One new kind of phytohormonal signaling integrator: Up-and-coming GASA family genes. Plant Signal. Behav. 2017, 12, e1226453. [Google Scholar] [CrossRef] [PubMed] [Green Version]
  44. Bertioli, D.J.; Cannon, S.B.; Froenicke, L.; Huang, G.; Farmer, A.D.; Cannon, E.K.S.; Liu, X.; Gao, D.; Clevenger, J.; Dash, S.; et al. The genome sequences of Arachis duranensis and Arachis ipaensis, the diploid ancestors of cultivated peanut. Nature Genet. 2016, 48, 438–446. [Google Scholar] [CrossRef] [PubMed]
  45. Chen, X.; Lu, Q.; Liu, H.; Zhang, J.; Hong, Y.; Lan, H.; Li, H.; Wang, J.; Liu, H.; Li, S.; et al. Sequencing of Cultivated Peanut, Arachis hypogaea, Yields Insights into Genome Evolution and Oil Improvement. Mol. Plant. 2019, 12, 920–934. [Google Scholar] [CrossRef] [PubMed] [Green Version]
  46. Wu, K.; Qu, Y.; Rong, H.; Han, X.; Tian, Y.; Xu, L.A. Identification and Expression Analysis of the Populus trichocarpa GASA-Gene Family. Int. J. Mol. Sci. 2022, 23, 1507. [Google Scholar] [CrossRef]
  47. Silverstein, K.A.T.; Moskal, W.A.; Wu, H.C.; Underwood, B.A.; Graham, M.A.; Town, C.D.; Vandenbosch, K.A. Small cysteine-rich peptides resembling antimicrobial peptides have been under-predicted in plants. Plant J. 2007, 51, 262–280. [Google Scholar] [CrossRef]
  48. Wigoda, N.; Ben-Nissan, G.; Granot, D.; Schwartz, A.; Weiss, D. The gibberellin-induced, cysteine-rich protein GIP2 from Petunia hybrida exhibitsin planta antioxidant activity. Plant J. 2006, 48, 796–805. [Google Scholar] [CrossRef]
  49. Rubinovich, L.; Weiss, D. The Arabidopsis cysteine-rich protein GASA4 promotes GA responses and exhibits redox activity in bacteria and in planta. Plant J. 2010, 64, 1018–1027. [Google Scholar] [CrossRef]
  50. Moyano-Canete, E.; Bellido, M.L.; Garcia-Caparros, N.; Medina-Puche, L.; Amil-Ruiz, F.; Gonzalez-Reyes, J.A.; Caballero, J.L.; Munoz-Blanco, J.; Blanco-Portales, R. FaGAST2, a strawberry ripening-related gene, acts together with FaGAST1 to determine cell size of the fruit receptacle. Plant Cell Physiol. 2013, 54, 218–236. [Google Scholar] [CrossRef] [Green Version]
  51. Qu, J.; Kang, S.G.; Hah, C.; Jang, J.C. Molecular and cellular characterization of GA-Stimulated Transcripts GASA4 and GASA6 in Arabidopsis thaliana. Plant Sci. 2016, 246, 550. [Google Scholar] [CrossRef] [PubMed]
  52. Jafari, M.; Shiran, B.; Rabiei, G.; Ravash, R.; Sayed Tabatabaei, B.E.; Martínez-García, P.J.; Martínez-Gómez, P. Identification of genes associated with kernel size in almond [Prunus dulcis (Mill.) D.A. Webb] using RNA-Seq. Plant Growth Regul. 2022, 97, 357–373. [Google Scholar] [CrossRef]
  53. Nakano, T.; Fujisawa, M.; Shima, Y.; Ito, Y. Expression profiling of tomato pre-abscission pedicels provides insights into abscission zone properties including competence to respond to abscission signals. Bmc Plant Biol. 2013, 13, 40. [Google Scholar] [CrossRef] [PubMed]
Figure 1. Predicted dimensional structures of AhGASA protein.
Agronomy 12 03067 g001
Figure 2. Phylogenetic tree of GASA proteins in A. hypogaea cv. Tifrunner. The subgroups of GASAs are shown using seven different colors. Triangles represent the AA subgenome and circles represent the BB subgenome. Numbers near the tree branches indicate bootstrap values and I–VII represent the evolutionary tree branches.
Agronomy 12 03067 g002
Figure 3. The evolutionary relationship of AhGASAs in A. hypogaea L., the motif composition, and gene structure association analysis. The numbers 1 to 20 correspond to motif 1 to motif 20.
Agronomy 12 03067 g003
Figure 4. Chromosome localization and gene replication of GASAs. GASAs were distributed in (A) A. duranensis, (B) A. ipaensis, (C) A. hypogaea L., and tandem repeats occurred in the gene pairs connected by wires during evolution.
Agronomy 12 03067 g004
Figure 5. Synteny of GASA genes in the different genomes of A. duranensis, A. ipaensis, Medicago truncatula L., Glycine max L., and A. hypogaea L.
Agronomy 12 03067 g005
Figure 6. Expression pattern and promoter analysis of the GASA gene family in A. hypogaea L. (A) The phylogenetic tree and promoter analysis of AhGASAs. (B) The expression patterns of AhGASAs under different developmental stages of peanut pod. (C) The cis-acting elements associated with phytohormones, light response, tissue-specific expression, and abiotic stresses. (D) Different stages of peanut pod development.
Agronomy 12 03067 g006
Figure 7. Quantitative real-time reverse transcriptase polymerase chain reaction (RT-qPCR) validation of 7 GASA genes. The line chart shows RT-qPCR relative expression, and the column diagram shows RNA-seq FPKM.
Agronomy 12 03067 g007
Publisher’s Note: MDPI stays neutral with regard to jurisdictional claims in published maps and institutional affiliations.

