Abstract
The barley old cultivars can be used as a source of genetic diversity to breed new varieties well adapted to different environmental conditions. In this study, 431 European barley accessions were evaluated phenotypically across 2 years under field conditions and genotypically using DArTseq to gain insight into the genetic architecture of phenology, biomass, yield components, and seed yield traits. Accessions were grouped into sub-collections by cultivation period (group A—cultivated prior to 1985, B—cultivated after 1985, and C—Polish landraces), and by European country of origin or European region, to compare their phenological and agronomic value for 16 traits such as: days to heading (DH), days to milk-waxy stage (DMW), days to maturity (DM), days to harvest (DPH), plant height (PH), lodging (LT), row number (RN), spike density (SD), spike length (SL), grain per spike (NGS), glume colour (GC1), grain awn type (GAT), grain covering (GT), grain pericarp colour (GPC), and 1000—grain weight (TGW), and to indicate marker-trait associations (MTAs) with these traits. Based on the results, phenotypic plants per se under field conditions and spikes, or seeds under laboratory conditions it was possible to cluster the collection. DH negatively correlated with PH and important yield components, such TGW. Overall, the genome-wide association study (GWAS) analysis identified 143 MTAs associated with these traits. Twenty-three MTAs were associated with plant phenological stages: 5 MTAs with DH, 6 MTAs with DMW, 5 MTAs with DM, and 9 MTAs with DPH. Eighty-nine SMTAs for plant phenotypic traits were identified: 1 for LT and 88 MTAs for PH. Thirty-one markers were identified for agronomic yield traits: 16 MTAs for SD, 11 MTAs for NGS, and 4 for TGW. One association result, 7241263-17 on chromosome 2H, corresponded to the genomic region mapped for DM, DPH, and SD. Marker 3258999-37-C/T on chromosome 2H, significant for NGS, was closely located to results 3263044-31-G/T for SD and 3263989-64-A/C for DMW. On chromosome 6H, closely located were markers significant for SD (3255466-35-C/G) and for NGS (3259102-57-C/A). Moreover, on chromosome 6H, closely located were markers significant for SD (3918801-14-G/A), for NGS (3666407-49-T/G), and for DMW (3663162-62-A/C). The well-characterized barley collection and identified MTAs markers will be used to create a Polish Genebank platform and will serve as a valuable resource for precise breeding programs.
Keywords:
barley; DArTseq; diversity; Hordeum vulgare; phenological traits; height; lodging; spike traits; seeds traits 1. Introduction
Barley (Hordeum vulgare L.) is one of the most important cereal crops in the world, including Poland. It constitutes a staple food in several regions of the world due to adaptation to high altitudes, drought, and soil salinity [1]. Cultivated varieties, including those with grain husks and naked grains, are used as a livestock feed, malt, and foods including the roasted grains as a coffee substitute. In recent years, there has been a growing interest in food barley because of recent research confirming the health benefits of barley in human diets [2]. In 2018, the barley domestic supply for Poland was 3289 thousand tonnes. Though Poland’s barley domestic supply fluctuated substantially in recent years, it tended to decrease for the period 1969–2018, ending at 3289 thousand tonnes in 2018.
It is one of the oldest cereal crops and is widely grown in marginally productive soils across the world. Available evidence suggests that barley was first domesticated around 10,000 to 12,000 y ago in the Fertile Crescent. Second, locally adapted landraces emerged in Eurasia. Modern crop breeding commenced around 1900 [3]. Genetic gain, in terms of higher yields, was achieved at the expense of reduced adaptability to various ecological stressors and a narrowing of the genetic base in the cultivated barley. Despite a noticeable shift towards improved cultivars, several farming communities transcending continental boundaries continue to retain the interest in barley landraces, due, apparently, to their better performance and compatibility with the local needs. The genetic uniformity of modern current cultivars is causing greater vulnerability to the negative effects of climate change, and will also limit future genetic gains [4]. Currently, more and more breeding strategies are focused on the identification of novel sources of genetic variation which can be incorporated into breeding programs. By broadening the genetic basis of their initial plant material, breeders continue to make gains in productivity and quality of new cultivars, while at the same time efficiently responding to climate change [5].
The ability to identify new varieties and determine their diversity with respect to previously registered varieties promises to be the prime requirement for a valuable market of plant varieties, as well as a guaranteeing genetic value of plant materials, according to Lanteri and Barcaccia, 2006 [6].
Genebanks’ main goal is to preserve key plant genetic resources for handling current and future challenges to food production. The role of genebanks has evolved from primarily serving plant breeders to including conservation of biodiversity and distribution of plant genetic resources to local communities [7,8,9,10,11]. More than 400,000 accessions of barley are stored in 47 barley collections with more than 500 accessions and 25 smaller collections worldwide. Major seed collections are PGRC—Plant Gene Resources of Canada; NSGC—The USDA-ARS National Small Grains Collection, CENARGEN—Embrapa Genetic Resources and Biotechnology: Embrapa Cenargen; ICARDA—International Center for Agricultural Research in the Dry Areas; NIAS—The National Institute of Agrobiological Sciences, reorganized to the National Agriculture and Food Research Organisation (NARO) in 2016; IPK—the Leibniz Institute of Plant Genetics and Crop Plant Research; and the Vavilov Institute of Plant Industry (VIR, Russia) (https://www.genebanks.org/resources/crops/barley/ (accessed on 25 July 2022)). In addition, there are well-established repositories and data-deposition and data-exchange formats for genomic data, such as the National Center for Biotechnology Information (NCBI) [12], the European Nucleotide Archive (ENA) [13], and the DNA Data Bank of Japan (DDBJ), which are part of the International Nucleotide Sequence Database Collaboration (https://ngdc.cncb.ac.cn/databasecommons/ (accessed on 25 July 2022)). Many accessions are duplicated in genebanks because of quarantine issues and safety reasons. These genetic resources of barley have priceless value for the breeding of barley to create new cultivars well adapted to the changing climate [8,14].
Being one of the most widely adapted crops, the barley germplasm pool has the potential to contain sufficient genetic diversity to breed for adaptation to changing environmental conditions. However, it has to be well characterised using novel genomic and breeding technologies [14,15,16]. Future barley cultivars will have to produce under the constraints of higher temperature in combination with increased concentrations of atmospheric carbon dioxide and ozone as a consequence of climate change [17].
Characterisation and evaluation data based on standardised methods and rating systems are needed for more efficient searching of initial breeding materials that meet all requirements for new barley cultivars. Improved web interfaces that provide genebank inventory identities, along with well-described genotype and phenotype data, are needed for precise accession selection. These repositories should include the description of molecular markers associated with all major germplasm characteristics [7,9,12,14,18,19,20]
The GWAS approach, starting with phenotyping of traits of interest followed by a forward genetic analysis to identify loci and candidate genes by marker-trait association (MTA) approach, was used in the present study [13,15,21]. Linkage disequilibrium (LD) present in characterized genetic resources are important prerequisites to deduce the genetic composition and genomic predictions of traits of interest. It could also be used as a predictor of the resolution at which significant genomic regions with influence on traits can be detected through marker-trait-association analysis [22].
In recent years, new high throughput genotyping platforms have enabled the implementation of GWAS in barley [15,23,24,25]. Many studies have shown practical results of characterisation and use of barley germplasm arrays for identifying candidate genes via GWAS, e.g., the use of elite US and UK breeding germplasm combined with the development of high-throughput barley SNP assays has allowed the detection of quantitative genetic factors for biotic and abiotic stress resistance [26,27,28], agronomic and/or grain quality traits [29,30,31,32], and one of the genes controlling spike architecture in barley [33]. In another study, GWAS was used to detect QTL for heading date, plant height, thousand-grain weight, starch content, and crude protein content in a diverse collection of 224 spring barleys of worldwide origin [34]. Other examples of using GWAS were a study using a large panel of 615 barley cultivars in a mixed linear model that identified significant associations for 16 morphologic and nine agronomic traits [35], and a study of a large panel consisting of 2417 accessions using the barley iSelect 9 k SNP assay to dissect hull cover, heading date, and spike morphology [15].
This research is a part of a larger effort focused on developing and implementing a national management system for major crop plant genetic resources stored in the Polish Genebank which incorporates phenotypic and genotypic data (https://agrobank.cdr.gov.pl/index.php (accessed on 25 July 2022)). This management system, with data sets for major crops, will facilitate more effective breeding of new cultivars well adapted to changing climate conditions. Accessions originated from Poland and other European countries. They were classified into three groups: 1. “old cultivars” if they were cultivated before 1985, 2. “modern cultivars” if they were cultivated after 1985, and 3. “Polish landraces”. All these accessions were genotyped to select a mini core collection for sequencing and creating a platform.
The aim of this study was to provide more information concerning the molecular characteristic of barley germplasm, which is crucial for their proper use in breeding programs. GWAS analysis was conducted to identify loci determining barley phenotypic and phenological traits during vegetation times, such as days to heading, days to milk-waxy stage, days to maturity, days to harvest, plant height, and lodging. Agronomic traits which directly or indirectly determine yield potential such as: number of grains per spike, 1000-grain weight, row number, spike density, spike length, and grain per spike were described and loci associated with them were identified. In addition, data for traits such as glume colour, lemma awn/hood, grain covering, and grain colour were collected for GWAS analysis.
2. Materials and Methods
The plant materials used in the presented study were characterized in terms of adult powdery mildew and rusts resistance under field conditions 2018–2019 in a previous study by Czembor et al. [36].
2.1. Plant Material
In summary, a collection of 431 barley accessions, including landraces and old cultivars, stored at the Polish Genebank (National Centre for Plant Genetic Resources: NCPGR) were phenotyped and evaluated using DArTseq: 137 POL, 67 DEU, 38 SWE, 35 CSK, 34 FRA, 27 GBR, 25 DNK, 21 NLD, 12 AUT, 8 SUN, 6 NOR, 4 FIN, 3 IRL, 3 CAN, 2 USA, and 2 HUN and 1 each from UKR, TUR, PRK, NZL, JPN, and BEL and 1 of unknown origin were evaluated. For evaluation using DArTseq, 23 additional control genotypes were included.
Accessions were classified into three groups to compare them in terms of phenological and other significant agronomical traits: group A (206 accessions) representing old cultivars cultivated prior to 1985, group B (178 accessions) representing modern cultivars cultivated after 1985, and group C (37 accessions) representing Polish landrace, i.e., traditional cultivars to which were not applied any breeding methods (“landraces have been and are in a constant state of evolution as a result of natural and artificial selection”) [37].
Accessions were grouped into sub-collections, either by country of origin or by European region according to barley domestication in Europe. These sub-collections were: group I: Polish (A—51, B—49. C—37); group II: West—Central European (CSK, DEU, DNK, AUT; A—91, B—59); group III: French (A—14, B—21); group IV: Great Britain (A—22, B—8); group V: North European (FIN, NOR; A—16, B—15); group VI: Swedish (A—12, B—26); VII other (origin unknown) [36].
The Polish accessions were selected to reflect the diversity of Polish accessions held at the Genebank, with priority given to those with key phenotypic traits in Polish breeding programs. This was then supplemented with non-Polish accessions from countries where a particular trait is most frequent. Passport data include: accession number (ACCENUMB), accession name (ACCENAME), country of origin (ORIGCTY), institute code (INSTCODE)/institute name, acquisition date (ACQDATE), donor institution code (DONORCODE)/donor institute name (DONORNAME), and type of germplasm storage (STORAGE).
2.2. Field Experiment and Phenotypic Evaluation
Field experiments were conducted in 2018 and 2019 in the experimental fields of Plant Breeding and Acclimatization Institute-National Research Institute (PBAI-NRI), Radzikow, near Warsaw, Poland. No specific permissions were required, and no endangered or protected species were involved.
The experimental trials were conducted in a randomised complete block design. In 2018, seeds were sown in three replications (blocks), and in 2019 in two replications—2 rows (row length of 2.0 m), plant spacing of 4.0 cm, and row spacing of 20.0 cm [36].
Accessions were evaluated according to IPGRI methodology, taking into account traits that are crucial for agricultural value such as: phenological development, height, lodging, inflorescence, and seeds traits. In the group of phenological, stages four stages of plant development, which are crucial for final yields, were described.
A total of sixteen traits were described: days to plants heading stage (DH), days to plants milky-waxy stage (DMW), days to plants maturity stage (DM), days to plants harvest stage (DPH), plants height (PH), plants lodging tendency (LT), row number (RN), spike density (SD), glume colour (GGC1), grain awn type (GAT), glume colour (GGC2), spike length (SL), grain per spike (NGS), grain type/covering (GT), grain colour (pericarp) (GC) and 1000-grain weight (TGW) (Table 1). Among the evaluated spring barley collection 402 were two-row barley and 29 six-row genotypes.

Table 1.
List of the traits described 431 accessions evaluated under field conditions across 2018–2019.
In 2018 five traits were described: DMW, DM, PH, LT, and SL, and in 2019 twelve additional traits were described as follows (in total, 15 traits): DH, DMW, DM, DPH, PH, LT, RN, SD, GHC1, GH, GHC2), NGS, GT, GC, and TGW (Table 1). Resistance to diseases, powdery mildew, and rusts was published separately [36].
2.2.1. Statistical Analysis
As it was described, the sub-collections were created using two criteria: (1) cultivation period or registration of cultivars (group A—cultivated prior to 1985, B—cultivated after 1985, and C—Polish landraces) and (2) country of origin or geographical region.
Based on the differences between and within the sub-collections, it was possible to compare the effects of plant breeding on the genetic diversity of barley over years and to conclude if the old cultivars may be valuable sources of the traits which were described (DH, DMW, DM, DPH, PH, LT, RN, SD, GHC1, GH, GHC2, NGS, GHT, GC, and TGW) in the breeding programs over the years.
A statistical analysis of the traits, DH, DMW, DM, DPH, PH, LT, SL, NGS, and TGW was conducted using Statistica software (version 13.31984-2017 TIBCO Software). It was used to obtain the range, mean, standard deviation (SD), coefficient of variation (CV), and analysis of variance (ANOVA test; α ≤ 0.05) values to confirm the significant differences in these traits between the accessions and the sub-collections and estimate the standard error (SE) for measurement of variation of the sub-collection mean. The results of the collection summary statistic were presented in the form of graphs as frequency histograms with mean, SD., Max, and Min and for sub-collections, the results are presented in the form of graphs with ANOVA and Standard Error (SE) bars. Relationships between plant phenological and morphological traits, and grain and spike morphological traits were described using Pearson’s correlation coefficient analysis and linear regression.
Because there were no differences in the grain traits described visually using a numeric scale, such as: GH, GHC1, GHC2, and for GC (with one exception in the Polish sub-collection which was not white like the whole collection, only black—POL003: 259 J: 43319, CZARNY PERCIWALA) and GT (with two exceptions in Polish sub-collections which were described as a naked—RAJSKI 40415, POLO 43368), statistical analyses were not performed.
2.2.2. Genotyping
Genotyped by Diversity Arrays Technology (DArT) Pty Ltd., Monana St., Bruce, ACT 2617, Australia, using DArTseq [21], were 454 accessions (431 evaluated under field conditions and 25 additional, used as controls). SNP calls were made against IBSC Barley Morex v2 assembly [38]. The Barley GBS 1.0 platform DArT genotyping service returned 28,530 in-silico DArT-seq markers.
2.3. Data Filtering Process
DArT data were handled in the same manner as described previously for soybean, and barley adult plant resistance for powdery mildew and rusts [36,39]. That is, we used the dartR v1.1.11 package [40] in the R programming language. SNPs and genotypes were removed if SNP markers contained >5% missing data and genotypes contained >10% missing data, respectively. SNPs with a reproducibility score (RepAvg) <100% were removed. Where SNPs originated from the same fragment, a random SNP was retained while the others were discarded. Non-informative monomorphic SNPs were removed, and so too were rare SNPs with a minor allele frequency of <1%. After filtering, 453 accessions (1 individual was removed due to having >10% missing calls) and 10,153 SNPs were retained for further analysis.
2.4. Genome-Wide Association Studies (GWAS)
GWAS analysis was conducted as was described for barley powdery mildew and rusts, adult plant resistance [36] using the GAPIT v2018.08.18 R package [25,41,42]. We used the recently developed Bayesian-information and Linkage-disequilibrium Iteratively Nested Keyway (BLINK) model, which has been shown to produce fewer false positives, identify more true positives, and scale to very large data sets [25]. Physical genome positions of markers were derived from the DArTseq SNP genotype file. Since GAPIT can only handle complete data, only markers with a physical position on one of the chromosomes and zero missing data were used as input into the GWAS analysis. Bonferroni and FDR thresholds were used. DArTseq markers with FDR and Bonferroni p = 0.01 thresholds were taken as significantly associated with the evaluated trait. In order to show the distribution of SNPs over the chromosome, Manhattan plots have also been generated. The significance levels for GWAS analysis on the Manhattan plots were as follow: solid green line—Bonferroni FDR multiple test threshold (p = 0.01) and dashed green line FDR threshold (FDR adjusted ≤ 0.05).
3. Results
The collection of 431 accessions was evaluated under field conditions across 2018–2019 and 16 traits were described in detail in Table 1. Phenotypic data collected for the GWAS panel are presented in Supplementary Tables S1–S3 and Figure S1. Overall, an analysis of the GWAS for phenotypically collected data indicates 146 markers associated with these traits which are presented on the Manhattan plots with Quantile–Quantile (QQ) plots observed against expected probability values (p-values) from the GWAS analysis.
3.1. Collecting Data of Plant Phenology Traits
Frequency distribution of the barley accessions based on phenological stages as days from planting time to plants heading stage (DH), milky-waxy grain stage (DMW), maturity (DM), and harvesting (DPH) are presented in Figure 1 and in Supplementary Tables S1 and S2 and Figure S1. Significant differences between accessions belonging to the evaluated collection was determined for all traits with the exceptions of DM and DPH in 2019, and DM in 2018 (Figure 1A1,B1,C1,D1, Supplementary Table S2). At the same time, differences between sub-collections were significant (Figure 1A2,B2,C2,D2, Supplementary Table S2).
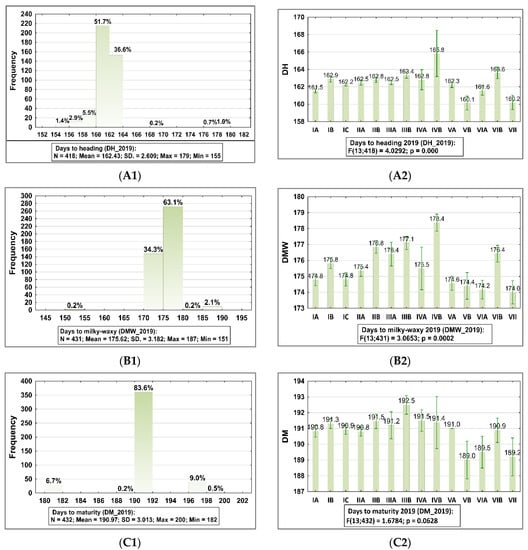
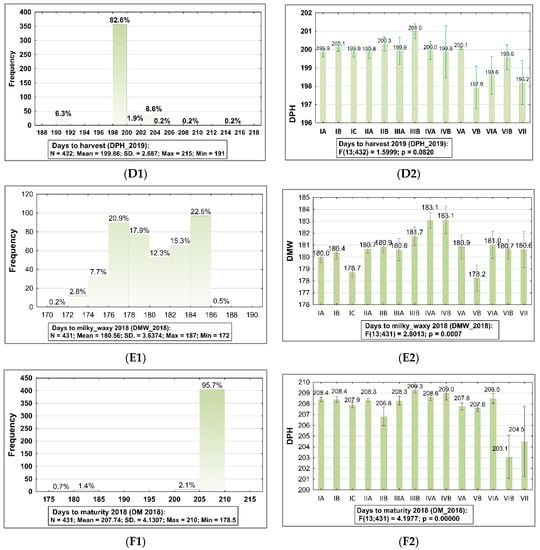
Figure 1.
Frequency distribution histograms with summary statistics for phenological traits of barley accessions belong to the collection evaluated in 2019 and 2018 and the result of ANOVA testing (p < 0.05) showed statistically significant differences between sub-collections (groups). The bars represent mean value and standard error (SE) for each sub-collection. 2019: (A1,A2) plants at tillage stage (DH), (B1,B2) plants at milky-waxy (DMW), (C1,C2) plants at maturity stage (DM), and (D1,D2) plants at harvest stage (DPH). 2018: (E1,E2) plants at milky-waxy stage (DMW), (F1,F2) plants at maturity stage (DM). The sub-collections (groups) of accessions were created using two criteria: (1) cultivation period and registration of cultivars (group A—cultivated prior to 1985, group B—cultivated after 1985, and group C—Polish landraces), and (2) country of origin or geographical region: I: POL; II: CSK, DEU, DNK, AUT; III: FRA; IV: GBR, IRL; V: NLD, FIN, NOR; VI SWE; VII: other non-European.
It was observed that in 2019, accessions were intermediate in all phenological stages as follows: 88.3% of accessions in the heading stage (PH) belong to the group in the range 160–164 days from planting time, 97.4% of accessions in which seeds were in the milky-waxy stage (DMW) belong to the group 170.0–180.0 days from planting, 83.6% of accessions belonging to the group which were in the Z90 stage according to Zadoks growth scale 190–192 days from planting time were in the maturity (PM) stage (Figure 1A1,B1,C1; Supplementary Table S1). The harvest (DPH) time was, on average, 9 days after seed maturity, when grain was dray (82.6% accessions belong to the group which were harvested 198–200 days after planting time; Figure 1F1, Supplementary Tables S1 and S2). In 2018, the plants’ developing stages were, on average, 5 days later. In 2019, significant differences between sub-collections were observed for DH, DMW, and in 2018, for DMW and DM.
A broad range in variation of the number of days from planting to heading and to milky-waxy stage was observed in the group originating from Great Britain (Figure 1A1,A2, Supplementary Table S2). Polish materials were very homogeneous in terms of these traits (CV = 0.25% in a range 162–164 days). On the other hand, in terms of the DMW, sub-populations from Northern Europe were more diverse than the others (Figure 1C2, Supplementary Table S2).
In the group of Polish landraces, meaning accessions to which were no breeding methods were applied, the range of variability was in a range 162–164 days (CV = 0.25%) (in a range 162–1790, Figure 1C2; Supplementary Table S2). The broadest range was in the group from Great Britain, in the sub-population cultivated after 1985, CV = 42.17%, however in this population only 6 accessions were evaluated. Next, the highest variation for heading was observed in the group IVA, the sub-population from Great Britain cultivated before 1985, CV = 21.10% (in a range 155.0–177.00).
The broad variability of DMW traits was found for sub-collections of old cultivars from Great Britain (CV = 39.10%), CSK, DEU, DNK, AUT (CV = 12.30%), and NLD, FIN, NOR (CV = 10.54%). In 2018, genetic variation for DMW was 13.25% (in a range 172.0–187.0 days from planting) and for DH, 6.17% (in a range 202.0–213.0 days from planting; Figure 1E1,E2,F1,F2; Supplementary Table S1).
3.2. Collecting Data of Plant Height and Lodging Tendency
Frequency distribution of the barley accessions based on plant height (PH) and lodging tendency (LT) are presented in Figure 2A1,B1,C1 and in the Supplementary Tables S1 and S2 and Figure S1. Differences for these traits are significant, with the exception of LT in 2019 (all genotypes were scored for 9, which means plants were vertical/upright on the scale of 1–9) and this trait was not taken into account in the statistical analysis. On average, in 2019, accession plant height was 78.0 cm with genetic variation in the range 50.0–105.0 cm (SD 10.308; CV 106.25%). In 2018, genotypes were lower, and their average height was 66.7 cm, with genetic variation in the range 40.0–91.0 cm (SD 8.652; CV 74.865).
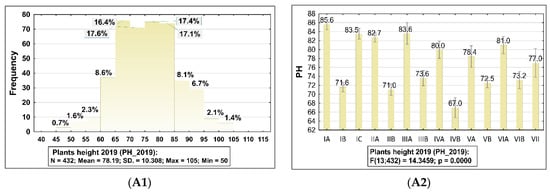
Figure 2.
Frequency distribution histograms with summary statistics for plant height (PH) and lodging tendency (LT) of barley accessions belong to the collection evaluated in 2019 and 2018, and the result of ANOVA testing (p < 0.05) showed statistically significant differences between sub-collections (groups). The bars represent mean value and standard error (SE) for each sub-collection. 2019: (A1,A2) plant height (PH). 2018: (B1,B2) plant height (PH), (C1,C2) lodging tendency (LT). The sub-collections (groups) of accessions were created using two criteria: (1) cultivation period and registration of cultivars (group A—cultivated prior to 1985, B—cultivated after 1985 and C—Polish landraces) and (2) country of origin or geographical region: I: POL; II: CSK, DEU, DNK, AUT; III: FRA; IV: GBR, IRL; V: NLD, FIN, NOR; VI SWE; VII: other non-European.
In 2018, over 25.0% of accessions from the whole evaluated collection belong to the group which were higher than 100.0 cm (Figure 2B1, Supplementary Table S1). Next, 19.7% of genotypes belong to the group with height in the range 80.0–100.0 cm and 5.5% of genotypes belong to the group with the range 60.0–80.0 cm. In 2019, dominated accessions of which height was in the range 70.0–80.0 cm. In both years differences between accessions cultivated prior to 1985 and after 1985 in different parts of Europe were significantly different from each other in this trait.
In 2019, it was possible to observe broad genetic variation in the sub-collections cultivated prior to 1985 (coefficient variation was in the range 46.5–93.6%), and in the sub-collections cultivated after 1985, it was in the range 18.4–96.3%. In 2018, genetic variation in the sub-collections cultivated prior to 1985 was in the range 32.3–74.7%, and in the sub-collections cultivated after 1985, it was in the range 24.1–59.5%. In both years, in the sub-collection originating from Poland, genetic variability for the trait height in the group of old cultivars was much higher than in the group of cultivars cultivated after 1985, and landraces. Regarding genetic variation in the sub-collection originating from Great Britain, genetic variation in the sub-collection cultivated before 1985 was broader than in the group cultivated after 1985 (CV in group A in 2018 was 59.5% and in 2019 it was 82.0%; CV in group B in 2018 was 24.1% and in 2019 it was 39.7%). In 2019, CV for height in both sub-collections originating from Central and Western Europe was over 90.0%.
On average, in 2018, in sub-collections cultivated prior to 1985, LT was scored in the range 5.4–7.4 and after 1985 in the range 7.8–8.2 using a 1–9 scale. Differences between sub-collections for this trait were significant (Figure 2C2). Genetic variability in the sub-collection cultivated prior to 1985 was in the range 0.97% (sub-collection originating from NLD, FIN, NOR)–2.8% (sub-collection originating from Central and Western Europe CSK, DEU, DNK, AUT).
3.3. Collecting Data of Spike and Grain Morphology Traits
The description of the spike morphology for GWAS panel was carried out considering six traits: RN, SD, SL, NGS, GAT1, and GAT2, and the description of the grain morphology was carried out considering three traits: GH, GC, and HGW. All of them were described using samples collected from the field experiments in 2019, with exception of SL, which was described using samples collected from the field experiment in 2018. A summary description of the spike and grain traits is presented on the Figure 3 and in the Supplementary Table S3 and Figure S2. Figure 3A1,B1,C1 presented frequency distribution with summary statistics for NGS, TGW, and SL. Figure 3A2,B2,C2 presented results of ANOVA testing (p < 0.05) and showed statistically significant differences between sub-collections (groups) with standard error (SE).
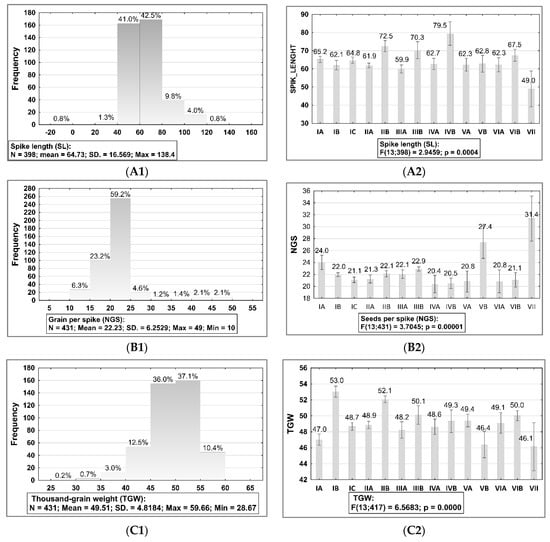
Figure 3.
Frequency distribution histograms with summary statistics for seeds per spike (NGS), spike length (SL) and 1000-grain weight (TGW) of barley accessions belong to the collection evaluated in 2019 and 2018 and the result of ANOVA testing (p < 0.05) showed statistically significant differences between sub-collections (groups). The bars represent mean value and standard error (SE) for each sub-collection. 2018: (A1,A2) spike length (SL); 2019: (B1,B2) grain per spike (NGS), (C1,C2) 1000-grain weight (TGW). The sub-collections (groups) of accessions were created using two criteria: (1) cultivation period and registration of cultivars (group A—cultivated prior to 1985, B—cultivated after 1985, and C—Polish landraces) and (2) country of origin or geographical region: I: POL; II: CSK, DEU, DNK, AUT; III: FRA; IV: GBR, IRL; V: NLD, FIN, NOR; VI SWE; VII: other non-European.
However, differences between accessions for SL were not significant, and it was possible to determine significant differences between sub-collections. Broad variability was observed in sub-collection II, accessions originating from CSK, DEU, DNK, and AUT (average 61.9 cm; CV = 511.7%, range: 46.5–138.4 cm) and IV, accessions originating from GBR and IRL and cultivated after 1985 (average 79.5 cm, CV = 331.8%, range 67.2–120.5). Old cultivars cultivated prior to 1985 were more homogeneous and, in these groups, the maximum SL length did not exceed 90.0 cm. SL in group B (cultivated after 1985) was above 100.0 cm.
On average, the NGS was 22.2 grains with a range of 10.2–49.2 g (CV = 39.09%). The broad variability of the NGS trait was found for the sub-collections of old cultivars cultivated after 1985 originating from NLD, FIN, and NOR (CV = 112.43%). Very homogenous sub-collections were from France (CV = 2.36% in group A and CV = 7.51% in group B).
It was observed that in the sub-collection accessions originating from Poland cultivated prior to 1985, the average for NGS was higher than the average of the sub-collection accessions cultivated after 1985, and of the landraces group. In addition, the range of the variability in group A originating from Poland was higher than in all other groups (CV = 74.9%, range 10.2–48.3 g).
There were no differences for the grain traits described visually using a numeric scale, such as: GH, GHC1, GHC2, GC (with one exception in Polish sub-collection: POL003: 259 J: 43319, CZARNY PERCIWALA, in which the grain was black and the grain of the remaining genotypes in the collection was described as a white), and GT (with two exceptions in Polish sub-collections which were described as a naked—RAJSKI 40415, POLO 43368). Because of this, they were not included in the statistical analysis. Variability in spike shape and density, awn types, and grain of the cultivars evaluated during AGROBANK project is presented in the Supplementary Figure S3.
3.4. Relationship between Phenological and Agronomical Traits
Pearson correlation coefficients were used to evaluate relationship between traits described across 2019–2018: DH, DMW, DM, DPH, RN, NGS, TSW, SD, GT, GC1, GC2, and GC in 2019 and LT in 2018.
In 2019, for DH it was possible to observe a low to moderate positive correlation with DMW (r = 0.228*, p <0.05), DM (r = 0.312**, p < 0.01), and DPH (r = 0.257**, p < 0.05) (Table 2). A low to moderate negative correlation was between DH and PH (r = −0.252*, p < 0.05), RN (r = −0.330**, p < 0.01), and NGS (r = −0.340**, p < 0.01). LT negatively correlated with DH (0.176*, p < 0.05), DMW (0.179*, p < 0.05) and moderately with PH (r = 0.426***, p < 0.001). RN strongly positively correlated with NGS (r = 0.801***, p < 0.001) and moderately negatively with TGW (r = −0.400***, p < 0.0015).
Table 2.
Pearson correlation coefficients matrix between traits described across 2019–2018: days number to heading stage (DH), days number to milky-waxy stage (DMW), days number to maturity stage (DM), days number to harvesting stage (DPH), plant height (PH), row number (RN), number grain per spike (NGS), thousand-grain weight (TGW), grain awn type (GH), spike density (SD), grain type (GT), grain glume colour (GHC1, GHC2), grain pericarp colour (GC) in 2019, and lodging tendency (LT) in 2018.
Based on the regression analysis model it was possible observe a positive relationship between PH and DPH scored in 2019 (Figure 4A), a negative relationship between LT and PH scored in 2018 (Figure 4B), a strong negative relationship between NGS and TGW scored in 2019 (Figure 4C), and a positive relationship between LT scored 2018 and NGS scored in 2019 (Figure 4D).
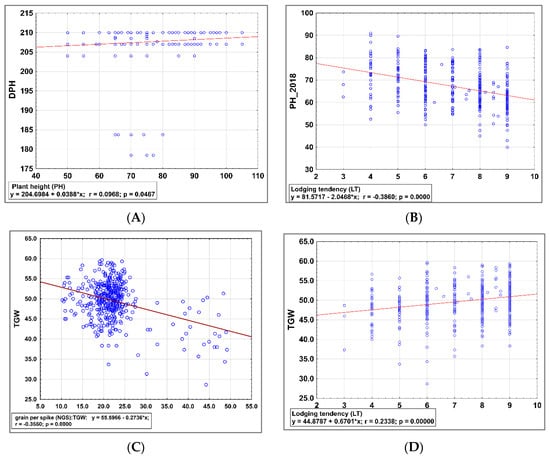
Figure 4.
Regression analysis model to estimate relationship between (A) in 2019 plant height (PH) and number days to harvest (DPH) scored in 2019, (B) lodging tendency (LT) and plant height (PH) scored in 2018, (C) number of grains per spike (NGS) and TGW scored in 2019, (D) lodging tendency (LT) scored 2018 and number of grains per spike (NGS).
3.5. GWAS Analysis for Marker Trait Associations
GWAS analysis indicated 143 marker-trait associations (MTAs) with the 16 traits investigated in 2018 and 2019 (Table 3, Supplementary Tables S4 and S5).
Table 3.
Summary of the number of significant (FDR adjusted ≤ 0.05) marker trait associations per chromosome per trait.
For days to heading (DH) 5 MTAs were identified, one on each of the chromosomes 1H, 2H, 3H, 5H, and 6H (Table 3, Figure 5, Supplementary Table S4). For DMW, 6 markers were identified (one on each of the chromosomes 1H, 2H, 4H, 5H, 6H, and UN), for DM, 5 markers (one on 2H and two on 3H and 5H). Only one marker (7241263-17-G/A) was shared between DM and DPH and this resided on 2H. For plant lodging (LT) scored in 2018, GWAS identified 1 locus on the chromosome. The highest number of significant markers identified were associated with PH (88 MTAs) and they are presented on Figure 5 and in Supplementary Table S5.
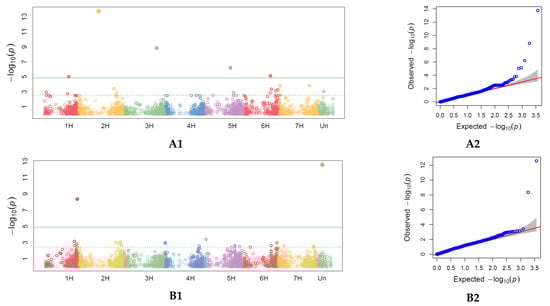
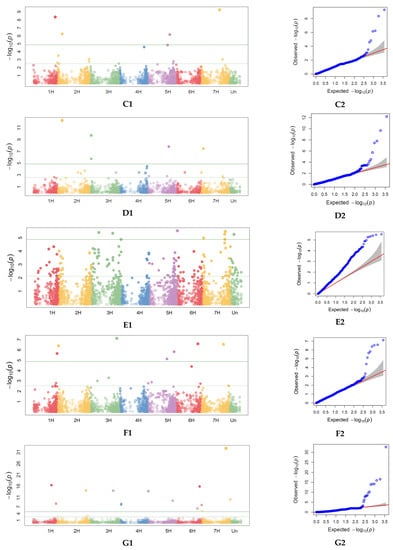
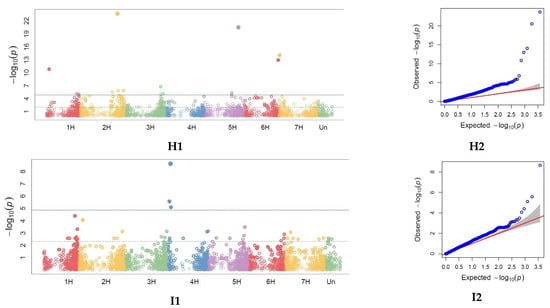
Figure 5.
Single nucleotide polymorphisms (SNPs) significantly associated with phenological, morphological and agronomic traits across 2018 and 2019 identified by genome-wide association study (GWAS) with BLINK model representation on the Manhattan plots (right) and Quantile–Quantile (QQ) plots (left) observed against expected probability values (p-values) from the GWAS analysis. Manhattan plot and Quantile–quantile (QQ) plots for heading (DH) in 2019 (A1,A2). Manhattan plot and QQ plots for days to milky-waxy (DMW) in 2019 (B1,B2). Manhattan plot and QQ plots for days to maturity (DM) in 2018 and 2019 (C1,C2). Manhattan plot and QQ plots for days to harvest (DPH) in 2019 (D1,D2). Manhattan plot and QQ plots for lodging tendency (LT) in 2018 (E1,E2). Manhattan plot and QQ plots for plant height (PH) in 2019 (F1,F2). Manhattan plot and QQ plots for spike density (SD) (G1,G2). Manhattan plot and QQ plots for grain per spike (NGS) (H1,H2). Manhattan plot and QQ plots for thousand-grain weight (TGW) (I1,I2).
GWAS for spike density (SD) described in 2019 identified 16 MTAs, 11 for NGS and 4 for TGW. Markers significant for SD were localized on chromosomes 1H (2 MTAs), 2H (5 MTAs), 3H (2 MTA), 4H (1 MTA), 5H (1 MTA), 6H (4 MTAs), and 7 (2 MTAs). MTAs significant for TGW were localized on chromosomes 4H (3 MTAs) and 1H (1 MTA). For NGS, they were localized on chromosomes 2H (2 MTAs), 3H (2 MTAs), 4H (1 MTA), 5H (2 MTAs), 6H (3 MTAs), and 7H (1 MTA).
The largest number of markers significantly associated with agronomic traits and related to plant phenological stages was on chromosomes 2H and 6H. Association results 7241263-17 on chromosome 2H correspond to the genomic region mapped for DM, DPH, and SD. Marker 3258999-37-C/T on chromosome 2H, significant for NGS, was closely located to results 3263044-31 for SD, and 3263989-64 for DMW. On chromosome 3H, marker 3919802-61 for SD, was closely located to marker 3920041-34 for DH. On chromosome 6H, closely located were markers significant for SD (3255466-35-C/G) and for NGS (3259102-57-C/A). Moreover, on chromosome 6H, closely located were markers significant for SD (3918801-14-G/A), for NGS (3666407-49-T/G), and for DMW (3663162-62-A/C).
4. Discussion
There are many examples of the utility of landraces or old cultivars as potential sources of new genes and alleles for crop breeding. Determining the genetic basis of economically important agronomic traits has been one of the major scientific challenges in the process of crop improvement. One of the most important tasks of crop geneticists is the molecular characterisation of germplasm for preservation from genetic erosion, and the identification of phenotypic variants potentially useful for breeding new varieties. In the past, one of the reasons for the limited use of landraces to introduce new genetic variation into breeding programs was linkage drag. Currently, the advent of new platforms of molecular markers provides a solution to overcome this problem and the use of these platforms is becoming routine in crop breeding programs [14,18,20,25,43,44,45].
The presented study is a part of a larger effort focused on developing and implementing a national management system for major crop plant genetic resources stored in the Polish Genebank, which incorporates phenotypic and genotypic data (https://agrobank.cdr.gov.pl/index.php (accessed on 29 October 2021)) [40]. This management system, with data sets for major crops (wheat, barley, soybean, rape, and pea), will facilitate more effective breeding of new cultivars well adapted to changing climate conditions.
Most of the agronomically important traits are quantitative, resulting in greater difficulty in discerning the genetic differences underlying the phenotype of interest. In barley, the genetic variability of old cultivars or landraces was not fully exploited at the beginning of modern breeding. Genebanks are invaluable sources of genetic material for important traits in breeding programs [7,8,9,10,14,18,19]. The introgression of new alleles into elite cultivars is performed more simply and effectively with old cultivars and landraces than with wild relatives. For this reason, old barley cultivars and landraces collected in European countries should be thoroughly mined for new genes.
Like other genebanks, the Polish Genebank (National Centre for Plant Genetic Resources: NCPGR), not only plays an important role in the conservation of plant genetic resources, but also as a source of new genetic alleles for crop breeding [36,39,46,47,48].
For a long time, Polish breeders included in their collections and breeding programs, varieties from other European countries, and changes in the spring barley gene pool in Poland during 120 years of breeding is described by Diurdziak et al. [49]. In the case of barley, those with increased resistance to powdery mildew originated from the Czech Republic, and those characterized by favourable yield-forming characteristics originated from Germany or Great Britain [36,50]. Therefore, the collection assessed in this study of 431 barley accessions stored in the Polish Genebank included local varieties, old and modern varieties originating from Poland and other European countries, taking into account that the number of accessions in each sub-collection represents variability for regions of Europe: Central, Northern, Western, Southern, and Great Britain and Ireland. Based on this fact, division into sub-collections of old and modern varieties and regions of Europe made it possible to compare, in detail, the directional trends of selection in breeding programs not only for whole Europe, but also for the regions of Europe. Moreover, the wide variation of phenotypic traits within the evaluated collection made it possible to conduct GWAS and help to identify their loci. Quantitative and qualitative traits were described during this study, such as barley phenological and agronomic traits: DH, DMW, DM, PH, LT, SD, SL, NGS, GH, GHC1, GH, GT, GHC2, GC, and TGW.
The sub-collection representing Polish germplasm was the most numerous. It included not only old and modern varieties as with other sub-collections; but also Polish landrace which were not described before. Some barley genotypes representing Polish populations have been preliminarily studied, but not with European context. Their historical phenotypic characteristics needed to be updated, taking into account that the climate changing that occurred in the 21st century affected also Polish germplasm diversity [46,49]. Moreover, Polish accessions have not been included in other extensive studies of genetic variation in Europe and the world. Poland is a country where barley has been cultivated on a large scale, and one of the most extensive studies which described a collection of 22,626 from many genebanks did not include a sub-collection of Polish genotypes. Other studies on the ecographical differentiation of landraces and wild relatives in Europe do not take into account Polish germplasm [15,24,34,35,51,52]. In this study, phenotypic data were collected in one environment and in the two years 2018 and 2019. They enabled the determination of the diversity of the collection of 431 accessions of Polish and European barley, including terrestrial breeds and old varieties, stored at the Polish Genebank, and conduction of GWAS analysis. They were described as a source of resistance to major diseases and the most important agronomic traits.
Earliness is an important trait in terms of yield and plant adaptation to different growing environments. In this study, heading date was one of the traits which was used in the group “earliness”, describes the plants’ phenological development. It was described not as days to flowering [15], but instead as the appearance/emergence of the spike out of the flag leaf sheath, i.e., Z50–Z59 = the first spikelet of inflorescence just visible to the emergence of complete inflorescence [53]. Moreover, in this study earliness was described not only as number of days from sowing time to heading (DH), but also to the milky-waxy stage (DMW), to maturity (DM), and next till harvesting time. Fine adjustment of these traits is important for understanding other developmental traits such as leaf area, plant height, tillering, and grain number [54]. In this study, positive relationships were observed between the main phases of plant development. Based on the results, phenotypic per se under field conditions it was possible to observe that DH negatively correlated with plant height (PH) and important yield components such as number of grains per spike (NGS). Heading date (or days to flowering), is a trait that is controlled by many QTLs [54]. Reducing plant height has played an important role in improving crop yield [55].
The number of tillers per plant, number of grains per spike (NGS), and thousand-grain weight (TGW) directly determined yield potential. Agronomic traits, such as spike density (SD), main spike length (SL), spike number per plant (SNP), and grain weight per spike (GWS), could indirectly affect the yield [35,56,57].
Based on the phenotypic data, this study confirms the importance of DH for other phenotypic traits such as LT and PH and yield components, such as NGS. A negative correlation was between DH and RN or NGS. In addition, a negative relationship between LT and DH, DMW or PH was observed. GWAS for DH identified 5 MTAs on the chromosomes 1H, 2H, 3H, 5H, and 6H. For DMW, it identified 6 markers (on 1H, 2H, 4H, 5H, 6H, and UN), for DM 5 markers (one on 2H and two on 3H and 5H). Only one marker (7241263-17-G/A) was shared between DM, DPH, and SD this resided on 2H. Based on the results obtained in this research, it is possible to conclude that the highest significant associations were located on chromosome 2H, which is confirmed by other studies [15]. Muñoz-Amatriaín et al. [15] evaluated 2298 accessions and obtained results showing that the highest significant associations were located on chromosome 2H, BK_14 and 12_30871 within PPD-H1, and SCRI_RS_222769 and SCRI_RS_127347 coincident with EPS2. Results obtained by Wang et al. [55] demonstrate that a QTL for plant height was identified on 7H. This QTL showed no significant effects on the agronomic traits and yield components. In this study, GWAS for plant lodging (LT) scored in 2018 identified one MTA on chromosome 7H. Moreover, 88 MTAs for plant height were present on all chromosomes. Because of this, confirmation based on additional multi-environmental and multi-year experiments is required.
In this study, based on phenotypic data, it was not possible to find any relationship between SD and other agronomic traits. However, association results 7241263-17 correspond to the genomic region mapped for DM, DPH, and SD on chromosome 2H. NGS negatively correlated with DH, as described previously. Negative significant correlation was between DH and PH and NGS. RN strongly positively correlated with NGS and negatively with TGW. TGW strongly negatively correlated with row number and grain NGS, and positively with RN. Thirty-one markers were identified for agronomic yield traits: 16 significant MTAs for SD, 11 significant MTAs for NGS, and 4 MTAs significant for TGW. Two MTAs significant for SD were localized on chromosome 1H, five on 2H, two on 3H, one on 4H, one on 5H, four on 6H, and two on 7H. Three MTAs significant for TGW were localized on chromosomes 4H and one on 1H. For NGS, they were localized on chromosomes 2H (2 MTAs), 3H (2 MTAs), 4H (one MTA), 5H (two MTAs), 6H (three MTAs), and on 7H (one MTA). Marker 3258999-37-C/T on chromosome 2H significant for NGS, was closely located to results 3263044-31-G/T for SD, and 3263989-64-A/C for DMW. It was possible to identify marker 7241263-17 located on chromosome 2H significant for DM, DPH and SD. On chromosome 6H, closely located were markers significant for SD (3255466-35-C/G) and for NGS (3259102-57-C/A). Moreover, on chromosome 6H, closely located were markers significant for SD (3918801-14-G/A), for NGS (3666407-49-T/G), and for DMW (3663162-62-A/C).
Many other studies have been conducted to determine the QTLs underlying agronomical traits of barley [15,17,29,31,51]. Based on the research conducted by Wang et al. [57], a total of 71 of 111 significant QTLs for 10 agronomic traits were detected. Plant material was phenotyped in six environments. Six QTLs underlaying TGW were detected on chromosomes 2H, 5H and 7H. A total of 24 QTLs underlying SD were detected on chromosomes 2H, 4H and 7H. This on chromosome 7H had the main effect on SD, which was detected in three years. For SMS, a total of 27 QTLs were detected and they were dispersed on chromosomes 1H, 2H, 4H, and 7H. A total of 16 QTLs underlying grain per plant (GP) were detected on chromosomes 2H, 4H, 5H, 6H and 7H. For MSL, 18 QTLs were detected across the five environments: one each on chromosomes 3H and 6H, two each on chromosomes 1H and 4H, four and eight on chromosomes 7H and 2H, respectively. For SPD, 15 QTLs were identified across the five environments: one each on chromosomes 3H, 5H, and 6H, three on chromosome 7H, and nine on chromosome 2H. For SP, 5 QTLs were identified across the five environments: one on chromosome 5H, two each on chromosomes 2H and 7H. SLP, 4 QTLs were identified across the five environments: one each on chromosomes 4H and 7H, two on chromosome 2H.
Results of the presented study may be used to compare adult disease resistance for powdery mildew and rusts in barley germplasm. These traits are some of the most important in barley production and for breeding programs [36]. Based on the phenotypic results for PM (powdery mildew), BBR (barley brown rust), and stem rust resistance of the same plant material phenotyped in this study, scored at the barley heading (DH) and milky-waxy (DMW) seed stages, GWAS analysis identified 73 marker–trait associations (MTAs) with these traits. For PM resistance five MTAs were identified at both the DH stage, and when considering the maximal disease score across both growth stages and both years. One marker (3432490-28-T/C) was shared between these two traits; it is located on chromosome 4H. For BBR resistance, six MTAs at PH and one MTA at the MW stage in 2019 and seven MTAs, when considering the maximal disease score across both growth stages and both years, were identified. Of the 48 markers identified as being associated with SR resistance, 12 were on chromosome 7H, 1 was in the telomeric region of the short arm, and 7 were in the telomeric region of the long arm. Rpg1 has previously been mapped to 7HS.
The number of seeds available from the Genebank was small. Therefore, the results of phenotyping collected for GWAS analysis were obtained based on the experiments conducted in one location and, for some traits, only in one year. Therefore, this is a preliminary study that will be continued for the most diverse genotypes which were sequenced, and the data will be collected in more environments.
5. Conclusions
The presented study provided genotypic and phenotypic information on a diverse set of previously uncharacterised Polish Genebank barley, old European cultivars, and Polish landraces. Many different genomic regions were identified as responsible for phenological and phenotypic plant, seed, or spike traits.
The evaluated plant material is also a source of resistance to important diseases, such as powdery mildew or barley brown rust [36]. This confirmed findings in other studies that European old barley cultivars and landraces are an important source of genetic variation, which are already well adapted to European conditions. Genebanks play an important role in their proper maintenance and availability for breeders, farmers, or scientists. Therefore, this research was conducted to develop and implement a national management system for crop plant genetic resources as part of the AGROBANK project at the Polish Genebank (NCPGR) (https://agrobank.cdr.gov.pl/index.php (accessed on 29 October 2021)). It will play a leading role in incorporating the phenotypic and genotypic data of crop plants of agronomic importance to Polish agriculture and food production, such as wheat, barley, soybean, or pea (http://dane.agrobank.pcss.pl/jbrowse/ (accessed on 29 October 2021)).
For Polish Genebank, this platform plays an important role in the preservation of data, as some of the information kept on paper or computer files with phenotypical characteristics may have been lost during material exchange between genebanks. Assignments to genetically defined populations can thus complement written records and the expert knowledge of curators in charge of maintaining and evaluating accessions. Genetic profiles for many genetically diverse genebank accessions can guide conservation decisions and supplement incomplete passport records. Moreover, they constitute a permanent resource for connecting genetic diversity and phenotypic variation by means of association mapping.
Supplementary Materials
The following supporting information can be downloaded at: https://www.mdpi.com/article/10.3390/agronomy12092135/s1, Figure S1: Frequency distribution of the barley accessions based on phenological stages; Figure S2: Frequency distribution of the barley accessions based on the spike and seeds traits; Figure S3: Variability in spike shape and density, awn types and grain; Table S1: Phenotypic data collected for the GWAS panel across 2018–2019; Table S2: Summary statistic for the phenological stages; Table S3: Summary statistic for the spike and seeds traits; Table S4: Significant marker-trait associations (MTAs) for days to plants heading stage (DH), days to plants milky-waxy stage (DMW), days to plants maturity stage (DM), days to plants harvest stage (DPH), lodging tendency (LT), spike density (SD), grain per spike (NGS) and 1000—grain weight (TGW); Table S5: Significant marker-trait associations (MTAs) for plant height (PH).
Author Contributions
Conceptualization J.H.C. and E.C. Methodology: E.C. and J.H.C. Investigation: E.C. and J.H.C. Phenotypic assessment and statistical analysis of data, visualization: E.C. Project administration: E.C. Project co-ordinator and resources: J.H.C. All authors (E.C., J.H.C.) contributed to developing the first draft, reviewing and editing the manuscript. All authors have read and agreed to the published version of the manuscript.
Funding
This platform is a part of the https://agrobank.cdr.gov.pl/index.php (accessed on 25 July 2022) project “Creation of bioinformatic management system about national genetic resources of useful plants and development of social and economic resources of Poland throughout the protection and use of them in the process of providing agricultural consulting services” (1/394826/10/NCBR/2018) financed by the National Center for Research and Development as part of the 1st round of competitive research grants under the strategic research and development program GOSPOSTRATEG “Social And Economic Development Of Poland In The Context Of Globalizing Markets”.
Institutional Review Board Statement
Not applicable.
Informed Consent Statement
Not applicable.
Data Availability Statement
Data are available in tables. Contact person is Jerzy H. Czembor, IHAR-PIB Radzikow.
Acknowledgments
We thank the Polish Genebank (National Centre for Plant Genetic Resources—KCRZG at the Plant Breeding and Acclimatization Institute—National Research Institute, Radzikow, Poland) for providing seed samples; Radoslaw Suchecki (CSIRO Agriculture and Food, Urrbrae, SA 5064, Australia for help in creating platform and for Nathan S. Watson-Haigh (South Australian Genomics Centre, SAHMRI, North Terrace, Adelaide SA 5000, Australia) for bioinformatics analysis and help in creating platform.
Conflicts of Interest
The authors declare no conflict of interest.
References
- Baik, B.K.; Ullrich, S.E. Barley for food: Characteristics, improvement, and renewed interest. J. Cereal Sci. 2008, 48, 233–242. [Google Scholar] [CrossRef]
- Sullivan, P.; Arendt, E.; Gallagher, E. The increasing use of barley and barley by-products in the production of healthier baked goods. Trends Food Sci. Technol. 2013, 29, 124–134. [Google Scholar] [CrossRef]
- Cleveland, D.A.; Soleri, D.; Smith, S.E. A biological framework for understanding farmers~plant breeding 1. Econ. Bot. 2000, 54, 377–394. [Google Scholar] [CrossRef]
- Khoury, C.K.; Bjorkman, A.D.; Dempewolf, H.; Ramirez-Villegas, J.; Guarino, L.; Jarvis, A.; Rieseberg, L.H.; Struik, P.C. Increasing homogeneity in global food supplies and the implications for food security. Proc. Natl. Acad. Sci. USA 2014, 111, 4001–4006. [Google Scholar] [CrossRef]
- Marselle, M.R.; Stadler, J.; Korn, H.; Irvine, K.N.; Bonn, A. Correction to: Biodiversity and Health in the Face of Climate Change; Springer: Berlin/Heidelberg, Germany, 2019; ISBN 9783030023171. [Google Scholar]
- Rebetzke, G.J.; Jimenez-Berni, J.; Fischer, R.A.; Deery, D.M.; Smith, D.J. Review: High-throughput phenotyping to enhance the use of crop genetic resources. Plant Sci. 2019, 282, 40–48. [Google Scholar] [CrossRef]
- Westengen, O.T.; Skarbø, K.; Mulesa, T.H.; Berg, T. Access to genes: Linkages between genebanks and farmers’ seed systems. Food Secur. 2018, 10, 9–25. [Google Scholar] [CrossRef]
- Raggi, L.; Caproni, L.; Negri, V. Landrace added value and accessibility in Europe: What a collection of case studies tells us. Biodivers. Conserv. 2021, 30, 1031–1048. [Google Scholar] [CrossRef]
- Nguyen, G.N.; Norton, S.L. Genebank phenomics: A strategic approach to enhance value and utilization of crop germplasm. Plants 2020, 9, 817. [Google Scholar] [CrossRef]
- Halewood, M.; Jamora, N.; Noriega, I.L.; Anglin, N.L.; Wenzl, P.; Payne, T.; Ndjiondjop, M.N.; Guarino, L.; Lava Kumar, P.; Yazbek, M.; et al. Germplasm acquisition and distribution by cgiar genebanks. Plants 2020, 9, 1296. [Google Scholar] [CrossRef]
- Volk, G.M.; Bretting, P.K.; Byrne, P.F. Survey identifies essential plant genetic resources training program components. Crop Sci. 2019, 59, 2308–2316. [Google Scholar] [CrossRef] [Green Version]
- Gaffney, J.; Tibebu, R.; Bart, R.; Beyene, G.; Girma, D.; Kane, N.A.; Mace, E.S.; Mockler, T.; Nickson, T.E.; Taylor, N.; et al. Open access to genetic sequence data maximizes value to scientists, farmers, and society. Glob. Food Sec. 2020, 26, 100411. [Google Scholar] [CrossRef]
- Caldwell, K.S.; Russell, J.; Langridge, P.; Powell, W. Extreme population-dependent linkage disequilibrium detected in an inbreeding plant species, Hordeum vulgare. Genetics 2006, 172, 557–567. [Google Scholar] [CrossRef] [PubMed]
- Milner, S.G.; Jost, M.; Taketa, S.; Mazón, E.R.; Himmelbach, A.; Oppermann, M.; Weise, S.; Knüpffer, H.; Basterrechea, M.; König, P.; et al. Genebank genomics highlights the diversity of a global barley collection. Nat. Genet. 2019, 51, 319–326. [Google Scholar] [CrossRef] [PubMed]
- Muñoz-Amatriaín, M.; Cuesta-Marcos, A.; Endelman, J.B.; Comadran, J.; Bonman, J.M.; Bockelman, H.E.; Chao, S.; Russell, J.; Waugh, R.; Hayes, P.M.; et al. The USDA barley core collection: Genetic diversity, population structure, and potential for genome-wide association studies. PLoS ONE 2014, 9, e94688. [Google Scholar] [CrossRef]
- Marone, D.; Russo, M.A.; Mores, A.; Ficco, D.B.M.; Laidò, G.; Mastrangelo, A.M.; Borrelli, G.M. Importance of landraces in cereal breeding for stress tolerance. Plants 2021, 10, 1267. [Google Scholar] [CrossRef]
- Ingvordsen, C.H.; Backes, G.; Lyngkjær, M.F.; Peltonen-Sainio, P.; Jahoor, A.; Mikkelsen, T.N.; Jørgensen, R.B. Genome-wide association study of production and stability traits in barley cultivated under future climate scenarios. Mol. Breed. 2015, 35, 84. [Google Scholar] [CrossRef]
- Rasheed, A.; Hao, Y.; Xia, X.; Khan, A.; Xu, Y.; Varshney, R.K.; He, Z. Crop Breeding Chips and Genotyping Platforms: Progress, Challenges, and Perspectives. Mol. Plant 2017, 10, 1047–1064. [Google Scholar] [CrossRef]
- CGIAR Genebank Platform. Available online: https://www.genebanks.org/ (accessed on 25 July 2022).
- Volk, G.M.; Byrne, P.F.; Coyne, C.J.; Flint-Garcia, S.; Reeves, P.A.; Richards, C. Integrating Genomic and Phenomic Approaches to Support Plant Genetic Resources Conservation and Use. Plants 2021, 10, 2260. [Google Scholar] [CrossRef]
- Elshire, R.J.; Glaubitz, J.C.; Sun, Q.; Poland, J.A.; Kawamoto, K.; Buckler, E.S.; Mitchell, S.E. A robust, simple genotyping-by-sequencing (GBS) approach for high diversity species. PLoS ONE 2011, 6, e19379. [Google Scholar] [CrossRef]
- Baird, S.J.E. Exploring linkage disequilibrium. Mol. Ecol. Resour. 2015, 15, 1017–1019. [Google Scholar] [CrossRef] [Green Version]
- Long, N.V.; Dolstra, O.; Malosetti, M.; Kilian, B.; Graner, A.; Visser, R.G.F.; van der Linden, C.G. Association mapping of salt tolerance in barley (Hordeum vulgare L.). Theor. Appl. Genet. 2013, 126, 2335–2351. [Google Scholar] [CrossRef] [PubMed]
- Sharma, R.; Draicchio, F.; Bull, H.; Herzig, P.; Maurer, A.; Pillen, K.; Thomas, W.T.B.; Flavell, A.J. Genome-wide association of yield traits in a nested association mapping population of barley reveals new gene diversity for future breeding. J. Exp. Bot. 2018, 69, 3811–3822. [Google Scholar] [CrossRef] [PubMed]
- Alqudah, A.M.; Sallam, A.; Stephen Baenziger, P.; Börner, A. GWAS: Fast-forwarding gene identification and characterization in temperate Cereals: Lessons from Barley—A review. J. Adv. Res. 2020, 22, 119–135. [Google Scholar] [CrossRef]
- Gutiérrez, L.; Germán, S.; Pereyra, S.; Hayes, P.M.; Pérez, C.A.; Capettini, F.; Locatelli, A.; Berberian, N.M.; Falconi, E.E.; Estrada, R.; et al. Multi-environment multi-QTL association mapping identifies disease resistance QTL in barley germplasm from Latin America. Theor. Appl. Genet. 2015, 128, 501–516. [Google Scholar] [CrossRef] [PubMed]
- Turuspekov, Y.; Ormanbekova, D.; Rsaliev, A.; Abugalieva, S. Genome-wide association study on stem rust resistance in Kazakh spring barley lines. BMC Plant Biol. 2016, 16, 13–21. [Google Scholar] [CrossRef]
- Ziems, L.A.; Hickey, L.T.; Platz, G.J.; Franckowiak, J.D.; Dracatos, P.M.; Singh, D.; Park, R.F. Characterization of Rph24: A gene conferring adult plant resistance to puccinia hordei in Barley. Phytopathology 2017, 107, 834–841. [Google Scholar] [CrossRef]
- Berger, G.L.; Liu, S.; Hall, M.D.; Brooks, W.S.; Chao, S.; Muehlbauer, G.J.; Baik, B.K.; Steffenson, B.; Griffey, C.A. Marker-trait associations in Virginia Tech winter barley identified using genome-wide mapping. Theor. Appl. Genet. 2013, 126, 693–710. [Google Scholar] [CrossRef]
- Gutiérrez, L.; Cuesta-Marcos, A.; Castro, A.J.; von Zitzewitz, J.; Schmitt, M.; Hayes, P.M. Association Mapping of Malting Quality Quantitative Trait Loci in Winter Barley: Positive Signals from Small Germplasm Arrays. Plant Genome 2011, 4, 256–272. [Google Scholar] [CrossRef]
- Li, Z.; Lhundrup, N.; Guo, G.; Dol, K.; Chen, P.; Gao, L.; Chemi, W.; Zhang, J.; Wang, J.; Nyema, T.; et al. Gu in Qingke Barley (Hordeum Vulgare L.) in the Qinghai-Tibet Plateau. Front. Genet. 2020, 11, 638. [Google Scholar] [CrossRef]
- Almerekova, S.; Genievskaya, Y.; Abugalieva, S.; Sato, K.; Turuspekov, Y. Population structure and genetic diversity of two-rowed barley accessions from kazakhstan based on snp genotyping data. Plants 2021, 10, 2025. [Google Scholar] [CrossRef]
- Ramsay, L.; Comadran, J.; Druka, A.; Marshall, D.F.; Thomas, W.T.B.; MacAulay, M.; MacKenzie, K.; Simpson, C.; Fuller, J.; Bonar, N.; et al. INTERMEDIUM-C, a modifier of lateral spikelet fertility in barley, is an ortholog of the maize domestication gene TEOSINTE BRANCHED 1. Nat. Genet. 2011, 43, 169–172. [Google Scholar] [CrossRef] [PubMed]
- Pasam, R.K.; Sharma, R.; Malosetti, M.; van Eeuwijk, F.A.; Haseneyer, G.; Kilian, B.; Graner, A. Genome-wide association studies for agronomical traits in a world wide spring barley collection. BMC Plant Biol. 2012, 12, 16. [Google Scholar] [CrossRef] [PubMed]
- Wang, M.; Jiang, N.; Jia, T.; Leach, L.; Cockram, J.; Waugh, R.; Ramsay, L.; Thomas, B.; Luo, Z. Genome-wide association mapping of agronomic and morphologic traits in highly structured populations of barley cultivars. Theor. Appl. Genet. 2012, 124, 233–246. [Google Scholar] [CrossRef] [PubMed]
- Czembor, J.H.; Czembor, E.; Suchecki, R.; Watson-haigh, N.S. Genome-Wide Association Study for Powdery Mildew and Rusts Adult Plant Resistance in European Spring Barley from Polish Gene Bank. Agronomy 2022, 12, 7. [Google Scholar] [CrossRef]
- Casañas, F.; Simó, J.; Casals, J.; Prohens, J.; Bradshaw, J.E. Toward an Evolved Concept of Landrace. Front. Plant Sci. 2017, 8, 145. [Google Scholar] [CrossRef]
- Mascher, M.; Gundlach, H.; Himmelbach, A.; Beier, S.; Twardziok, S.O.; Wicker, T.; Radchuk, V.; Dockter, C.; Hedley, P.E.; Russell, J.; et al. A chromosome conformation capture ordered sequence of the barley genome. Nature 2017, 544, 427–433. [Google Scholar] [CrossRef]
- Czembor, E.; Czembor, J.H.; Suchecki, R.; Haigh, N.S.W. DArT—Based evaluation of soybean germplasm from Polish Gene Bank. BMC Res. Notes 2021, 14, 343. [Google Scholar] [CrossRef]
- Gruber, B.; Unmack, P.J.; Berry, O.F.; Georges, A. dartr: An r package to facilitate analysis of SNP data generated from reduced representation genome sequencing. Mol. Ecol. Resour. 2018, 18, 691–699. [Google Scholar] [CrossRef]
- Paradis, E. Pegas: An R package for population genetics with an integrated-modular approach. Bioinformatics 2010, 26, 419–420. [Google Scholar] [CrossRef]
- Huang, M.; Liu, X.; Zhou, Y.; Summers, R.M.; Zhang, Z. BLINK: A package for the next level of genome-wide association studies with both individuals and markers in the millions. Gigascience 2018, 8, 1–12. [Google Scholar] [CrossRef] [Green Version]
- König, P.; Beier, S.; Basterrechea, M.; Schüler, D.; Arend, D.; Mascher, M.; Stein, N.; Scholz, U.; Lange, M. BRIDGE—A Visual Analytics Web Tool for Barley Genebank Genomics. Front. Plant Sci. 2020, 11, 701. [Google Scholar] [CrossRef] [PubMed]
- Jia, J.; Li, H.; Zhang, X.; Li, Z.; Qiu, L. Genomics-based plant germplasm research (GPGR). Crop J. 2017, 5, 166–174. [Google Scholar] [CrossRef]
- Crossa, J.; Pérez-Rodríguez, P.; Cuevas, J.; Montesinos-López, O.; Jarquín, D.; de los Campos, G.; Burgueño, J.; González-Camacho, J.M.; Pérez-Elizalde, S.; Beyene, Y.; et al. Genomic Selection in Plant Breeding: Methods, Models, and Perspectives. Trends Plant Sci. 2017, 22, 961–975. [Google Scholar] [CrossRef] [PubMed]
- Dziurdziak, J.; Bolc, P.; Wlodarczyk, S.; Puchta, M.; Gryziak, G.; Podyma, W.; Boczkowska, M. Multifaceted analysis of barley landraces collected during gene bank expeditions in poland at the end of the 20th century. Agronomy 2020, 10, 1958. [Google Scholar] [CrossRef]
- Piechota, U.; Czembor, P.C.; Czembor, J.H. Evaluating barley landraces collected in North Africa and the Middle East for powdery mildew infection at seedling and adult plant stages. Cereal Res. Commun. 2020, 48, 179–185. [Google Scholar] [CrossRef]
- Czembor, J.H.; Czembor, E. Mlo resistance to powdery mildew (Blumeria graminis f. sp. hordei) in barley landraces collected in Yemen. Agronomy 2021, 11, 1582. [Google Scholar] [CrossRef]
- Dziurdziak, J.; Podyma, W.; Bujak, H. Tracking Changes in the Spring Barley Gene Pool in Poland during 120 Years of Breeding. Int. J. Mol. Sci. 2022, 23, 4553. [Google Scholar] [CrossRef]
- Friedt, W.; Horsley, R.D.; Poulsen, D.; Government, Q.; Lance, R.C.M.; Ceccarelli, S.; Grando, S.; Capettini, F. Barley Breeding History, Progress, Objectives, and Technology; Ullrich, S.E., Ed.; Blackwell Publishing: Hoboken, NJ, USA, 2011; 637p, ISBN 9780470958636. [Google Scholar]
- Tsai, H.Y.; Janss, L.L.; Andersen, J.R.; Orabi, J.; Jensen, J.D.; Jahoor, A.; Jensen, J. Genomic prediction and GWAS of yield, quality and disease-related traits in spring barley and winter wheat. Sci. Rep. 2020, 10, 3347. [Google Scholar] [CrossRef]
- Karagöz, A.; Özbek, K.; Akar, T.; Ergün, N.; Aydoğan, S.; Sayim, İ. Agro-morphological variation among an ancient world barley collection. Tarim Bilim. Derg. 2017, 23, 444–452. [Google Scholar] [CrossRef]
- Alqudah, A.M.; Schnurbusch, T. Heading date is not flowering time in spring barley. Front. Plant Sci. 2017, 8, 896. [Google Scholar] [CrossRef] [Green Version]
- Fernández, M.; Ana, C.; Ernesto, M.C. Major Flowering Time Genes of Barle: Allelic Diversity, Effects, and Comparison with Wheat; Springer: Berlin/Heidelberg, Germany, 2021; Volume 134, ISBN 0123456789. [Google Scholar]
- Wang, J.; Yang, J.; Jia, Q.; Zhu, J.; Shang, Y.; Hua, W.; Zhou, M. A New QTL for Plant Height in Barley (Hordeum vulgare L.) Showing No Negative Effects on Grain Yield. PLoS ONE 2014, 9, e90144. [Google Scholar] [CrossRef] [PubMed]
- Wenzl, P.; Li, H.; Carling, J.; Zhou, M.; Raman, H.; Paul, E.; Hearnden, P.; Maier, C.; Xia, L.; Caig, V.; et al. A high-density consensus map of barley linking DArT markers to SSR, RFLP and STS loci and agricultural traits. BMC Genom. 2006, 7, 299–305. [Google Scholar] [CrossRef] [PubMed]
- Wang, J.; Sun, G.; Ren, X.; Li, C.; Liu, L.; Wang, Q.; Du, B.; Sun, D. QTL underlying some agronomic traits in barley detected by SNP markers. BMC Genet. 2016, 7, 103. [Google Scholar] [CrossRef] [PubMed] [Green Version]
Publisher’s Note: MDPI stays neutral with regard to jurisdictional claims in published maps and institutional affiliations. |
© 2022 by the authors. Licensee MDPI, Basel, Switzerland. This article is an open access article distributed under the terms and conditions of the Creative Commons Attribution (CC BY) license (https://creativecommons.org/licenses/by/4.0/).