Article

Quantifying Nutrient and Economic Consequences of Residue Loss from Harvest Weed Seed Control

by
Matthew P. Spoth
1,
Lauren M. Schwartz-Lazaro
2,
Gabrielle L. LaBiche
2,
Wade E. Thomason
1,
Kevin W. Bamber
1 and
Michael L. Flessner
1,*
1
School of Plant and Environmental Sciences, Virginia Tech, Blacksburg, VA 24060, USA
2
School of Plant, Environmental and Soil Sciences, Louisiana State University AgCenter, Baton Rouge, LA 70803, USA
*
Author to whom correspondence should be addressed.
Agronomy 2022, 12(9), 2028; https://doi.org/10.3390/agronomy12092028
Submission received: 19 July 2022 / Revised: 20 August 2022 / Accepted: 24 August 2022 / Published: 26 August 2022

Abstract

:
Harvest weed seed control (HWSC) methods destroy, remove, or concentrate weed seeds collected during harvest. Depending on the method of HWSC, chaff and straw fractions may also be destroyed, removed, or concentrated. Observations at soybean (Glycine max (L.) Merr.) harvest in this study estimated the distribution of aboveground biomass between seed, straw, and chaff fractions and the nutrient composition of straw and chaff. Measurements were combined to predict nutrient consequences of HWSC, which have not been documented. The average harvest index of soybean was 0.57:1. Soybean biomass that enters the combine partitions into 7.25 ± 0.37% chaff, 36.05 ± 1.2% straw, and 56.7 ± 1.2% seed. Chaff and straw residues equal 13.4% and 68.5% of the seed weight, respectively. In a soybean crop yielding 3368 kg ha−1 (50 bu a−1), chaff yields 9.4, 0.8, 5.0, and 0.6 kg ha−1 and straw 31.6, 2.1, 1.1, and 2.0 kg ha−1 of N, P, K, and S, respectively. Using 5-year average fertilizer prices ending in 2021, the cost to replace chaff, straw, and the combination of both residues is USD 1.58, USD 5.88, and USD 7.46, respectively. These results give insight into the nutrient consequences and replacement costs of HWSC.

1. Introduction

Herbicides are a very effective tool that allow producers to maximize weed control and maintain crop yield. Although still an integral part of conventional crop production, a looming threat of herbicide-resistant (HR) weeds jeopardizes global agriculture [1,2]. As the number of unique cases worldwide rises above 500, herbicide discovery programs decrease and regulations prohibit the use of older chemical formulations, and the longevity of our current management regime is questioned [3,4,5]. HR can increase labor requirements, decrease crop productivity, and negatively affect soil health [6]. Although there are potentially effective herbicidal antidotes to weed resistance, forgoing the diversification of weed management tactics may lead to the development of resistance to the alternative “solution” herbicide, more multiple-resistant populations among fields, and potentially doubled production costs [7,8,9]. Recent trends indicate an increased interest in alternative control strategies, with one such example being harvest weed seed control (HWSC) [1,10,11].
HWSC is an overarching theme used to describe a variety of technologies and practices designed to capture and either concentrate, remove, or destroy weed seeds during crop harvest [5,12,13,14]. Under conventional management, weed seeds would typically be dispersed back across the field after being separated from the grain within the combine. HWSC, however, can be employed to attenuate such seeds bound for the weed seedbank. The many different systems of HWSC include narrow windrow burning, chaff lining, chaff tramlining, chaff removal carts, bale direct, and seed impact mills (described by Refs. [5,15]). Although worldwide adoption is limited, HWSC practices have been well-established in Australian crop production, where, as of 2017, 43% of growers routinely used some form of HWSC [12]. HWSC is recognized as a pre-emptive action to limit competition and seedbank longevity from problematic weed species, including those that are or have the potential of becoming HR [15,16]. For example, by destroying only 50% of weed seed prior to being deposited in the seedbank, resistance development may be delayed by nearly 10 years [17]. HWSC is a tool that has been shown to reliably, practically, and economically manage nuisance weeds across our cropping systems [18].
Although research has shown that HWSC systems are similarly effective, each method varies in ease of use, combine modifications, capital expenses, and labor requirements [12,19]. Additionally, nutrient and cost consequences from removing or condensing crop residues during HWSC operations are common in all systems except seed impact mills [13]. For example, methods such as narrow windrow burning and bale direct target both the chaff and straw fractions, while chaff lining and chaff tramlining only result in the concentration of the chaff, therefore creating varying degrees of removal or concentration [20]. Crop residues returned to the soil can play an important role in the following crop production as they decompose and release nutrients [21]. If removed or concentrated, replacement with fertilizer may be necessary. Estimations of the amount and distribution of nutrients in crop fractions are important to allow for an accurate comparison of cost between conventional and the multiple HWSC systems.
The harvest index (HI) of a crop is the grain or seed yield in relation to total aboveground biomass, i.e., the combined grain/seed + straw + chaff fractions. HI gives some insight into the breakdown of aboveground biomass production; however, going one step further to determine seed yield in relation to chaff and straw separately is important in the scope of HWSC. Crop yield is the primary dictator of chaff and straw production; however, additional variables, such as combine header size, combine threshing type, and crop and environmental conditions at harvest, also influence amounts. Knowing each factor of the chaff + straw + grain breakdown is critical in determining the nutrient cost incurred by HWSC.
HI estimates are well-established in winter wheat (Triticum aestivum L.). Multiple publications report the total weight of straw plus chaff is nearly equivalent to grain weight. HI estimations fell within 0.400:1 to 0.550:1, or 400 to 550 g of chaff + straw per kg of grain [22,23,24,25]. Observations by Aase and Siddoway [22] indicate that HI is static across a wide range of wheat yields. While HI is relatively stable, the constituent parts of straw and chaff for the aboveground biomass fraction vary. The chaff-to-straw ratio is not consistent due to timing of crop, weather, moisture content, and quality or type of combining [25]. For example, Broster et al. [26] found a draper front-style combine produced over twice the amount of chaff compared to a stripper front. Furthermore, the stripper front produced around 20 kg chaff 100 m−1, and the draper produced around 45 kg 100 m−1. A review of what has been found to date in the literature for wheat is included in Table 1. Chaff values fell within the range of 9.6 to 37% of aboveground biomass, or 17 to 38% of grain yield, and straw totaled 38 to 67% of aboveground biomass. Consideration of all available research gives us an estimate of how much wheat chaff and straw will be produced during harvest operations.
Furthermore, nutrient content differed between crop residues, influencing the consequences of different HWSC systems. These values are well-reported in wheat due to the possible contributions of residues to animal nutrition. Differences are in part due to cereal straw composition of senesced leaf and stem material, while the chaff fraction is composed of smaller particles, such as glumes, hulls, parts of heads, short straw, leaf materials, weed seeds, and whole or cracked kernels separated from harvested grain [25]. Kernan et al. [29] evaluated six wheat cultivars in two separate trials and observed average crude protein content from each trial for stems of 26 and 29 g kg−1 dry matter, leaves 53 and 62 g kg−1 dry matter, and chaff 43 and 74 g kg−1 dry matter, while a similar study found crude protein content of wheat chaff was 17 g kg−1 [37]. Stems found in straw had the least nutritional feed value, which can be applied to residue removal estimations. Furthermore, Broster and Walsh [27] estimated that S concentration was double that of chaff than straw, and there was approximately 20% more N in chaff, although the largest nutrient difference, being K, was five times higher in straw than chaff.
Combining wheat harvest residue production values and nutrient composition estimates allows for an accurate prediction of nutrient concentration or removal, as exhibited by Broster and Walsh [27]. HWSC methods that target both straw and chaff in a wheat crop yielding 2.4 t ha−1 on average remove 10.0, 0.7, 18.8, and 1.4 kg ha−1 of N, P, K, and S, respectively, during harvest. When HWSC approaches only concentrate or remove chaff, the degree of removal is reduced by 51%, 56%, 86%, and 66%, or 4.8, 0.3, 2.5, and 0.5 kg ha−1 less of N, P, K, and S, respectively, per year [27]. Walsh et al. [5] cites that chaff production continues to play a critical role in the development of HWSC systems, and additional research needs to determine chaff production in species other than wheat.
Information on the chaff + straw + seed breakdown and nutrient composition of soybean (Glycine max (L.) Merr.) fractions, however, is less common. The HI estimate is well-established and can be expected to fall in the range of 0.397:1 to 0.513:1 [38]. HI estimates have varied slightly due to variety and plant competition (0.5:1 to 0.54:1), but they remained consistent across planting density, plant size at harvest, photoperiod, environmental stressors early in plant development, and yield [39]. Green et al. [40], however, are the only ones to investigate chaff and straw amounts in relation to soybean seed. Using a Case 2388 combine in Keiser, AR, USA, they found that biomass for chaff, straw, and seed was 27, 22, and 51% in 2014 and 15, 36, and 49% in 2015, respectively. To determine the efficacy of a stationary Harrington Seed Destructor, Schwartz-Lazaro et al. [41] used an HI estimate of 55% for a typical soybean crop, but further breakdown of the amount of chaff and straw in the 55% was not reported. The amount of chaff produced during harvest must be considered when weighing the practicalities, as well as the efficacy, of HWSC systems. Without a reliable HI estimate for soybeans, this relationship is difficult to understand.
In similar fashion to wheat, decomposing soybean residues added at harvest promote nutrient recycling and enhance soil properties [42]. However, the C:N ratio characteristic of soybean crop residue has greater potential than cereal residues to contribute to plant nutrition and nutrient deposition into the soil profile. It was found that, 400 days after the amendment of soybean residues, mineralization resulted in NO−3- N values in the soil of 342.1 μg g−1 dry matter, which equated to a 401.5% increase. Over the sampling period, increases were also observed in soil K, Mg, and Ca [42]. Complete return of soybean residues can influence soil nutrient dynamics; however, the specific partitioning of nutrients within soybean fractions is unknown.
Therefore, to accurately quantify the nutrient consequences of the various forms of HWSC in soybean systems, the objectives of this study were to determine the relationship between soybean chaff, straw, and seed fraction biomass, as well as to analyze chaff and straw for nutrient content. The authors hypothesize nutrient losses are inherent across the field in HWSC systems that remove or concentrate chaff or straw as opposed to conventional harvest. However, nutrient content and differences in residue distribution across the field, dictated by HWSC method, will result in different consequences between systems.

2. Materials and Methods

Observations of harvest residues’ biomass and nutrient composition were collected from soybean fields in the eastern USA at Kentland Farm, Blacksburg, VA, USA (37.1932° N, −80.5734° W), Southern Piedmont Agricultural Research and Extension Center, Blackstone, VA, USA (37.0830° N, −77.9736° W), Lanexa, VA, USA (37.5412° N, −76.8903° W), Cape Charles, VA, USA (37.3586° N, −75.9475° W), USDA Beltsville Agricultural Research Center, Beltsville, MD, USA (39.0282° N, −76.8962° W), and Alexandria, LA, USA (31.1789° N, −92.3986° W). Data were collected in the fall of 2020 and 2021, coinciding with soybean harvest. Plot sizes were 1.5 m × 30.5 m when using a plot combine (Winterstieger Classic; Wintersteiger AG, Ried im Innkreis, Austria) or 9.1 m × 30.5 m with a commercial combine. A range of 8 to 11 replications were collected in Virginia fields, and 3 observations were recorded in each Louisiana location. All plots were randomly arranged in weed-free fields with the goal of a range of soybean yields in the overall data set. The number of observations (n) is listed alongside each statistic.
Multiple methods of chaff and straw collection were used to document the nutritional composition and aboveground biomass distribution. In Blacksburg, Lanexa, and Blackstone, chaff and straw were collected using a device fitted onto the back of a Wintersteiger Classic combine with a 1.5 m small grain header. In Cape Charles, harvest residues were captured using nets as they were dispensed out of a John Deere S680 (Deere and Company, Moline, IL, USA) combine outfitted with a Redekop Seed Control Unit (Redekop Manufacturing Company, Saskatoon, SK, Canada). In Beltsville, chaff and straw were captured using a combination of mesh bags and tarps from a John Deere S660 with a Redekop Seed Control Unit. In all Louisiana locations, tarps were attached behind a Case IH, Tier III Rotary Combine (Case IH, Racine, WI, USA). During harvest at all locations, soybean yield and seed moisture were recorded. After straw and chaff volumes from the collection pass were weighed, a random subsample of chaff and straw from each pass was collected. This sample was subsequently dried to obtain percent moisture at the time of harvest and ground using a Wiley mill (Thomas Scientific, Swedesboro, NJ, United States) fitted with a 1 mm sieve. For nutrient composition analysis, 30 g was sent to Waters Agricultural Laboratories Incorporated (Warsaw, NC, USA), where the sample was subjected to the basic plant tissue test via wet digestion analysis with an inductively coupled argon plasma emission spectrophotometer/vacuum (ICP) [43]. Nutrients of interest that were analyzed included nitrogen (N), phosphorus (P), potassium (K), sulfur (S), Magnesium (Mg), Calcium (Ca), Boron (B), Zinc (Zn), Manganese (Mn), Iron (Fe), and Copper (Cu).
Data were pooled across site-year and then analyzed using JMP Pro 15 (SAS Institute, Cary, NC, USA) to calculate simple statistics of nutritional content and fraction biomass. N, P, K, and S statistics were reported using a box-and-whisker plot. To analyze the economic loss from HWSC systems, N, P, and K fertilizer prices were obtained from monthly DTN Fertilizer Reports [44] and S from weekly USDA AMS North Carolina, USA production cost reports [45]. From these reports, 5-year average fertilizer costs were calculated, ending in 2021. Nutrients included in the cost analysis were limited to N (Urea), P (MAP), K (Potash), and S (Ammonium sulfate). Losses were given a value by comparing each nutrients’ content in the harvest residue fraction to the fertilizer nutrient content. Based on inherent characteristics of each HWSC system and the amount of harvest residue lost from the field or concentrated, economic consequences due to chaff and straw fate could then be calculated for each system. Removal estimates were calculated at an average soybean yield of 3368 kg ha−1 (50 bu A−1), corresponding to the approximate US national average soybean yield. Similar to Broster and Walsh [27], for bale direct, all straw and chaff nutrients were assumed lost. In narrow windrow burning, all straw and chaff nutrients were also assumed lost despite the possibility of some nutrient deposition within windrows following burning. In addition, the loss of standing stubble beneath narrow windrows due to burning was not considered. For chaff lining/tramlining and chaff carts, only the chaff fraction losses were used to estimate cost [27]. In chaff lining/tramlining, chaff is not removed from the field but rather concentrated. The lack of distribution across the field necessitates nutrient replacement; therefore, chaff nutrients are considered lost for the purpose of economic analysis.

3. Results

3.1. Harvest Index of Soybean

Across all samples, the average HI of soybean was 0.57:1 ± 0.1%, with a range of observations from 0.40:1 to 0.76:1. Furthermore, the constituents of soybean aboveground biomass were 7.25 ± 0.37, 36.05 ± 1.2, and 56.7 ± 1.2% chaff, straw, and seed, respectively (Table 2). For each unit of seed harvested, an amount equal to 13.4% and 68.5% of that weight of chaff and straw, respectively, will be produced. Based on these estimates, a soybean crop yielding 3368 kg ha−1 (50 bu a−1) will also result in the production of 451 kg ha−1 chaff and 2305 kg ha−1 straw.

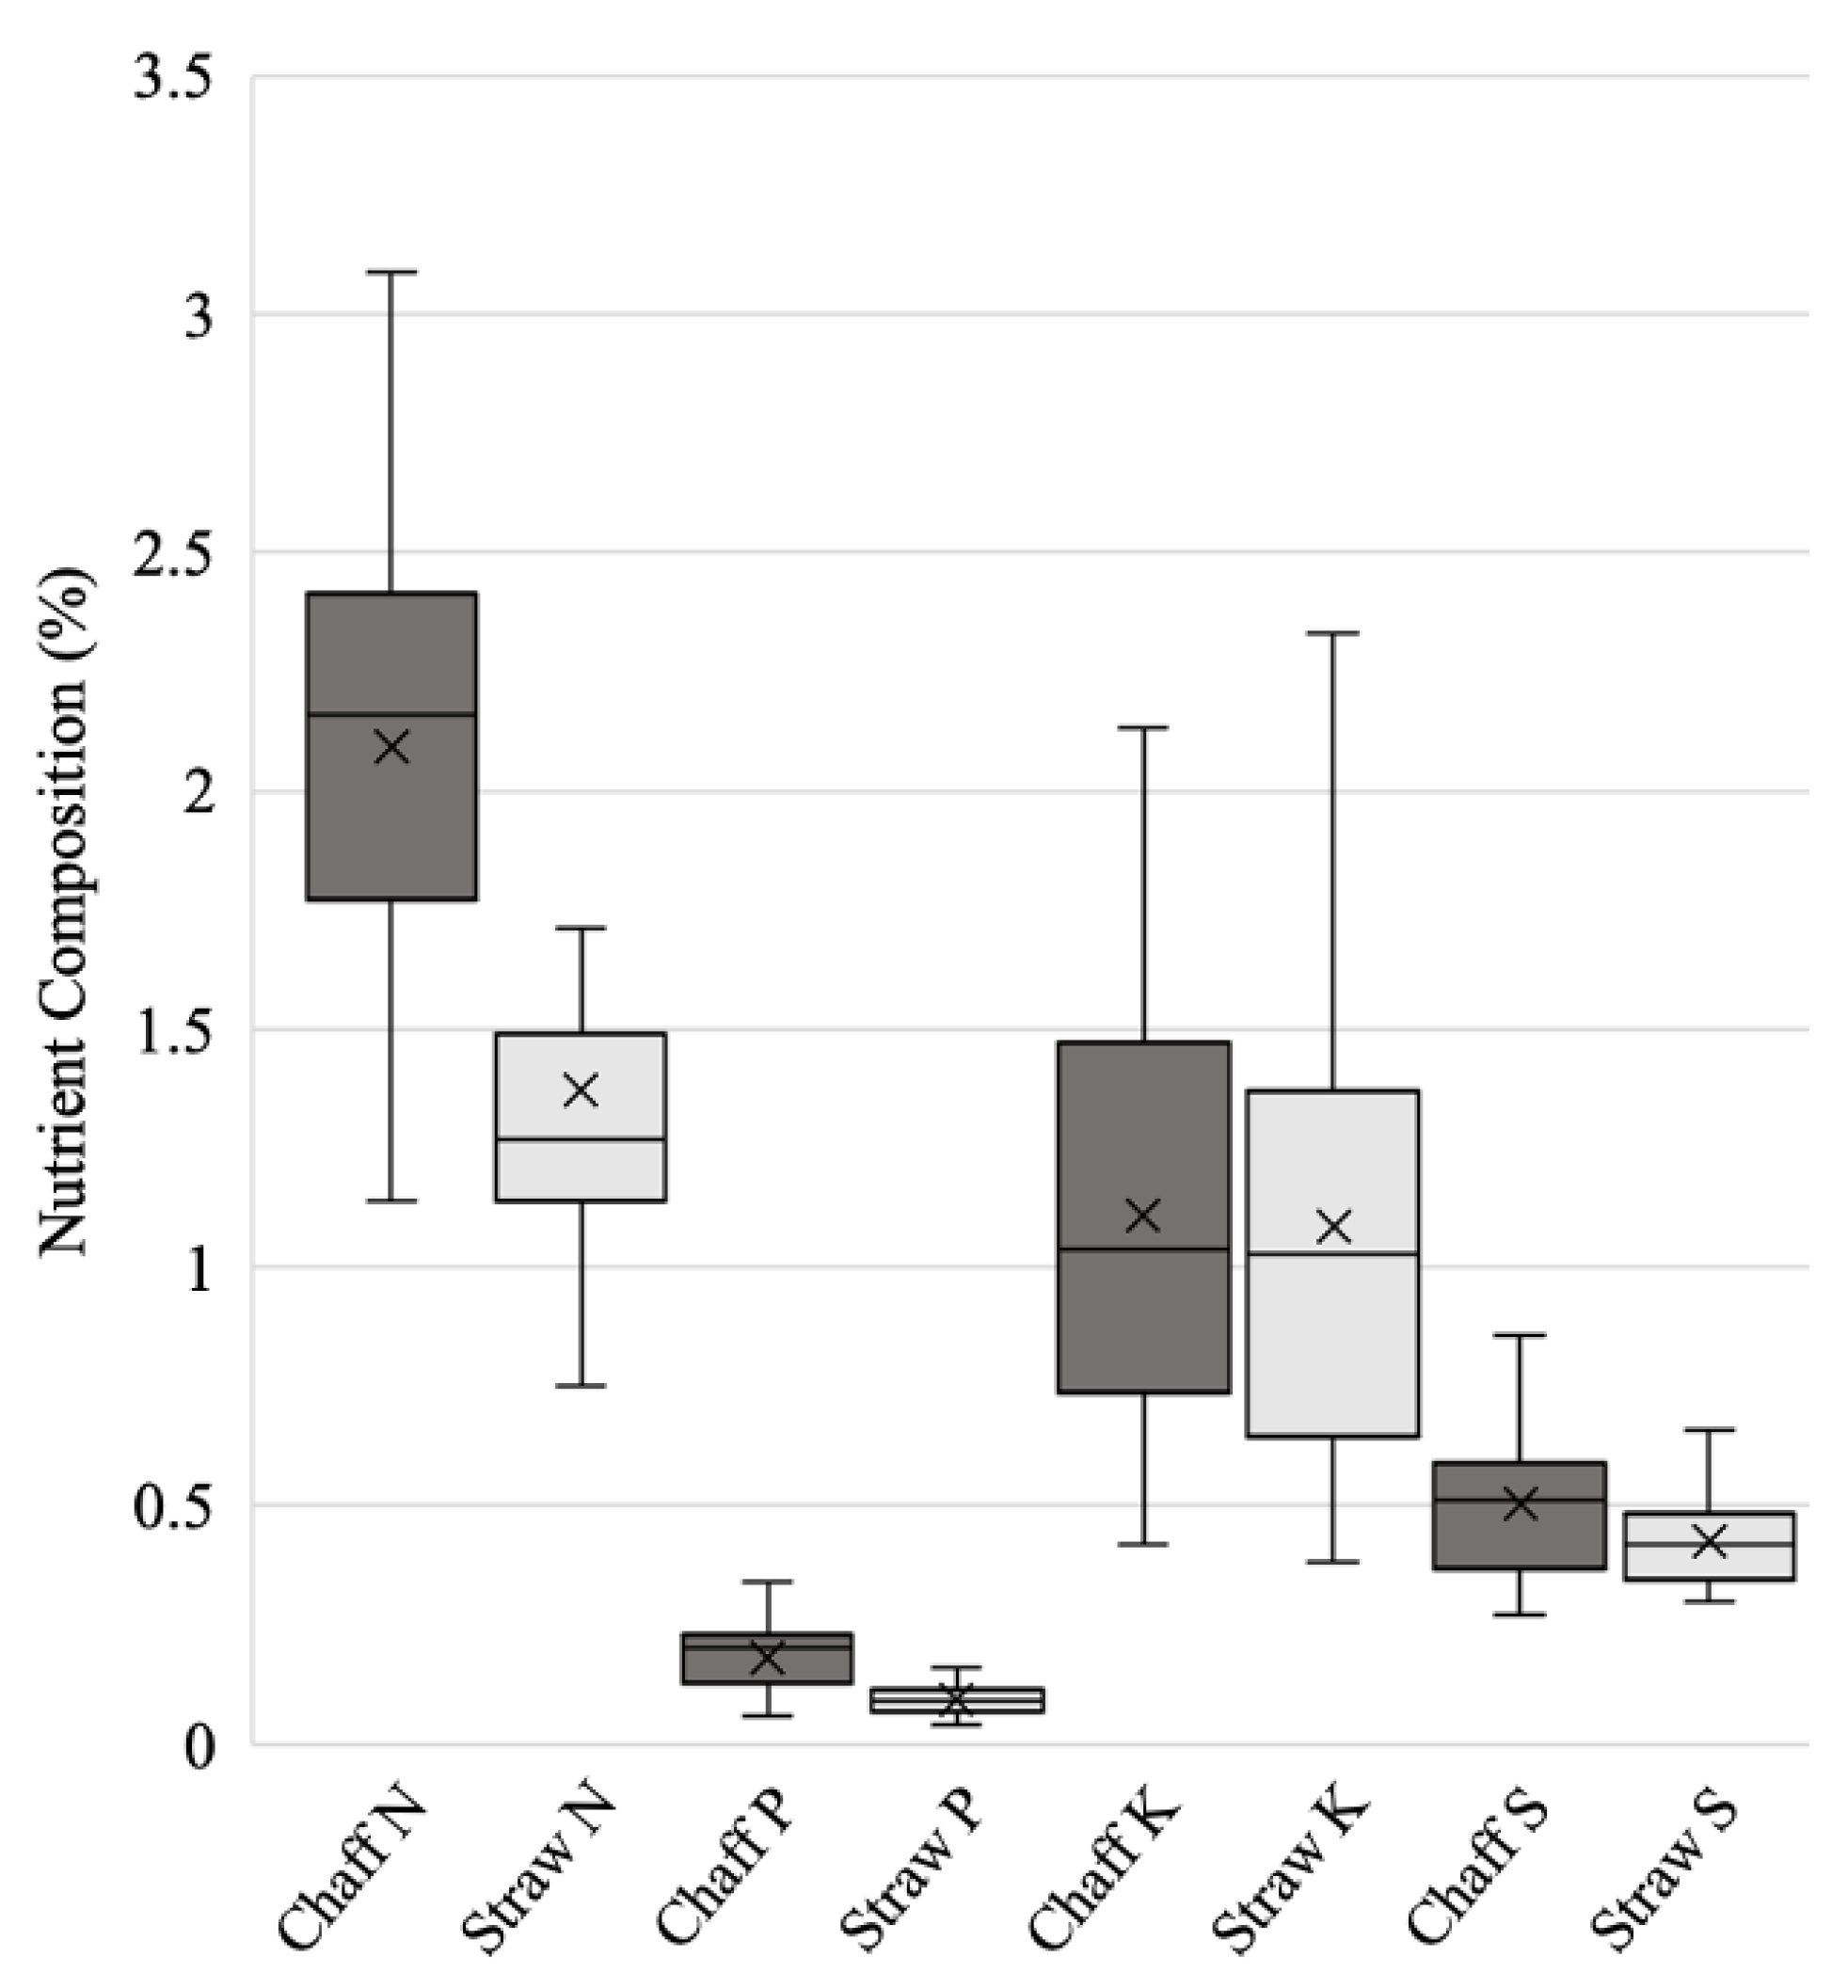
3.2. Nutrient Composition of Harvest Residues

The mean % composition of N, P, K, and S in soybean chaff was 2.09 ± 0.06, 0.18 ± 0.01, 1.11 ± 0.05, and 0.13 ± 0.01, respectively. The average N, P, K, and S content was, respectively, 34, 49, 2, and 34 % higher in chaff than in straw (Figure 1). The mean % composition of Ca and Mg, as well as ppm concentration of B, Zn, Mn, and Fe, followed a similar trend, with Cu being the exception. Ca, Mg, and micronutrient composition of soybean harvest residues are reported in Table 3. Depending on HWSC system, these nutrients need to be accounted for in the following season.

3.3. Nutrient Cost of HWSC in Soybean Production

Using these data, we can estimate the nutrient removal costs of various HWSC systems. Depending on HWSC system, residues are unaffected (conventional harvest, seed impact mills), chaff is lost from the field or condensed (e.g., chaff lining, chaff carts), straw is lost (e.g., straw baling), or a combination of both residues are lost (e.g., bale direct, narrow windrow burning) [27]. In a soybean crop yielding 3368 kg ha−1 (50 bu a−1), chaff yields 9.4, 0.8, 5.0, and 0.6 kg ha−1 and straw 31.6, 2.1, 1.1, and 2.0 kg ha−1 of N, P, K, and S, respectively for each. The total straw value was USD 5.88 ha−1 and chaff USD 1.58 ha−1 due to the replacement cost of N, P, K, and S (Table 4). The replacement cost under various forms of HWSC is presented in Table 5.

4. Discussion

A main objective of this study was to quantify the amount of chaff, straw, and seed produced during soybean harvest. The HI value from this study is similar to previous research [38,39,40,41]; however, aboveground biomass partitioning estimates in this experiment did vary from Green et al. [40], which is the only study available for comparison. In this study, the amount of chaff as a percent of total aboveground biomass recorded was 73% and 52% less than their data in 2014 and 2015, respectively. Green et al. [40] attributed one possible difference in their data to potential changes in the moisture content of the chaff and straw fractions at the time of harvest. Additional HI variation could be due to combine and threshing type, environmental conditions, crop variety, location, or the use of a desiccant during harvest. HI estimates are critical in calculating the cost of nutrient removal from HWSC and can also better inform chaff lining, tramlining, and seed impact mill research, since the amount of chaff deposited in soybean chaff lines has not been well-characterized previously.
Following the biomass quantification of soybean chaff, straw, and grain, cataloging the nutrient composition of chaff and straw harvest fractions was of interest. Soybean seed nutrient composition was not a priority because it is removed regardless of harvest method, and nutrient composition is well-characterized in the literature. Previous research in wheat by Schultz and French [46] reported that the nitrogen content found in wheat residue varied from 1.6 to 11.5 mg kg−1, phosphorus 0.2 to 1.5 mg kg−1, and potassium 6.9 to 25.5 mg kg−1. Although similar statistics in soybean are limited, this research found that nutrient composition was most often highest in chaff, which followed expectations derived from this research. Hocking [47] cites phloem mobility as the primary driver of nutrient location within a mature wheat plant; therefore, N and P are typically highest in grain. K, however, which is typically phloem-mobile, followed the distribution of phloem-immobile nutrients [47]. This study found that K concentration was found at similar concentrations in chaff and straw. In all nutrients analyzed, except for K and Cu, the nutrient composition of chaff was 13–80% higher than straw. Chaff collected during this study was visually composed primarily of soybean pods, and we hypothesize that this, along with phloem mobility and pod proximity to seed, was the driver of greater nutrient composition in chaff rather than straw.
A degree of variation in nutrient composition is expected and can be a result of crop type, stage of crop maturity and therein extent of lignification, retention of leaf and stem material in harvest operations, soil fertility, fertilizer applications, and environmental influences [6,46,48]. Harvest height can also significantly affect residue composition, and when harvesting lower, as with HWSC, total nutrient content on a residue-per-weight basis may be decreased [49]. Our data support this hypothesis in that a lower harvest height means additional straw would be collected, therefore decreasing nutrient density in residue. However, it is important to note that soybeans are already harvested at a low height; therefore, this difference is not as applicable as it is for crops such as wheat. Future research should investigate the extent to which the sources of variation mentioned play a role in nutrient composition between chaff and straw.
Finally, combining all the data included in this study, we find the cheapest forms of HWSC in terms of nutrient consequences would be seed impact mills. Seed impact mills do not disrupt harvest residue across the field, so this follows initial expectations. HWSC methods that only remove or concentrate chaff would incur a cost; however, this cost is less than that of narrow windrow burning and bale direct, which result in the greatest loss of nutrients due to the removal of both straw and chaff (Table 5). The costs associated with soybean residue fate and nutrient replacement determined by this study are only part of the total cost to implement each HWSC system. It is important to put these costs into the context of soybean production, HWSC, and potential weed control to acutely justify management decisions.
Herein, we present new data to help farmers weigh HWSC options in soybean. The nutrient replacement cost is relatively minimal in comparison to total HWSC cost. For example, seed impact mills, which have no nutrient or residue consequences, have high up-front costs in the range of USD 60,000 to 75,000 and require larger and late-model combines, routine maintenance costs, and a 15% increase in engine load and 37% fuel usage increase for the Harrington Seed Destructor [19]. Distributed across acreage, seed impact mills increased production cost by approximately AUD 34 ha−1 [50]. Chaff lining is an inexpensive option, including crafting a chute to deposit chaff in a line, that condenses but does not kill weed seeds. Chaff lining chutes can be fabricated using ingenuity and scrap metal, or they can be purchased commercially starting at AUD 4080 + GST (WestOZ Boilermaking Service, Cockburn Central Western Australia 6164, Australia) [51]. With no additional post-harvest labor requirements and low up-front costs, chaff lining is considered a good entry-level form of HWSC. Chaff tramlining modifications are more expensive than chaff lining but also lack the need for post-harvest labor. Chaff carts and bale direct systems also incur up-front capital costs for the machinery, but byproducts can be of some economic value. Chaff cart dumps can be grazed by livestock, and bales can be sold for various uses. Such methods would also increase fuel consumption during harvest. The final HWSC method, narrow windrow burning, is also relatively inexpensive. In many cases, combines may already be capable of windrowing crop residues, so modifications may not be required. Similar to chaff lining, modifications, if needed, can be done in-house at a low cost [13]. Labor is, however, required to ignite windrows following harvest, and there is risk of fire escaping [19]. In many of the inexpensive HWSC options, nutrient concentration or removal is the main question or concern in cost analysis, which can now be addressed using the results of this study.
Manson [50] determined that, when herbicides were effective and weed pressure was low, the HWSC technology used must incur AUD 34 ha−1 or less in extra costs to have a place in a farm business. HWSC techniques becomes more valuable, and higher costs can be afforded, in a scenario where fields are overpopulated with weeds or HR is a concern, the reason being that the economic losses HR can pose under a reactive management approach are greater than the cost of anti-resistance strategies, especially where target site resistance may occur and alternative herbicides are available [52]. To provide an idea of how expensive HR can be, the cost of managing HR rigid ryegrass (Lolium rigidum (Gaud.)) in Australia is greater than any other HR species combined, with additional herbicide inputs including both the use of alternate herbicides and higher application rates totaling AUD 187 million, or AUD 8 ha−1 annually [53]. Additionally, in Georgia cotton (Gossypium hirsutum (L.)) production, average herbicide costs doubled in attempts to control HR Palmer amaranth (Amaranthus palmeri (S. Wats.)), and some producers have been forced to hand-weed escapes at an average cost of USD 57 ha−1, or a 475% increase in cost compared to previous years [9]. Careful stewardship is necessary to avoid the development of future HR, and it may be worth the comparatively lower cost to implement HWSC.
Nutrient replacement costs are still critical to review, as production costs must be considered with increasing scrutiny for producers to maintain profitable endeavors, especially as input costs continue to rise. The total cost to produce one acre of soybeans in the US increased from USD 438 to USD 500 between 2012 to 2020 [54]. In this calculation from the USDA, costs such as seed, fertilizer, and chemicals and fixed costs, including labor and capital recovery of machinery and equipment, were included. Over the same time period, grower returns, or revenue, decreased by 14 percent per acre. Capital equipment and opportunity land costs are cited as increasing most in cost [54]. In 2020, an increase in soybean prices resulted in average soybean returns outweighing costs for the first time since 2017.
In addition to nutrient considerations and costs, the return of crop residues can play a critical role in preventing erosion, increasing soil organic matter, improving the microbial community, weed suppression, and improving water infiltration, all of which can contribute to improvements in crop yield and quality [55]. Yield responses due to residue retention are variable across studies and thought to mainly contribute a positive effect on yield in dry environments, due to the water conservation aspects [56]. In contrast, the importance of residue return following harvest has been a point of contention as large quantities of residue can have negative effects. These effects include nitrogen immobilization leading to N deficiencies in the crop, acting as a physical barrier to seedling emergence and crop establishment, and allelopathic effects from select crop species [56,57]. Additionally, correlation in stubble retention has been linked to an increased incidence of disease and pests issues, as well as decreases in soil temperatures [57]. Contrasting viewpoints question the importance of residue retention in cropping systems and may exhibit a case-based approach. Future research is needed to fully characterize these other aspects of crop residue fate in the context of HWSC and economic consequence; however, nutrient removal or concentration concerns from HWSC are undeniable.

5. Conclusions

A survey of cotton and soybean producers in Arkansas, Louisiana, Mississippi, and Tennessee, USA reported that costs were principal in farmers’ choice not to adopt 13 out of 16 different HR management practices [58]. It is evident that producers weigh their options and make management decisions they believe will best suit their needs. Nutrient losses are unavoidable in all HWSC systems except seed impact mills. Supporting the initial hypothesis, differences in both straw versus chaff total biomass and nutrient composition did exist during soybean harvest, therefore changing the consequence of each specific HWSC method. Nutrients lost will need to be replaced with fertilizer to maintain maximum productivity. If a producer has a serious weed problem, they may decide the investment in HWSC and the associated fertilization replacement cost are not of top concern. For those on the verge of adoption wanting to conserve funds, an option with less nutrient consequences may be best for them. Consideration of cost is critical when adopting new practices, and this research provides data to fully build a record of HWSC costs in soybean. Future research aimed at compiling an accurate guide on the total cost to implement and maintain HWSC practice is principal in promoting the adoption of such practices.

Author Contributions

Conceptualization and development of methodology of the project by M.P.S., M.L.F., W.E.T. and L.M.S.-L.; M.P.S. prepared initial manuscript and performed statistical analysis; M.L.F., L.M.S.-L., G.L.L. and W.E.T. provided review and editing; supervision of project and funding acquisition by M.L.F. and L.M.S.-L.; G.L.L. and K.W.B. helped substantially in sample collection and processing. All authors have read and agreed to the published version of the manuscript.

Funding

This research was funded by the Virginia Agricultural Experiment Station, the Virginia Soybean Board, and the Hatch Program of the National Institute of Food and Agriculture, U.S. Department of Agriculture (VA-160159).

Institutional Review Board Statement

Not applicable.

Informed Consent Statement

Not applicable.

Data Availability Statement

The data presented in this study are available on request from the corresponding author.

Acknowledgments

The authors are grateful to the Davis Produce and Shockley Farms, as well as the USDA Beltsville staff, for allowing parts of this research to be conducted on their farm. Additional thanks to the Dean Lee Research and Extension farm crew, Brooklyn Hampton, Sarah Chu, and Sohaib Chattha. The hard work and good spirits of Wykle Greene, Cynthia Sias, and Eli Russell were fundamental to the success of this project.

Conflicts of Interest

The authors declare no conflict of interest.

References

  1. Harker, K.N.; O’Donovan, J.T. Recent Weed Control, Weed Management, and Integrated Weed Management. Weed Technol. 2013, 27, 1–11. [Google Scholar] [CrossRef]
  2. Heap, I. Global Perspective of Herbicide-Resistant Weeds. Pest Manag. Sci. 2014, 70, 1306–1315. [Google Scholar] [CrossRef] [PubMed]
  3. Heap, I. The International Survey of Herbicide Resistant Weeds. Available online: http://www.weedscience.org/Home.aspx (accessed on 7 July 2022).
  4. Stubler, H.; Strek, H. Invited Plenary Presentation: Weed Control at the Crossroads—Which Innovations Are on the Horizon? In Proceedings of the 7th International Weed Science Congress, Prague, Czech Republic, 19–25 June 2016; pp. 8–12. [Google Scholar]
  5. Walsh, M.J.; Broster, J.C.; Schwartz-Lazaro, L.M.; Norsworthy, J.K.; Davis, A.S.; Tidemann, B.D.; Beckie, H.J.; Lyon, D.J.; Soni, N.; Neve, P.; et al. Opportunities and Challenges for Harvest Weed Seed Control in Global Cropping Systems. Pest Manag. Sci. 2018, 74, 2235–2245. [Google Scholar] [CrossRef]
  6. Duke, S.O. Perspectives on Transgenic, Herbicide-Resistant Crops in the United States Almost 20 Years after Production. Pest Manag. Sci. 2015, 71, 652–657. [Google Scholar] [CrossRef]
  7. Evans, J.A.; Tranel, P.J.; Hager, A.G.; Schutte, B.; Wu, C.; Chatham, L.A.; Davis, A.S. Managing the Evolution of Herbicide Resistance. Pest Manag. Sci. 2016, 72, 74–80. [Google Scholar] [CrossRef]
  8. Peterson, M.A.; Collavo, A.; Ovejero, R.; Shivrain, V.; Walsh, M.J. The Challenge of Herbicide Resistance around the World: A Current Summary. Pest Manag. Sci. 2018, 74, 2246–2259. [Google Scholar] [CrossRef]
  9. Sosnoskie, L.M.; Culpepper, A.S. Glyphosate-Resistant Palmer Amaranth (Amaranthus Palmeri) Increases Herbicide Use, Tillage, and Hand-Weeding in Georgia Cotton. Weed Sci. 2014, 62, 393–402. [Google Scholar] [CrossRef]
  10. Norsworthy, J.K.; Ward, S.M.; Shaw, D.R.; Llewellyn, R.S.; Nichols, R.L.; Webster, T.M.; Bradley, K.W.; Frisvold, G.; Powles, S.B.; Burgos, N.R.; et al. Reducing the Risks of Herbicide Resistance: Best Management Practices and Recommendations. Weed Sci. 2012, 60, 31–62. [Google Scholar] [CrossRef]
  11. Kumar, V.; Singh, S.; Chhokar, R.S.; Malik, R.K.; Brainard, D.C.; Ladha, J.K. Weed Management Strategies to Reduce Herbicide Use in Zero-till Rice–Wheat Cropping Systems of the Indo-Gangetic Plains. Weed Technol. 2013, 27, 241–254. [Google Scholar] [CrossRef]
  12. Walsh, M.; Ouzman, J.; Newman, P.; Powles, S.; Llewellyn, R. High Levels of Adoption Indicate That Harvest Weed Seed Control Is Now an Established Weed Control Practice in Australian Cropping. Weed Technol. 2017, 31, 341–347. [Google Scholar] [CrossRef]
  13. Shergill, L.S.; Schwartz-Lazaro, L.M.; Leon, R.; Ackroyd, V.J.; Flessner, M.L.; Bagavathiannan, M.; Everman, W.; Norsworthy, J.K.; VanGessel, M.J.; Mirsky, S.B. Current Outlook and Future Research Needs for Harvest Weed Seed Control in North American Cropping Systems. Pest Manag. Sci. 2020, 76, 3887–3895. [Google Scholar] [CrossRef] [PubMed]
  14. Glasner, C.; Vieregge, C.; Robert, J.; Fenselau, J.; Bitarafan, Z.; Andreasen, C. Evaluation of New Harvesting Methods to Reduce Weeds on Arable Fields and Collect a New Feedstock. Energies 2019, 12, 1688. [Google Scholar] [CrossRef]
  15. Walsh, M.; Newman, P.; Powles, S. Targeting Weed Seeds In-Crop: A New Weed Control Paradigm for Global Agriculture. Weed Technol. 2013, 27, 431–436. [Google Scholar] [CrossRef]
  16. Walsh, M.J.; Powles, S.B. Management Strategies for Herbicide-Resistant Weed Populations in Australian Dryland Crop Production Systems. Weed Technol. 2007, 21, 332–338. [Google Scholar] [CrossRef]
  17. Somerville, G.J.; Powles, S.B.; Walsh, M.J.; Renton, M. Modeling the Impact of Harvest Weed Seed Control on Herbicide-Resistance Evolution. Weed Sci. 2018, 66, 395–403. [Google Scholar] [CrossRef]
  18. Walsh, M.J.; Powles, S.B. High Seed Retention at Maturity of Annual Weeds Infesting Crop Fields Highlights the Potential for Harvest Weed Seed Control. Weed Technol. 2014, 28, 486–493. [Google Scholar] [CrossRef]
  19. Flessner, M.L.; Mirsky, S.B.; Schwartz-Lazaro, L.M.; Bagavathiannan, M.V.; VanGessel, M.J.; Shergill, L.S.; Ackroyd, V.J.; Rubione, C.G. From Spreader to Predator: Killing Weed Seeds with the Combine. Crop. Soils 2021, 54, 40–45. [Google Scholar] [CrossRef]
  20. Walsh, M. Development of Harvest Weed Seed Control (HWSC) in Australian Cropping Systems. Outlooks Pest Manag. 2018, 29, 114–119. [Google Scholar] [CrossRef]
  21. Lyon, D.J.; Walsh, M.J.; Barroso, J.; Campbell, J.M.; Hulting, A.G. Harvest Weed Seed Control: Applications for the PNW Wheat Production Systems; Washington State University Extension: Pullman, WA, USA, 2019. [Google Scholar]
  22. Aase, J.K.; Siddoway, F.H. Spring Wheat Yield Estimates from Spectral Reflectance Measurements. IEEE Trans. Geosci. Remote Sens. 1981, GE-19, 78–84. [Google Scholar] [CrossRef]
  23. Stumborg, M.; Townley-Smith, L. Agriculture Biomass Resources in Canada. In Proceedings of the American Society of Agricultural and Biological Engineers Annual Meeting, ASABE, Ottawa, ON, Canada, 1–4 August 2004. [Google Scholar]
  24. Suardi, A.; Stefanoni, W.; Alfano, V.; Bergonzoli, S.; Pari, L. Equipping a Combine Harvester with Turbine Technology Increases the Recovery of Residual Biomass from Cereal Crops via the Collection of Chaff. Energies 2020, 13, 1572. [Google Scholar] [CrossRef] [Green Version]
  25. McCartney, D.H.; Block, H.C.; Dubeski, P.L.; Ohama, A.J. Review: The Composition and Availability of Straw and Chaff from Small Grain Cereals for Beef Cattle in Western Canada. Can. J. Anim. Sci. 2006, 86, 443–455. [Google Scholar] [CrossRef]
  26. Broster, J.; Rayner, A.; Ruttledge, A.; Walsh, M. Impact of Stripper Fronts and Chaff Lining on Harvest Weed Seed Control. In Proceedings of the 2018 West Wyalong GRDC Grains Research Update, West Wyalong, Australia, 25 July 2018; pp. 55–61. [Google Scholar]
  27. Broster, J.C.; Walsh, M.J. Nutrient Removal and Movement as a Result of Different HWSC Practices. In Proceedings of the 20th Agronomy Australia Conference, Toowoomba, Australia, 18–22 September 2022; pp. 3–6. [Google Scholar]
  28. Zhang, H.; Turner, N.C.; Poole, M.L. Increasing the Harvest Index of Wheat in the High Rainfall Zones of Southern Australia. Field Crops Res. 2012, 129, 111–123. [Google Scholar] [CrossRef]
  29. Kernan, J.A.; Coxworth, E.C.; Crowle, W.L.; Spurr, D.T. The Nutritional Value of Crop Residue Components from Several Wheat Cultivars Grown at Different Fertilizer Levels. Anim. Feed Sci. Technol. 1984, 11, 301–311. [Google Scholar] [CrossRef]
  30. Bergonzoli, S.; Suardi, A.; Rezaie, N.; Alfano, V.; Pari, L. An Innovative System for Maize Cob and Wheat Chaff Harvesting: Simultaneous Grain and Residues Collection. Energies 2020, 13, 1265. [Google Scholar] [CrossRef]
  31. Coronado, D.L.L.; Alejo, J. Wheat Plant Composition: Varietal Differences in Physical Composition, Chemical Composition and in Vitro Digestibility of Various Plant Parts. M.S. Thesis, The University of Arizona, Tucson, AZ, USA, 1979. [Google Scholar]
  32. Coxworth, E.; Kernan, J.; Knipfel, J.; Thorlacius, O.; Crowle, L. Crop Residues and Forages in Western Canada; Potential for Feed Use Either with or without Chemical or Physical Processing. Agric. Environ. 1981, 6, 245–256. [Google Scholar] [CrossRef]
  33. Ruttledge, A.; Widderick, M.; Walsh, M.; Broster, J.; Bell, K.; Rayner, A.; Jalaludin, A.; Cooray, O.; Heuke, L.; Robilliard, S.; et al. The Efficacy of Chaff Lining and Chaff Tramlining in Controlling Problem Weeds; GRDC: Barton, Australian, 2018. [Google Scholar]
  34. Stumborg, M.A.; Townley-Smith, L. Assessment of Cereal Chaff as a Biomass Resource for Ethanol and Other Uses. In Proceedings of the Ethanol Research and Development Workshop, Natural Resources Canada Green Plan Program, Ottawa, ON, Canada, 17–18 March 1997; pp. 9–15. [Google Scholar]
  35. Stumborg, M.; Townley-Smith, L.; Coxworth, E. Sustainability and Economic Issues for Cereal Crop Residue Export. Can. J. Plant Sci. 1996, 76, 669–673. [Google Scholar] [CrossRef]
  36. Broster, J.C.; Walsh, M.J.; Chambers, A.J. Harvest Weed Seed Control: The Influence of Harvester Set up and Speed on Efficacy in South-Eastern Australia Wheat Crops; Narromine GRDC Grains Research Update; GRDC: Narromine, Australian, 2016; pp. 26–45. [Google Scholar]
  37. White, L.M.; Bergman, J.W. Chaff Feed Quality of Winter Wheat, Spring Wheat, Barley, and Oat Cultivars. Agronomy 1985, 77, 269–274. [Google Scholar] [CrossRef]
  38. Schapaugh, W.T.; Wilcox, J.R. Relationships between Harvest Indices and Other Plant Characteristics in Soybean. Crop Sci. 1980, 20, 529–533. [Google Scholar] [CrossRef]
  39. Spaeth, S.C.; Randall, H.C.; Sinclair, T.R.; Vendeland, J.S. Stability of Soybean Harvest Index. Agron. J. 1984, 76, 482–486. [Google Scholar] [CrossRef]
  40. Green, J.K.; Norsworthy, J.K.; Walsh, M.J. Distribution of Common Cocklebur and Palmer Amaranth Seed Exiting the Combine for Harvest Weed Seed Control in Soybean. Crop Forage Turfgrass Manag. 2020, 6, 1–6. [Google Scholar] [CrossRef]
  41. Schwartz-Lazaro, L.M.; Norsworthy, J.K.; Walsh, M.J.; Bagavathiannan, M.V. Efficacy of the Integrated Harrington Seed Destructor on Weeds of Soybean and Rice Production Systems in the Southern United States. Crop Sci. 2017, 57, 2812–2818. [Google Scholar] [CrossRef]
  42. Scagnozzi, A.; Saviozzi, A.; Levi-Minzi, R.; Riffaldi, R. Nutrient Release from Decomposing Crop Residues in Soil: A Laboratory Experiment. Am. J. Altern. Agric. 1997, 12, 10–13. [Google Scholar] [CrossRef]
  43. Isaac, R.A.; Johnson, W.C. Elemental Analysis of Plant Tissue by Plasma Emission Spectroscopy: Collaborative Study. J. Assoc. Off. Anal. Chem. 1985, 3, 499–505. [Google Scholar] [CrossRef]
  44. Quinn, R. DTN Retail Fertilizer Trends; AgFax: Burnsville, MN, USA, 2022. [Google Scholar]
  45. North Carolina Production Cost Report (Weekly) (RA_GR210); United States Department of Agriculture: Raleigh, NC, USA, 2021.
  46. Schultz, J.E.; French, R.J. Mineral Content of Herbage and Grain of Halberd Wheat in South Australia. Aust. J. Exp. Agric. 1976, 16, 887–892. [Google Scholar] [CrossRef]
  47. Hocking, P.J. Dry-Matter Production, Mineral Nutrient Concentrations, and Nutrient Distribution and Redistribution in Irrigated Spring Wheat. J. Plant Nutr. 1994, 17, 1289–1308. [Google Scholar] [CrossRef]
  48. Burnside, O.; Wilson, R.; Wicks, G.; Roeth, F.; Moomaw, R. Weed Seed Decline and Buildup in Soils under Various Corn Management Systems across Nebraska. Agron. J. 1986, 78, 451–454. [Google Scholar] [CrossRef]
  49. Korres, N.E. Agronomic Weed Control: A Trustworthy Approach for Sustainable Weed Management. Non-Chem. Weed Control 2018, 97–114. [Google Scholar] [CrossRef]
  50. Manson, J. Harvest Weed Seed Control for the Southern High Rainfall Zone; Grains Research and Development Corporation: Barton, Australian, 2019. [Google Scholar]
  51. Newman, P. Tools and Tips Setting Up for Chaff Lining; Grains Research and Development Corporation: Barton, Australian, 2019. [Google Scholar]
  52. Orson, J.H. The Cost to the Farmer of Herbicide Resistance. Weed Technol. 1999, 13, 607–611. [Google Scholar] [CrossRef]
  53. Llewellyn, R.; Ronning, D.; Ouzman, J.; Walker, S.; Mayfield, A.; Clarke, M. Impact of Weeds on Australian Grain Production: The Cost of Weeds to Australian Grain Growers and the Adoption of Weed Management and Tillage Practices; CSIRO: Canberra, Australia, 2016. [Google Scholar]
  54. Vaiknoras, K. Costs and Returns Associated with Soybean Production, 2012–2020; 2021. Available online: https://www.ers.usda.gov/data-products/chart-gallery/gallery/chart-detail/?chartId=101716 (accessed on 20 August 2022).
  55. Flower, K.; Dang, Y.; Ward, P. Advances in Crop Residue Management. In Proceedings of the Australian Agriculture in 2020: From Conservation to Automation, Agronomy Australia and Charles Sturt University, Wagga Wagga, Australia, 27 August 2019; pp. 137–149. [Google Scholar]
  56. Kirkegaard, J.; Swan, T.; Hunt, J.; Vadakattu, G.; Kelly, J. The Effects of Stubble on Nitrogen Tie-up and Supply. In Proceedings of the Grains Research Update: Strategic Steps-Enduring Profit, Grains Research and Development Corporation, Corowa, Australia, 27 February 2018; pp. 57–65. [Google Scholar]
  57. Scott, B.J.; Eberbach, P.L.; Evans, J.; Wade, L.J. Stubble Retention in Cropping Systems in Southern Australia: Benefits and Challenges; Industry and Investment NSW: Wagga Wagga, Australia, 2010; p. 105.
  58. Riar, D.S.; Norsworthy, J.K.; Steckel, L.E.; Stephenson, D.O.; Eubank, T.W.; Scott, R.C. Assessment of Weed Management Practices and Problem Weeds in the Midsouth United States—Soybean: A Consultant’s Perspective. Weed Technol. 2013, 27, 612–622. [Google Scholar] [CrossRef]
Figure 1. Box-and-whisker plot of soybean chaff and straw nutrient (N, P, K, S) composition (chaff n = 73, straw n = 57).
Agronomy 12 02028 g001
Table 1. Aboveground components of wheat at harvest found in the literature.
Chaff of TotalStraw of TotalGrain of TotalChaff of Grain YieldLocationCombine TypeReference
---------------- % ----------------
19443833Southern New South Wales, AustraliaCombine type unspecified[27]
15473938Kojonup, Western AustraliaHand threshing[28]
12385024Saskatoon, CanadaHand threshing[29]
9.6464422Revello, Northern ItalyAxial Flow (CASE IH 7088)[30]
3367--Northwest MexicoLaboratory threshing unit[31]
22-7828Pannecè, FranceHand threshing[24]
26–3763–74-Saskatoon, CanadaHand threshing[32]
---30Narrabri and Toowoomba, Australia-[33]
---17Swift Current, SaskatchewanCombine type unspecified[34]
---25Swift Current, SaskatchewanRotary[35]
20–3070–80-New South Wales, Australia-[5,36]
Table 2. Relationship between aboveground components of soybean following combine harvest (n = 66).
Soybean FractionTotal Aboveground BiomassAboveground Biomass Excluding SeedRelationship to Seed Yield
-------- % ± SE --------
Chaff7.25 ± 0.3717.55 ± 1.2113.39 ± 0.76
Straw36.05 ± 1.2082.45 ± 1.2168.45 ± 3.62
Seed 56.70 ± 1.20--------------------
Table 3. Nutrient composition of harvest residues (Mg, Ca, B, Zn, Mn, Fe, Cu) (chaff n = 73, straw n = 57).
Harvest ResidueMgCaBZnMnFeCu
---------- % ---------------------------------------- ppm -------------------------------
Chaff0.51 ± 0.021.19 ± 0.0628.25 ± 1.0430.36 ± 2.0855.23 ± 3.77236.43 ± 34.8712.70 ± 1.10
Straw0.42 ± 0.010.89 ± 0.0324.53 ± 0.9115.98 ± 1.5029.14 ± 1.5246.56 ± 2.7912.75 ± 1.23
Table 4. Cost to replace nutrients lost in chaff or straw.
NutrientFertilizer—PriceChaff ValueStraw Value
USD ton−1----- USD ha−1 -----
NUrea—403.020.913.05
PMAP—528.370.180.47
KPotash—387.010.432.15
SAmmonium sulfate—414.690.060.21
Total Value1.585.88
Note: Average fertilizer prices calculated using DTN monthly and North Carolina USDA Ag Market News weekly averages of retail fertilizer prices over 5 years (2017–2021) [44,45]. Residue production based on an approximate US national soybean yield average of 3368 kg ha−1 (50 bu a−1).
Table 5. Cost of fertilizer to replace nutrients in residues lost during harvest weed seed control.
HWSC SystemChaff OutcomeStraw OutcomeCost to Replace Nutrients
USD ha−1
No_HWSC (conventional harvest)Spread_evenly behind combineSpread_evenly behind combine0
Seed_Impact MillsSpread_evenly behind combineSpread_evenly behind combine0
Narrow Windrow BurningConcentrated + BurnedConcentrated + Burned7.46
Bale DirectRemovedRemoved7.46
Chaff CartsRemovedSpread_evenly behind combine1.58
Chaff Lining/TramliningConcentratedSpread_evenly behind combine1.58
Note: Average fertilizer prices calculated using DTN monthly and North Carolina USDA Ag Market News weekly averages of retail fertilizer prices over 5 years (2017–2021) [44,45]. Residue production based on an approximate US national soybean yield average of 3368 kg ha−1 (50 bu a−1).
Publisher’s Note: MDPI stays neutral with regard to jurisdictional claims in published maps and institutional affiliations.

