2.4. Field Trials
Kununurra—Trial 1 (2015) was a randomized complete block design (RCBD) but with 2 incomplete blocks or columns per replicate with 3 replicates, 5 varieties by 3 sowing rates. Seed was planted on 15 April 2015 and plants harvested on 25 July 2015. Data are presented for varieties BEW and JC1 sown at 3 kg/ha. Plant establishment was assessed at harvest time by counting all plants in plots from 1 replicate only. Trial 2 (2016) was a 2-dimensional or latinized RCBD with 4 replicates, planted on 25 May 2016 at a sowing rate of 2.5 kg/ha and harvested on 29 August 2016. Trial plots were sown using a gravity-fed cone-seeder into four 21 m long rows at 22 cm row spacings on 90 cm wide raised beds. DAP (N 18%, P 20%, S 1.6%) at 320 kg/ha plus Zinc 10% was drilled into the sides of the bed at a depth of around 50 mm. The sites were irrigated using flood irrigation immediately after sowing with further irrigation applied fortnightly. Plots were harvested with an experimental small-plot harvester at maturity (plant senescence). Seed was cleaned and weighed to assess plot seed yield.
Katherine—Trial 1 (2016) was a split-plot design with 2 sowing dates as the main-plots, and 3 sowing rates by 2 nitrogen rates by 2 varieties as sub-plots partially randomized in 3 replicates. Data are presented for the planting date of 20 May 2016 and sowing rate of 8 kg/ha with data for nitrogen levels combined. Plant establishment was assessed on 3 June and seed harvested on 29 August. Trial 2 (2017) was a split-plot design with 2 sowing dates as main-plots and 12 varieties/lines as sub-plots fully randomized in 3 replicates. Data are presented for the planting date of 12 May 2017 and 10 varieties/lines. Plots were sown at a rate of 8 kg/ha. Plant establishment was assessed on 23 May and seed harvested from 4 September to 3 October based on maturity of lines. Plots were 10 m × 1.5 m in trial 1 and 10 m × 2.8 m in trial 2 and sown with a disc-seeder. Fertilisers applied were DAP at 120 kg/ha and muriate of potash (K 50%) at 100 kg/ha just after sowing and nitrogen was applied as urea (N 40%) top-dressed in late June. Plots were irrigated using a lateral move overhead irrigator delivering 640 mm during the growing period of 2016. Plant establishment was assessed using three quadrats per plot each of size 0.35 m2. Plots were harvested with an experimental small-plot harvester at maturity. Seed was cleaned, dried and weighed to assess plot seed yield.
Walkamin (2018)—The trial used a split-plot design where the main-plots were 2 times of sowing, and the subplots were 2 varieties and 3 sowing rates. Data are presented for variety BEW, the planting date of 22 June 2018 and the sowing rate of 4 kg/ha. DAP at 250 kg/ha was spread on 18 June 2018 then incorporated and rolled with a multi-weeder to provide the final seedbed. Seed was sown using a Jang-seeder about 20 mm deep and each plot was 10 m × 2.75 m wide sown as seven rows at 25 cm row spacing. Overhead irrigation with sprinklers was applied at weekly intervals. The trial was machine harvested on 17 October 2018 and seed cleaned and weighed to assess plot seed yield.
Mingenew, Cunderdin, Geraldton, Eradu and Esperance—The trials were sown using air-cone-seeders fitted with knife points and press wheels at approximately 1 cm depth (soil coverage). Each trial plot consisted of seven 10-metre-long rows that were 22.5–27 cm apart, with 40 cm buffers. Plots were fertilised according to the recommendations for canola (Agras (N 16%, P 9%, S 14%) 80 kg/ha at Cunderdin; Agstar Extra (N 14%, P 14%, S 9%) 80 kg/ha at Mingenew, Geraldton and Eradu; Agras No1 100 kg/ha at Esperance). Grass weeds were controlled using pre-emergent s-metolachlor (e.g., Dual® Gold) and post-emergent grass selective herbicides like clethodim. Broad-leaved weeds were controlled with post-emergent diflufenican (e.g., Brodal®) and/or by manual weeding. Plant density was assessed at or close to maturity using a range in number and size of quadrats as follows: 6 quadrats per plot of 0.2 m × 1.6 m at Mingenew and Cunderdin, 4 quadrats per plot of 0.21 m × 1.15 m at Geraldton (2 at anthesis and 2 at maturity), 6 quadrats per plot of 0.22 m × 1.6 m at Eradu and 3 quadrats per plot of 0.45 m × 1 m at Esperance. All plants in the plots were harvested using experimental small-plot harvesters using a low drum speed setting. Some trials were desiccated before harvest if required. The harvested seed was threshed and then aspirated for cleaning before weighing.
Mingenew (2016)—The trial was a split-plot design with the main-plots as 3 times of sowing and the sub-plots with 4 sowing rates by 3 nitrogen levels by 3 varieties. Plot size was 10 m × 1.8 m. Data for control varieties are presented for the planting date of 9 June 2016 and 8 kg/ha sowing rate with data for nitrogen levels combined (data from means of 6 replicates in each of 2 blocks). Nine germplasm lines were randomly arranged in the borders of main trial plots in 1 replicate only. Plant establishment was visually assessed in only 1 block. Control varieties were machine harvested and germplasm lines were hand harvested on 6 December 2016.
Cunderdin (2016)—The trial was a split-plot design with 3 times of sowing as the main-plots, and the sub-plots of 4 sowing rates by 3 nitrogen levels by 3 varieties. Plot size was 10 m × 1.8 m. Data for control varieties are presented for the planting dates of 3 May, 25 May and 14 June 2016 and 8 kg/ha sowing rate with data for nitrogen levels combined (data from means of 6 replicates in each of 2 blocks). Nine germplasm lines were randomly arranged in the borders of main trial plots in 3 replicates of the 14 June planting time. Plant establishment was visually assessed in the 3 replicates. Control varieties were machine harvested and germplasm lines were hand harvested on 15 December 2016.
Geraldton (2017)—The trial was a proportionally balanced-RCBD with 2 sowing rates blocked as replicates, 8 germplasm lines, 5 control varieties replicated one, two or three times, and planted on 1 June 2017. Data are presented for 2 of the 5 control varieties. Data for the 2 sowing rates were combined and treated as replicates in the analysis. Plots were harvested on 20 October 2017.
Eradu (2017)—The trial was a proportionally balanced-RCBD with 2 sowing rates blocked as replicates, 8 germplasm lines, 5 control varieties replicated one, two or three times, and planted 23 May 2017. Data are presented for 2 of the 5 control varieties. Data for the 2 sowing rates were combined. Plots were harvested on 13 November 2017.
Esperance (2017)—The trial was a proportionally balanced-RCBD with 2 sowing rates blocked as replicates, 8 germplasm lines, 5 control varieties replicated one, two or three times, and planted on 26 June 2017. Data are presented for 2 of the 5 control varieties. Data for the 2 sowing rates were combined. Plots with very poor plant establishment (<5 plant/m2) were eliminated from the analysis (6 entries with 2 reps and 4 entries with 1 rep were analysed). Plots were harvested in January 2018.
Manjimup (2016–2017)—The trial was a RCBD with 2 sowing rates, 5 control varieties and 9 germplasm lines, 2 replicates, and sown on 4 October 2016. Data for the 2 sowing rates were combined. Plots consisted of eight rows 10 metres long with each row 17 cm apart. Seed was sown using a gravity-fed pasture cone-seeder (super seeder points without press wheels). Agstar at 100 kg/ha was applied at sowing. The trial site was irrigated based on evapotranspiration using overhead impulse sprinklers from the middle of December to the end of January. Hand harvesting and plant counts were undertaken on four 1.6 m × 0.2 m quadrats per plot on 26 April 2017. Whole plots (less quadrat cuts) were machine harvested on 22 March 2017 and seed cleaned and weighed to assess yield.
Bool Lagoon—Plots were 8 m × 2.2 m with 8 rows 15 cm apart and sown with a cone-seeder with disc and knife points. Plots were fertilised at 140 kg/ha with nitrogen (18%), phosphorus (13%) and sulphur (10%) and 400 mL/ha Impact™ at sowing and 100 kg/ha nitrogen as urea top-dressed in early summer. During 2015 and 2016 plant establishment was assessed using three 30 cm × 50 cm quadrats per plot at the seedling stage. At or close to maturity plots were swathed and allowed to dry before harvesting with an experimental small-plot harvester. Seed was cleaned and weighed to assess plot seed yield.
Trial 1 (2015–2016) was a split-plot design with 4 times of sowing as the main-plots and 2 varieties by 3 sowing rates as sub-plots, in 4 replicates. Buffer plots were sown on each side of the main plots. Data are presented for the planting time of 30 October 2015 and sowing rate of 3 kg/ha. Overhead sprinkler irrigation was applied as required. The trial was harvested between 2 and 22 March 2016.
Trial 2 (2016–2017) was a RCBD in 4 replicates (lines in replicate 1 were arranged systematically and lines in replicates 2–4 were fully randomized). There were 5 varieties, 9 germplasm lines and 11 selections. Data are presented for 2 varieties and 9 germplasm lines. Only replicates 2–4 were analysed. The trial was sown on 10 November 2016 at 4 kg/ha, and harvested on 8 March 2017. No irrigation was applied.
Trial 3 (2017–2018) was a RCBD with 4 varieties, 4 germplasm lines and 4 selections in 4 replicates. Data are presented for 2 varieties and 4 germplasm lines. Seed was sown at 4 kg/ha on 9 October 2017. No irrigation was applied. Plots were hand harvested between 2 March to 3 April 2018 using 1 quadrat (4 rows × 21 cm) per plot.
Leeton—Trials were sown with a precision cone-seeder in four rows with 30 cm centres on 1.8 m raised beds. Plot length was 8.5 m. The seed was dropped on the soil surface and then covered with trailing chain and press wheels. After sowing, the trials were watered using furrow irrigation to wet up the whole bed. The timing of subsequent irrigation was determined using evapotranspiration measurements, occurring approximately every two weeks. Based on soil test results, fertiliser was applied pre-sowing at 110 kg/ha of Granulock Z (N 11%, P 22.8%, S 4.0% and Zn 2.0%) for all trials. Weed control was achieved using pre- and post-emergent herbicides. Glyphosate 360 was used pre-sowing and metolachlor (e.g., Dual Gold®) as the post sowing pre-emergent. Additional grass weed control was achieved using post-emergent haloxyfop (e.g., Verdict 520) at label rates. Flea beetles were controlled with Maldison 500® applied post-seeding pre-emergent. Establishment counts and hand harvest of seed were carried out on a 1 m × 4 row pegged area of each plot. Establishment counts were assessed at the seedling stage. An experimental harvester was used to harvest seed of the whole of plots. Quadrat seed yields are presented for Trials 1, 3 and 4 and machine harvested seed yields presented for Trial 2 (machine harvested yields were generally unreliable due to poor suitability of harvester for small seeded crops).
Trial 1 (2017) was a RCBD with 3 replicates, 4 varieties and 8 germplasm lines. Data are presented for only two of the varieties. Seed was sown at 4 kg/ha on 16 March 2017 and plots harvested from quadrats on 27 July 2017. Plots were machine harvested on 24–25 August 2017.
Trials 2–4 (2017–2018) were RCBD with 3 replicates, 2 varieties and 4 germplasm lines. Data are presented for only one of the varieties. Seed at the three trials was sown on 27 October, 20 November and 19 December 2017 at 7 kg/ha and hand or machine harvested on 24 April, 26 April and 16 May 2018, respectively.
Trials not harvested—
Northam—Trial was a RCBD with four replicates, 10 varieties, 4 times of sowing and a plot size of 5 m × 0.5 m.
Katanning—Trial was a RCBD with two replicates, 13 varieties and a plot size of 10 m × 1.6 m.
Alice Springs—Two trials, autumn and winter/spring sown, were RCBD with four replicates, 12 varieties and a plot size of 10 m × 2 m.
2.6. Statistical Analysis
A linear mixed model was used to compare the mean effects (model means) of the treatments. Depending on the trial, this could be just varieties, varieties by seeding rate and/or nitrogen, or varieties by time of sowing). The responses analysed include the raw data (seed yield, density, days to first flower, the weighted mean seed size and standard deviation of the seed size distribution, colour ΔE*ab) and/or a transformation of these responses if necessary. By default, we used the square root (SQRT) transformation since the new data then stays positive.
The R Statistical System [
17] denoted as R was used to fit the linear mixed model using the aov or lmer function to do this ‘analysis of variance’ for balanced and unbalanced data, respectively. The R function emmeans produces the model means and contrasts with degrees of freedom with standard errors (which are used to compute the least significant difference (LSD) at the 5% level of significance (
p = 0.05).
The raw means are usually presented with the transformed model means in parentheses as required. The model means may be adjusted for the raw data if untransformed because of possible unbalance in the dataset under analysis.
A multiple linear regression was used to relate the mean seed yield of BEW to the climatic variables at each site of mean daily temperature (minimum temperature + maximum temperature/2), maximum temperature and number of days with maximum temperature exceeding 34 °C. A step-wise multiple linear regression (forward-, backward- and both-) was used in R. The criterion to determine the stopping rule is the smallest AIC (Akaike Information criterion).
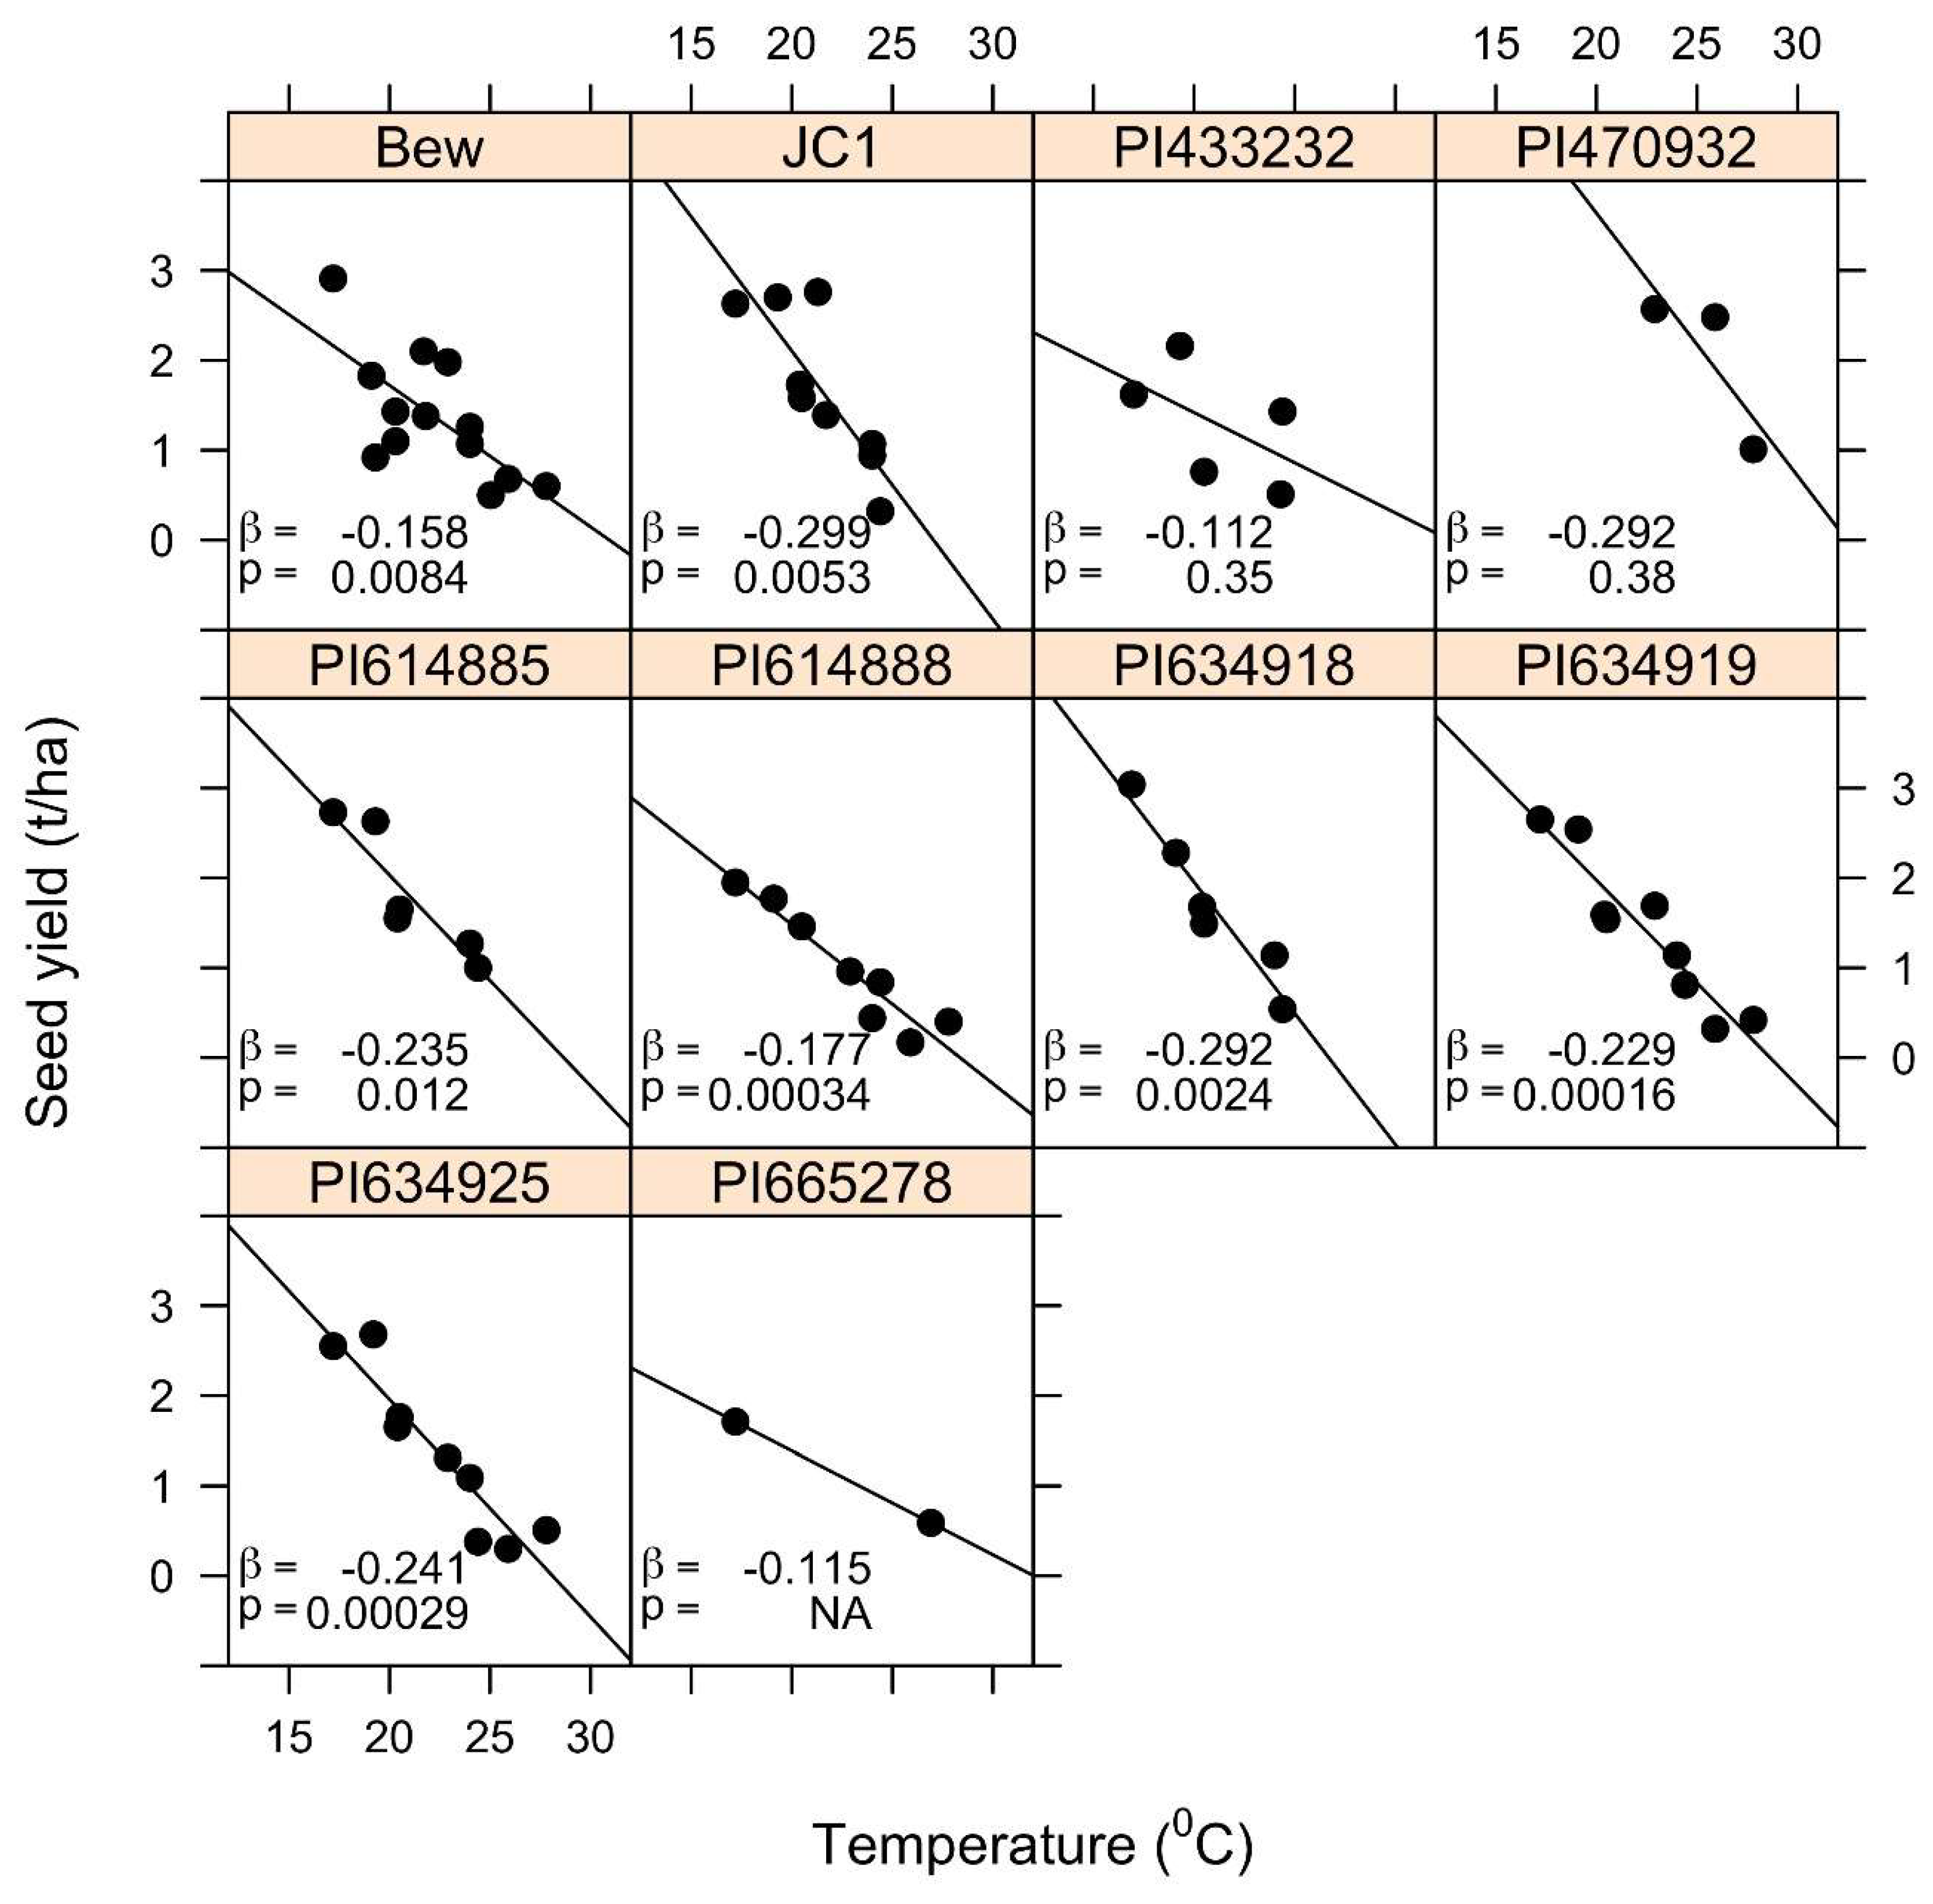
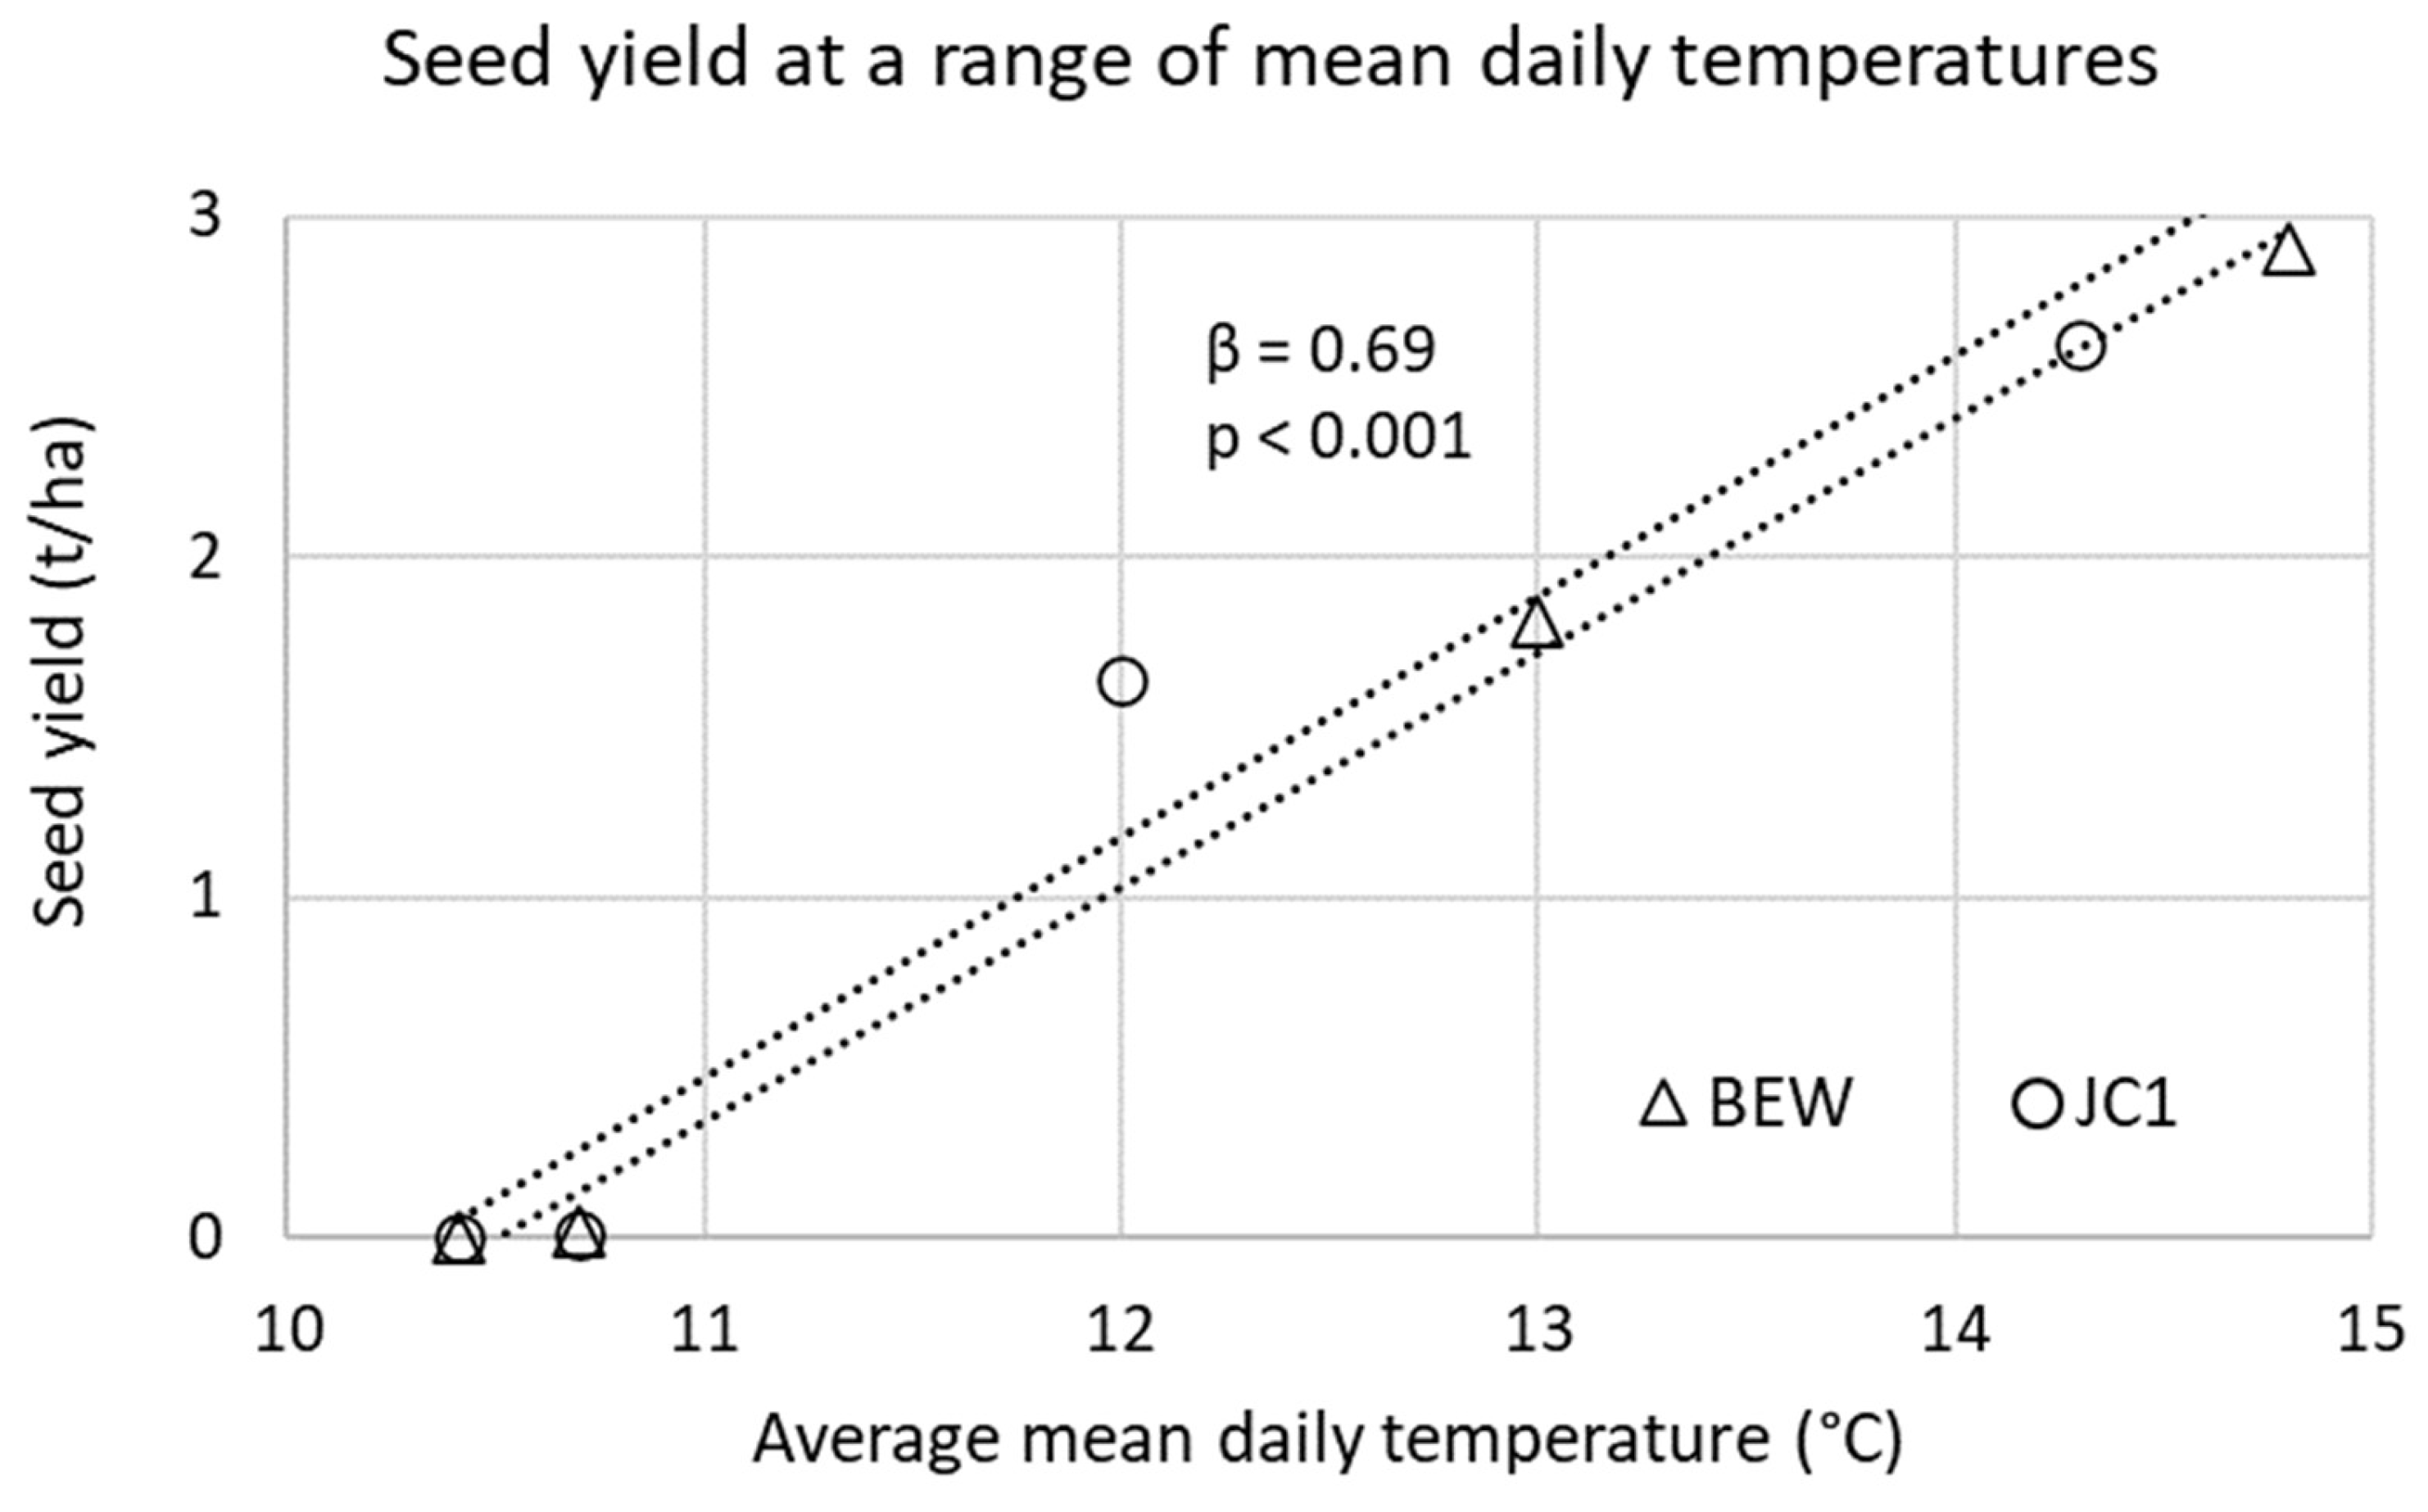
Linear regressions (intercept + a slope parameter β) were fitted to the data for seed yield and average daily mean temperature during the seed development stage (second half of the period between commencement of flowering and maturity) for each of the germplasm lines and varieties. The estimate of the slope parameter (β) is shown with a test of the coefficient (p-value shown to 2 significant digits). Similarly, linear regressions were also fitted to the data for seed yield and average mean temperature during the first 30 days after commencement of flowering for varieties BEW and JC1.
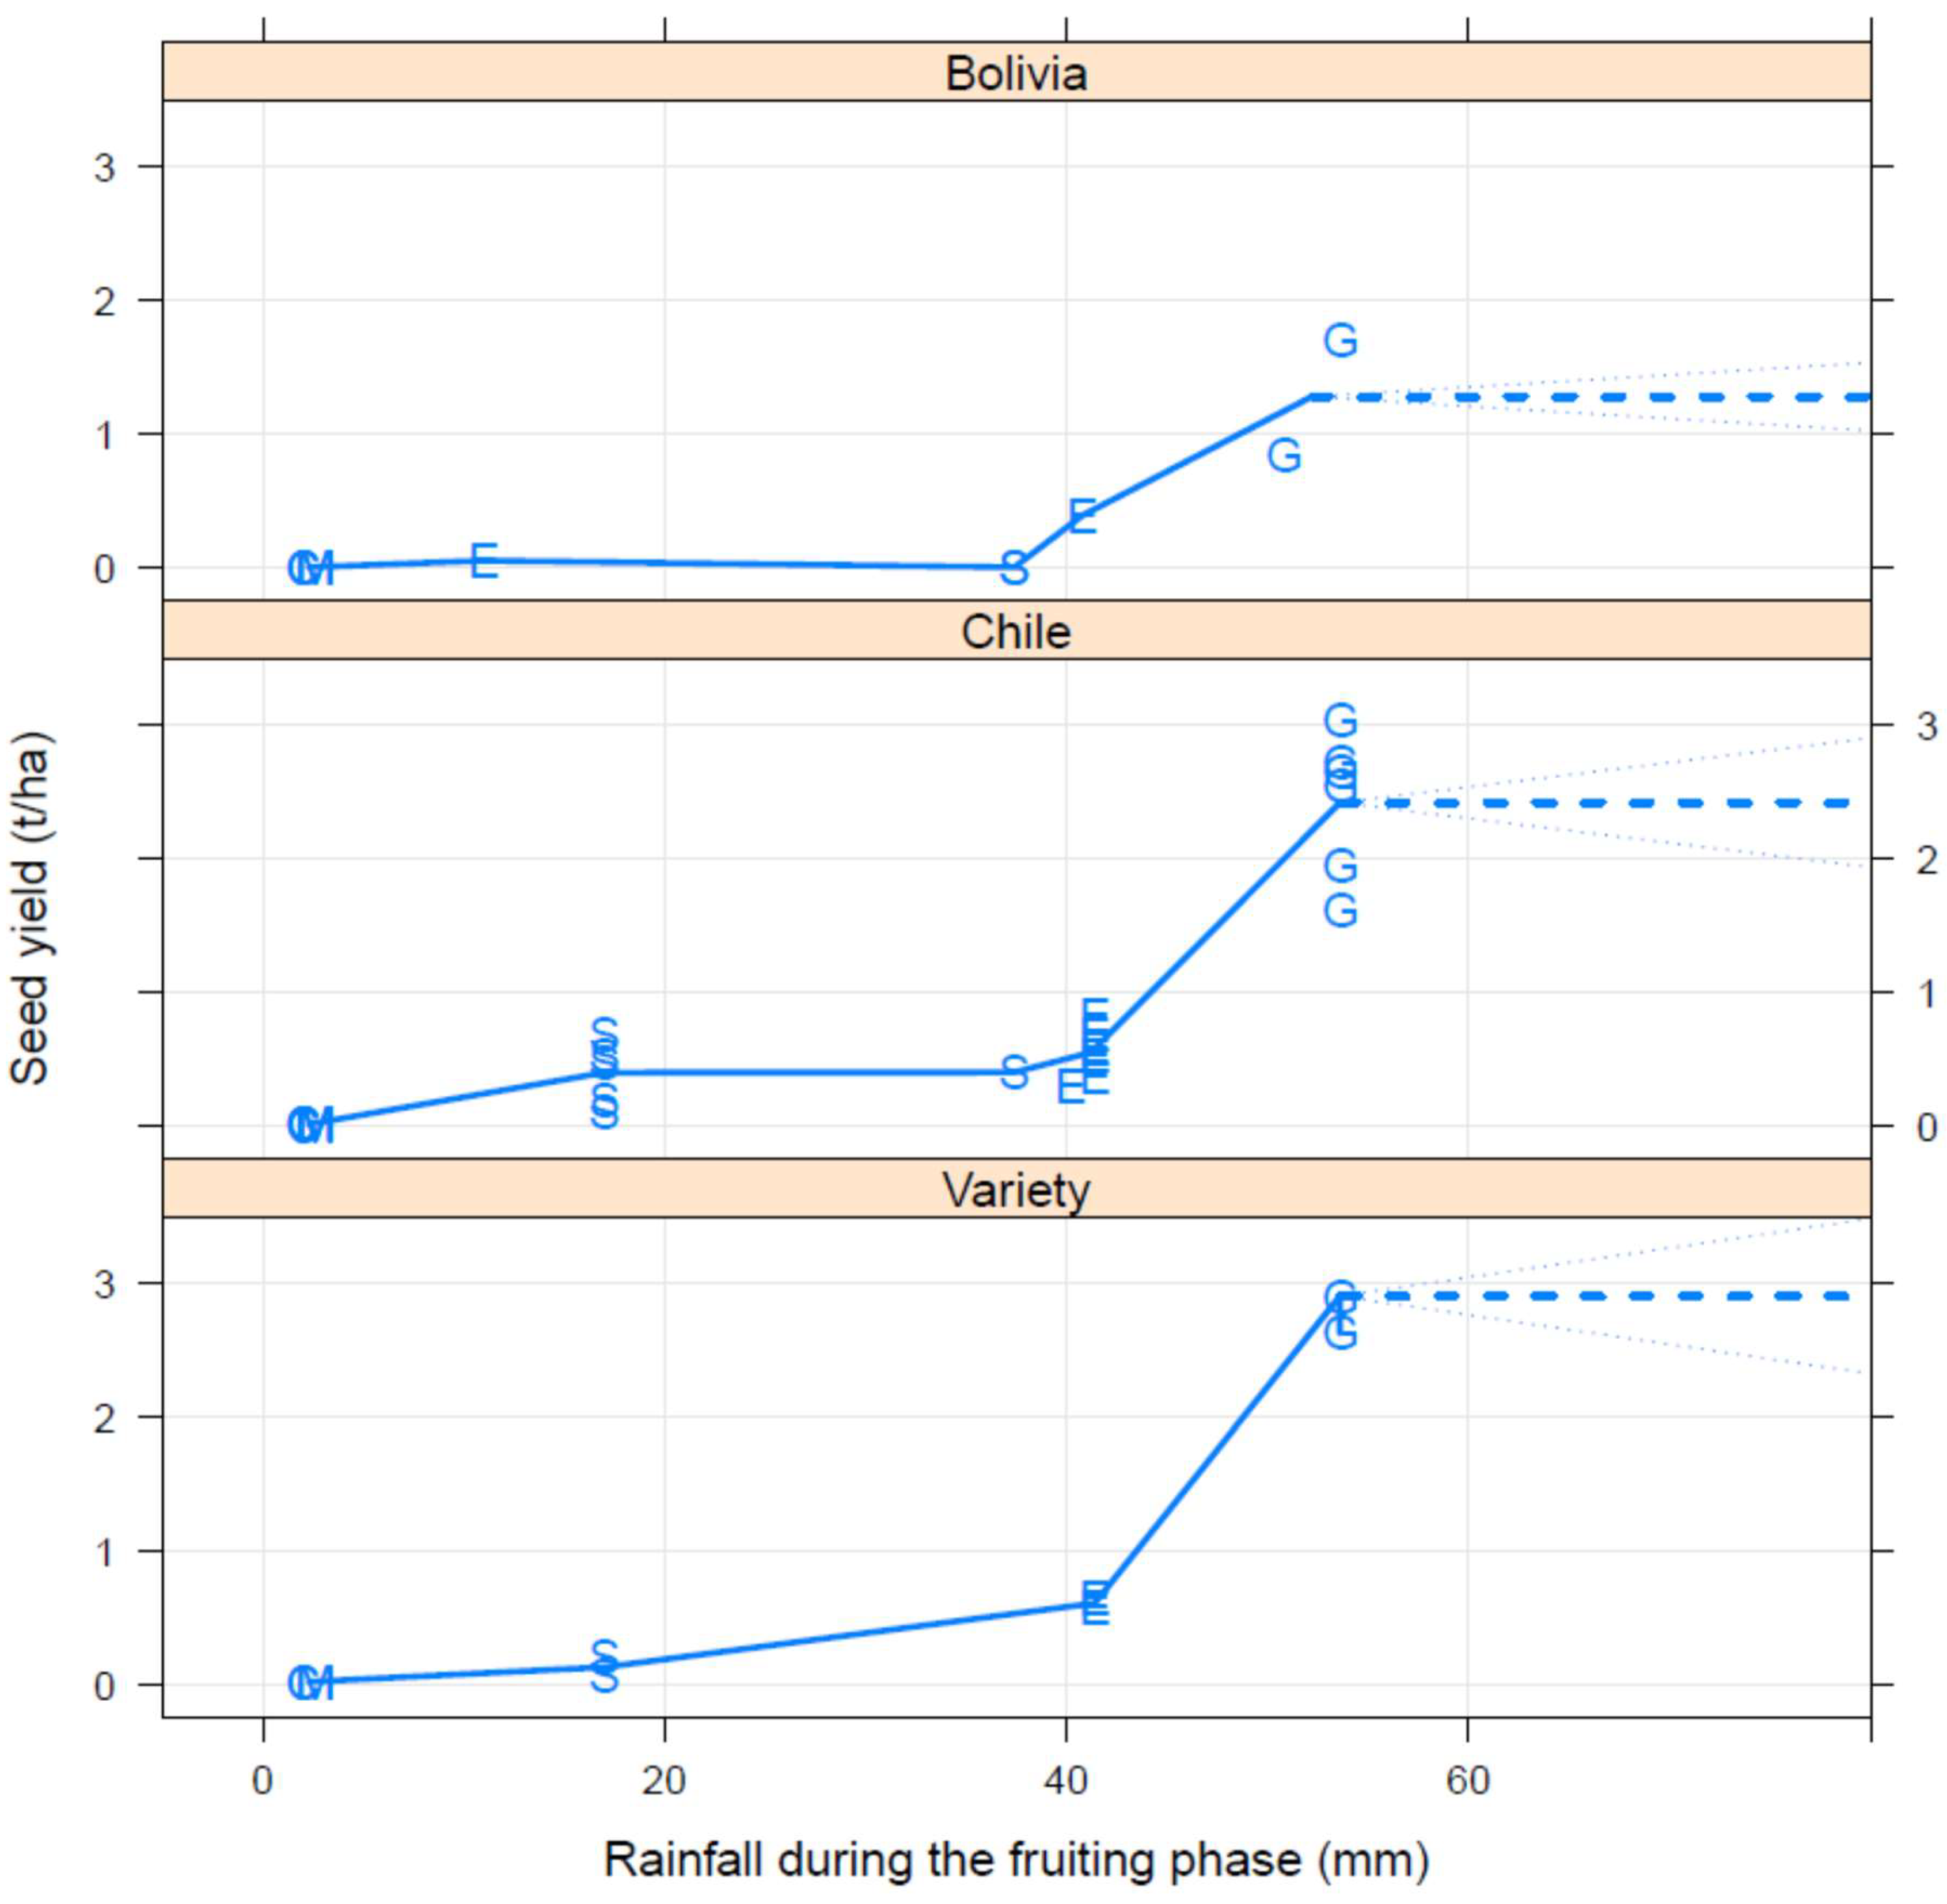
Data for seed yield and rainfall during the seed development stage (second half of the period between commencement of flowering and maturity) for each of the germplasm lines and varieties were analysed as follows. A k-means clustering procedure was used to form the mean centres and then line segments drawn connecting the estimated cluster-means in the graphs for the 3 groups of varieties/lines (Variety, Bolivian and Chilean). Line segments through clustered means were concatenated to approximate the logistic curve. Dashed lines indicate the prediction beyond the maximum observed yield. The natural response of biological processes follows the cumulative normal distribution or the S-shaped logistic curve. The genotype by environment (G × E) ANOVA was conducted to estimate the variation of the two components, genotype and environment.


 ,
,  ’ in 2019. The origin of PI 433232 is documented as Groben, Chile but is likely to be a misspelling of Gorbea, Chile.
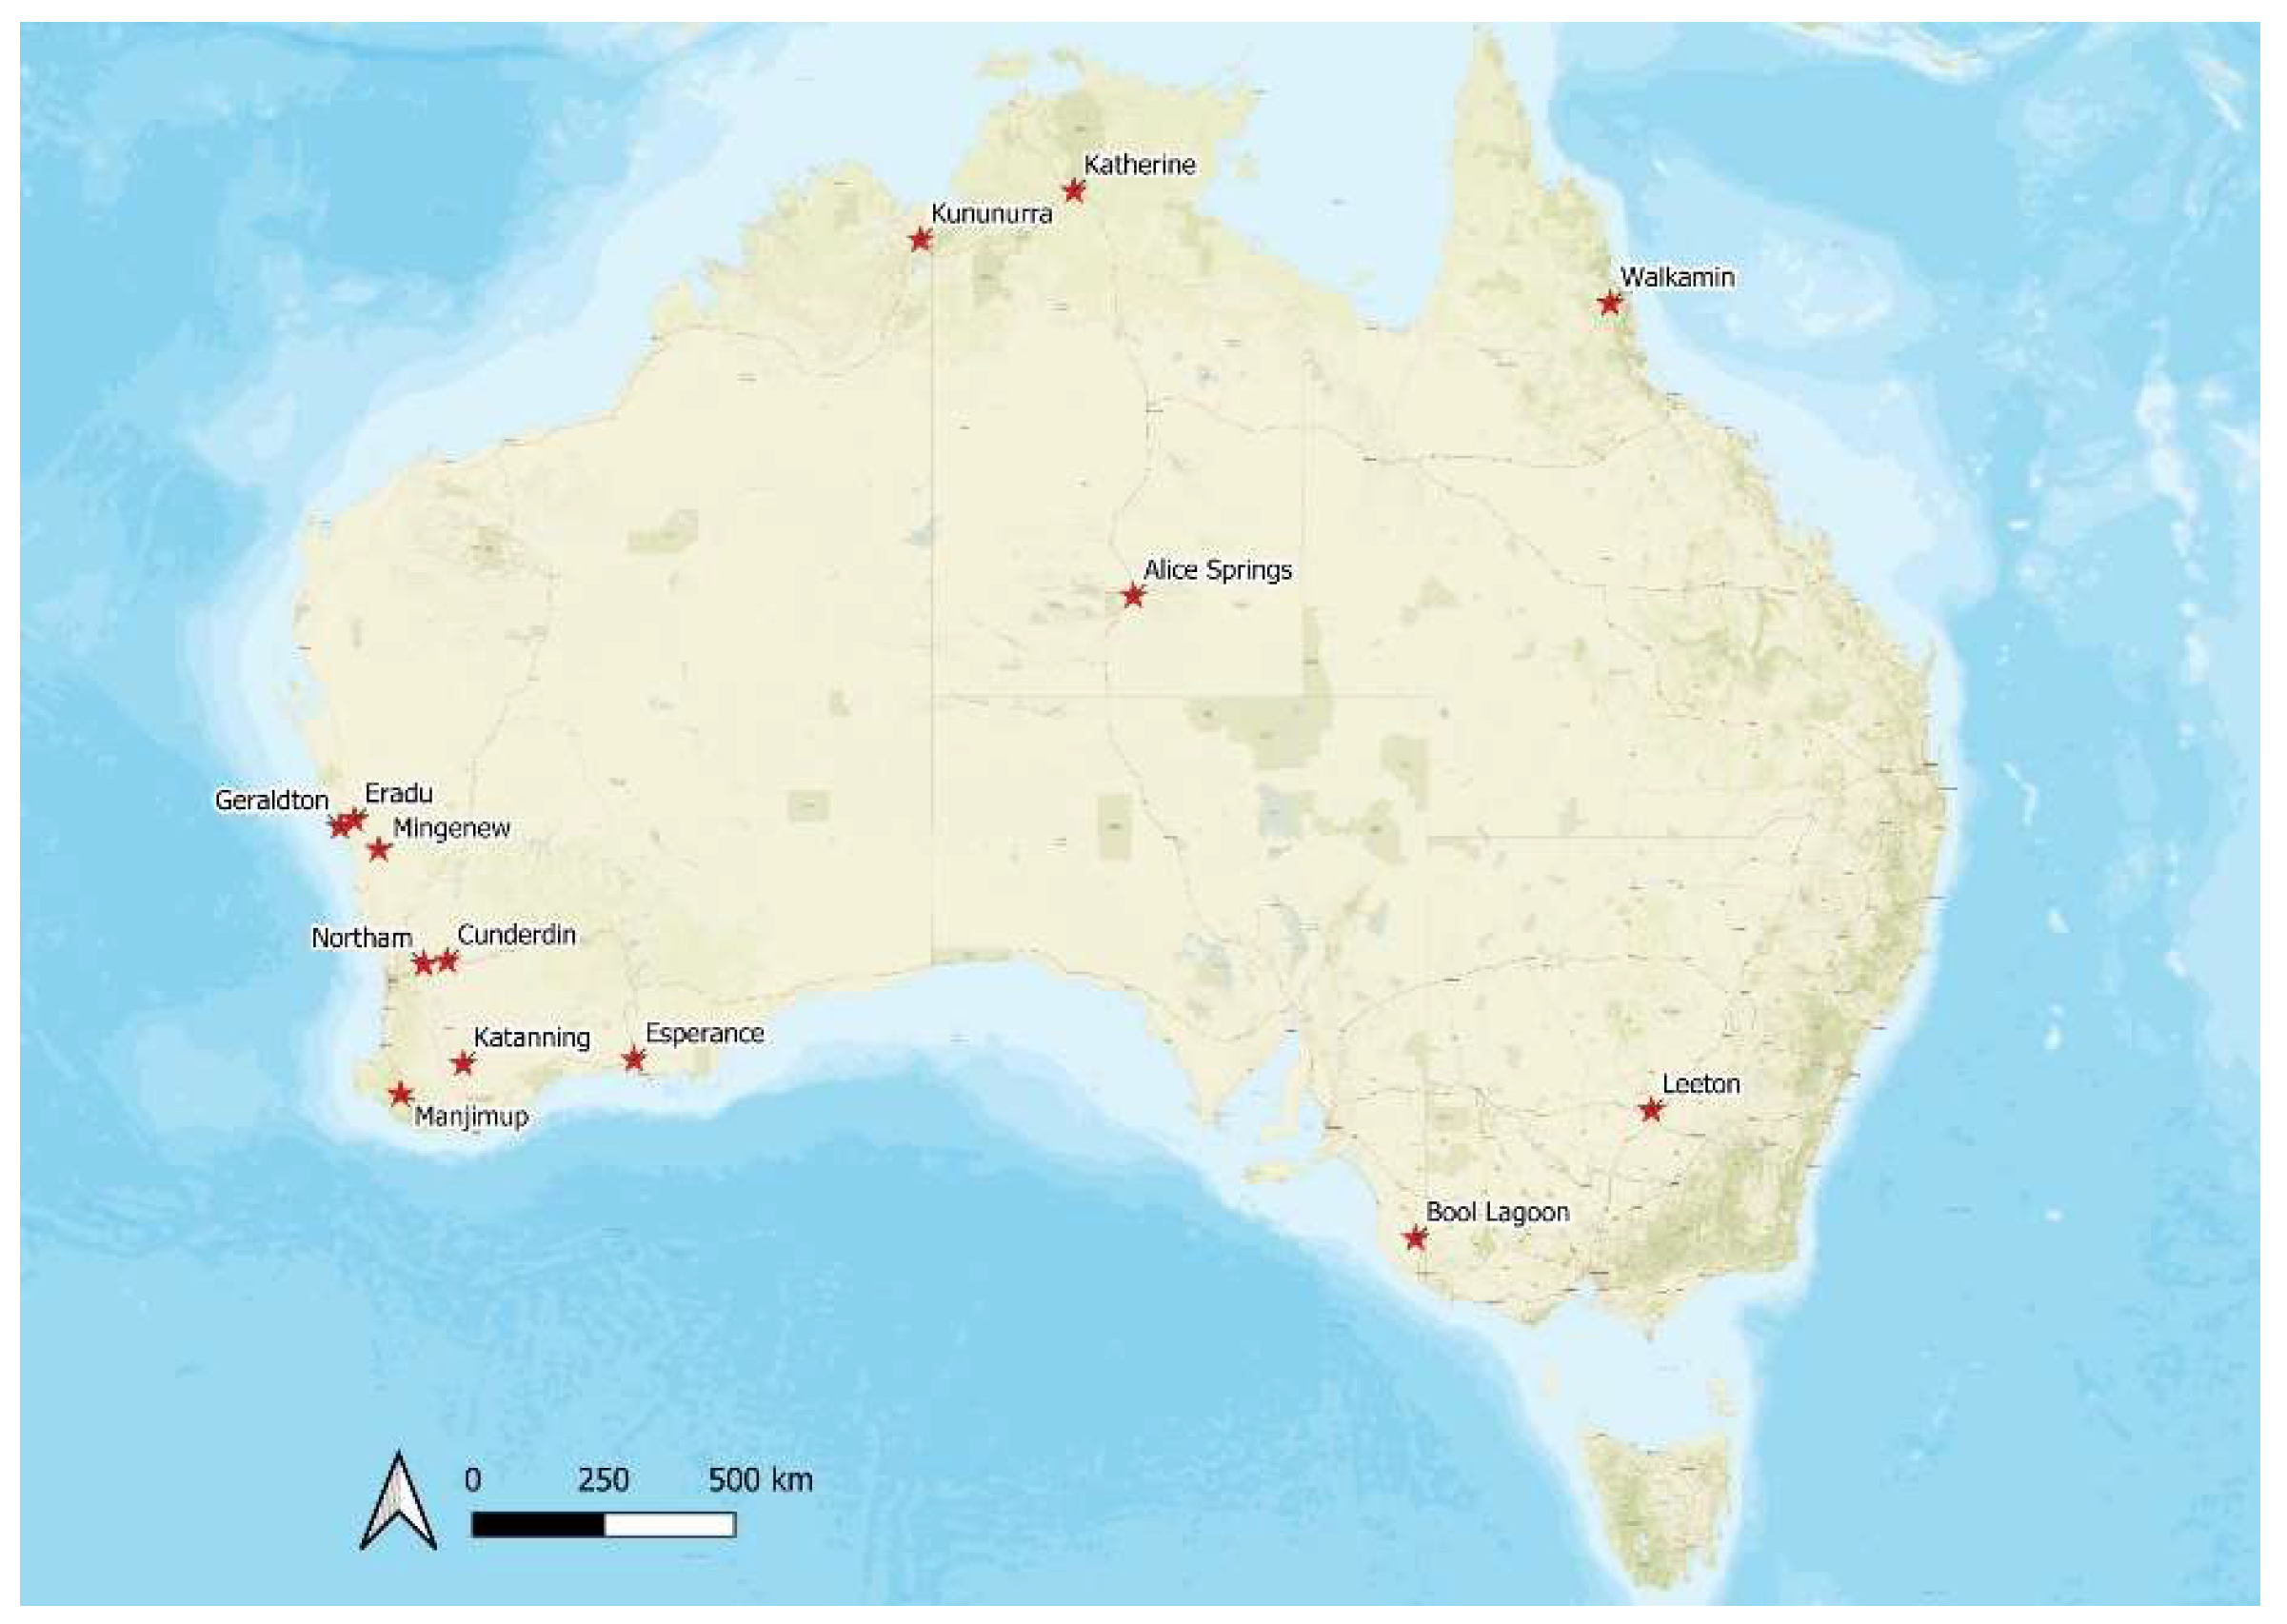


