Article

Crop Load and Thinning Methods Impact Yield, Nutrient Content, Fruit Quality, and Physiological Disorders in ‘Scilate’ Apples

Tasmanian Institute of Agriculture, University of Tasmania, Hobart, TAS 7001, Australia
*
Authors to whom correspondence should be addressed.
Agronomy 2022, 12(9), 1989; https://doi.org/10.3390/agronomy12091989
Submission received: 29 July 2022 / Revised: 18 August 2022 / Accepted: 18 August 2022 / Published: 23 August 2022

Abstract

:
Most apple cultivars produce too many flowers to enable consistent yields of high-quality fruit, thus, crop load management (thinning) is an integral part of orchard management in modern apple cultivation. Crop load is managed by thinning excess flowers and/or fruit from a tree, however ideal targets vary between cultivars. In this two-year study, the effect of thinning methods at different levels of crop load on fruit quality and production, post-harvest storability and physiological disorders, and fruit and leaf nutrient content in ‘Scilate’ apples were investigated in southern Tasmania, Australia. Two thinning methods, artificial bud extinction (ABE) and hand thinning (HT), were compared at three levels of crop load: 3, 6, or 12 fruit cm−2 limb cross-sectional area (LCSA), described as low, medium, and high, respectively. During the second season, all the ABE and HT treatments received additional chemical thinning (CT). The results demonstrated that ABE consistently outperformed HT in terms of improved fruit set, return bloom, and fruit weight. The fruit quality parameters, such as flesh firmness, total soluble solids, dry matter content, malic acid content, and fruit shape, were also improved under the ABE regime, with these positive effects being the clearest in the second season. In general, high-quality fruits were obtained from the low and medium crop loads, while the fruit quality was poor for the high crop load trees, but the low crop load fruit had a slightly higher incidence of internal flesh browning (predominantly radial) and fruit softening after regular atmosphere storage. The crop load also impacted on the fruit and leaf mineral nutrient content, where fruit N, Ca, Mn, and Zn, and leaf N, Fe, Zn, and Cu content increased while fruit and leaf K declined with a higher crop load. High crop load, irrespective of the thinning regime, and HT with a medium crop load, induced severe biennial bearing, whereas, the fruit yield was relatively consistent with ABE, even with a medium crop load. We conclude that ABE with a medium crop load (around six fruit cm−2 LCSA) is an effective method of managing crop load and optimizing the fruit quality in ‘Scilate’ apples.

1. Introduction

Crop load management is a crucial aspect of modern-day apple (Malus x domestica Borkh.) production. Effective crop load management is important for consistency in yield and ensuring a high fruit quality, both of which are crucial to economic sustainability in the apple industry [1]. Many fruit trees, including apple, produce a considerably higher number of flowers than they are able to support to fruit maturation. For a good commercial yield, only around 7–10% of the initial flowers are needed to set fruit [2,3,4,5]. Although apple trees shed some fruit naturally, this is usually not sufficient to achieve desirable and consistent cropping with optimum fruit size and quality [4,6,7].
Early thinning, particularly prior to the completion of cell division, is necessary in order to ensure high quality fruit and to produce high yields [4,7], as fruits act as dominant sinks and require a high investment of tree carbohydrates [4,8,9] and mineral nutrient resources [10] during the early fruit development phase. Thus, high quality and high yield can be achieved by minimizing the wastage and maximizing the supply of carbohydrates and mineral nutrients to the developing fruit [4,9,10]. However, inadequate or untimely thinning practices can lead to production problems, such as a biennial bearing pattern resulting in fluctuating production, compromised tree health, poor fruit quality with increased risk of physiological disorders, and a reduced storage potential [9,11]. The most common techniques that are used for thinning in apple production are hand thinning (HT) and chemical thinning (CT).
Hand thinning, which involves the manual removal of excessive flower or fruit loads, is the most accurate and reliable way of thinning [3,12]. However, performing accurate and timely HT at the early stages of fruit growth, particularly during the blossom stage, is impractical under commercial production systems. It is a highly labor-intensive and complex operation, incurring heavy expenses [4,6,12,13]. Commercially, HT is carried out at the later fruitlet stage, leading to the removal and wastage of a considerable amount of tree resources that have already been invested into the developing fruit [14] and the increased risk of inducing biennial bearing patterns [3,15].
Chemical thinning has become the standard way of managing crop load in commercial apple production [16] and involves the application of plant bioregulators (PBRs), either caustic materials (desiccants) or chemicals with hormonal action, during flowering or post-bloom, followed by complementary hand thinning later in the season [16,17,18,19]. The main advantage of CT is that it minimizes labor costs in comparison to the sole use of HT [20], while still allowing for the production of good yields and high-quality fruit. According to Bound and Jones [21], Robinson and Lakso [22], Bound [18], and Costa et al. [3], there are several drawbacks associated with CT, including unpredictability in effectiveness and a high dependability upon application time, application dose, cultivar, and weather conditions; CT can also result in phytotoxicity under some application conditions and negative environmental impacts and registration complexities are associated with some chemicals.
As both HT and CT have shortcomings, there is a need for the development of alternate, more robust, reliable, economically viable, and environmentally friendly thinning methods.
Lauri et al. [23,24] reported high rates of natural spur extinction in regular bearing cultivars and Lauri and Lespinasse [25] found that cultivars that are prone to alternate bearing can be made to bear more regularly by lowering the axillary shoot numbers per branch. This has led to the introduction of an alternate concept of crop load management known as artificial bud (or spur) extinction (ABE/ASE) [25,26]. ABE is a precision technique that ensures precise fruit positioning and the quantification or estimation of fruit loads [17]. This technique involves the manual removal of floral buds during late winter or early spring in order to reduce the bud density to the desired crop load levels, followed by light HT after fruit set to reduce the clusters to single or double fruit [12,27]. It imitates natural bud extinction but ensures the removal of poorly positioned, undesirable buds while optimizing the bud position and providing increased canopy light interception. In addition, reducing bud density at a very early stage (before flowering) reduces resource wastage and competition for tree resources among the sinks (developing fruit).
In studies that were undertaken in the apple cultivars ‘Galaxy’, ‘Scifresh’, ‘Scilate’ ‘Royal Gala’, ‘Kalei’, ‘Gala’, and ‘Fuji’, ABE was found to improve the fruit set, fruit size, fruit quality, and return bloom in comparison to conventional methods [2,17,28,29,30,31,32,33,34]. The results reported in relation to the gross fruit yield following the application of ABE were variable, with improved yield in ‘Fiero Fuji’ [17], decreased yield in ‘Scifresh’ [31], and no effect on yield in ‘Scilate’ [32], ‘Royal Gala’ [35], ‘Kalei’ [29], and ‘Royal’, ‘Alvina’, and ‘Buckeye’ Gala strains [17]. However, considering the overall benefits, ABE could be a possible alternative to the current best practice CT [17,30]. According to Bound [17], additional benefits of ABE include reliable and consistent cropping with predictable fruit size and yield, the avoidance of weather dependability, and elimination of the negative effects of chemical thinners at comparable costs to CT. Bound [17] also found that the costs that are associated with ABE are reduced in subsequent seasons following the initial implementation.
Most of the ABE studies have compared ABE with conventional thinning methods, such as HT or CT, and have mainly considered regularity in the bearing, fruit yield, fruit quality, and economics. One study with ‘Scilate’ apples by Van Hooijdonk et al. [32] demonstrated that ABE prevented biennial bearing patterns and led to an improvement in the fruit size, blush cover, and dry matter content. However, none of these studies have investigated the effect of ABE and different levels of crop loads on physiological disorders, fruit and leaf nutrients, and leaf area (representing the tree health status). Thus, in this study, along with comparing ABE and HT alone or in combination with chemical thinners at different crop levels for bearing patterns, fruit quality, and yield, we have also examined the effect of these thinning regimes and crop load levels on the incidence of physiological disorder (internal flesh browning) and fruit softening, as well as on fruit and leaf nutrients and leaf area.

2. Materials and Methods

The trial was conducted over two consecutive seasons on a commercial orchard situated in the Huon Valley in southern Tasmania, Australia (43°02′ S, 146°98′ E). The study was commenced in August 2019 with 6-year-old ‘Scilate’ regrafted trees (originally ‘Pink Lady’) on MM 106 rootstock, planted with a 4.5 m × 2 m row and tree spacing, in a north-west/south-east row orientation with a planting density of 1100 trees/hectare.

2.1. Experimental and Treatment Design

A total of 36 trees were selected in early spring 2019 and six treatments were allocated at random to single tree plots, with six replicates per treatment. A factorial treatment design was used with two thinning regimes (ABE or HT) at three crop load levels (3, 6, or 12 fruit cm−2 limb cross-sectional area (LCSA), described as low, medium, and high, respectively). The treatment details are described in Table 1.

2.2. Treatment Setup and Counts

The ABE treatment was applied to the entire tree in early spring (September) of each season; the limbs were measured 2 cm from their base using an Equilifruit disc (National Institute for Agricultural Research, Paris, France) and the required flower bud density of 3, 6, or 12 buds cm−2 LCSA was determined depending on the allocated treatment. Where possible, the poorly positioned, weak, and shaded buds were removed to achieve adequate spatial arrangement of healthy and well-positioned buds on each limb. The terminal buds were retained in preference to spurs as they have been shown to set higher quality fruit [36]. The axillary buds were removed from one-year-old wood by stripping with the thumb and forefinger to leave one bud approximately every 10 cm. Trees were hand thinned in mid-November after final fruit set. Clusters on the ABE-treated trees were thinned to a single fruit per bud, or double where necessary, to maintain the required level of crop load. The crop loads on the HT treatments were set at the time of commercial hand thinning in mid-November, using Equilifruit discs, to determine the fruit numbers on each limb, again retaining single or double fruitlets in each cluster to obtain the required fruit numbers.
The return bloom was assessed in season two by counting the number of flower clusters on the tree. In season two, all trial trees were accidently sprayed by the grower with chemical thinner (CT) consisting of 1.3% Biothin (782 g L−1 ammonium thiosulphate, SST, Australia (ATS)) + 125 mL L−1 Ethrel (720 g L−1 ethephon, Nutrien Ag Solutions) on 7th October followed by 1.3% ATS on 13th October in 750 liter of water per hectare. This is a standard method for crop load management used by growers in Australia. As all trial trees received the same chemical thinners and we were making comparisons between the different treatments, we believe it does not affect the validity of the results, particularly as the second-year data tends to corroborate the first-year results; therefore, we believe that no misleading inferences have been made by including the second year in the analysis. We also endeavored to analyze each year separately and clearly show all data within the charts (so nothing is hidden or confounded).

2.3. Sample Collection and Storage

The leaf and fruit samples were collected the day prior to commercial harvest in mid-April (Table 1).
For the leaf samples, 20 fully mature leaves were randomly collected from the middle of the branches of the current-season tree growth for each tree; within each treatment, replicates one and two, three and four, and five and six were pooled to give three replicates of 40 leaves per treatment. After measuring the individual leaf area (ILA) using a leaf area meter (Model LI-3000C with a transparent belt conveyor accessory, LI-COR, Nebraska, USA) the leaf samples were stored in labelled paper bags and placed in a hot air oven at 60 °C for drying until a constant weight was attained. The dried leaf samples were then sent to a commercial laboratory for nutrient analysis, including nitrogen (N), phosphorus (P), potassium (K), calcium (Ca), magnesium (Mg), boron (B), iron (Fe), manganese (Mn), zinc (Zn), and copper (Cu). Total N was determined using Rayment and Lyons [37] ‘Method 9G2’, while all other nutrients were estimated through an inductively coupled plasma (ICP) spectroscopy test, which used the procedures explained by McQuaker et al. [38].
For fruit sampling, 70 fruits were randomly harvested from each tree and returned to the laboratory. The samples from each tree were sorted and divided into two sub samples, with 25 defect-free fruits each (selected at random), one for ‘harvest’ and the second for ‘post-harvest’ assessments. As we were unable to follow the standard cool-down protocol for ‘Scilate’, all sub samples were placed into a regular atmosphere cool room at 1 °C. The harvest fruit quality assessments were completed within a few days of harvest and the post-harvest assessments were undertaken after 7.5 months of storage.

2.4. Fruit Quality Assessments

The fruit quality assessments at harvest included fruit weight, length, diameter, color, DA index, flesh firmness, total soluble solids (TSS), starch pattern index (SPI), dry matter content (DMC), and malic acid (MA) content.
The fruit weight was measured on a digital balance; fruit length and diameter (mm) were measured using digital vernier calipers and length/diameter (L/D) ratio representing fruit shape was calculated. The fruit color was measured with a chroma meter (Model CR-400, Konica Minolta, Tokyo, Japan), taking one observation per fruit from the brightest portion of blush to give L* (lightness: 0 = black, 100 = white), a* (green-red: negative = green, positive = red), and b* (blue-yellow: negative = blue, positive = yellow) values. The fruit skin chlorophyll content (DA index) was estimated with a DA meter (Model FRM01, Sinteleia, Bologna, Italy). The fruit flesh firmness (kg) was measured on pared flesh with a fruit texture analyzer (Güss Model GS-20, Strand, South Africa) fitted with an 11 mm penetrometer probe. The juice expressed from the fruit during the firmness measurements was collected with a plastic pipette and was used to determine the TSS content (°Brix) with a digital refractometer (Atago PR-1, Atago Co. Ltd., Tokyo, Japan).
The fruit was then cut transversely through the core and the cut surface of the calyx half was painted with iodine solution to estimate the SPI using the ENZA 6-point starch pattern chart (ENZA International Ltd., Hastings, New Zealand). Two 2.5 cm wedges were cut from opposite sides of the stem half and sliced to ≤1 cm thickness before placing into pre-weighed paper cups, which were then weighed and air dried at 60 °C until a constant weight was attained. The dry weight was recorded, and the percentage DMC was calculated. The dried fruit samples from each treatment were bagged, labelled, and sent to a commercial laboratory for assessment of fruit nutrient content (as for leaf samples). The remaining portion of the stem half was used for juice extraction and the juice from all 25 fruits in each replicate was mixed, filtered, and used for determining MA content with a Mettler Toledo G20 compact titrator.
The post-harvest fruit assessments included fruit weight, flesh firmness, TSS, color, and MA content. The incidence of internal flesh browning (IFB) was measured through subjective assessments by transversely cutting the fruit into four equal slices. The type of browning (radial or CO2 injury) and incidence were recorded based on the portion of flesh affected using a scale of 1 to 5, where 1 represented no IFB, 2 represented <25%, 3 represented 25–50%, 4 represented 50–75%, and 5 represented >75% of flesh affected. To confirm the type of IFB, the symptomatic fruit were examined using a scanning electron microscope. The fruit softening (FS) was expressed in terms of percentage loss in firmness during storage and was calculated from the harvest and post-harvest flesh firmness.

2.5. Soil Sampling

As the trees were located in a small uniform block, a composite soil sample was collected during August 2019 and 2020; 10 cores were randomly collected from the trial block using a tube soil sampling auger and were mixed thoroughly. The samples were air dried, and all the visible roots, debris, and gravel were removed. The samples were forwarded to a commercial laboratory for nutrient analysis. The results of various soil parameters and nutrient status during both seasons are displayed in Table 2.

2.6. Statistical Analysis

All data were subjected to analysis of variance (two-way ANOVA) using statistical software R (version 4.1.0). The presented data are the mean values for each treatment and the exact p values are provided. The residuals of all ANOVA models were checked and found to be approximately normally distributed, except for the models relating to the fruit Mg and IFB percentages. The fruit Mg had very little variance between samples, therefore, the ANOVA results reported here (no evidence of thinning method or crop load effects) are not misleading. For IFB, instead of ANOVA results, we reported the results of chi-squared tests (using Fisher’s exact test p-values) based on the counts of an auxiliary categorical variable that records if ‘any brown fruit at all is found on a tree’ (contingency tables for thinning regime, crop load, and year were analyzed). In addition, the data from both seasons related to the fruit set and ILA were pooled and subjected to Pearson’s correlation test.

3. Results

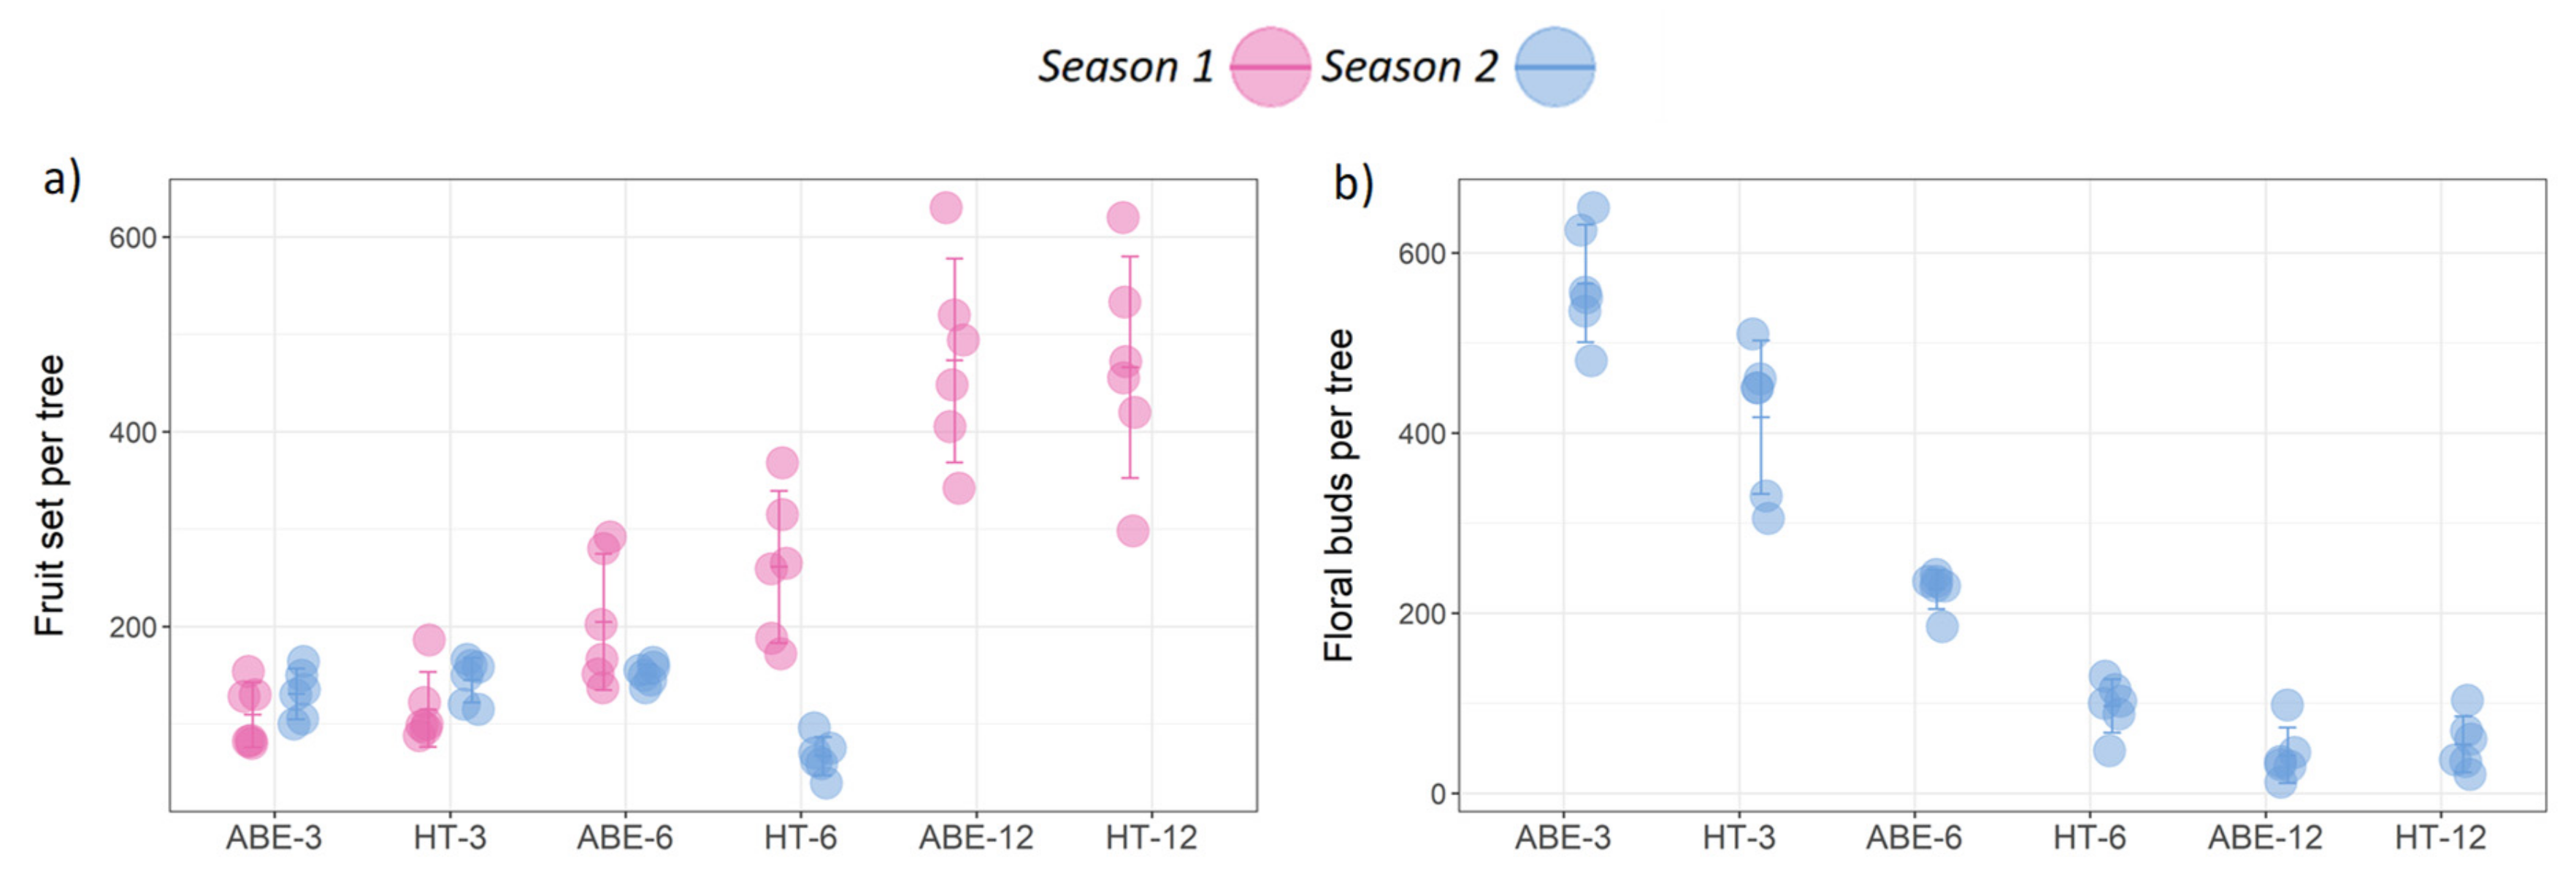
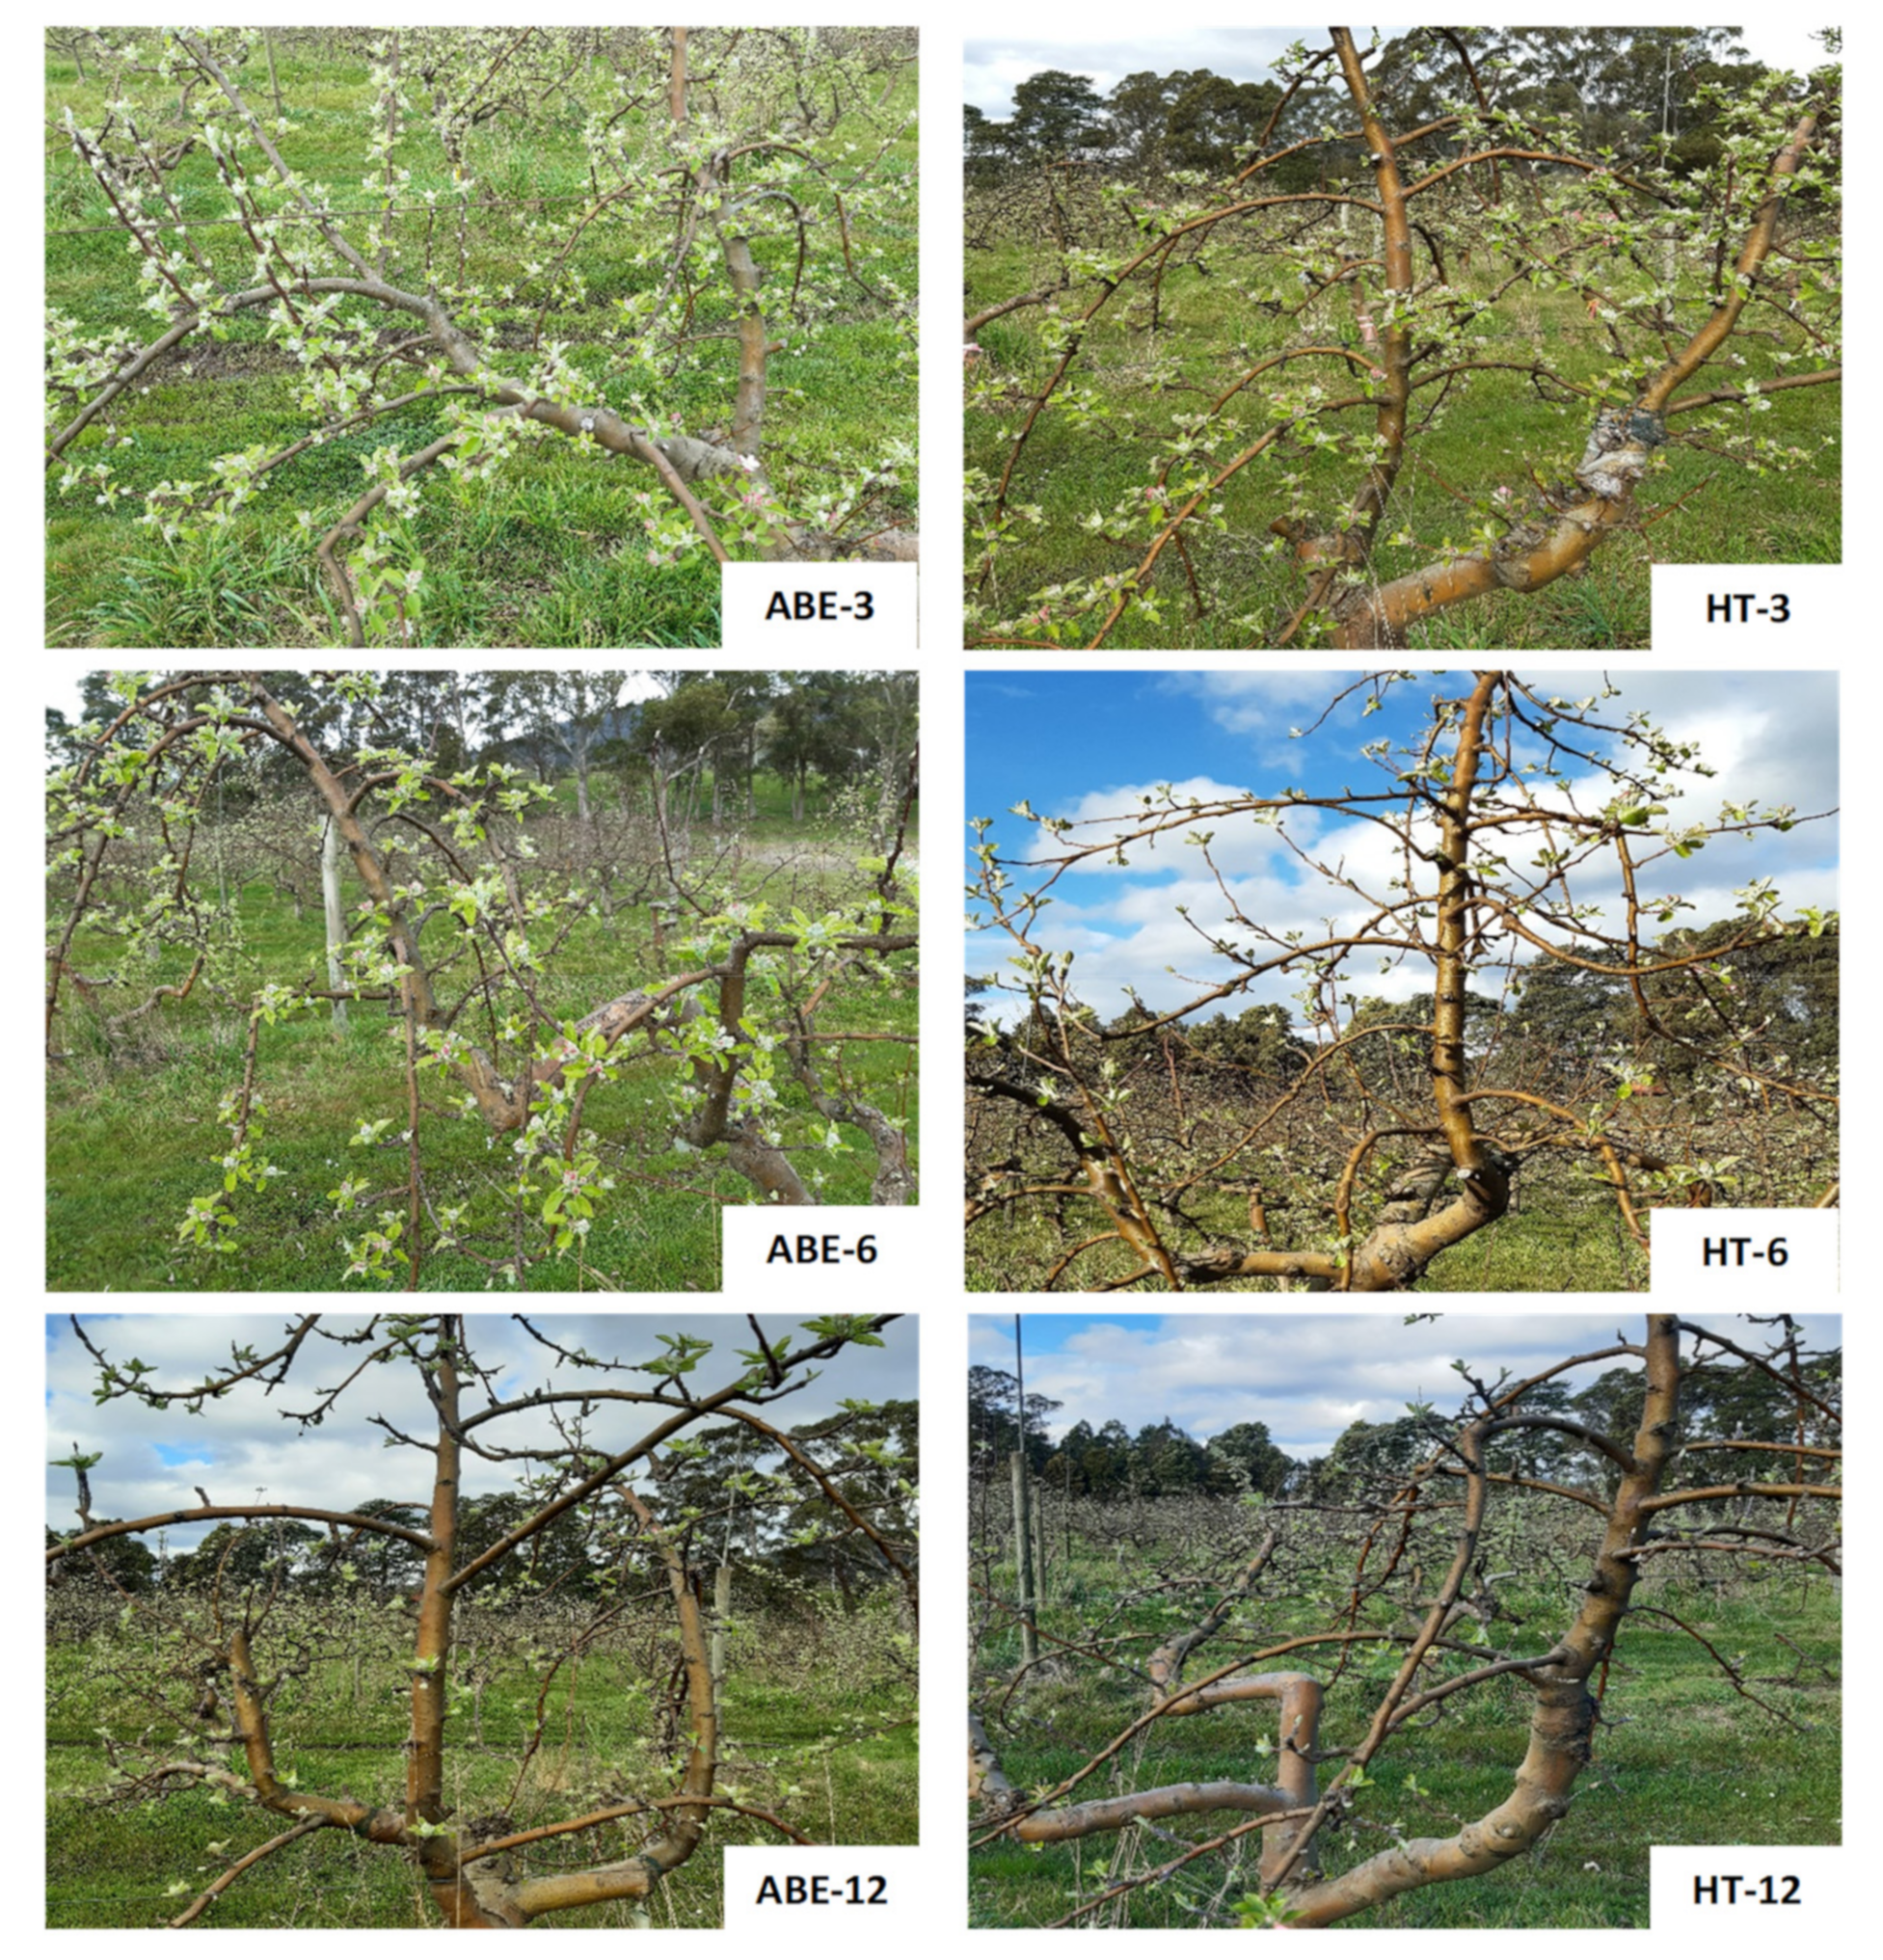
3.1. Fruit Set and Return Bloom

In season one, the thinning regime had no effect on the fruit set, however, as expected, the level of crop load significantly influenced fruit set (p < 0.001), with the heaviest crop load in the high crop load treatments, followed by the medium, and then low crop load treatments, irrespective of the thinning regime (Figure 1a). There was no evidence of an interaction between thinning regime and crop load. However, during season two, thinning regime (p < 0.001), crop load (p = 0.002), and their interaction (p < 0.001) had a significant effect on fruit set. Fruit set was consistent across the seasons in the low and medium crop load levels, except for HT-6, where it was significantly lower than ABE-6. Irrespective of the thinning regime, the high crop load of 12 fruit cm−2 LCSA induced severe biennial bearing, producing only few or no fruit per tree in season two.
During season two, the highest return bloom was recorded in the low crop load treatments, followed by the medium and the high crop load treatments. The ABE treatments improved return bloom compared with the HT treatments, except under heavy crop load (12 fruit cm−2 LCSA) (Figure 1b and Figure 2). The return bloom was higher in the ABE treatments compared with HT treatments at both the low and medium crop loads.

3.2. Fruit Weight and Yield

The fruit weight during both seasons was significantly higher in the ABE treatments compared with the HT treatments (p < 0.001) (Figure 3a and Figure 4). The fruit from the ABE treatments were heavier than HT (48.7 g and 70.0 g for season one and two, respectively). The crop load level had a significant effect on the fruit weight in both seasons, with lower crop loads resulting in heavier fruit (p < 0.001). There was no significant interaction between the thinning regime and the crop load in season one (p = 0.081), however a significant interaction was observed in season two (p = 0.039).
The fruit yield varied significantly with the crop load in both seasons (p < 0.001) (Figure 3b); in season one there was an increasing trend with an increase in crop load, but in season two both the ABE-12 and the HT-12 treatments had no fruit for harvest and yield was reduced in HT-6. There was no interaction between the thinning regime and the crop load in relation to the fruit yield during season one, but a significant interaction was observed in season two (p < 0.001). The thinning regime had no effect on the yield in season one (p = 0.072), but in season two the yield was significantly higher in the ABE-managed trees compared with the HT trees. In season two, the fruit yield was increased by 42.70% in ABE-3 and 45.48% in HT-3, while ABE-6 maintained similar yields in both seasons (37.7 kg tree−1 or 41.4 tonnes ha−1 in season one; 36.1 kg tree−1 or 39.7 tonnes ha−1 in season two), but in the HT-6 trees there was a severe yield loss in season two (9.5 kg tree−1 or 10.5 tonnes ha−1), and there was no yield obtained in the ABE-12 or HT-12 treatments.

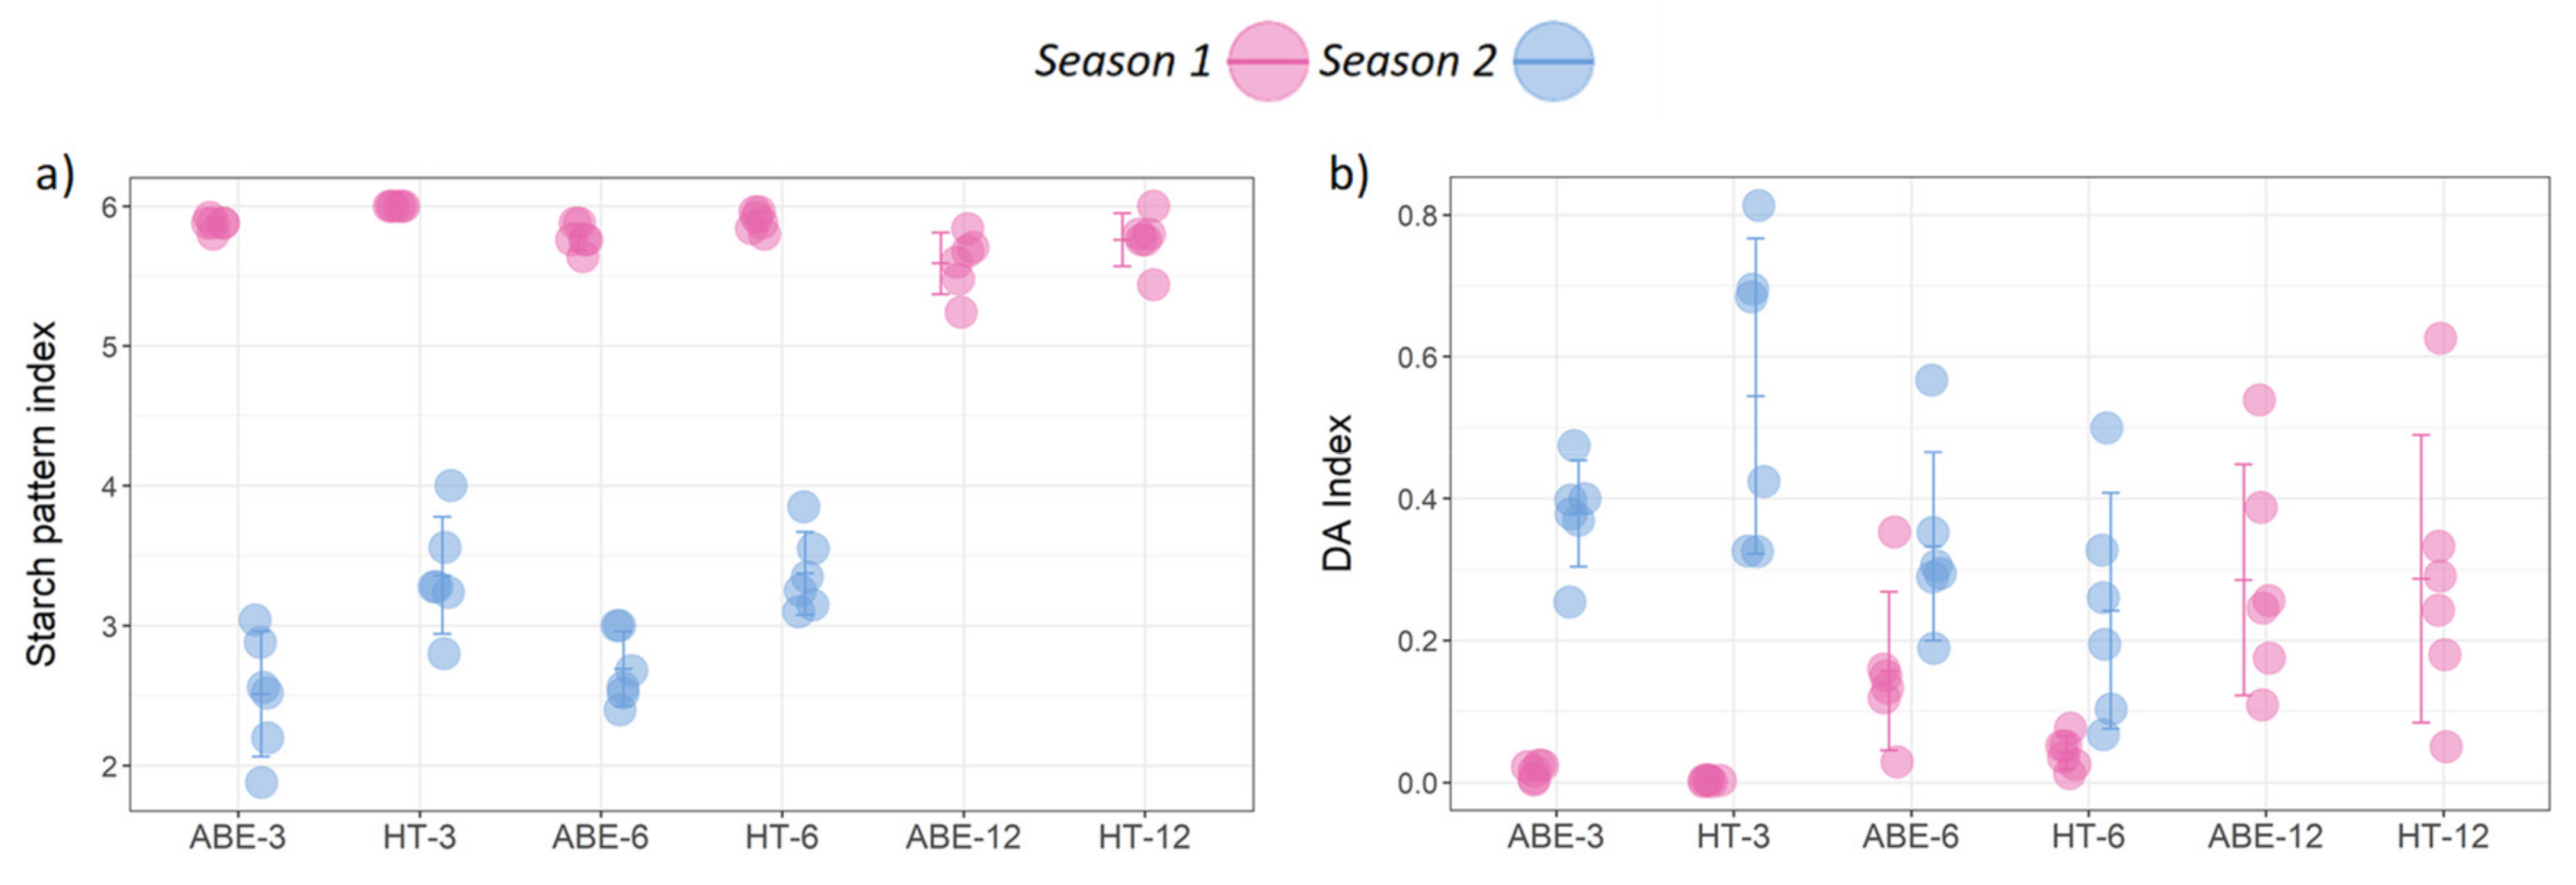
3.3. Fruit Maturity at Harvest

In relation to fruit maturity at harvest, the thinning regime had a significant effect on the SPI during both seasons (season one: p = 0.002; season two: p < 0.001). The SPI was lower in the fruit from the ABE-managed trees compared with the HT trees (Figure 5a). The effect of crop load level on SPI varied between the two seasons; in season one, while the fruit were very mature at harvest, the crop load was higher and the SPI was lower, indicating the presence of more starch.
The thinning regime had no effect on the fruit skin background color, measured as DA index, during either season (season one: p = 0.259; season two: p = 0.55) (Figure 5b). The crop load had a significant effect on the DA index in season one (p < 0.001), with the fruit from the higher crop loads having a higher DA index (greener skin = higher chlorophyll content) than the fruit from the lower crop loads. However, in season two (p = 0.01) this trend was reversed. There was no interaction between the thinning regime and the crop load for either the SPI or the DA index.

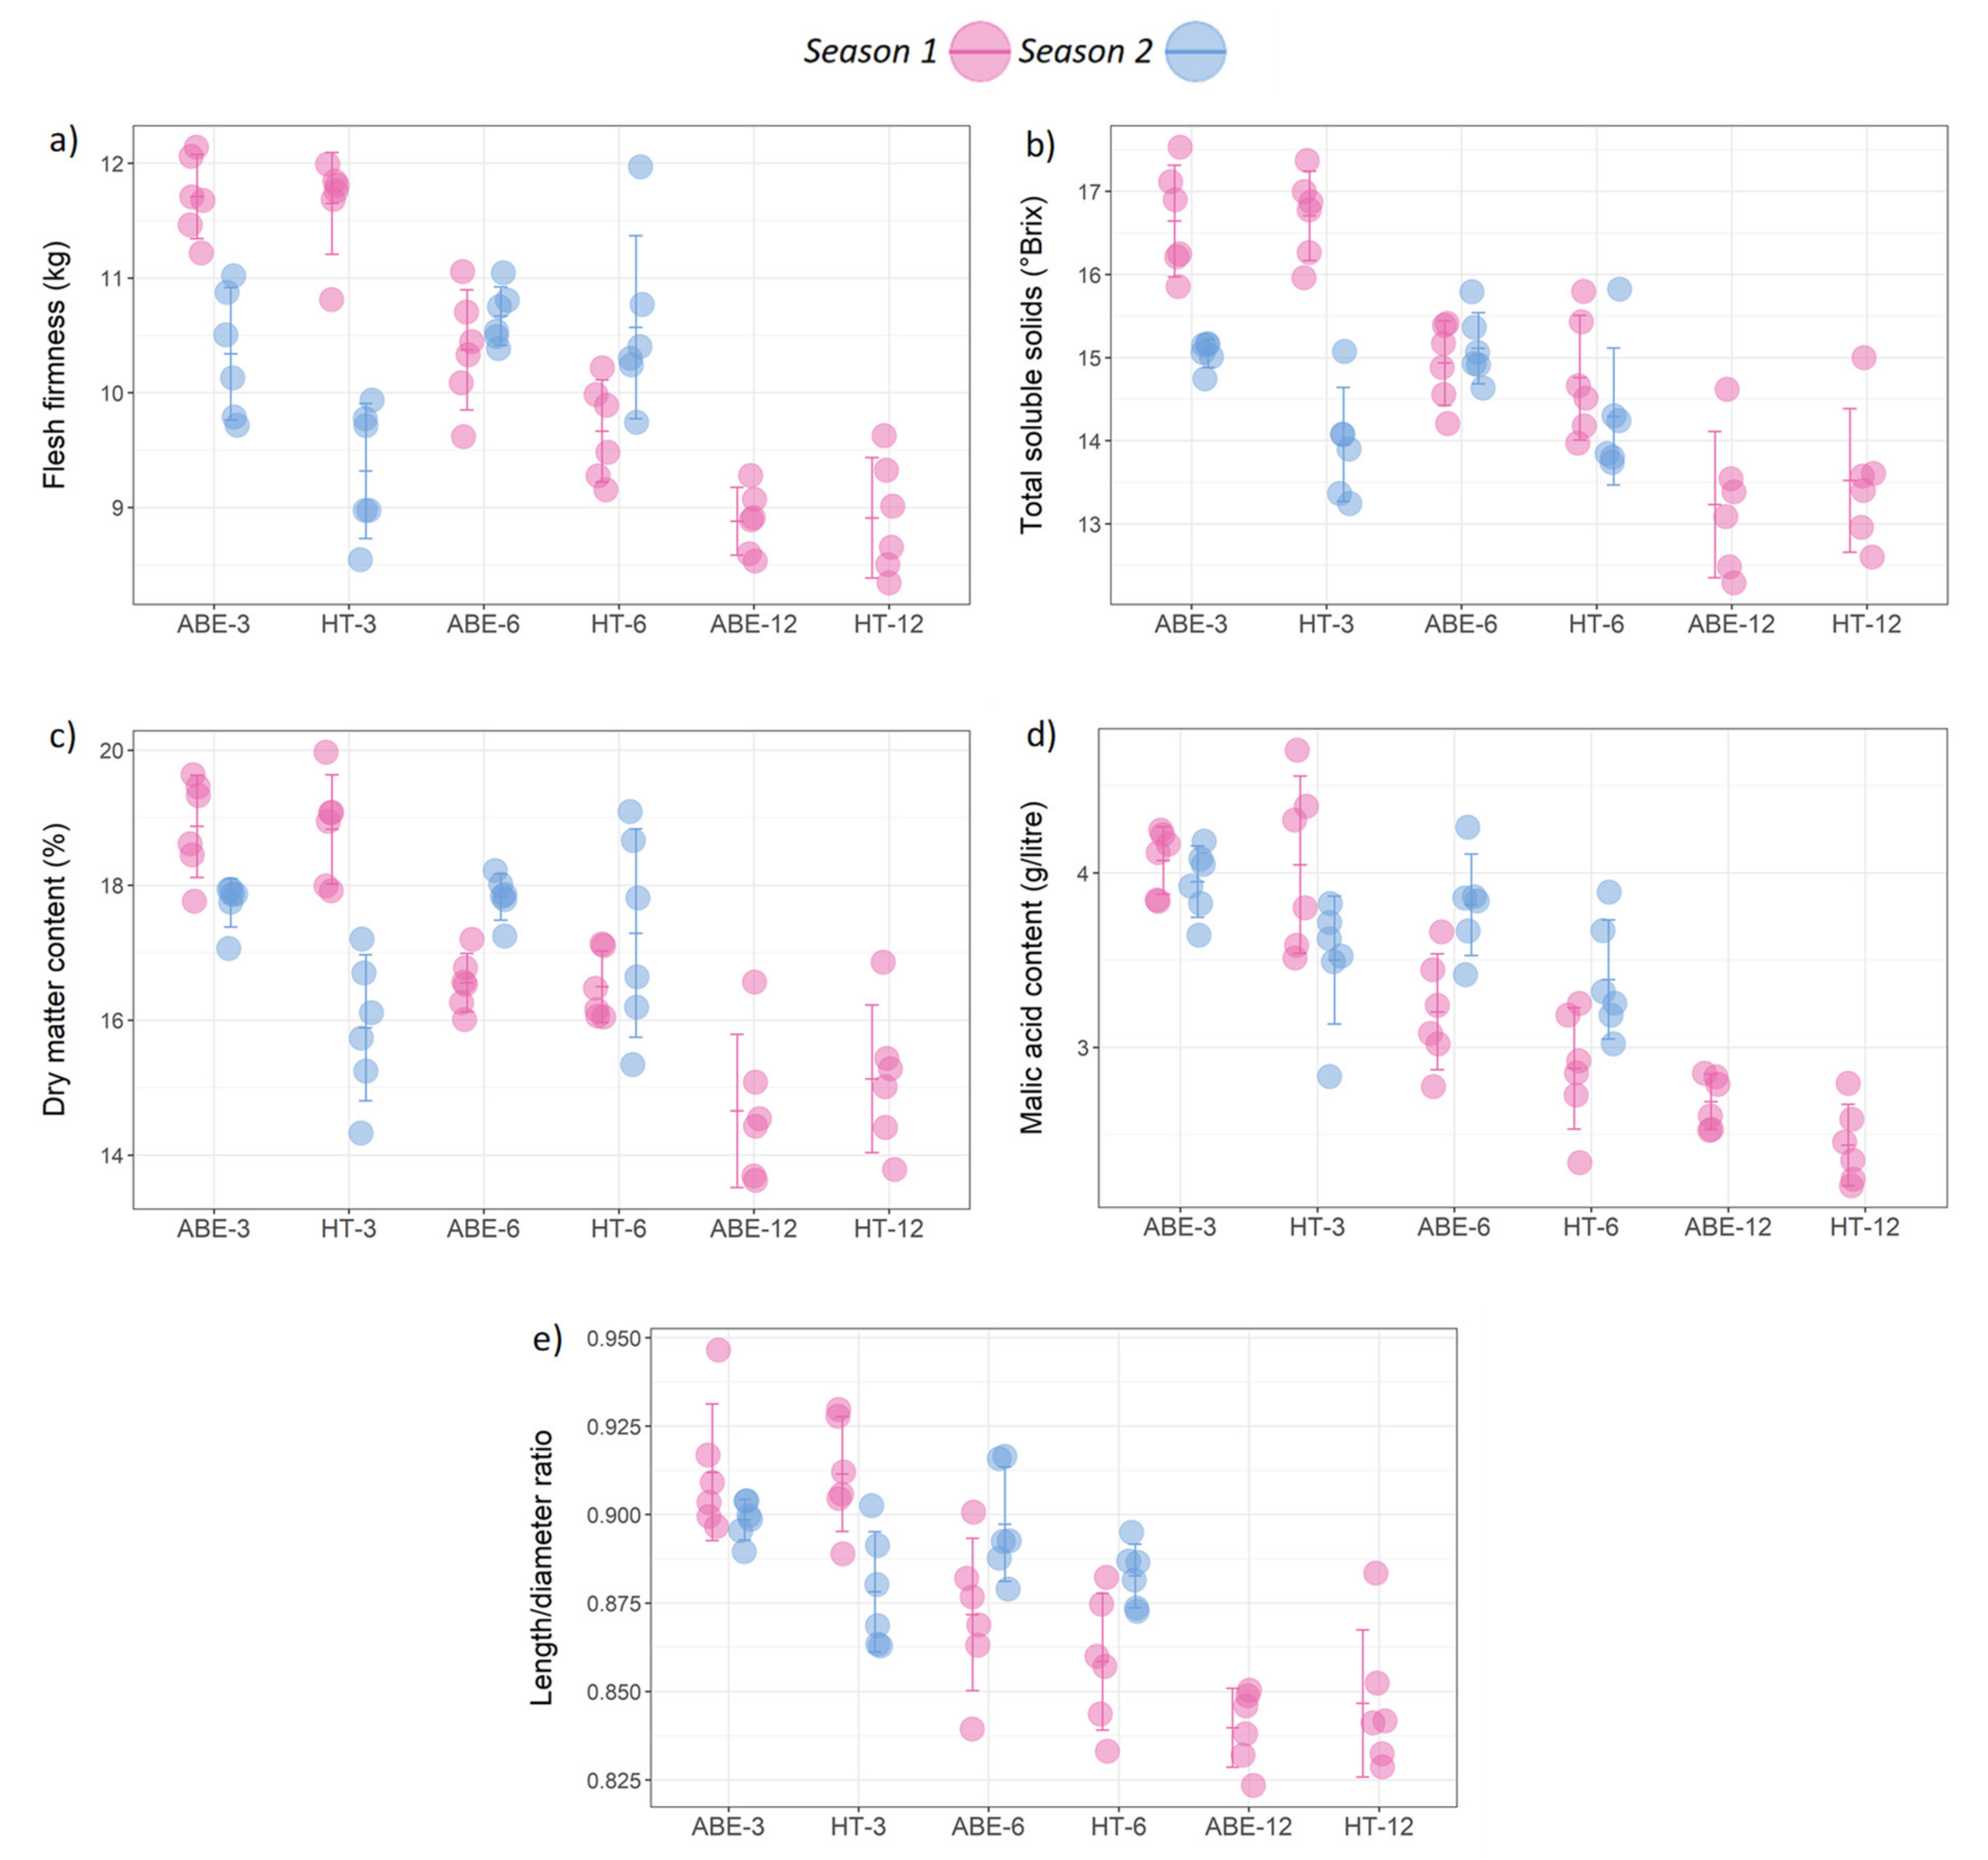
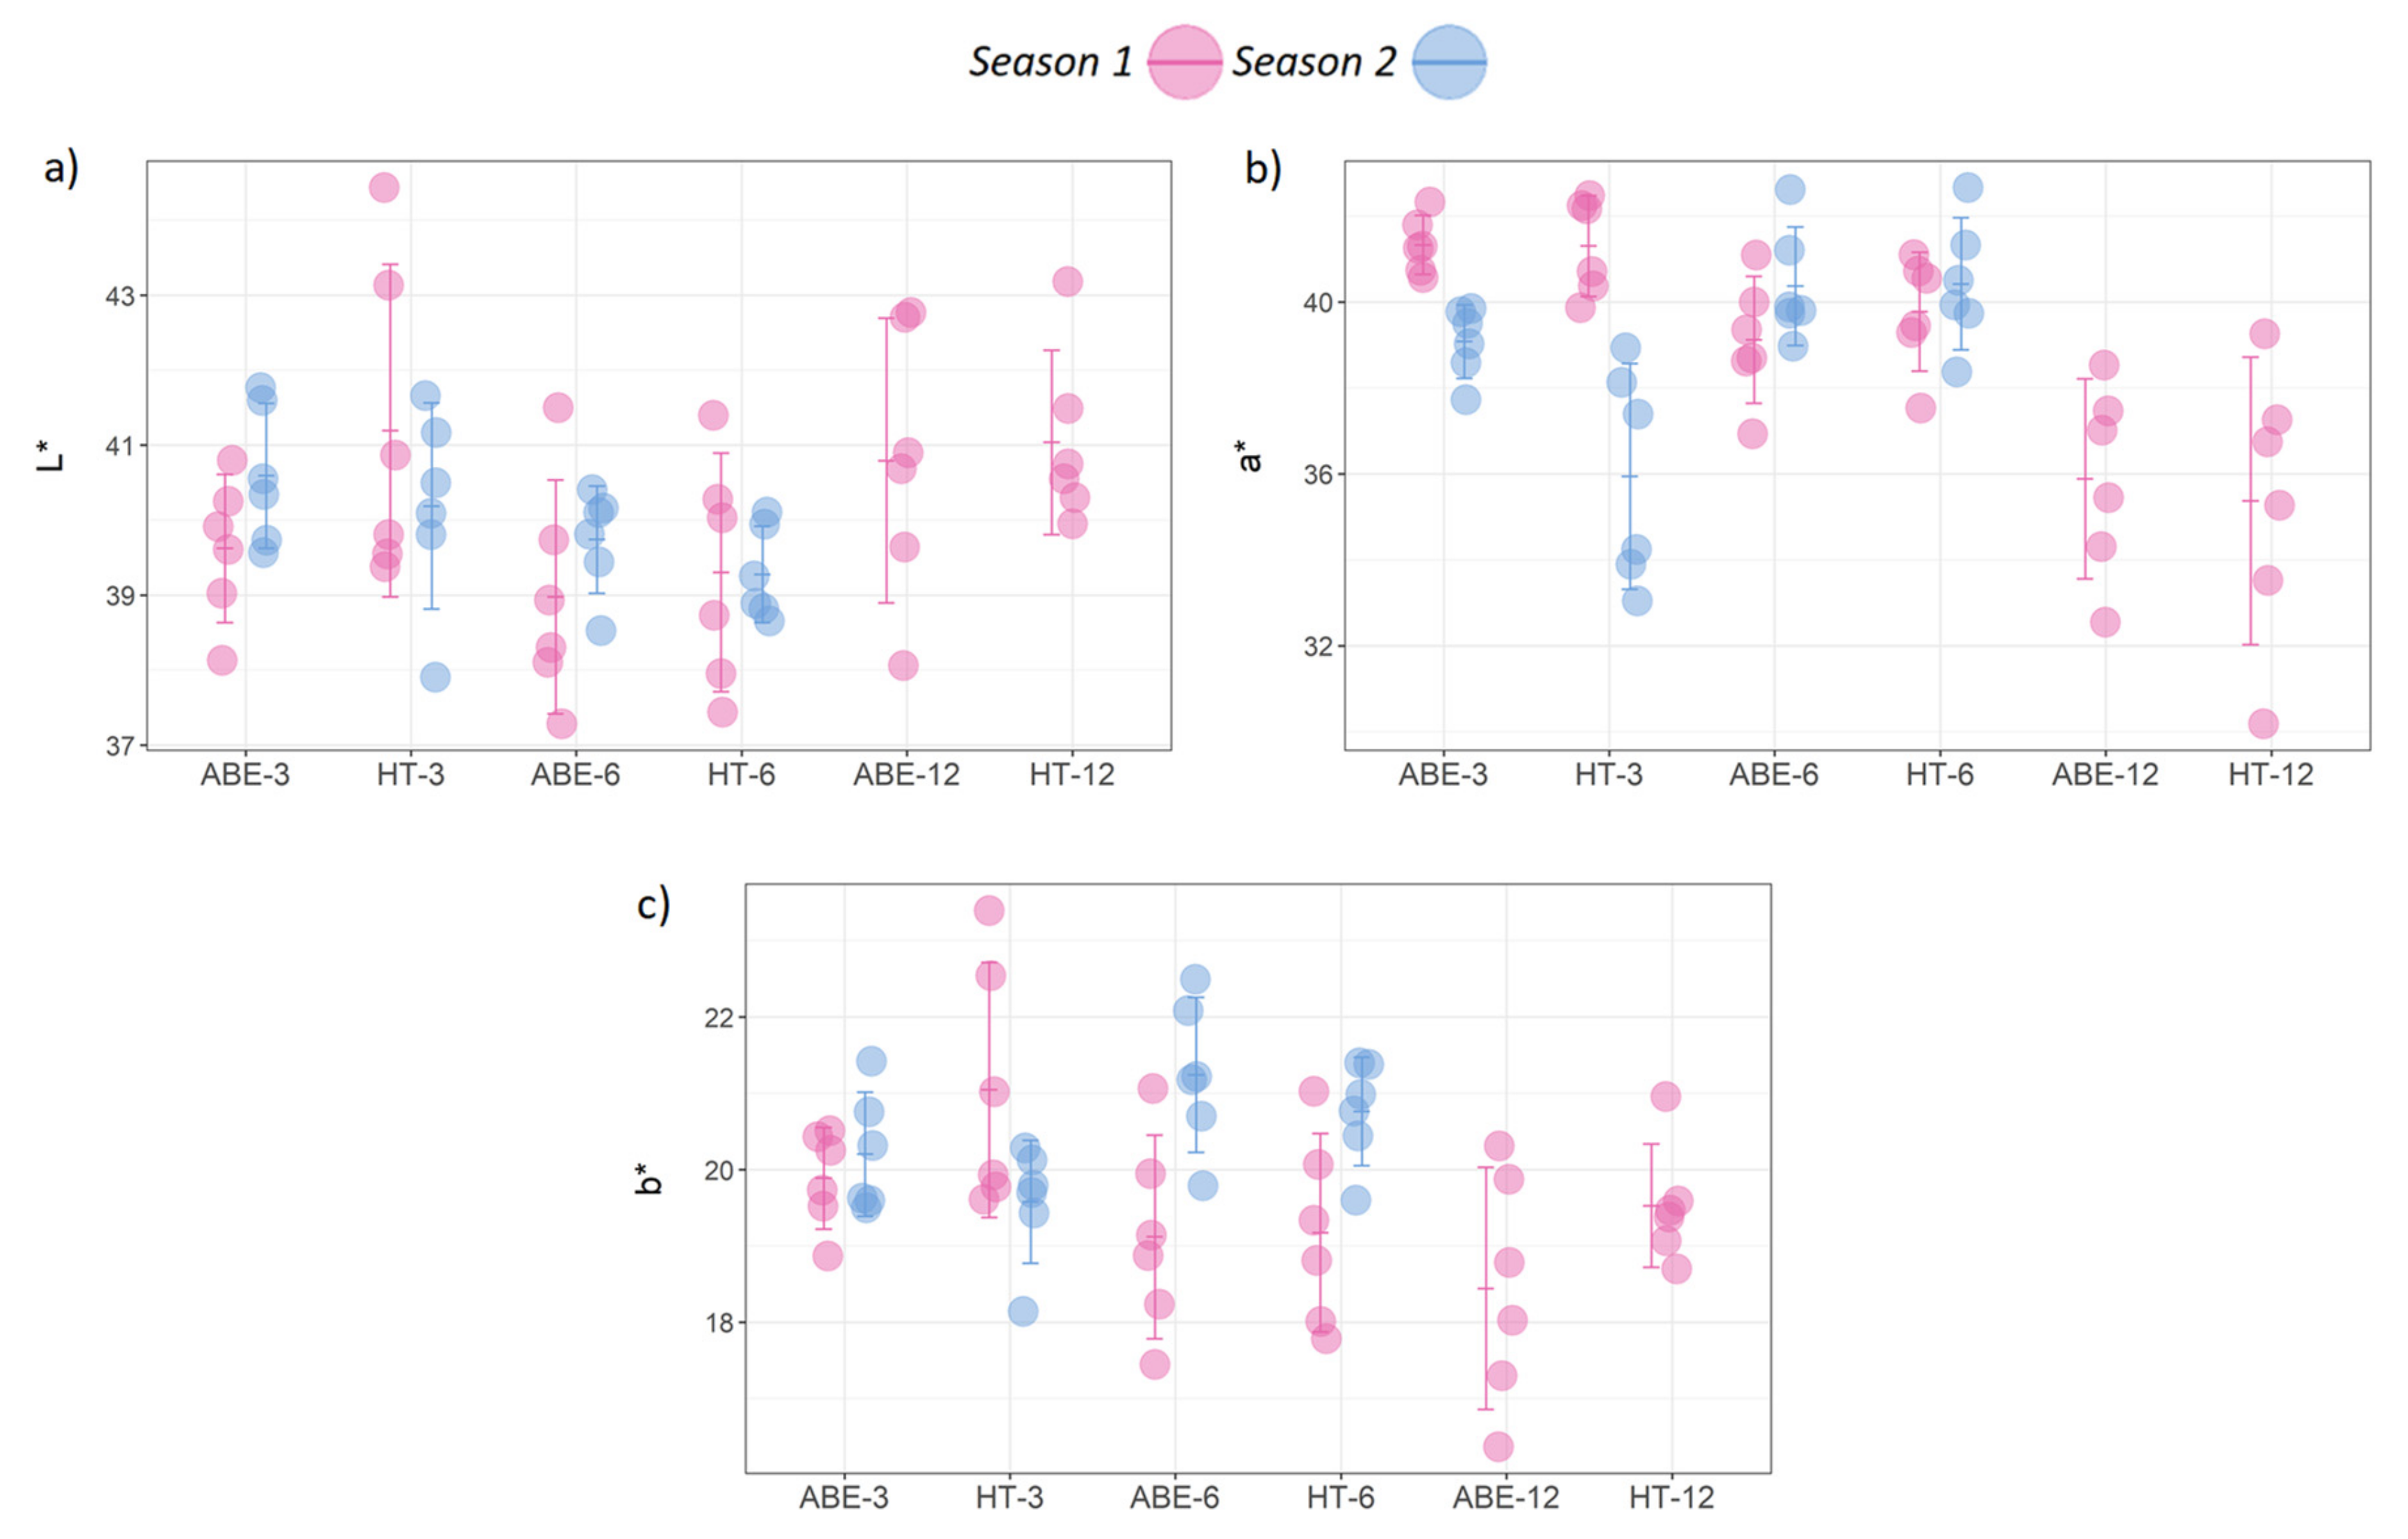
3.4. Fruit Quality at Harvest

Among the fruit quality parameters that were measured at harvest, the results were variable between the seasons. In season one, the thinning regime had no significant effect on the fruit flesh firmness, TSS, DMC, MA content, or L/D ratio (Figure 6); however in season two all of these parameters were significantly higher in the ABE-managed trees than in the HT trees (fruit flesh firmness: p = 0.02; TSS: p = < 0.001; DMC: p = 0.005; MA content: p = 0.002; L/D ratio: p = 0.002).
The crop load had a significant effect on the fruit flesh firmness (p < 0.001), TSS (p < 0.001), DMC (p < 0.001), MA content (p < 0.001), and L/D ratio (p < 0.001) in season one. The maximum values for these variables were recorded in the low crop load (3 fruit cm−2 LCSA) treatments followed by the medium (6 fruit cm−2 LCSA) and the lowest values in the high crop load (12 fruit cm−2 LCSA) treatments. In season two, the crop load had no effect on the fruit quality, with the exception of the fruit flesh firmness (p = 0.002). There were no significant interactions for any of these fruit quality parameters in either season.
The fruit color parameters were affected more by the crop load than the thinning regime (Figure 7). Overall, the fruit from the ABE treatments had slightly higher a* values (indicator of redness) during season one and significantly higher a* values during season two (p = 0.032). However, the thinning regime had no significant effect on L* or b* for either season. The crop load significantly affected L*, a*, and b* during both seasons. In general, better color development was observed under the low crop load in season one and under the medium crop load in season two, with poor color development under the high crop loads.

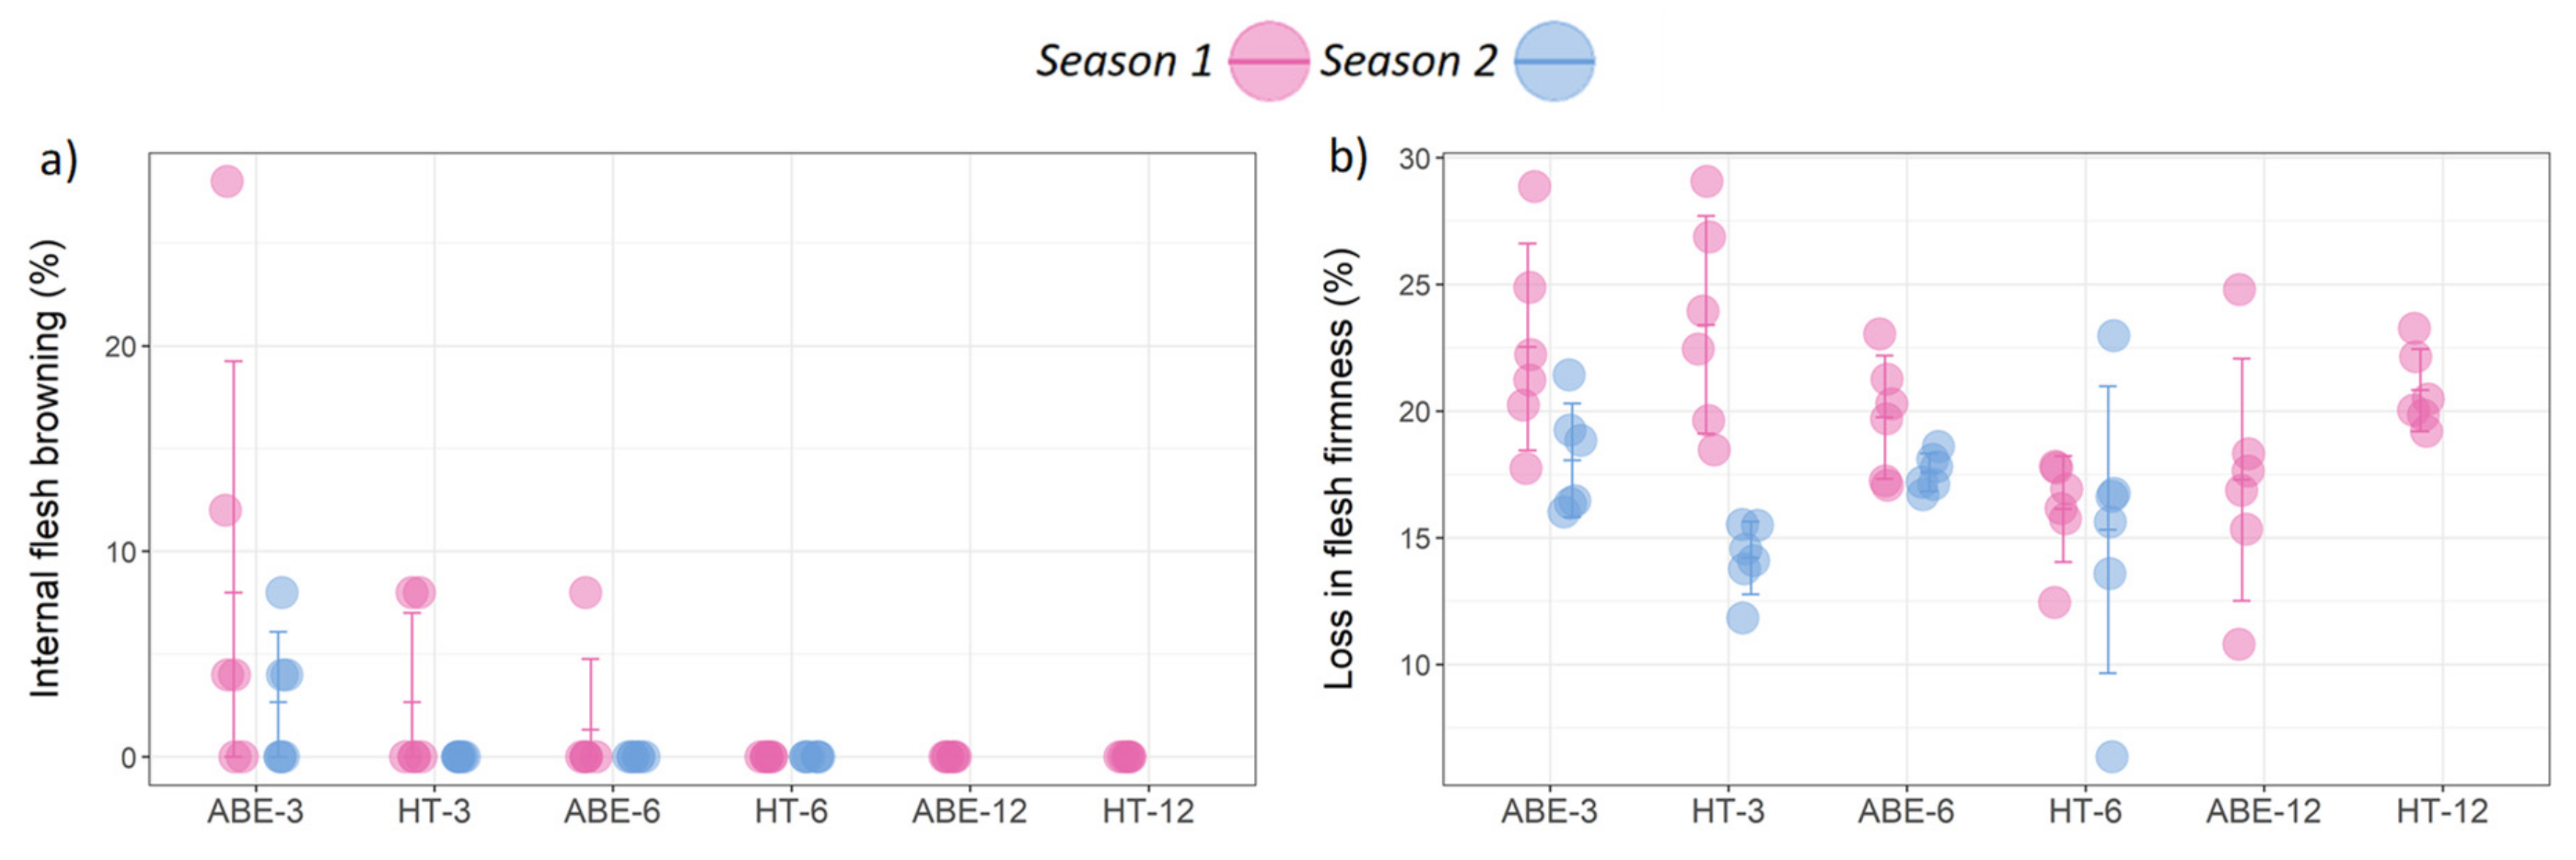
3.5. Internal Flesh Browning and Fruit Softening

For determining the relationship of IFB with thinning regime and crop load, contingency tables were developed based on these categories and whether or not a particular sampling unit (tree) had ‘any IFB’ (‘any IFB’ corresponds to a non-zero value for the IFB percentage, which is present in Figure 8a). Using a chi-squared analysis with Fisher’s exact p-values, it was observed that IFB was related to crop load (p = 0.003) but not to thinning regime (p = 0.08). The main type of IFB that was observed in this study was radial browning, a senescent-related browning disorder, with very few fruit showing CO2 injury-type browning.
In relation to FS, the effect of thinning regime and crop load level varied between the seasons (Figure 8b). The thinning regime significantly (p = 0.022) affected FS during season two, while the crop load effect was significant (p = 0.002) during season one only, where greater FS was observed in the low crop load treatments, irrespective of the thinning regime.

3.6. Fruit Nutrients

The thinning regime had no effect on the fruit N, P, K, Ca, or Mg content in either season. The crop load had no significant effect on P or Mg but did affect the fruit N content (p = 0.02), K (p = 0.001) and Ca content (p = 0.007) in season one (Table 3a). Both N and Ca increased with increasing crop load and K declined with increasing crop load. No significant interaction was found in relation to any of these nutrients in either season.
For the micronutrients, the thinning regime had no significant effect on levels of B, Fe, Mn, or Cu, but did affect Zn during both seasons (season one: p = 0.004; season two: p = 0.022) (Table 3b). A higher Zn content was found in the fruit from the ABE regime compared to the HT regime. The crop load had no effect on B, Fe, or Cu in either season (results are presented in the supplementary tables), but there was a significant effect in both seasons on fruit Mn as follows: season one (p = 0.04) and season two (p = 0.023) and Zn content as follows: season one (p = 0.006) and season two (p = 0.017), with an increasing trend with higher crop load in season one and a decreasing trend in season two. The interaction between thinning regime and crop load was significant for fruit Zn and Cu content only in season one.

3.7. Leaf Nutrients

The thinning regime had no effect on leaf macro or micronutrients, except for leaf Zn concentration during season two, with concentrations being significantly higher in the ABE-managed trees than in the HT trees (p = 0.001) (Table 4b). The crop load also had no significant effect on leaf P, Ca, Mg, B, or Mn (results are presented in the supplementary tables). Moreover, there was a significant crop load effect in both seasons on the concentration of leaf N (season one: p = 0.011; season two: p = 0.001), Fe (season one: p = 0.001; season two: p = 0.004), Zn (season one: p = 0.028; season two: p = 0.001), and Cu (season one: p = 0.038; season two: p = 0.011); K levels also exhibited a significant difference, only in season one (p = 0.001) (Table 4a,b). The leaf N, Fe, Zn, and Cu followed an increasing trend with an increase in the crop load during season one. However, an opposite trend was observed for N, Fe, and Zn, but not for Cu during the second season. The leaf K content declined with increasing levels of crop load during season one. The interaction between thinning regime and crop load level was significant for leaf Zn content in both seasons and for Fe and Cu in season two.

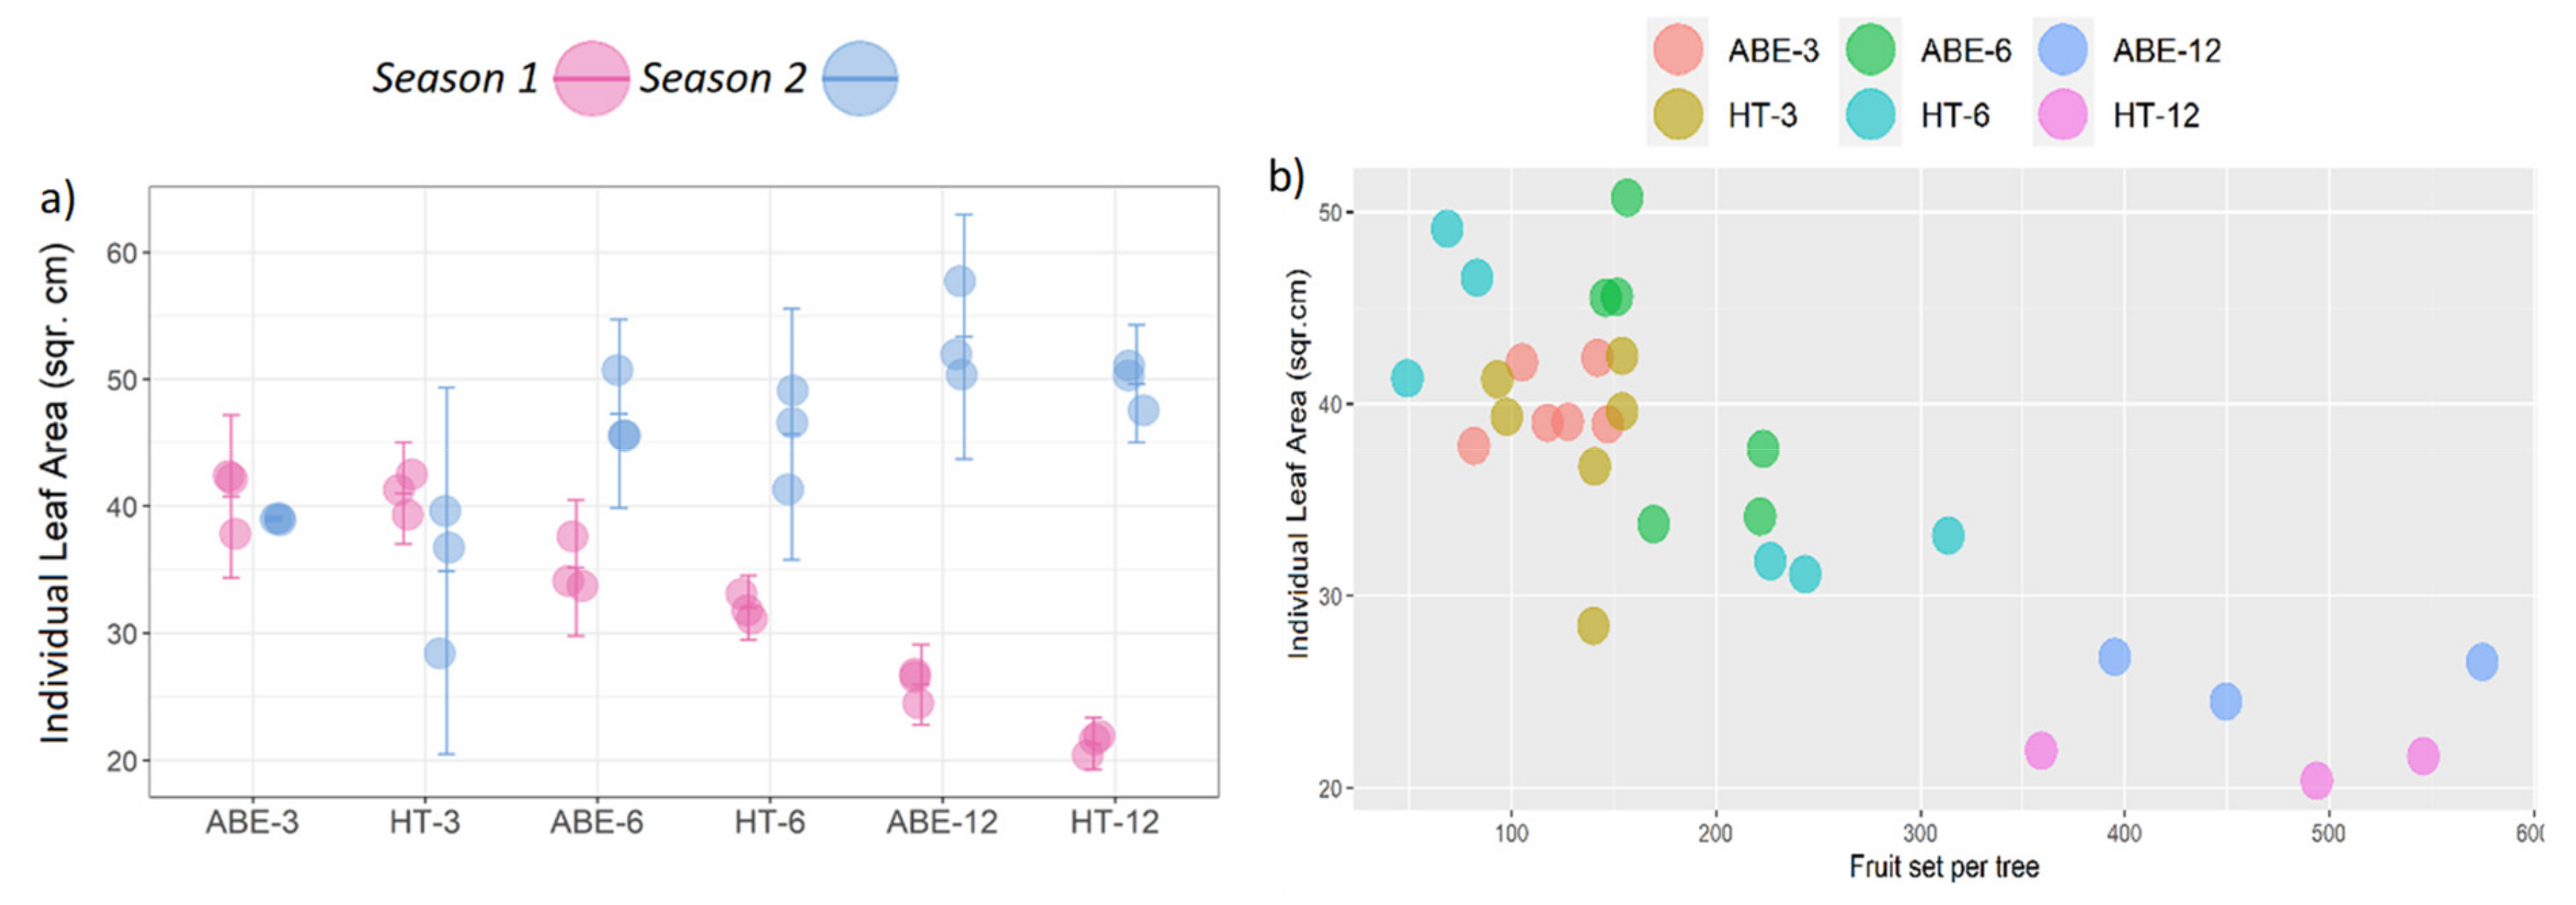
3.8. Individual Leaf Area and Plant Health

In relation to ILA, the thinning regime had a significant effect in season one (p = 0.009), while the crop load showed a significant effect in both seasons (season one: p = 0.001; season two: p = 0.001). In the medium and high crop load treatments, the trees in the ABE regime attained larger sized leaves than those in the HT regime in both seasons (Figure 9a). In season one, maximum ILA was recorded in the low crop loads followed by the medium crop loads, with minimum ILA observed in the high crop load trees, however this trend was opposite during the second season, where the actual crop load was very low in the high crop load treatments; compilation of data across the two seasons showed a negative correlation (r = −0.821) between fruit set/tree and ILA (Figure 9b). No interaction between the thinning regime and the crop load was observed during either season. The tree health was severely compromised under high crop load, irrespective of the thinning regime. During season one, limbs were broken due to excessive fruit load, causing permanent and irreparable damage to the tree structure (Figure 10a,b).

4. Discussion

4.1. Fruit Set and Return Bloom

This study has demonstrated that, in spite of reduced bud numbers on the trees, the fruit set in the ABE-managed trees was at least as high or higher than in the HT trees. This indicates that, when there is less competition between flowers, a higher percentage are able to set fruit. These results are consistent with the findings of Tustin et al. [30], Van Hooijdonk et al. [32], Tabing et al. [29], Bound [17], and Breen et al. [33,34].
As expected, there was a significant effect of crop load on return bloom, however, at equivalent crop loads, return bloom was considerably higher in the ABE-managed trees than in the HT trees. The severe reduction in return bloom in the second season in both the ABE and HT high crop load treatments and the medium HT treatment indicates that these trees were pushed into biennial bearing as the result of carrying a heavy crop load during the flower initiation period. As noted by Reddy et al. [39], in addition to carbohydrates and the stimulation or inhibition of flower initiation genes, the crop load levels also contribute to marked variations in metabolites, such as hydroxycinnamates, salicylates, salicylic acid biosynthetic pathway intermediates and flavanols, and phytohormones such as cytokinin. Thus, if trees are carrying high crop loads, this is a major contributor to the inhibition of flower initiation, resulting in biennial bearing the following year. The improved return bloom in the medium crop load ABE-managed trees could be attributed to the early removal of the excessive floral buds in the first season, promoting bud organogenesis, and thus improving the return bloom and preventing alternate bearing [17].

4.2. Fruit Weight and Yield

The improvement in the average fruit weight that was observed in ABE-managed trees during both seasons of our study is in line with the improvement in fruit weight with the application of ABE over conventional methods that have been reported by Van Hooijdonk et al. [32] in ‘Scilate’, Tabing et al. [29] in ‘Kalei’, Breen et al. [35] in ‘Royal Gala’, and Bound [17] in ‘Alvina Gala’, ‘Buckeye Gala’, and ‘Fiero Fuji’ apples. This increase in fruit weight can be explained by the early removal of excess floral buds, which prevents wastage of resources, in combination with higher light interception through better fruit positioning contributing to increased carbohydrate production and improved partitioning to targeted fruits [17,30,34]. The reduction in fruit weight with increasing crop load was in line with the previously reported inverse relationship between the fruit number/tree and the final fruit weight [3,4,40,41].
The previous studies that have been undertaken in different apple cultivars have shown inconsistent effects of ABE on fruit yield. Bound [17] reported increased yields in ‘Fiero Fuji’ apples with ABE management, while Tustin et al. [31] observed a decline in yield of ‘Scifresh’ apples. Several studies have found no effect of ABE on fruit yield of ‘Scilate’ [32], ‘Royal Gala’ [35], ‘Kalei’ [29], and several ‘Gala’ strains [17]. In this study, ABE resulted in higher yields than in the HT treatments, particularly in the second season, however yield was affected more by crop load than by the thinning regime, with higher crop loads resulting in increased yields in spite of a reduction in fruit weight. However, no measure was made of the fruit size categories or the marketable yield, so it is difficult to know the true impact of the variations in the yield between the treatments.
In season two, the ABE-managed trees recorded a 22% higher yield in the low crop load treatment and a 279% higher yield in the medium crop load treatments over the hand-thinned trees. This large yield difference between the thinning regimes at the medium crop load was the result of severe alternate bearing in the HT regime, leading to a marked reduction in both return bloom and fruit set along with a smaller fruit size. The increased fruit yield in the ABE-managed trees can be explained by improved fruit weight with improved or consistent fruit set/tree.

4.3. Fruit Maturity and Quality

The slower conversion of starch to sugar, as shown by the lower SPI values, combined with a greener skin color, measured as a higher DA Index, with the increasing crop load observed in this study demonstrate that higher crop loads retard fruit maturity. A similar effect of crop load on maturity has been reported by Palmer et al. [42]. The fruit in the second season were picked at an earlier stage of maturity, and differences were more marked between the different treatments, with a lower SPI in the fruit from the ABE-managed trees. This is consistent with the findings of Van Hooijdonk et al. [32] in ‘Scilate’ apples; however, Breen et al. [35] and Bound [17] reported no effect of ABE on the SPI in other cultivars. The higher DA index under the high crop load during the first season can be explained by the increased fruit and leaf nitrogen content under the high crop load, which delayed the maturity, as suggested by Daugaard and Grauslund [43], and a later maturity under the heavy crop load than the light crop load [42].
While the thinning regime had little effect on most of the fruit quality parameters in season one, there were differences in the second season, with ABE management showing increased fruit flesh firmness, TSS, DMC, and MA content. This is consistent with the results that were reported by Bound [17], who observed that ABE had either a positive or no effect on these fruit quality parameters. However, this conflicts with the findings of Tabing et al. [29] who reported no effect of ABE on fruit flesh firmness, TSS, or DMC. The observed improvement in fruit flesh firmness, TSS, and DMC in our study can be explained by the better availability of carbohydrate resources due to the early removal of competing sinks, improved fruit positioning, and increased light interception and resource partitioning [17,30]. In relation to fruit color, the high a* value (representing a greater red blush intensity) in the ABE-managed trees is consistent with the findings of Lauri et al. [28], Van Hooijdonk et al. [32], and Tabing et al. [29]. This improvement in fruit coloration is most likely associated with the removal of the shaded buds, the good positioning of the buds within the canopy, and the early reduction in floral bud density, resulting in increased light interception contributing to fruit color improvement [44].
The loss of quality (flesh firmness, TSS, DMC, MA content, L/D ratio, and fruit color) with increasing crop load is in line with the findings of Bound [17] and Atay [41] and can be attributed to increased competition for resources with increasing crop load, while the low crop load trees had adequate availability of carbohydrate resources.

4.4. Internal Flesh Browning and Fruit Softening

The higher incidence of radial IFB with low crop load and greater FS in the fruit from the ABE-managed trees with a low crop load can be attributed to greater fruit size. The low crop load trees, regardless of the thinning method, produced large fruit, and the fruit size was further increased by the implementation of ABE. According to Ferguson and Watkins [45], larger fruit are more susceptible to physiological disorders compared to small fruit. Similarly, Lidster et al. [46] reported senescent breakdown of cold-stored ‘Spartan’ apples, Johnston et al. [47] reported faster fruit softening of ‘Royal Gala’ apples, and Lee et al. [48] reported flesh breakdown and cracking of ‘Royal Gala’ apples associated with fruit size, with the susceptibility increasing with larger fruit. This increased susceptibility may be due to the earlier onset of maturation and ripening in large-sized fruit [49], which in turn leads to accelerated softening and ripening or senescence. Furthermore, as large fruit can have a bigger cell size [50], reducing the cell number per unit of flesh volume [51], this can lead to a reduction in the total amount of cell-wall matrix components along with a reduced total surface area for intercellular attachments and consequent poor tissue strength [49]. Lee et al. [48] noted that this accelerated ripening and large cell size can make the larger fruit more prone to senescent-related disorders, such as IFB, flesh breakdown, and fruit softening.

4.5. Fruit and Leaf Nutrients

For all of the 10 fruit and leaf nutrients that were examined in this study, the lack of effect of the thinning regime on the nutrient content (with the exception of Zn) was unexpected, as it was anticipated that there would be an improvement in the fruit nutrient status under ABE management, based on the fact that ABE management removes the competing sinks very early on in the season, before cell division, when there is a high demand for mineral nutrients in the fruit [10]. However, despite the absence of statistically significant differences, a trend was still observed with the level of some nutrients (fruit Fe, Mn, Zn; leaf, Ca, Mg, Fe, Mn, Zn) being slightly higher in the ABE-managed trees (the results are presented in the Supplementary Tables). Further investigation is required in order to determine the validity of this trend.
The trends for several of the nutrients varied in regard to the change in the crop load levels between the seasons. In general, the fruit N, Ca, Mn, and Zn and the leaf N, Fe, Zn, and Cu content increased with higher crop load, while the fruit and leaf K declined with an increase in crop load. These trends are somewhat consistent with the findings of Mészáros et al. [10], who reported higher fruit N, P, and Mn and leaf N, Mg, Ca, Fe, and Mn, as well as lower fruit and leaf K content, at high crop load and vice versa. According to Mészáros et al. [10], increased concentrations of N and Mn in the leaves and fruits with higher crop loads can be likely attributed to their rise in uptake, while the increase in the Fe and Mn content with an increase in the crop load can be associated with a response to avoidance of deficit, which in turn led to an increased uptake by up to 20–30%.

4.6. Leaf Area and Tree Health

Our study found that the leaf area was greater in the ABE-managed trees than in the HT trees. These results are consistent with the findings of McArtney et al. [52] who reported that delaying thinning by four weeks reduced the tree leaf area by 17% in ‘Royal Gala’ apples and by 6% in ‘Braeburn’ apples. Leaf area is a critical factor in fruit growth, dry matter accumulation, and quality as there is a linear relationship between light interception and leaf area [42].
Our finding that leaf area declined with increasing crop load is in line with the studies that were reported by Wünsche and Ferguson [53]. In general, only the trees with crop loads of less than 250 fruit per tree produced a leaf size of 30 cm−2 and above. We also observed that the leaves from trees with heavy crop loads were thinner than those with a light crop load. A higher crop load can result in fewer and/or smaller-sized leaves that are available per fruit; this reduction in leaf:fruit or leaf-area:fruit ratio means less availability of photosynthates per fruit, leading to increased inter-fruit competition for carbohydrate resources, which consequently reduces the fruit quality [54,55]. Hence, the increase in the leaf area at lower crop loads would be a major contributor to the improvement in the fruit weight, firmness, TSS, and DMC that has been observed under ABE management and lower crop loads, and concurs with the findings of Hudina and Stampar [56] who reported a reduction in sugars, soluble solids, and organic acids with a decline in the leaf area in ‘Williams’ pears. A higher leaf:fruit or leaf-area:fruit ratio has also been reported to improve the fruit size, weight, color, sugar content, fruit maturity, and ripeness of cherries [57,58] and the fruit quality of peaches [59]. The heavy crop loads in our study, irrespective of the thinning regime, resulted in considerable damage to the trees, due to limb breakage as a result of the excessive fruit.

5. Conclusions

This two-year study has demonstrated the viability of ABE management as a thinning method for ‘Scilate’ apples and has also shown that this cultivar is able to carry a crop load of around six fruit cm−2 LCSA when the crop load is reduced early, as it is in ABE management, without compromising fruit quality or return bloom. The early removal of un-desired sinks under ABE management, with low and medium crop loads, improved the fruit set and the return bloom with consistently higher fruit weight and overall yield compared to HT management with the same crop loads. The fruit quality parameters, such as the flesh firmness, TSS, DMC, MA content, fruit shape, and to some extent fruit color, were also improved in the ABE-managed trees. Even at medium crop loads, the later removal of the excess fruit through hand thinning is not ideal for production sustainability or profitability as it can result in biennial bearing and a reduction in fruit quality. However, low crop loads, irrespective of the thinning regime, can increase the risk of IFB development and FS during storage. High crop loads are detrimental as, in addition to the impact on the fruit quality and the induction of severe biennial bearing patterns, they can cause permanent irreparable damage to tree health and structure. The results in relation to the fruit and leaf nutrients were more dependent upon the crop load than on the thinning regime. Further research is required in order to study and highlight the positive effects of ABE under commercial high-density ‘Scilate’ apple planting systems. While it appears that a crop load of six fruit cm−2 LCSA is sustainable, further work is needed in order to confirm the ideal crop load for which the maximum benefits of ABE can be obtained for this cultivar.

Supplementary Materials

The following supporting information can be downloaded at: https://www.mdpi.com/article/10.3390/agronomy12091989/s1. The following supplementary material is provided with this article: Table S1: Additional data relating to Table 3. The effect of the thinning regime (artificial bud extinction (ABE) or hand thinned (HT)) and crop load (3, 6, or 12 fruit cm−2 limb cross-sectional area) on fruit macronutrient and micronutrient concentrations in seasons one and two; Table S2: Additional data relating to Table 4. The effect of the thinning regime (artificial bud extinction (ABE) or hand thinned (HT)) and crop load (3, 6, or 12 fruit cm−2 limb cross-sectional area) on leaf macronutrient and micronutrient concentrations in seasons one and two. The MS Excel file containing all the data analysis outputs of ANOVA summaries and results.

Author Contributions

Conceptualization, S.A.B. and R.S.S.; Investigation, R.S.S.; Data Curation and interpretation, R.S.S.; Visualization, R.S.S.; Methodology, S.A.B. and R.S.S.; Writing—Original draft preparation, R.S.S.; Supervision, S.A.B.; Project Administration, S.A.B.; Formal Analysis, I.H.; Software, I.H.; Validation, S.A.B. and I.H.; Writing—review and editing, S.A.B. and I.H. All authors have read and agreed to the published version of the manuscript.

Funding

This research was conducted as a part of a PhD project, with partial funding provided by Montague Fresh (Aust)Pty. Ltd.

Data Availability Statement

Data are contained within the article or Supplementary Material.

Acknowledgments

We would like to thank Scott Price and Andrew Smith from R&R Smith for providing trees to carry out the experiment and donating fruit samples. We would also like to acknowledge Montague Pty. Ltd. for their financial support towards our project. Thanks are also due to Nigel Swarts for assistance with the acquisition of funds and Gurjeet Singh Brar for his valuable assistance with field and laboratory work.

Conflicts of Interest

The authors declare no conflict of interest.

References

  1. Schmidt, T.R.; Auvil, T.D.; Hanrahan, I.; Castillo, F.; McFerson, J.R. Crop load management of tree fruits in the Pacific Northwest of USA. Acta Hortic. 2011, 903, 759–766. [Google Scholar] [CrossRef]
  2. Breen, K.; van Hooijdonk, B.; Tustin, D.; Wilkie, J.; Bound, S.; Middleton, S.; Close, D. Changes in fruit set of ‘Gala’ apple in response to environment and artificial spur extinction. Acta Hortic. 2014, 1058, 77–83. [Google Scholar] [CrossRef]
  3. Costa, G.; Blanke, M.; Widmer, A. Principles of thinning in fruit tree crops-needs and novelties. Acta Hortic. 2013, 998, 17–26. [Google Scholar] [CrossRef]
  4. Jones, K.M.; Bound, S.; Miller, P. Crop Regulation of Pome Fruit in Australia; Tasmanian Institute of Research: Hobart, Australia, 1998. [Google Scholar]
  5. Untiedt, R.; Blanke, M. Effects of fruit thinning agents on apple tree canopy photosynthesis and dark respiration. Plant Growth Regul. 2001, 35, 1–9. [Google Scholar] [CrossRef]
  6. Webster, T. Current approved thinning strategies for apples and pears and recent thinning research trials in Europe. Compact. Fruit Tree 2002, 35, 73–76. [Google Scholar]
  7. Williams, M.W.; Edgerton, L.J. Fruit thinning of apples and pears with chemicals. Agric. Inf. Bull. 1981, 289. [Google Scholar] [CrossRef]
  8. Lakso, A.N. Early fruit growth and drop-the role of carbon balance in the apple tree. Acta Hortic. 2011, 903, 733–742. [Google Scholar] [CrossRef]
  9. Lakso, A.N.; Goffinet, M.C. Apple fruit growth. N. Y. Fruit Q. 2013, 21, 11–14. [Google Scholar]
  10. Mészáros, M.; Hnátková, H.; Čonka, P.; Náměstek, J. Linking mineral nutrition and fruit quality to growth intensity and crop load in apple. Agronomy 2021, 11, 506. [Google Scholar] [CrossRef]
  11. Davis, K.; Stover, E.; Wirth, F. Economics of fruit thinning: A review focusing on apple and citrus. HortTechnology 2004, 14, 282–289. [Google Scholar] [CrossRef]
  12. Bound, S.A. Managing crop load in european pear (Pyrus communis L.)—A review. Agriculture 2021, 11, 637. [Google Scholar] [CrossRef]
  13. Meland, M. The effect of hand thinning on yield and return bloom of five pear cultivars in a Northern climate. Acta Hortic. 1998, 475, 275–282. [Google Scholar] [CrossRef]
  14. Bound, S. Managing Crop Load in Deciduous Tree Crops; NSW Government Department of Primary Industries: Orange, NSW, Australia, 2021; pp. 126–131. [Google Scholar]
  15. Tromp, J. Flower-bud formation in pome fruits as affected by fruit thinning. Plant Growth Regul. 2000, 31, 27–34. [Google Scholar] [CrossRef]
  16. Greene, D.; Costa, G. Fruit thinning in pome- and stone-fruit: State of the art. Acta Hortic. 2013, 998, 93–102. [Google Scholar] [CrossRef]
  17. Bound, S. Precision crop load management of apple (Malus x domestica Borkh.) without chemicals. Horticulturae 2019, 5, 3. [Google Scholar] [CrossRef]
  18. Bound, S.A. Alternate thinning chemicals for apples. Acta Hortic. 2010, 884, 229–236. [Google Scholar] [CrossRef]
  19. Wertheim, S.J.; Webster, A.D. Manipulation of growth and development by plant bioregulators. In Fundamentals of Temperate Zone Tree Fruit Production; Tromp, J., Webster, A.D., Wertheim, S.J., Eds.; Backhuys Publishers: Leiden, The Netherlands, 2005; pp. 267–294. [Google Scholar]
  20. Looney, N.E. Chemical thinning of apple: Some new strategies and important refinements to old procedures. Acta Hortic. 1986, 179, 597–604. [Google Scholar] [CrossRef]
  21. Bound, S.; Jones, K. Ammonium thiosulphate as a blossom thinner of ‘Delicious’ apple, ‘Winter Cole’ pear and ‘Hunter’ apricot. Aust. J. Exp. Agric. 2004, 44, 931–937. [Google Scholar] [CrossRef]
  22. Robinson, T.L.; Lakso, A.N. Predicting chemical thinner response with a carbohydrate model. Acta Hortic. 2008, 903, 743–750. [Google Scholar] [CrossRef]
  23. Lauri, P.É.; Térouanne, E.; Lespinasse, J.M. Relationship between the early development of apple fruiting branches and the regularity of bearing—An approach to the strategies of various cultivars. J. Hortic. Sci. 1997, 72, 519–530. [Google Scholar] [CrossRef]
  24. Lauri, P.É.; Térouanne, E.; Lespinasse, J.M.; Regnard, J.L.; Kelner, J.J. Genotypic differences in the axillary bud growth and fruiting pattern of apple fruiting branches over several years—An approach to regulation of fruit bearing. Sci. Hortic. 1995, 64, 265–281. [Google Scholar] [CrossRef]
  25. Lauri, P.É.; Lespinasse, J.M. Apple tree training in France: Current concepts and practical implications. Fruits 1999, 54, 441–454. [Google Scholar]
  26. Lauri, P.É.; Lespinasse, J.M. The vertical axis and solaxe systems in France. Acta Hortic. 1998, 513, 287–296. [Google Scholar] [CrossRef]
  27. Lauri, P.E.; Crété, X.; Ferre, G. Centrifugal training in apple-appraisal of a two-year experiment on ‘Galaxy’ in Southeast France. Acta Hortic. 2007, 732, 391–396. [Google Scholar] [CrossRef]
  28. Lauri, P.É.; Willaume, M.; Larrive, G.; Lespinasse, J.M. The concept of centrifugal training in apple aimed at optimizing the relationship between growth and fruiting. Acta Hortic. 2004, 636, 35–42. [Google Scholar] [CrossRef]
  29. Tabing, O.; Parkes, H.; Middleton, S.; Tustin, D.; Breen, K.; Van Hooijdonk, B. Artificial spur extinction to regulate crop load and fruit quality of ‘Kalei’ apple. Acta Hortic. 2016, 1130, 273–278. [Google Scholar] [CrossRef]
  30. Tustin, D.S.; Dayatilake, G.A.; Breen, K.C.; Oliver, M.J. Fruit set responses to changes in floral bud load—A new concept for crop load regulation. Acta Hortic. 2012, 932, 195–202. [Google Scholar] [CrossRef]
  31. Tustin, D.S.; Dayatilake, G.A.; Henriod, R.E.; Breen, K.C.; Oliver, M. Changes in fruiting behaviour and vegetative development of ‘Scifresh’ apple in response to artificial spur extinction using centrifugal training. Acta Hortic. 2011, 903, 603–610. [Google Scholar] [CrossRef]
  32. Van Hooijdonk, B.; Tustin, D.; Oliver, M.; Breen, K.; Dayatilake, G. Modification of canopy architecture imposed by artificial spur extinction promotes reliable cropping behaviour and enhances fruit quality of ‘Scilate’ apple trees. Acta Hortic. 2014, 1058, 63–70. [Google Scholar] [CrossRef]
  33. Breen, K.C.; Tustin, D.S.; Palmer, J.W.; Boldingh, H.L.; Close, D.C. Apple fruit set is influenced by altered floral bud density but not by reduced carbohydrate reserves. Acta Hortic. 2018, 1228, 315–322. [Google Scholar] [CrossRef]
  34. Breen, K.; Tustin, S.; Palmer, J.; Boldingh, H.; Close, D. Revisiting the role of carbohydrate reserves in fruit set and early-season growth of apple. Sci. Hortic. 2020, 261, 109034. [Google Scholar] [CrossRef]
  35. Breen, K.C.; Tustin, D.S.; Palmer, J.W.; Close, D.C. Method of manipulating floral bud density affects fruit set responses in apple. Sci. Hortic. 2015, 197, 244–253. [Google Scholar] [CrossRef]
  36. Breen, K.; Palmer, J.; Birken, E.; Tustin, D.; Henriod, R.; Seymour, S.; Diack, R.; Dayatilake, G.; Oliver, M. The influence of fruiting bud structure on fruit size and quality of ‘Scifresh’ apple. In Proceedings of the Growing Smarter with Less Water—The Annual New Zealand Agricultural and Horticultural Science Convention, Lincoln University, Canterbury, New Zealand, 13–15 August 2007; pp. 13–15. [Google Scholar]
  37. Rayment, G.E.; Lyons, D.J. Soil Chemical Methods—Australasia; CSIRO Publishing: Collingwood, Australia, 2010; p. 516. [Google Scholar]
  38. McQuaker, N.R.; Brown, D.F.; Kluckner, P.D. Digestion of environmental materials for analysis by inductively coupled plasma-atomic emission spectrometry. Anal. Chem. 1979, 51, 1082–1084. [Google Scholar] [CrossRef]
  39. Reddy, P.; Plozza, T.; Ezernieks, V.; Stefanelli, D.; Scalisi, A.; Goodwin, I.; Rochfort, S. Metabolic pathways for observed impacts of crop load on floral induction in apple. Int. J. Mol. Sci. 2022, 23, 6019. [Google Scholar] [CrossRef]
  40. Jones, K.; Bound, S.; Koen, T.; Oakford, M. Effect of timing of hand thinning on the cropping potential of ‘Red Fuji’ apple trees. Aust. J. Exp. Agric. 1992, 32, 417–420. [Google Scholar] [CrossRef]
  41. Atay, E.; Crété, X.; Loubet, D.; Lauri, P.E. Effects of different crop loads on physiological, yield and fruit quality of ‘JoyaTM’ apple trees: High crop load decreases maximum daily trunk diameter and does not affect stem water potential. Int. J. Fruit Sci. 2021, 21, 955–969. [Google Scholar] [CrossRef]
  42. Palmer, J.W.; Giuliani, R.; Adams, H.M. Effect of crop load on fruiting and leaf photosynthesis of ‘Braeburn’/M.26 apple trees. Tree Physiol. 1997, 17, 741–746. [Google Scholar] [CrossRef]
  43. Daugaard, H.; Grauslund, J. Fruit colour and correlations with orchard factors and post-harvest characteristics in apple cv. Mutsu. J. Hortic. Sci. Biotechnol. 1999, 74, 283–287. [Google Scholar] [CrossRef]
  44. Willaume, M.; Lauri, P.-É.; Sinoquet, H. Light interception in apple trees influenced by canopy architecture manipulation. Trees 2004, 18, 705–713. [Google Scholar] [CrossRef]
  45. Ferguson, I.B.; Watkins, C.B. Crop load affects mineral concentrations and incidence of bitter pit in ‘Cox’s Orange Pippin’ apple fruit. J. Am. Soc. Hortic. Sci. 1992, 117, 373–376. [Google Scholar] [CrossRef]
  46. Lidster, P.D.; Porritt, S.W.; Mason, J.; Eaton, G.W. Spartan apple breakdown as affected by orchard factors, nutrient content and fruit quality. Can. J. Plant Sci. 1975, 55, 443–446. [Google Scholar] [CrossRef]
  47. Johnston, J.W.; Hewett, E.W.; Hertog, M.L.A.T.M.; Harker, R. Harvest date and fruit size affect postharvest softening of apple fruit. J. Hortic. Sci. Biotechnol. 2002, 77, 355–360. [Google Scholar] [CrossRef]
  48. Lee, J.; Mattheis, J.P.; Rudell, D.R. Fruit size affects physiological attributes and storage disorders in cold-stored ‘Royal Gala’ apples. HortScience 2013, 48, 1518–1524. [Google Scholar] [CrossRef]
  49. Harker, F.R.; Redgwell, R.J.; Hallett, I.C. Texture of fresh fruit. Hortic. Rev. 1997, 20, 121–224. [Google Scholar]
  50. Malladi, A.; Hirst, P.M. Increase in fruit size of a spontaneous mutant of ‘Gala’ apple (Malus × domestica Borkh.) is facilitated by altered cell production and enhanced cell size. J. Exp. Bot. 2010, 61, 3003–3013. [Google Scholar] [CrossRef]
  51. Mann, H.; Bedford, D.; Luby, J.; Vickers, Z.; Tong, C. Relationship of instrumental and sensory texture measurements of fresh and stored apples to cell number and size. HortScience 2005, 40, 1815–1820. [Google Scholar] [CrossRef]
  52. McArtney, S.; Palmer, J.W.; Adams, H.M. Crop loading studies with ‘Royal Gala’ and ‘Braeburn’ apples: Effect of time and level of hand thinning. N. Z. J. Crop Hortic. Sci. 1996, 24, 401–407. [Google Scholar] [CrossRef]
  53. Wünsche, J.N.; Ferguson, I.B. Crop load interactions in apple. Hortic. Rev. 2005, 31, 231–290. [Google Scholar]
  54. Anthony, B.; Serra, S.; Musacchi, S. Optimizing crop load for new apple cultivar: “WA38”. Agronomy 2019, 9, 107. [Google Scholar] [CrossRef]
  55. Parker, A.K.; Hofmann, R.W.; van Leeuwen, C.; McLachlan, A.R.; Trought, M.C. Leaf area to fruit mass ratio determines the time of veraison in Sauvignon Blanc and Pinot Noir grapevines. Aust. J. Grape Wine Res. 2014, 20, 422–431. [Google Scholar] [CrossRef]
  56. Hudina, M.; Stampar, F. Influence of leaf area on the sugar and organic acids content in pear (Pyrus communis) fruits cultivar ‘Williams’. Acta Hortic. 2002, 596, 749–752. [Google Scholar] [CrossRef]
  57. Cittadini, E.D.; Peri, P.; Ridder, N.d.; Keulen, H.v. Relationship between fruit weight and the fruit-to-leaf area ratio, at the spur and whole-tree level, for three sweet cherry varieties. Acta Hortic. 2008, 795, 669–672. [Google Scholar] [CrossRef]
  58. Usenik, V.; Orazem, P.; Stampar, F. Low leaf to fruit ratio delays fruit maturity of ‘Lapins’ sweet cherry on Gisela 5. Sci. Hortic. 2010, 126, 33–36. [Google Scholar] [CrossRef]
  59. Samira, M.M.; Fayed, T.; Hussein, A.; Maged, S.M. Effect of some pruning applications on leaf to fruit ratio, yield and fruit quality of ‘Florda Prince’peach trees. J. Hortic. Sci. Ornam. Plants 2014, 6, 18–26. [Google Scholar]
Figure 1. Effect of thinning regime and crop load on (a) fruit set across two seasons, and (b) return bloom during the second season (error bars represent 95% confidence interval). ABE = artificial bud extinction; HT = hand thinned.
Agronomy 12 01989 g001
Figure 2. Photos illustrating the effect of thinning method and crop load on return bloom in season two.
Agronomy 12 01989 g002
Figure 3. Effect of thinning regime and crop load on (a) average fruit weight, and (b) fruit yield per tree under different treatments across two seasons (error bars represent 95% confidence interval). ABE = artificial bud extinction; HT = hand thinned.
Agronomy 12 01989 g003
Figure 4. Photos showing the effect of thinning method and different crop loads on average fruit size.
Agronomy 12 01989 g004
Figure 5. Effect of thinning regime and crop load on fruit maturity parameters at harvest: (a) Starch pattern index, and (b) DA index under different treatments across two seasons (error bars represent 95% confidence interval). ABE = artificial bud extinction; HT = hand thinned.
Agronomy 12 01989 g005
Figure 6. Effect of thinning regime and crop load on fruit quality parameters: (a) flesh firmness, (b) total soluble solids, (c) dry matter content, (d) malic acid content, and (e) length/diameter ratio under different treatments across two seasons (error bars represent 95% confidence interval). ABE = artificial bud extinction; HT = hand thinned.
Agronomy 12 01989 g006
Figure 7. Effect of thinning regime and crop load on fruit color parameters: (a) L *, (b) a * and (c) b * values (error bars represent 95% confidence interval). ABE = artificial bud extinction; HT = hand thinned.
Agronomy 12 01989 g007
Figure 8. Effect of thinning regime and crop load on physiological disorders: (a) internal flesh browning and (b) loss in flesh firmness during storage (error bars represent 95% confidence interval). ABE = artificial bud extinction; HT = hand thinned.
Agronomy 12 01989 g008
Figure 9. (a) Effect of thinning regime and crop load on individual leaf area (error bars represent 95% confidence interval) and (b) two years of compiled data showing a negative correlation (r = −0.821) between fruit set/tree and individual leaf area. ABE = artificial bud extinction; HT = hand thinned.
Agronomy 12 01989 g009
Figure 10. (a) Poor quality fruit. (b) Damage caused by high crop load (irrespective of thinning regime) during season one.
Agronomy 12 01989 g010
Table 1. Treatment details and dates of application and harvest. LCSA = limb cross-sectional area; ABE = artificial bud extinction; HT = hand thinned.
SeasonThinning RegimeCrop Load
(Fruit cm−2 LCSA)
Date AppliedHarvest Date
One (2019–2020)ABE3, 6, 1217 September 201914 April 2020
HT3, 6, 1218 November 201914 April 2020
Two (2020–2021)ABE3, 6, 1228 September 202014 April 2021
HT3, 6, 1223 November 202014 April 2021
Table 2. Soil properties and nutrient content during both seasons.
Soil ParameterSeason 1Season 2
Soil TypeSandy GreySandy Grey
Texture3.02.5
Organic Carbon (%)4.835.13
pH (CaCl2)54.5
Ammonium Nitrogen (mg/kg)107
Nitrate Nitrogen (mg/kg)48
Phosphorus Colwell (mg/kg)1819
Potassium Colwell (mg/kg)179307
Exc. Potassium (meq/100 g)0.340.46
Exc. Calcium (meq/100 g)14.416.73
Exc. Magnesium (meq/100 g)1.762.31
Boron Hot CaCl2 (mg/kg)1.123.29
DTPA Iron (mg/kg)328.9504.1
DTPA Manganese (mg/kg)3.733.63
DTPA Zinc (mg/kg)6.985.85
DTPA Copper (mg/kg)3.632.71
Sulfur (mg/kg)6.813.4
Exc. Sodium (meq/100 g)0.170.31
Table 3. Effect of thinning regime (artificial bud extinction (ABE) or hand thinned (HT)) and crop load (3, 6, or 12 fruit cm−2 limb cross-sectional area (LCSA)) on fruit macronutrient and micronutrient concentrations in seasons 1 and 2.
(a)
Fruit Macronutrients
Nitrogen (%)Potassium (%)Calcium (%)
Season 1Season 2Season 1Season 2Season 1Season 2
(i) Crop load (CL)
3 fruit cm−2 LCSA0.170.230.850.810.030.03
6 fruit cm−2 LCSA0.180.230.740.850.030.03
12 fruit cm−2 LCSA0.19-0.74-0.04-
p-value0.0200.8880.0010.2820.0070.081
LSD0.020.050.070.070.010.01
(b) 
Fruit Micronutrients
Manganese (mg/kg)Zinc (mg/kg)Copper (mg/kg)
Season 1Season 2Season 1Season 2Season 1Season 2
(i) Thinning regime (TR)
Artificial bud extinction (ABE)2.031.842.331.762.113.24
Hand-thin (HT)1.991.591.881.432.092.89
p-value0.8020.1540.0040.0220.9230.079
LSD0.320.340.370.270.510.37
(ii) Crop load (CL)
3 fruit cm−2 LCSA1.691.941.881.772.082.88
6 fruit cm−2 LCSA2.101.501.981.422.063.25
12 fruit cm−2 LCSA2.24-2.46-2.17-
p-value0.0400.0230.0060.0170.9010.066
LSD0.500.340.580.270.790.37
(iii) TR x CL
ABE-3 1.752.061.792.011.753.02
HT-31.621.821.981.532.412.74
ABE-62.071.622.271.512.443.46
HT-62.131.371.681.341.683.04
ABE-122.27-2.94-2.14-
HT-122.21-1.97-2.19-
p-value0.8780.9590.0080.2160.0330.690
Note: (1) Means for the nutrients with significant effect along with two-way ANOVA p values from corresponding models are presented in this table. Means for the nutrients where no significant interaction was observed are presented in the Supplementary Material. Mean values for ABE-12 and HT-12 in season two are missing due to the unavailability of fruit samples. (2) The ‘LSD’ values shown are equivalent to the minimal absolute difference between two categories that would be notionally “statistically significant” according to a Tukey multiple comparison contrast analysis within a two-way ANOVA model without interactions (assuming a Bonferroni adjustment for the number of contrasts within a particular covariate and a Type I error rate of 0.05). (3) If interactions are relevant, the LSD values for the fixed effects can be misleading without reference to the apparent differences in means found in panel [(b) iii].
Table 4. Effect of thinning regime (artificial bud extinction (ABE) or hand thinned (HT)) and crop load (3, 6, or 12 fruit cm−2 limb cross-sectional area (LCSA)) on leaf macronutrient and micronutrient concentrations in season 1 and 2.
(a)
Leaf Macronutrients
Nitrogen (%)Potassium (%)
Season 1Season 2Season 1Season 2
(i) Crop load (CL)
3 fruit cm−2 LCSA1.411.751.471.68
6 fruit cm−2 LCSA1.781.481.191.65
12 fruit cm−2 LCSA1.781.421.141.87
p-value0.0110.0010.0010.122
LSD0.290.210.190.29
(b) 
Leaf Micronutrients
Iron (mg/kg)Zinc (mg/kg)Copper (mg/kg)
Season 1Season 2Season 1Season 2Season 1Season 2
(i) Thinning regime (TR)
Artificial bud extinction (ABE)89.496.69.314.58.943.1
Hand-thin (HT)82.286.09.011.48.642.6
p-value0.1050.2000.540<0.0010.7440.797
LSD9.1421.171.301.241.604.91
(ii) Crop load (CL)
3 fruit cm−2 LCSA72.4114.68.514.87.438.0
6 fruit cm−2 LCSA86.476.38.812.78.946.2
12 fruit cm−2 LCSA98.583.010.211.210.044.4
p-value0.0010.0040.028<0.0010.0380.011
LSD14.1832.862.021.922.497.62
(iii) TR x CL
ABE-3 73.2137.09.216.76.7838.0
HT-371.792.27.712.97.9438.0
ABE-695.077.09.414.99.8643.3
HT-677.875.68.110.67.9749.1
ABE-12100.075.99.211.79.9548.1
HT-1297.090.211.110.79.9540.8
p-value0.2640.0260.0230.0280.2560.050
Note: (1) Means for the nutrients with significant effect along with two-way ANOVA p values from corresponding models are presented in this table. Means for the nutrients where no significant effect was observed are presented in the supplementary material. (2) The ‘LSD’ values shown are equivalent to the minimal absolute difference between two categories that would be notionally “statistically significant” according to a Tukey multiple comparison contrast analysis within a two-way ANOVA model without interactions (assuming a Bonferroni adjustment for the number of contrasts within a particular covariate and a Type I error rate of 0.05). (3) If interactions are relevant, the LSD values for the fixed effects can be misleading without reference to the apparent differences in means found in panel [(b) iii].
Publisher’s Note: MDPI stays neutral with regard to jurisdictional claims in published maps and institutional affiliations.

