Article

Factors Influencing the Spatiotemporal Variability in the Irrigation Requirements of Winter Wheat in the North China Plain under Climate Change

1
Key Laboratory of Agricultural Soil and Water Engineering in Arid and Semiarid Areas, Ministry of Education, Northwest A&F University, Yangling 712100, China
2
Institute of Water-Saving Agriculture in Arid Areas of China, Northwest A&F University, Yangling 712100, China
3
College of Water Resources and Architectural Engineering, Northwest A&F University, Yangling 712100, China
*
Author to whom correspondence should be addressed.
Agronomy 2022, 12(9), 1987; https://doi.org/10.3390/agronomy12091987
Submission received: 22 July 2022 / Revised: 13 August 2022 / Accepted: 19 August 2022 / Published: 23 August 2022

Abstract

:
The North China Plain is a major grain-producing area, but faces water scarcity, which directly threatens food security. The problem is more severe under climate change and the seasonal impact of climate change on winter wheat is different. Thus, it is of great importance to explore the spatiotemporal characteristics of irrigation requirements (IR) and the factors influencing IR in different growth periods of winter wheat, but it has not received much attention. Therefore, we used relative contribution, partial correlation and path analyses to assess the spatiotemporal characteristics of the IR and primary factors influencing the IR of winter wheat in various growing stages in the North China Plain. The results indicated that wind speed and net solar radiation showed a significant downward trend; no prominent trend was noted in IR (multiyear average, 302.3 mm). Throughout the growing season of winter wheat, IR increased gradually from the southern to northern extent of the North China Plain. The irrigation demand of winter wheat in stage P2 (green-up to heading) was the largest. Furthermore, the dominant drivers of IR in terms of spatial distribution and inter-annual variation were phenological period (Phe), effective precipitation (Pe) and relative humidity (RH); however, the degree of their effects varied across the growth stages and growing regions of winter wheat. Each factor exerted both direct and indirect effects on IR and Phe exhibited the strongest indirect effect on IR. The major factors contributing most to IR were Pe and RH in the P1 stage (sowing to green-up) and Phe, Pe and RH in the P2 and P3 (heading to maturity) stages. Pe and RH limited IR, whereas Phe promoted it. Our findings will help improve agricultural water management in the future.

1. Introduction

Climate change and population growth have led to severe water scarcity, which threatens food security. Furthermore, the overexploitation of groundwater causes various ecological problems. Because agricultural irrigation is a major mode of water use and the agricultural domain is quite extensive in China, the implications of climate change on water resources and crop production are alarming, particularly in Northern China [1]. The North China Plain is a key agricultural production base, mainly growing winter wheat and summer maize, with 70% of the country’s wheat grown in this region [2,3]. Although large areas of arable lands and extensive irrigated areas are present in the North China Plain, the proportion of water resources does not correspond to the existing population, arable land distribution or agricultural productivity in this area. Moreover, owing to frequent drought, this region of China is ecologically fragile. According to the Sixth Assessment Report (2021) issued by the Intergovernmental Panel on Climate Change (https://www.ipcc.ch/report/sixth-assessment-report-cycle/, accessed on 6 March 2022), the temperature in 2001–2020 was 0.99 °C higher than that in 1850–1900. Global warming is expected to worsen in the future unless adequate measures are taken immediately. Climate change alters not only atmospheric circulation, the hydrological cycle and precipitation patterns [4,5,6] but also the physiological characteristics of crops, thus, inevitably affecting crop water requirements (CWR) and crop growth and development [7]. This, in turn, affects crop yield and quality. Therefore, the spatiotemporal characteristics of irrigation requirements (IR) for different winter wheat growth stages and factors influencing IR must be explored to devise relevant strategies for ensuring high crop yield and to develop targeted measures for timely water replenishment during critical periods, such as drought. This will ensure high crop growth under optimal water conditions.
Climate change reportedly affects the CWR and IR of crops. Liu et al. [8] studied the spatiotemporal variation characteristics of meteorological factors and IR of spring wheat, winter wheat, spring maize and summer maize during their growing seasons in the Yellow River basin between 1974 and 2017; they identified effective precipitation (Pe), net solar radiation (Rn) and relative humidity (RH) to be the primary meteorological factors affecting the change in crop IR. Luo et al. [9] revealed that the decreasing trend noted in the IR of rice in South China between 1953 and 2017 was mainly due to a decrease in CWR and an increase in precipitation; precipitation had a major effect on IR. In addition, Xu et al. [10] studied the IR of wheat in the Beijing–Tianjin–Hebei region between 1960 and 2019; precipitation, wind speed (wind) and RH exhibited a decreasing trend, whereas the average temperature showed an increasing trend. The IR of wheat gradually increased from the south to the north and from the west to the east in the North China Plain. The overall change in IR showed the highest association with potential evapotranspiration; however, the annual change in regional IR was dependent primarily on wind, RH and Rn. Using the CropWat model, Ruan et al. [11] assessed CWR in the Syr Darya basin, Central Asia, between 2000 and 2018 to evaluate the spatiotemporal variation characteristics of the CWR of major crops at the urban scale. Based on sensitivity analysis, they identified the changes in cropland (65.0%) and climate (35.0%) to be the predominant factors affecting the change in CWR. Furthermore, Xu et al. [12] evaluated the effects of climate change on maize IR at different growth stages and under different climate change conditions; they reported that climate change in the future may further limit irrigation for the cultivation of maize in the Northeast agricultural region. Maize is more sensitive to a water deficit and requires more frequent irrigation at the mid-season stage than at other stages. Using the water balance equation, Wu et al. [13] estimated the IR of the winter wheat–summer maize rotation system between 1980 and 2012. The changes in the IR of winter wheat, summer maize and the rotation system exhibited no significant trend; the multiyear averages were 341.1, 250.5 and 592.5 mm, respectively. The high-IR regions were mainly clustered in the northern part of Shandong Province. The IR of the crops grown in most regions in the northern part of the Yellow River basin, the northern part of the North China Plain and the junction of Hebei and Shandong provinces exhibited an increasing trend and those in other regions showed a decreasing trend. Yang et al. [14] analyzed the trends in and spatial distribution of the CWR and IR of cotton between 1965 and 2016 and reported a decreasing trend in CWR because of substantial decreases in Rn, sunshine hours and wind.
There are two primary methods to evaluate IR. The first type of approach is crop model simulation [12,13,15], which requires a complex set of parameters (e.g., meteorological data, genetic parameters, physical and hydrological properties) and field experimental calibration. The second type is a combination of the water balance equation and crop coefficient method, which has been more widely used in water demand studies due to the simplicity of parameter acquisition [8,9,16]. In this paper, we also use the water balance model combined with the crop coefficient method to assess IR.
Most studies focused on the correlation between CWR or IR and meteorological factors throughout the growth period of crops in a single region. However, crop growth responds differently to climate change across growing regions and growth stages; in addition to meteorological indicators, phenological period (Phe) affects IR. However, to the best of our knowledge, these aspects have not been explored adequately.
In this study, we assessed the effects of meteorological factors and Phe on the IR of winter wheat in the North China Plain between 2000 and 2020. The evaluations were performed considering various growing regions and growth stages of this crop. For this study, we used the water balance model and contribution, partial correlation and path analyses. Specifically, the study objectives were as follows:
(1)
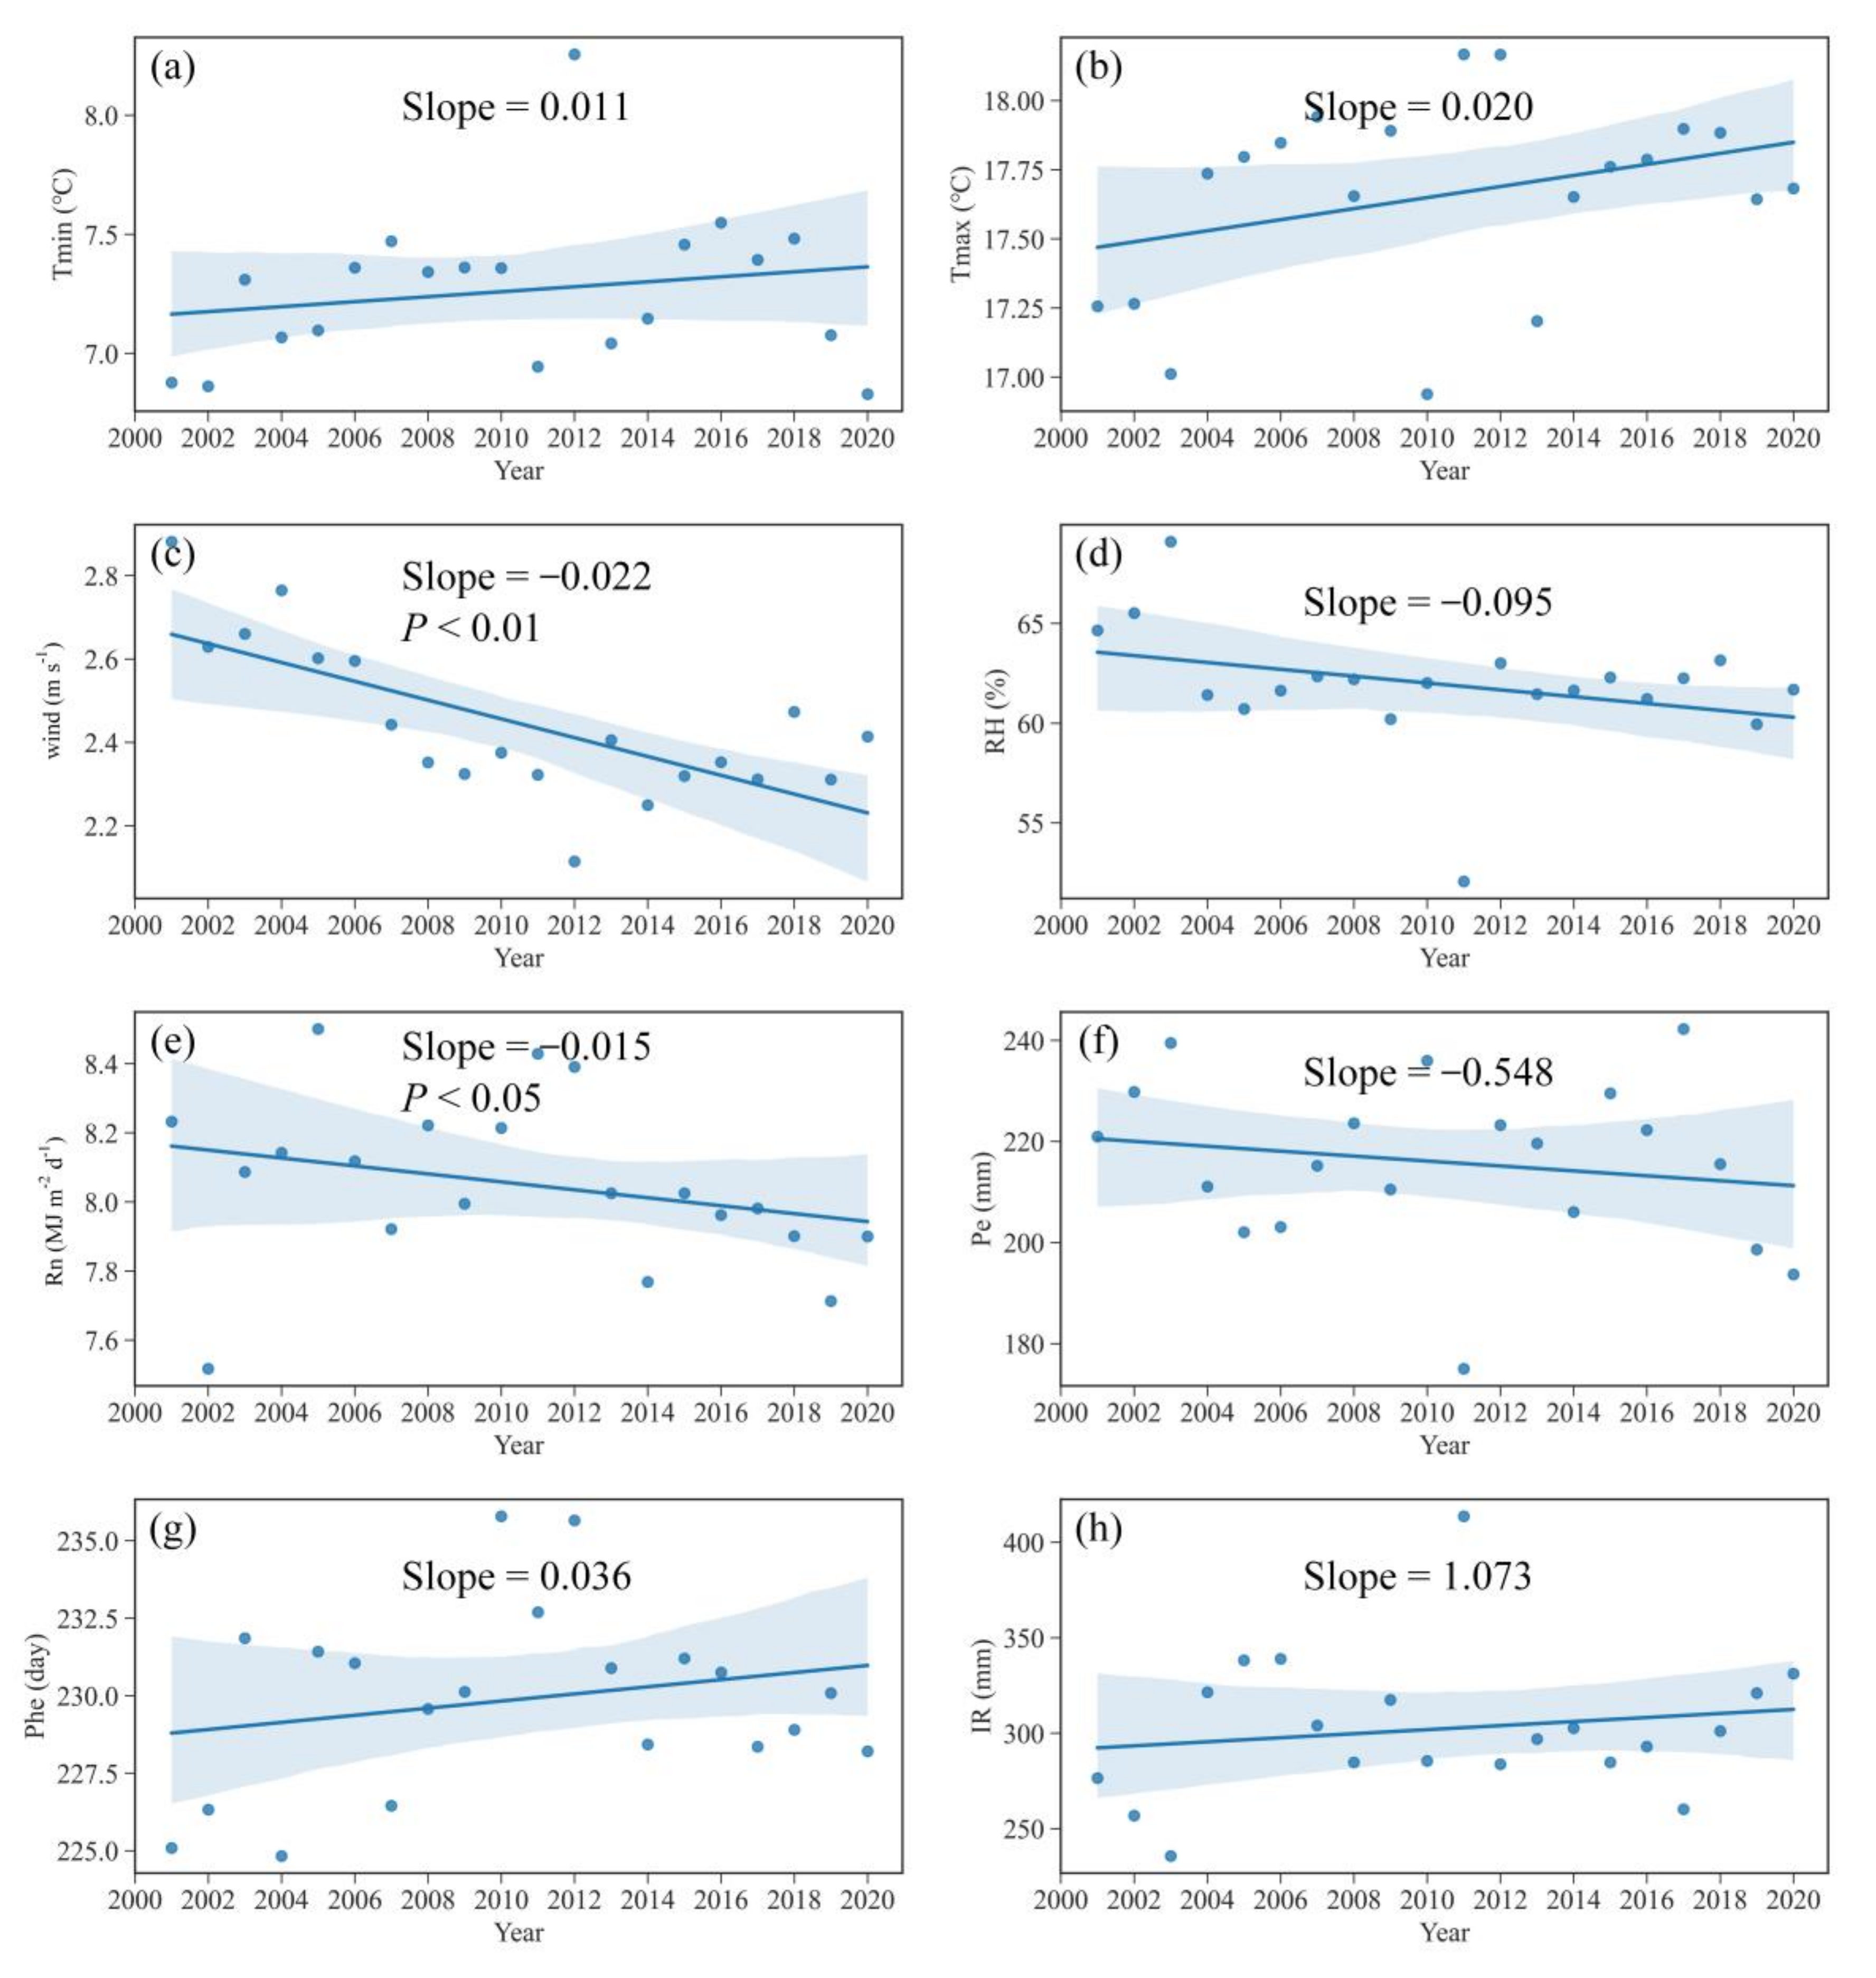
To assess the trends in the independent factors (minimum temperature (Tmin), maximum temperature (Tmax), wind, RH, Rn, Pe and Phe) and IR and the spatiotemporal characteristics of IR and the probability of exceedance (PoE) of IR between 2000 and 2020.
(2)
To identify the primary drivers of IR and indirect effects of each factor on IR.
(3)
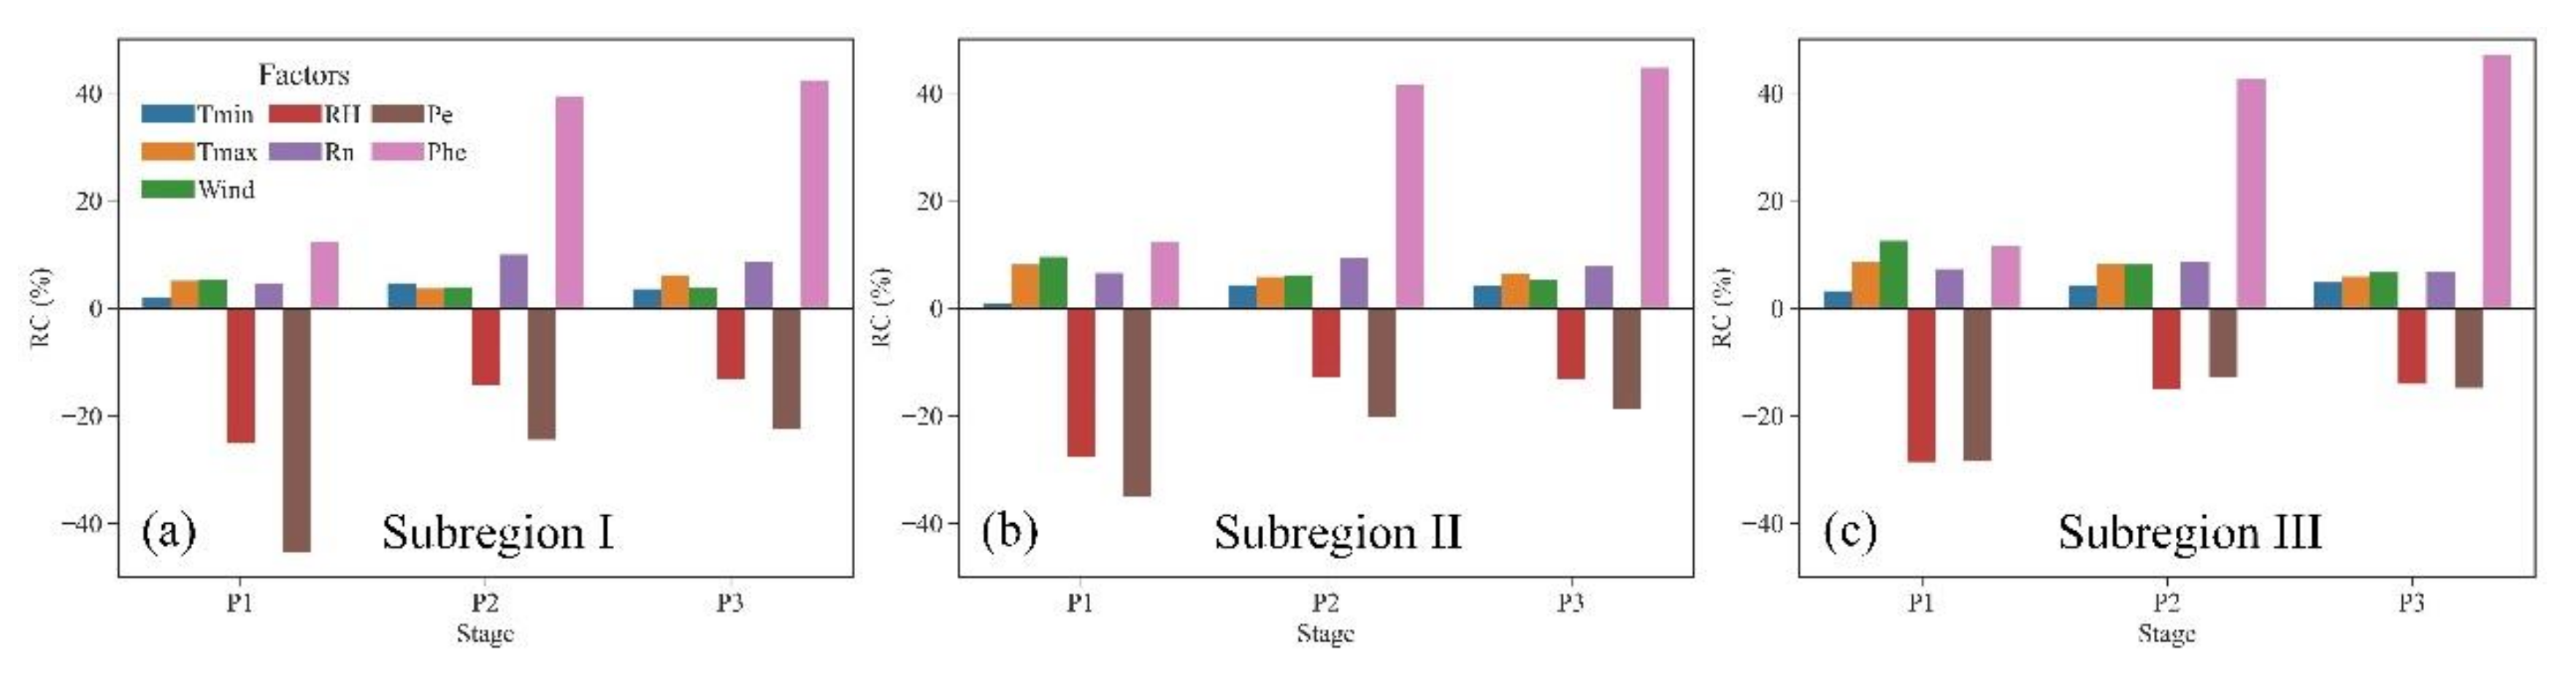
To determine the relative contribution rate of each factor to the IR of winter wheat.

2. Materials and Methods
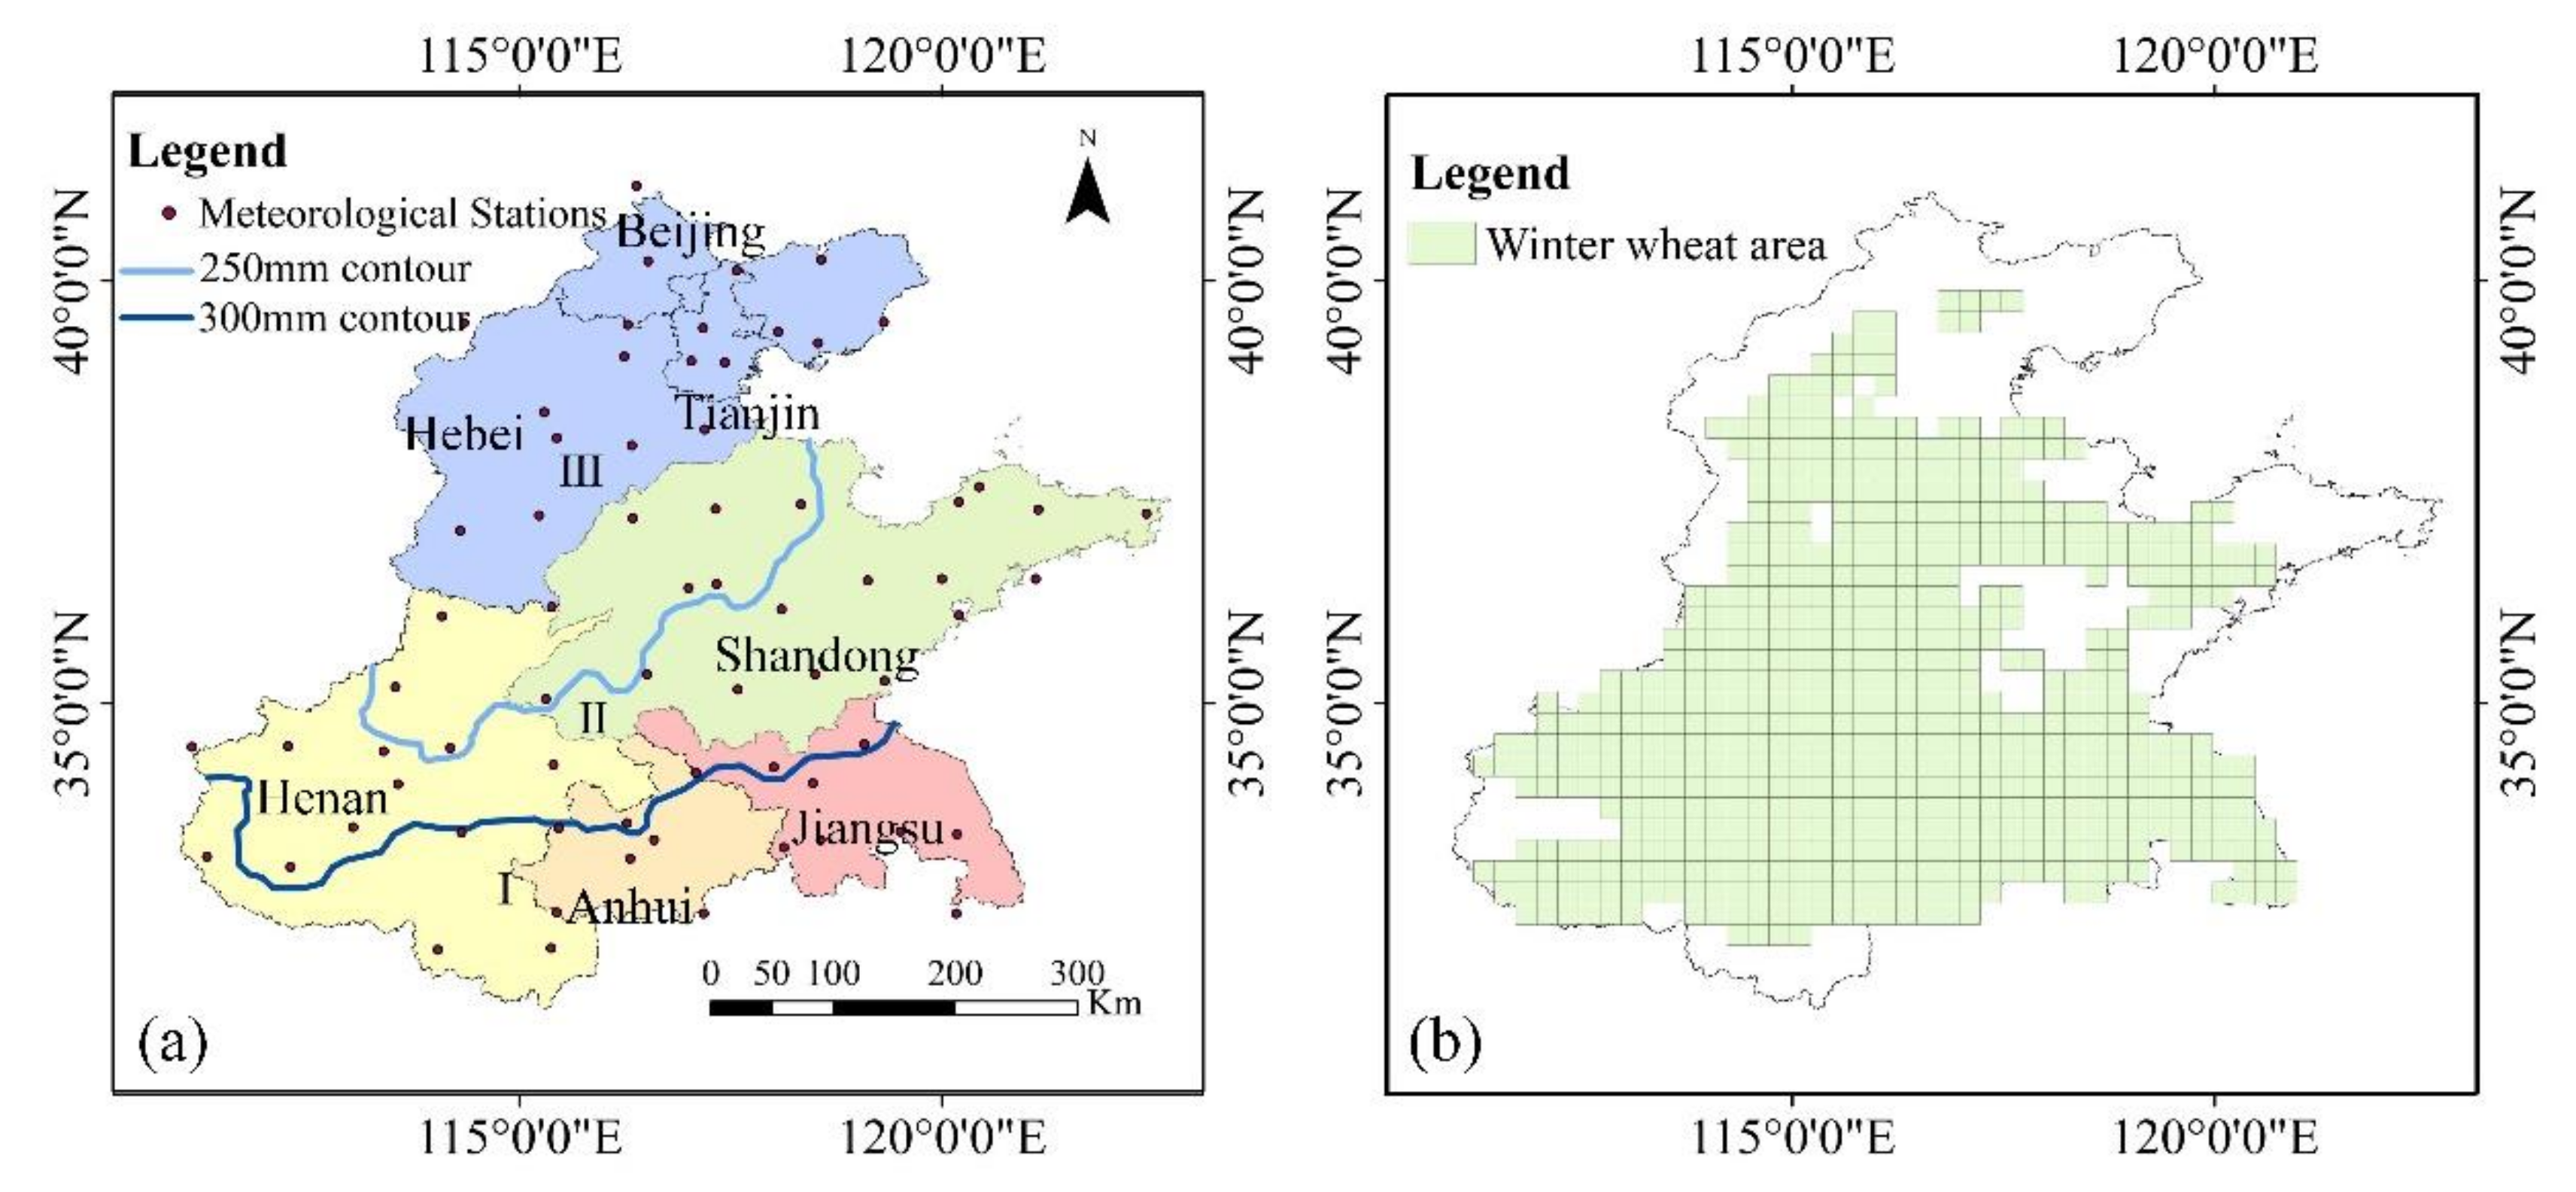
2.1. Study Area

The North China Plain is located in the eastern part of China and covers an area of approximately 300,000 km2 that includes Beijing, Tianjin, Hebei, Shandong, Henan, Jiangsu and Anhui. This alluvial plain is composed of loamy soil textures that favor arable farming [17]. The prominent crops grown in this region are winter wheat and summer maize. However, winter wheat is short of water in the region because rainfall is concentrated between June and October, when winter wheat grows from October to June of the following year. The North China Plain has a semi-humid monsoon climate with distinct seasonal variations and annual average precipitation that decreases from the south to the north. As depicted in Figure 1a, we divided the North China Plain into three subregions based on Pe: I (Pe ≥ 250 mm), II (200 mm < Pe < 250 mm) and III (Pe ≤ 200 mm). From the China Meteorological Center (http://data.cma.cn/, accessed on 25 February 2022), data on daily minimum temperature, maximum temperature, sunshine duration, relative humidity, wind speed and precipitation between 2000 and 2020 were obtained from a total of 68 meteorological stations. The MOD09A1 data product was used to determine surface reflectance of MODIS bands 1–7 at a 500 m spatial resolution (Google Earth; https://developers.google.com/earth-engine/datasets/catalog/MODIS_006_MOD09A1?hl=en, accessed on 25 February 2022).

2.2. Preprocessing

The best 8-day synthetic remote sensing observations were considered by eliminating partial cloud interference using the maximum value composite method. The growing regions of winter wheat in the study area were marked using the MODIS-NDPI intertemporal data sequence waveform-matching method and further processed through Savitzky–Golay filtering for noise reduction [18]. We divided major winter wheat regions into grids with a spatial resolution of 25 km (613 grids in total) and assumed that each grid had uniform meteorological conditions and planting structures. The remote sensing and meteorological data in each grid were derived as the mean values of all winter wheat pixels in the grid. Moreover, The Kriging method was used for spatial interpolation to obtain daily meteorological data in each grid from 2000 to 2020. Finally, the dynamic threshold method was used to identify the key phenological period of winter wheat; this method is used to estimate phenological characters based on remote sensing data [19]. In the present study, the growth Period of winter wheat was divided into three major growth stages: P1 (sowing to green-up), P2 (green-up to heading) and P3 (heading to maturity).

2.3. Methods

2.3.1. IR Calculation

According to the field water balance model, the water storage capacity of the wheat field before irrigation or drainage on the t-day is calculated as follows:
W t W t 1 = P F E T c
where W t is the field water storage before irrigation or drainage on the t-day (mm), W t 1 is the field storage at the end of the previous day (mm), P is the rainfall on the t-day (mm), F is the amount of the field leakage on the t-day (mm), though in this paper, the daily field leakage was ignored and ETc is the actual evapotranspiration.
Therefore, IR can be estimated according to the following principle [20]:
I R = E T c P e
where IR is the irrigation water requirements of winter wheat (mm d−1) and Pe is the effective rainfall during the growth period of winter wheat, excluding surface runoff, deep infiltration and evaporation (mm d−1). When ETc ≤ Pe (i.e., IR ≤ 0), no irrigation is needed.
The CWR of winter wheat can be estimated using the single-crop coefficient approach recommended by the Food and Agriculture Organization (FAO), where the daily value is determined by multiplying the reference evapotranspiration by the crop coefficient [21].
E T c = E T 0 × K c
where ETc (mm d−1) is the actual CWR, ET0 (mm d−1) is the reference crop evapotranspiration and Kc (dimensionless) is the crop coefficient. In this paper, we referred to [10,22,23] and set the crop coefficients of winter wheat at the P1, P2 and P3 stages as 0.8, 1.2 and 0.95, respectively.
The Penman–Monteith equation proposed by FAO is the most widely used method for quantifying reference evapotranspiration and is only influenced by local geographical and climatic conditions [21]. In the present study, the Penman–Monteith equation was used to calculate the ET0 for each weather station.
E T 0 = 0.408 Δ ( R n G ) + γ 900 T + 273 u 2 ( e s e a ) Δ + γ ( 1 + 0.34 u 2 )
where ET0 (mm d−1) is the reference crop evapotranspiration, Rn (MJ m−2 d−1) is the net canopy surface solar radiation, G (MJ m−2 d−1) is the soil heat flux, γ (kPa °C−1) is the psychrometric constant, T (°C) is the mean temperature, u 2 (m s−1) is the average daily wind at a 2 m height, e s (kPa) is the saturation vapor pressure, e a (kPa) is the actual vapor pressure and Δ (kPa °C−1) is the slope of the saturation vapor pressure curve.
The effective precipitation at each growth stage of winter wheat is the net precipitation that reaches the root layer of the crop at that stage, representing the effective fraction of the total precipitation. In this study, we used the effective precipitation calculation method recommended by the Natural Resources Conservation Service of the US Department of Agriculture [8]:
P e = P × ( 4.17 0.2 P ) / 4.17 ,   P   <   8.3   m m 4.17 + 0.1 P , P     8.3   m m
where Pe (mm d−1) is the effective daily precipitation and P (mm d−1) is the total daily precipitation.

2.3.2. Contribution Rate Analysis

The contribution analysis method was used to assess the average relative contribution rate of each factor to the IR of winter wheat.
To eliminate the confounding effects of non-climatic factors, the first-difference estimator approach was used, which reduces the effects of long-term trends due to technology or management [24,25].
We first calculated the trend in each parameter using a one-dimensional linear regression model with year as the independent variable:
f ( i ) = T i × y e a r + b i
where f(i), Ti and bi are the function value, slope and intercept of factor i (IR, Tmin, Tmax, Wind, RH, Rn, Pe or Phe), respectively.
Δ I R = k = f 1 f n S k × Δ T k + ε
where Δ I R is the first-order difference in the IR of winter wheat; f1, …, fn are Tmin, Tmax, wind, RH, Rn, Pe and Phe, respectively; Sk is the sensitivity of the IR of winter wheat to each factor; and Δ Tk is the first-order difference for the mean of each factor.
The multiple regression model developed to calculate the trend in the IR of winter wheat is as follows:
T I R , k = k = f 1 f n S k × T k
where TIR,k is the trend in the IR of winter wheat under the influence of each factor and Tk represents the trend in IR in response to various factors in the corresponding period.
Therefore, the contribution of a single variable (e.g., Tmin) to the IR of winter wheat can be expressed as follows:
R C T m i n = S T m i n × T T m i n k = f 1 f n S k × T k × 100 %
The average relative contribution rate of Tmin ( R C ¯ T min ) can be calculated using the following equation:
R C ¯ T min = m = 1 n R C T m i n , m k = f 1 f n m = 1 n R C k , m × 100 %
where R C T min , m denotes the relative contribution rate of Tmin for grid m and R C k , m represents the relative contribution rate of each factor for grid m.
The average relative contribution rates of Tmax, wind, RH, Rn, Pe and Phe were also calculated using this method.

2.3.3. Correlation Analysis

Partial correlation analysis was performed to determine the linear correlation between two variables under the condition that the linear effects of other variables were controlled for and the index used was the partial correlation coefficient. Therefore, the relationship between winter wheat IR and each factor can be fully revealed under comprehensive meteorological conditions.
Path analysis is independent of the interactions between variables. This analysis helps in determining the relative importance of multiple independent variables. In addition, it helps clarify the direct and indirect effects of each particular variable on the dependent variable, which facilitates the determination of the interaction between variables and the degree of the effect of the particular variables on the dependent variable. In this study, we first developed a multiple regression model using the independent variables (Tmin, Tmax, wind, RH, Rn, Pe and Phe) and the dependent variable (IR) to obtain the partial regression coefficient b for each independent variable; subsequently, the standard deviations S i , x and S y were calculated for the independent and dependent variables, respectively. Thus, the direct and indirect path coefficients can be expressed as follows:
P i , y = b i × S i . x S y
I P i , j , y = r i , j × P j , y
where P i , y is the direct path coefficient of independent variable i to the dependent variable y, I P i , j , y is the indirect path coefficient of the independent variable i and of the independent variable j to the dependent variable y and r i , j is the Pearson correlation coefficient of the independent variables i and j.

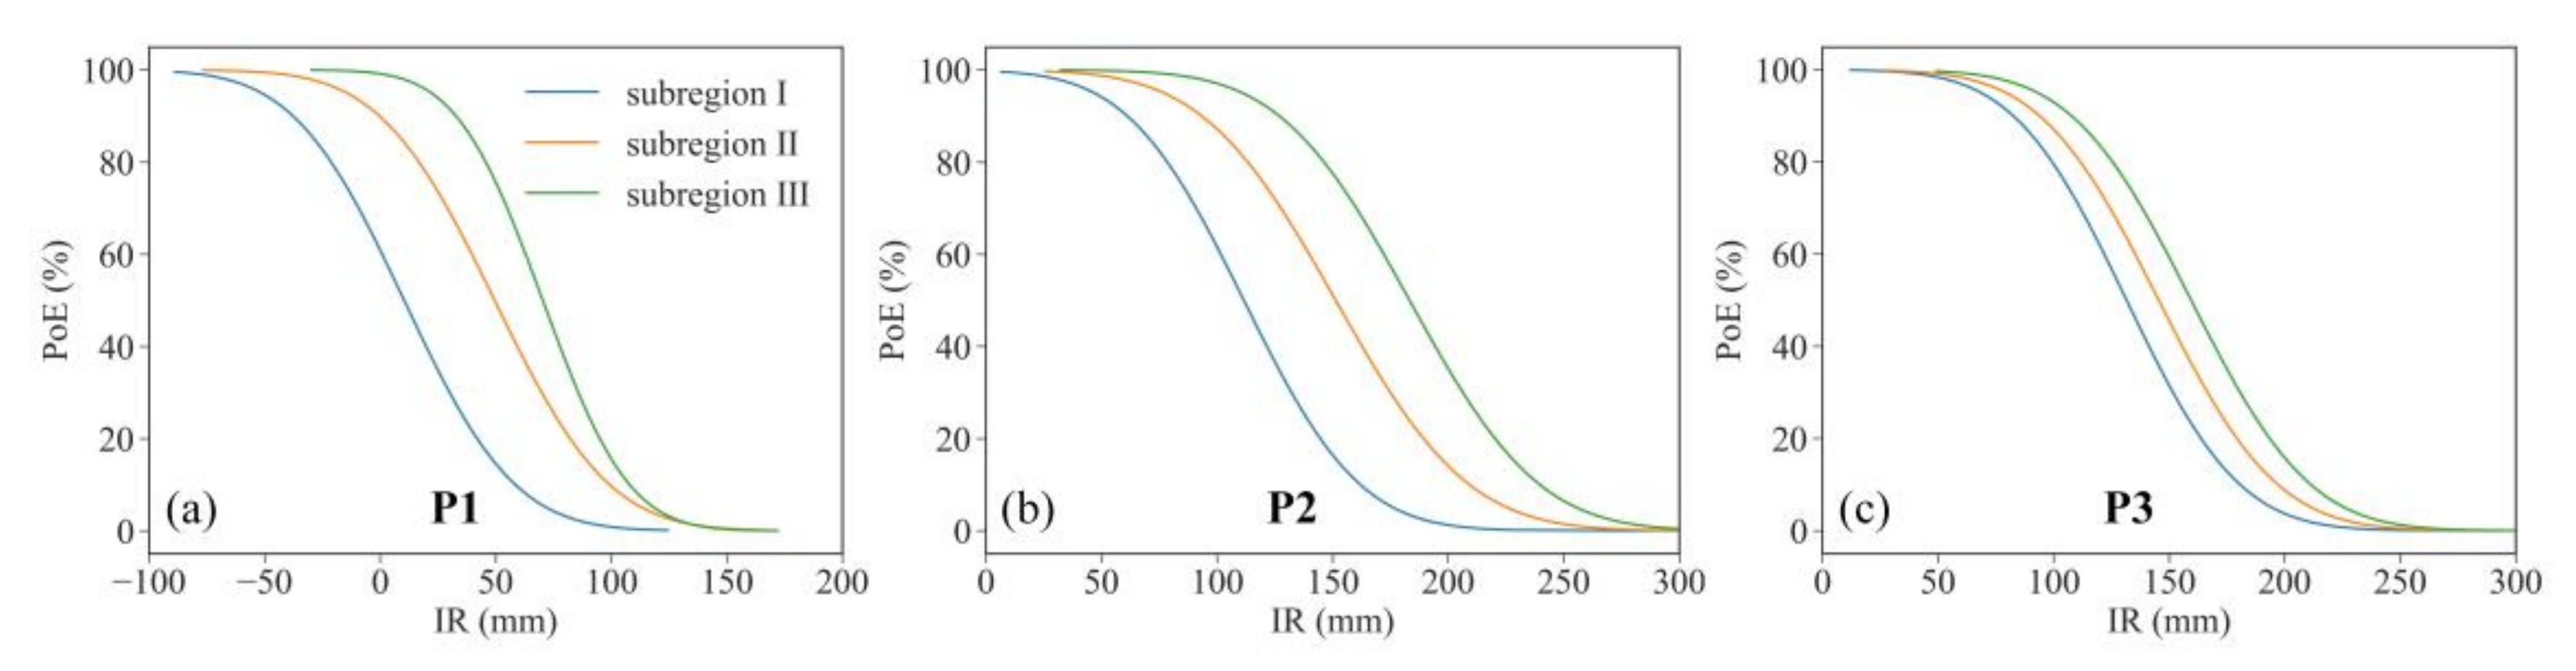
2.3.4. Probability of Exceedance (PoE) of IR

The PoE indicates the probability of a specified threshold being breached. It is used in weather forecasting and extreme event prediction. Based on the study conducted by Gao et al. [26], we used the PoE curve to describe the likelihood of exceeding a certain amount of irrigation between 2000 and 2020.

2.3.5. Trend Analysis

The Sen’s slope test and Mann–Kendall test were used to analyze and test the significance of the trends of Tmin, Tmax, wind, RH, Rn, Pe, Phe and IR. The Sen’s slope test is a robust nonparametric statistical method for trend analysis. The method is computationally efficient, insensitive to measurement error and niche data and suitable for the trend analysis of lengthy time-series data. The Mann–Kendall test is a nonparametric test, which is superior in its ability to help analyze a linear or nonlinear trend. The specific formula was described by Li et al. [27].

3. Results

3.1. Temporal Variation in IR and Independent Factors

The trends in IR and the factors influencing winter wheat IR in the North China Plain between 2000 and 2020 are presented in Figure 2. Tmin, Tmax and Phe exhibited increasing trends; however, the changes were not significant. Conversely, wind, RH, Rn and Pe exhibited decreasing trends; only wind and Rn decreased significantly (p < 0.01 and p < 0.05, respectively). No prominent trend was noted in IR and the multiyear average value of IR was 302.3 mm.

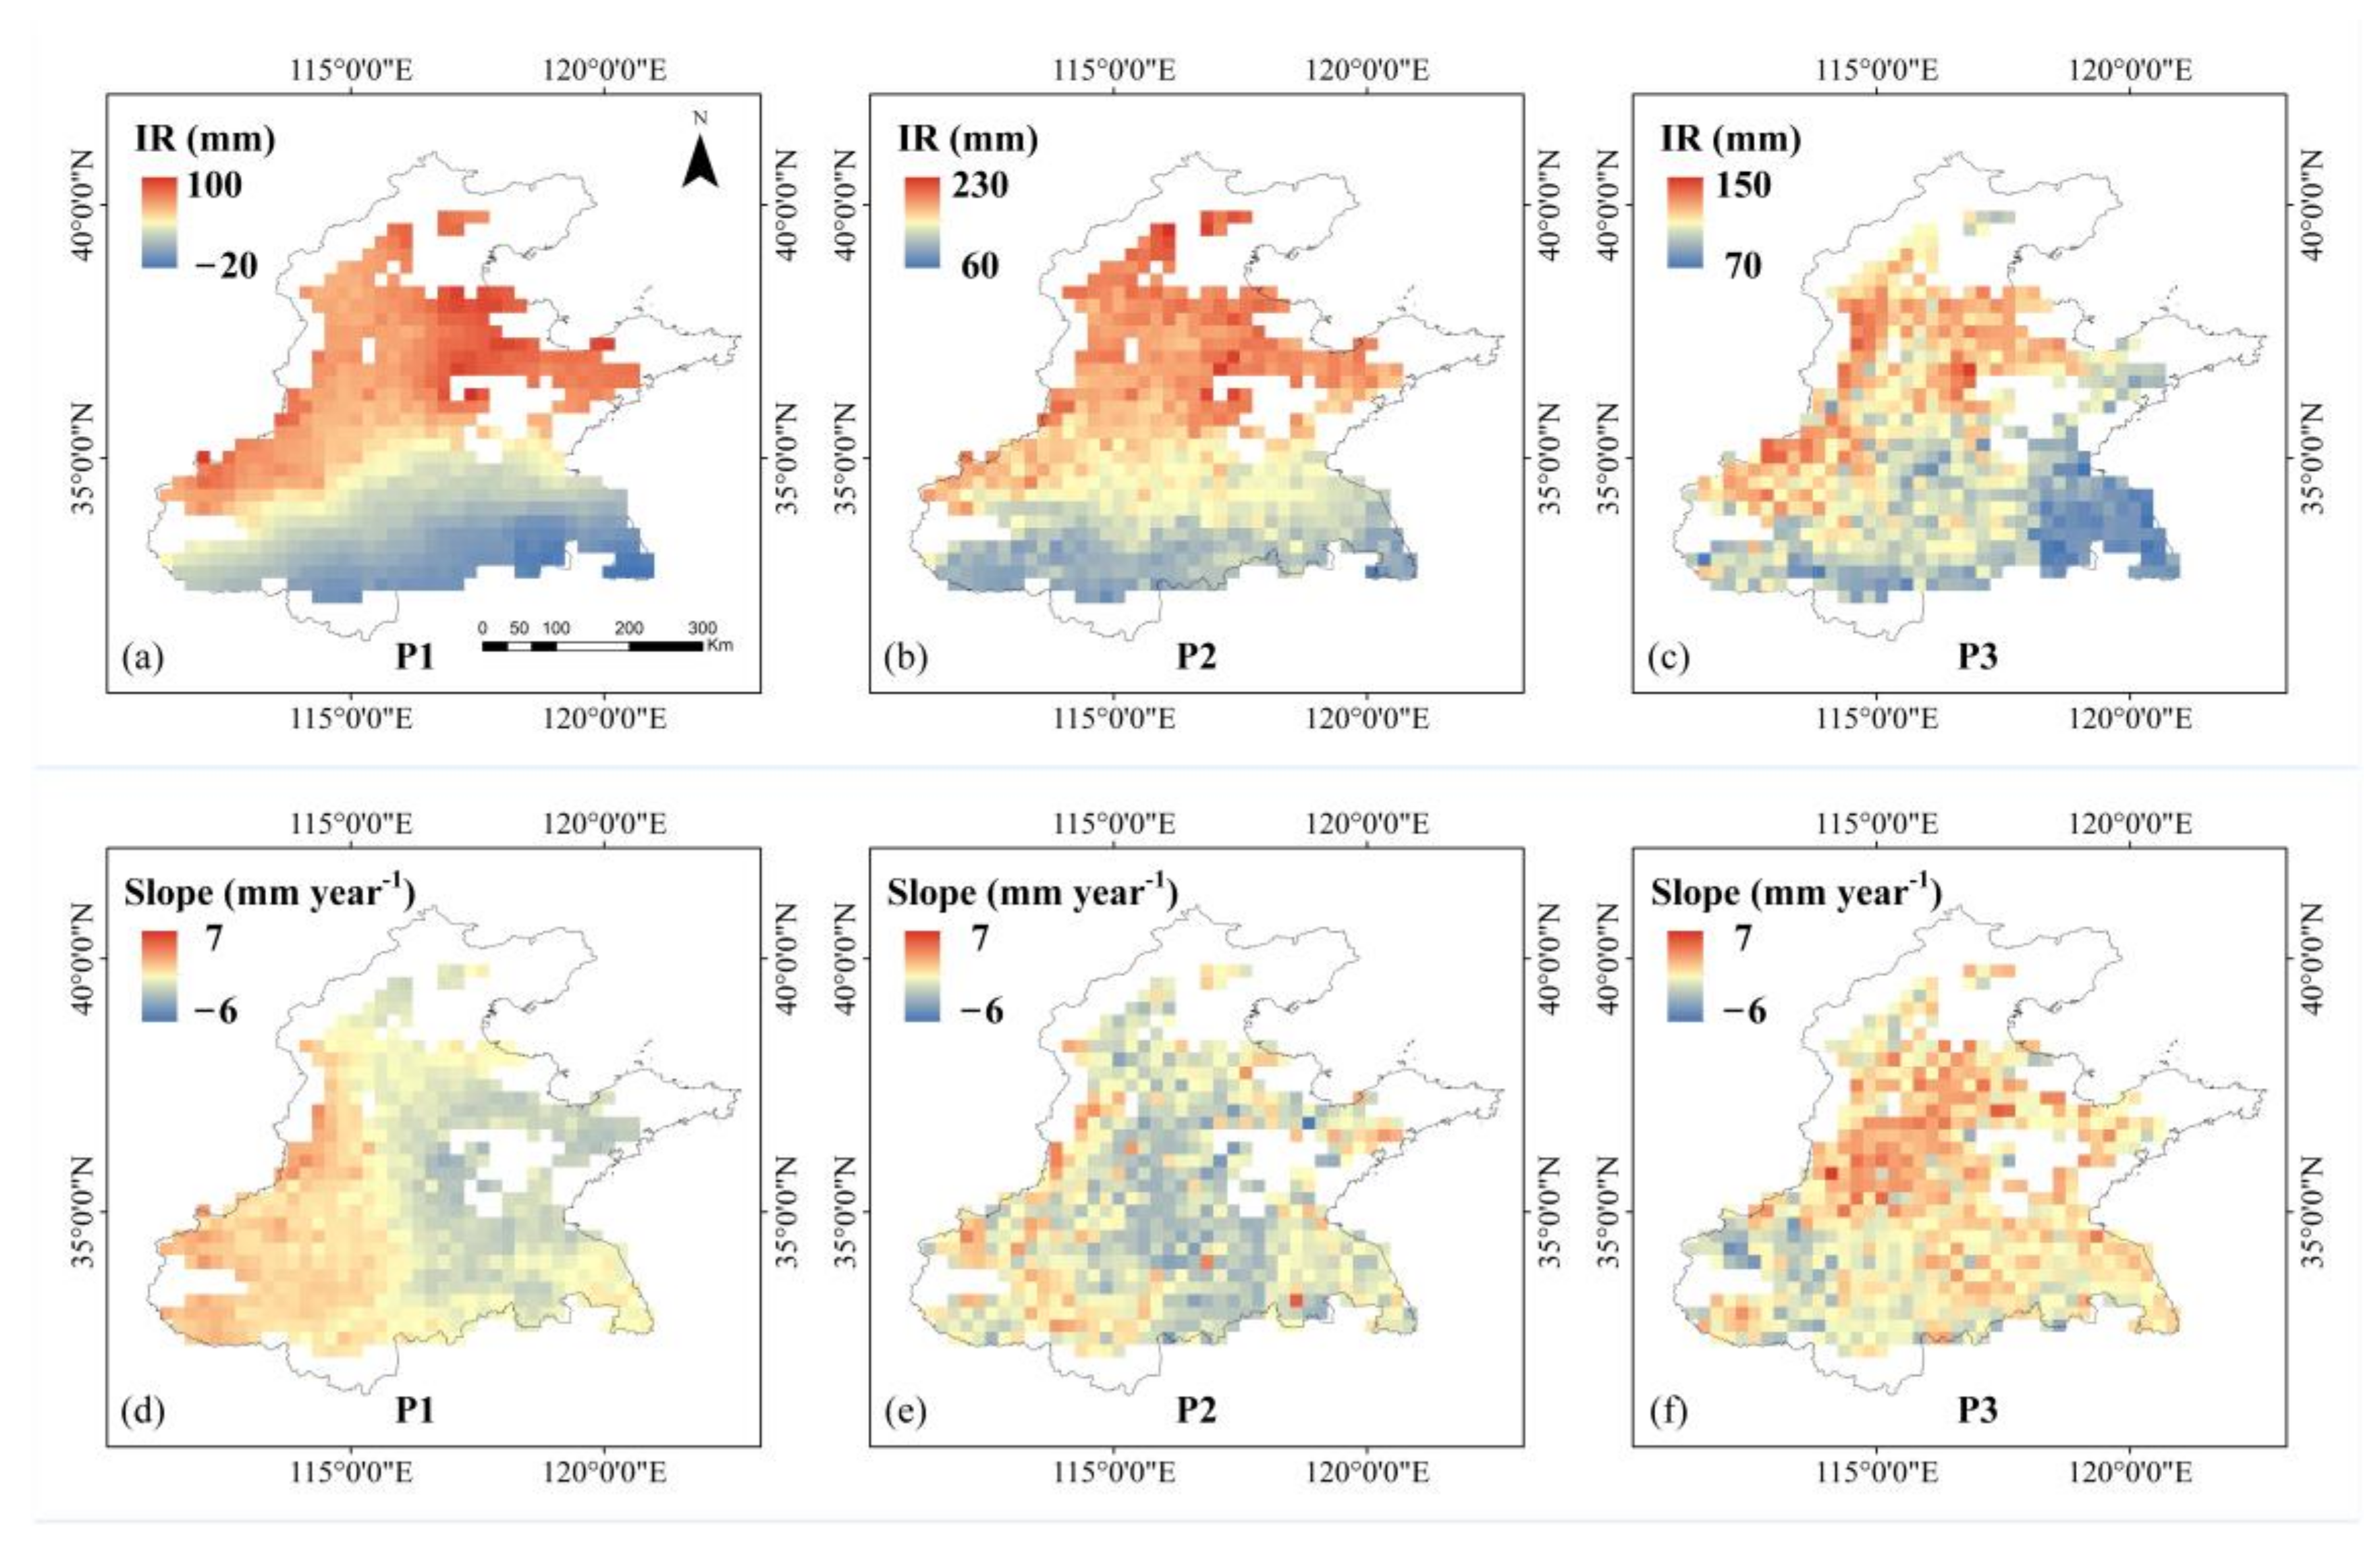
3.2. Spatiotemporal Patterns of IR

3.2.1. Spatial Variation in IR

Figure 3 shows the spatial distribution of and trends in multiyear average IR during different growth stages of winter wheat in the North China Plain between 2000 and 2020. The multiyear average IR of winter wheat in the P1, P2 and P3 stages was 45.5, 151.2 and 146.5 mm, respectively. IR increased gradually from the south to the north of the plain throughout the growth period (Figure 3a–c). In the P1 stage, IR exhibited a decreasing trend in the east but an increasing trend in the west (Figure 3d). In the P2 stage, IR exhibited a decreasing trend in most areas except for the western and southern parts of Henan Province (Figure 3e). In the P3 stage, the southwestern part exhibited a decreasing trend; the central and northern parts exhibited an increasing trend, particularly at the junction of Henan, Hebei and Shandong. However, no trend was evident in other areas (Figure 3f).

3.2.2. Comparison of PoE for IR in Different Growth Stages of Winter Wheat

During the P1 stage, the probability of irrigation in subregions I, II and III was 60.9%, 89.9% and 99.2%, respectively (Figure 4a). In the P2 and P3 stages, this probability was approximately 100% in the study area (Figure 4b,c). The PoE of a water deficit gradually increased from the south to the north of the plain. In different growth stages of winter wheat, the average probability of IR exceeding a certain value in the study area exhibited the following order: >50 mm, P2 (97.6%) > P3 (95.4%) > P1 (46.6%); >100 mm, P2 (82.0%) > P3 (55.6%) > P1 (10.7%); and >150 mm, P2 (48.4%) > P3 (8.4%) > P1 (0.3%). Thus, winter wheat exhibited the highest probability of a water deficit in the P2 stage.

3.3. Correlation Analysis

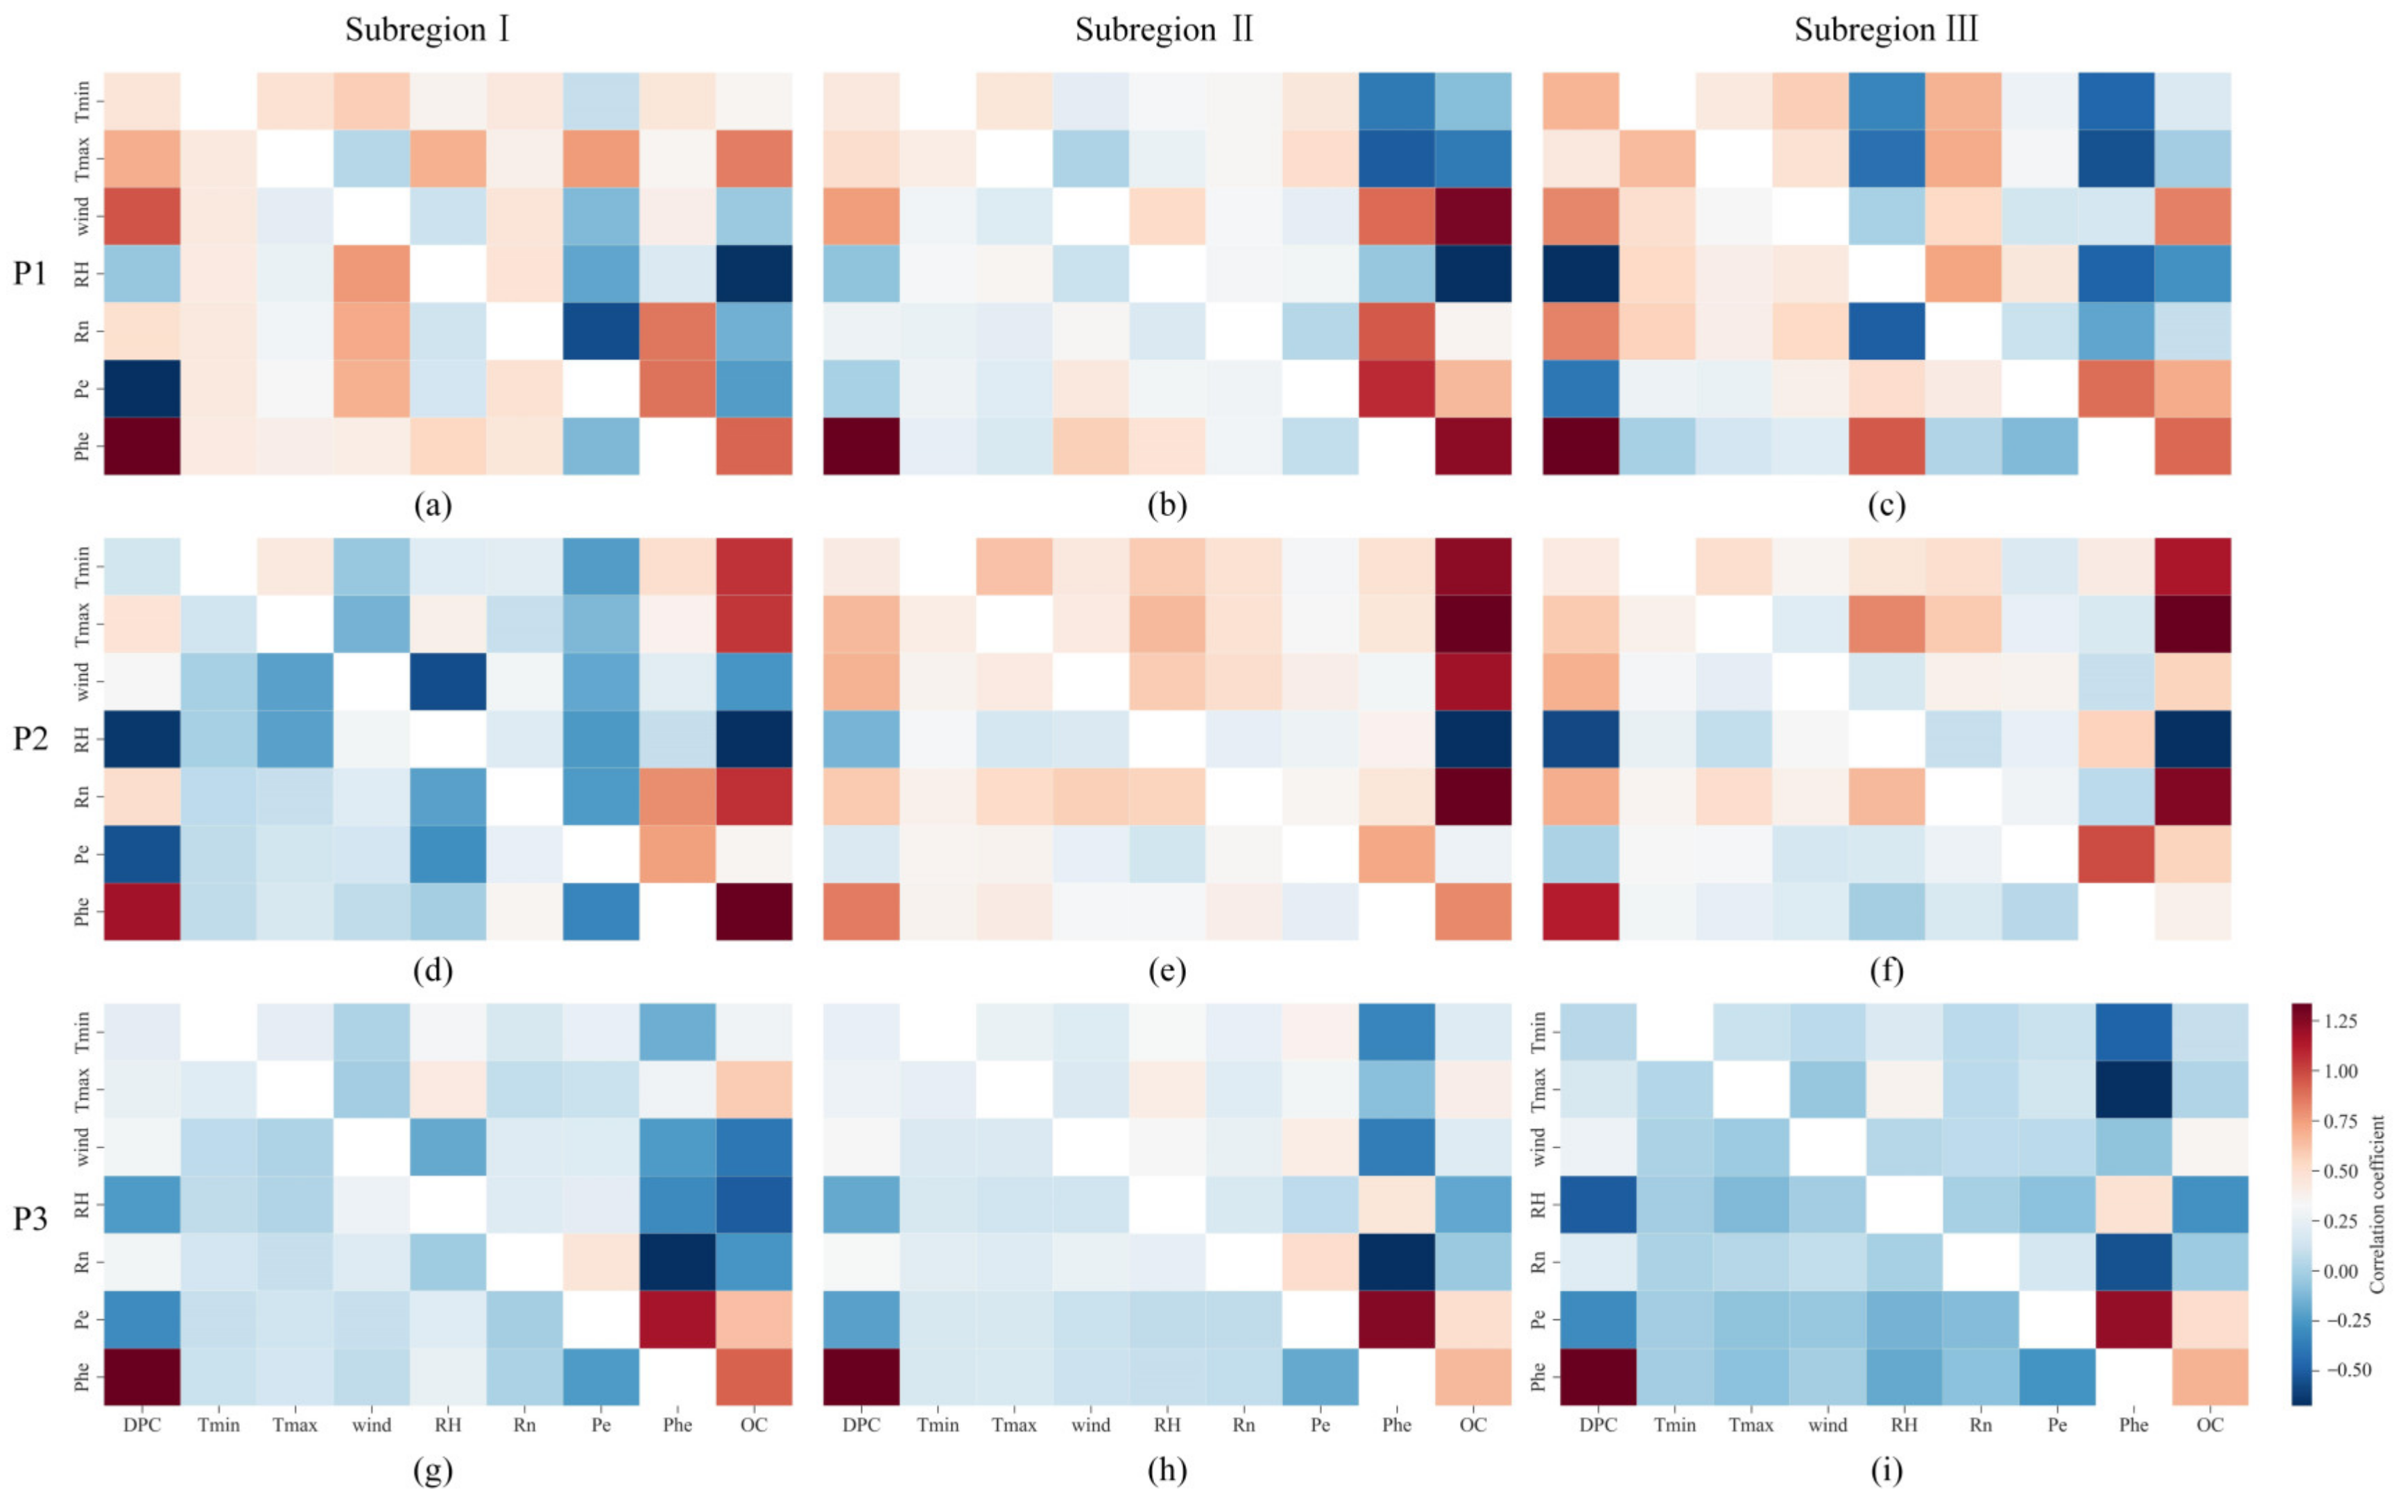
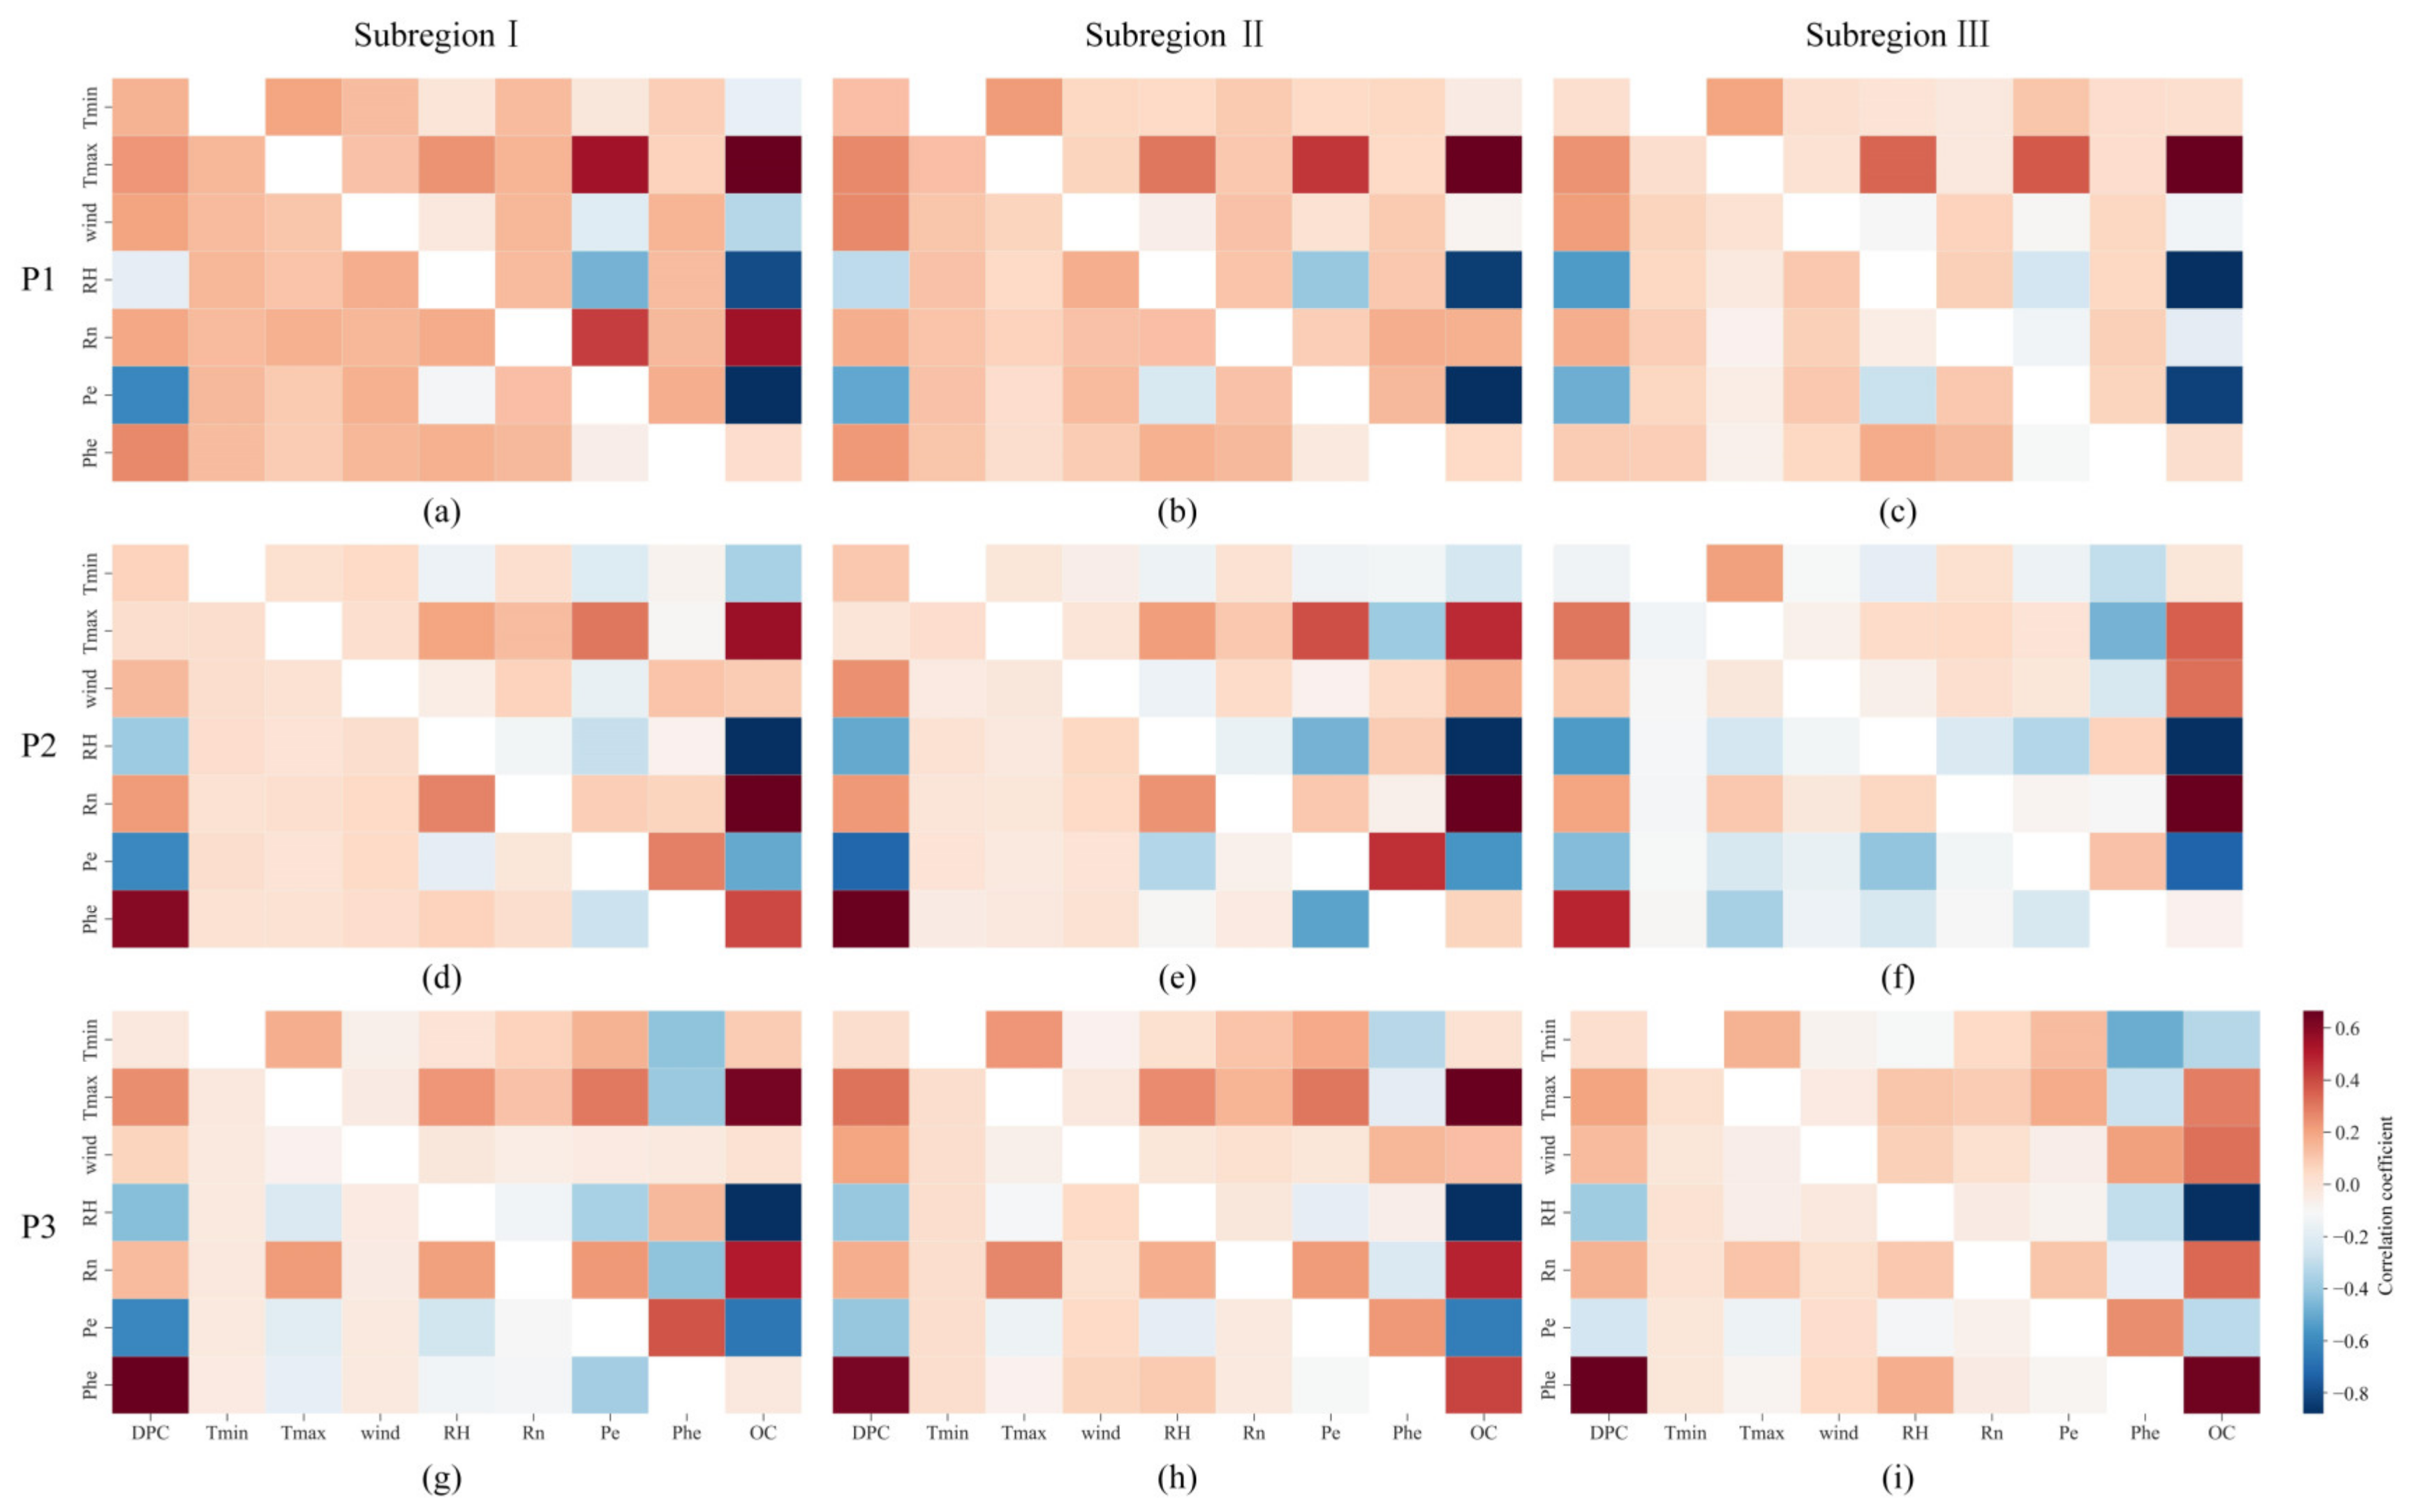
3.3.1. Partial Correlation Analysis

To compare the magnitude of correlations between IR and the respective variables in different growth stages and growing regions of winter wheat, we calculated the average partial correlation coefficients of various factors considering the I, II and III subregions and P1, P2 and P3 stages.
IR had significant correlations with all factors in the spatial distribution (Table 1). The absolute magnitudes of correlations exhibited the following order: Phe > wind > Pe > RH > Tmax > Tmin > Rn in the P1 stage, Phe > RH > Rn > wind > Pe > Tmax > Tmin in the P2 stage and Phe > RH > Pe > wind > Rn > Tmax > Tmin in the P3 stage. Regarding regions, the order was as follows: Phe > Pe > RH > wind > Tmax > Rn > Tmin in subregion I, Phe > RH > wind > Pe > Tmax > Rn > Tmin in subregion II and Phe > RH > wind > Rn > Pe > Tmin > Tmax in subregion III.
In terms of interannual variation, IR had significant correlations with all factors except Tmin (Table 2). The absolute magnitudes of the correlations exhibited the following order: Pe > RH > wind > Rn > Phe > Tmax > Tmin in the P1 stage, Phe > Pe > RH > wind > Rn > Tmax > Tmin in the P2 stage and Phe > Pe > RH > wind > Rn > Tmax > Tmin in the P3 stage. Regarding regions, the order was as follows: Pe > Phe > RH > wind > Rn > Tmax > Tmin in subregion I, Pe > RH > Phe > wind > Rn > Tmax > Tmin in subregion II and Pe > RH > wind > Rn > Phe > Tmax > Tmin in subregion III.
Overall, the dominant drivers of IR were Phe, Pe and RH, both in terms of spatial distribution and interannual variation. IR exhibited significantly negative correlations with Pe and RH but positive correlations with Tmin, Tmax, wind, Rn and Phe.

3.3.2. Path Analysis

Given the complex dynamics of climate and phenological changes of winter wheat, we found it necessary to analyze the effects of various factors, rather than a single factor, on IR. Therefore, path analysis was used to evaluate the indirect effects of each factor on IR (Figure 5 and Figure 6).
Regarding spatial distribution (Figure 5), in the P1 stage, RH, Phe and Pe exerted the largest total effect in subregions I, II and III, respectively; the corresponding factors that exerted the largest indirect effects were Pe, Phe and Phe, respectively. In the P2 stage, Phe, RH and Tmax exerted the largest total effect in subregions I, II and III, respectively, whereas Pe, Rn and RH exerted the largest indirect effects, respectively. In the P3 stage, Phe exerted the largest total effect in subregions I, II and III; the corresponding factor with the largest indirect effect was Pe. In general, Phe exerted the largest indirect effect on IR. Tmin, Tmax, wind, RH and Rn mainly limited IR through Phe, whereas the indirect effects of Pe on IR through Phe were reflected in the facilitating role.
Regarding interannual variation (Figure 6), in the P1 stage, Pe, Pe and RH exerted the largest total effect in subregions I, II and III, respectively. RH, RH and Pe exerted the largest indirect effects in subregions I, II and III, respectively. In the P2 stage, RH exerted the largest total effect in subregions I, II and III and Pe exerted the largest indirect effect. In the P3 stage, RH exerted the largest total effect in subregions I, II and III; Pe, Pe and Phe exerted the largest indirect effects in subregions I, II and III, respectively. During the entire growth period of winter wheat, RH, Pe and Tmin limited IR, whereas the other factors promoted it. Although the direct effect of Tmax on IR was small, its overall effect was large, which resulted primarily from the indirect effect of Tmax on IR through RH and Pe; this promoted IR. Notably, the overall effects of Tmax and Tmin on IR were opposite, probably because an increase in Tmax led to a decrease in RH and Pe, thus, increasing IR, whereas Tmin exerted an opposite effect.

3.4. Relative Contribution

Relative contribution rates for the factors to the IR of winter wheat in 2000–2020 are presented in Figure 7. The factors with the highest average contribution rate in the three subregions were Pe (36.4%) and RH (27.2%) in the P1 stage; Phe (41.1%), Pe (19.3%) and RH (14.1%) in the P2 stage; and Phe (44.7%), Pe (18.8%) and RH (13.5%) in the P3 stage. RH and Pe negatively contributed to IR in the study area during the entire growth period of winter wheat, which reduced IR. By contrast, Tmin, Tmax, wind, Rn and Phe contributed positively, which increased IR. The contribution rates of RH, Tmax, wind and Phe increased from the south to the north of the study area, whereas that of Pe decreased in the same direction. With the growth and development of winter wheat, the contribution rates of wind, RH and Pe decreased gradually, whereas that of Phe increased. These results indicated that IR in the study area was mainly affected by Phe, Pe and RH. Pe and RH limited the increase in IR, whereas Phe promoted it. The contribution of each factor to the IR of winter wheat varied by growing area.

4. Discussion

No significant trend was noted in the IR of winter wheat in 2000–2020; this finding is consistent with that of [13]. However, Liu et al. [28] suggested that the crop water requirement of winter wheat in the North China Plain exhibited a decreasing trend between 1950 and 2000. Thus, the effect of climate change on IR may vary over time. In addition, Pe may exert a strong effect on IR. Liu et al. [8] predicted an increasing trend in the IR of wheat and maize in the Yellow River basin under future climate change. Therefore, the variability and related determinants of IR are dependent on the growing region of crops. These are associated with not only regional climatic conditions and geomorphological background but also the complex mathematical relationships between climate factors and IR [29].
In this study, most factors (e.g., Tmin, Tmax, wind, Rn and Phe) had positive correlations with the IR of winter wheat, whereas RH and Pe had negative correlations with IR. However, because RH and Pe exhibited a decreasing trend and Tmin, Tmax and Phe showed an increasing trend in 2000–2020, all these led to an increase in IR. The trend in the IR of winter wheat was not significant, which might be because of the significant decreases in wind and Rn. Atmospheric circulation is responsible for the decrease in wind; the latitudinal circulation is enhanced and meridional circulation is weakened in Asia [30]. Rising temperature may reduce atmospheric pressure at the near-surface level and decrease temperature differences and pressure gradients between land and adjacent oceans [31]. This, in addition to the effects of human activities, can reduce the strength of atmospheric circulation and wind in China. The reduction in wind decreases the intensity of surface–atmosphere energy exchange. The decrease in radiation results from an increase in aerosol concentration, which inhibits stomatal opening and reduces plant transpiration [32]. Therefore, wind and Rn exert limiting effects on IR. Water deficit was most severe in the P2 stage. The PoE of IR increased gradually from the south to the north of the plain, mainly because Pe was smaller and Phe was longer in the north. Therefore, targeted measures should be taken to replenish water in critical periods and regions in a timely manner to ensure high crop growth under optimal water conditions.
The independent variables not only affected IR directly but also indirectly by influencing other independent variables. The increase in Tmax resulted in an increase in the IR of winter wheat, mainly by reducing RH and Pe and providing energy to the evaporation surface; however, the contribution of Tmax to IR was relatively low and it was offset by the changes due to other factors that limited IR in 2000–2020. We found that IR responded differently to Tmax and Tmin in terms of interannual variability and the total correlation coefficient between Tmax and IR was positive, whereas that between Tmin and IR was negative. This might be because an increase in Tmin affects the changes in IR due to other factors, thus, exerting an indirect effect on IR. Moreover, increases in both Tmin and Tmax shortened Phe, which reduced the effects of climate change (warming) to some extent. In addition, the results of the correlation analysis performed in our study revealed that the effect of temperature on IR was smaller than that of Phe, Pe, RH, Rn and wind. This suggests that the overall effect of climate warming on IR in the study area was relatively limited. The reduced importance of temperature shows that global warming may not necessarily lead to an increase in atmospheric evaporation demand [33]. This further suggests that a water shortage in China may be more likely to be attributable to a population increase and human activities than from climate change.
The effects of each factor on IR varied across the growth stages and growing regions of winter wheat. Phe, Pe and RH contributed the most to IR during the entire growth period of winter wheat. Pe and RH exerted the largest effects on IR in the P1 stage, whereas Phe exerted the largest effect in the P2 and P3 stages. The effect of Pe decreased gradually from the south to the north of the North China Plain, whereas that of RH and Phe correspondingly gradually increased.
This study has some limitations. The effects of soil type, altitude, crop area and human activities on IR were not assessed. To understand how to mitigate or avoid the negative effects of climate change, these aspects should be probed in future studies.

5. Conclusions

Using the water balance model and contribution, partial correlation and path analyses, we assessed the spatiotemporal variability in the IR of winter wheat in the North China Plain between 2000 and 2020. In addition, the characteristics of climatic and phenological changes and their effects on IR were studied. Tmin, Tmax and Phe exhibited an increasing trend in 2000–2020, but the changes were not significant. Conversely, wind, RH, Rn and Pe exhibited a decreasing trend; however, only wind and Rn decreased significantly. IR exhibited no significant trend, but it was strongly associated with significant decreases in wind and Rn. The multiyear average value of IR was 302.3 mm, which showed an increasing trend from the south to the north of the North China Plain. The PoE of IR increased from the south to north, with the highest probability of a water deficit noted in the P2 stage. Phe, Pe and RH exhibited the highest correlation with IR, both in terms of spatial distribution and interannual variation. However, the degree to which the factors affected IR varied across the growth stages and growing regions of winter wheat. Each factor exerted not only direct but also complex indirect effects on IR. An increase in temperature affected the change in Phe and, thus, limited the increase in IR; hence, the overall effect of climate warming on IR was relatively limited in the study area. The factors with the highest contribution to IR in the North China Plain were Phe, Pe and RH. Pe and RH had the largest contribution in the P1 stage, whereas Phe had the largest contribution in the P2 and P3 stages. Phe promoted IR, whereas Pe and RH limited it. The contribution of Pe decreased gradually from the south to the north of the North China Plain, whereas that of RH and Phe increased.

Author Contributions

N.W.: Conceptualization, Methodology, Formal analysis, Writing—Original Draft. J.W.: Data Curation, Visualization. Y.G.: Resources. K.J.: Validation. X.M.: Writing—Review and Editing, Funding acquisition. All authors have read and agreed to the published version of the manuscript.

Funding

This work was supported by the National Natural Science Foundation of China [grant numbers: 52179048].

Institutional Review Board Statement

Not applicable.

Informed Consent Statement

Not applicable.

Data Availability Statement

Meteorological data: “China Meteorological Information Center” at http://data.cma.cn/; Remote sensing data: “MOD09A1 were obtained from google earth engine” at https://developers.google.com/earth-engine/datasets/catalog/MODIS_061_MOD09A1?hl=en (accessed on 25 February 2022).

Conflicts of Interest

The authors declare no conflict of interest.

References

  1. Li, R.; Geng, S. Impacts of Climate Change on Agriculture and Adaptive Strategies in China. J. Integr. Agr. 2013, 12, 1402–1408. [Google Scholar] [CrossRef]
  2. Zeng, R.; Yao, F.; Zhang, S.; Yang, S.; Bai, Y.; Zhang, J.; Wang, J.; Wang, X. Assessing the effects of precipitation and irrigation on winter wheat yield and water productivity in North China Plain. Agri. Water Manag. 2021, 256, 107063. [Google Scholar] [CrossRef]
  3. Lu, C.; Fan, L. Winter wheat yield potentials and yield gaps in the North China Plain. Field Crops Res. 2013, 143, 98–105. [Google Scholar] [CrossRef] [Green Version]
  4. Sun, S.; Wu, P.; Wang, Y.; Zhao, X.; Liu, J.; Zhang, X. The impacts of interannual climate variability and agricultural inputs on water footprint of crop production in an irrigation district of China. Sci. Total Environ. 2013, 444, 498–507. [Google Scholar] [CrossRef]
  5. Menzel, L.; Bürger, G. Climate change scenarios and runoff response in the Mulde catchment (Southern Elbe, Germany). J. Hydrol. 2002, 267, 53–64. [Google Scholar] [CrossRef]
  6. Groisman, P.Y.; Karl, T.R.; Easterling, D.R.; Knight, R.W.; Jamason, P.F.; Hennessy, K.J.; Suppiah, R.; Page, C.M.; Wibig, J.; Fortuniak, K.; et al. Changes in the Probability of Heavy Precipitation: Important Indicators of Climatic Change. Clim. Chang. 1999, 42, 243–283. [Google Scholar] [CrossRef]
  7. Chen, X.; Qi, Z.; Gui, D.; Gu, Z.; Ma, L.; Zeng, F.; Li, L. Simulating impacts of climate change on cotton yield and water requirement using RZWQM2. Agric. Water Manag. 2019, 222, 231–241. [Google Scholar] [CrossRef]
  8. Liu, Y.; Lin, Y.; Huo, Z.; Zhang, C.; Wang, C.; Xue, J.; Huang, G. Spatio-temporal variation of irrigation water requirements for wheat and maize in the Yellow River Basin, China, 1974–2017. Agric. Water Manag. 2022, 262, 107451. [Google Scholar] [CrossRef]
  9. Luo, W.; Chen, M.; Kang, Y.; Li, W.; Li, D.; Cui, Y.; Khan, S.; Luo, Y. Analysis of crop water requirements and irrigation demands for rice: Implications for increasing effective rainfall. Agric. Water Manag. 2022, 260, 107285. [Google Scholar] [CrossRef]
  10. Xu, C.; Lu, C.; Sun, Q. Impact of climate change on irrigation water requirement of wheat growth—A case study of the Beijing-Tianjin-Hebei region in China. Urban Clim. 2021, 39, 100971. [Google Scholar] [CrossRef]
  11. Ruan, H.; Yu, J.; Wang, P.; Wang, T. Increased crop water requirements have exacerbated water stress in the arid transboundary rivers of Central Asia. Sci. Total Environ. 2020, 713, 136585. [Google Scholar] [CrossRef]
  12. Xu, H.; Tian, Z.; He, X.; Wang, J.; Sun, L.; Fischer, G.; Fan, D.; Zhong, H.; Wu, W.; Pope, E.; et al. Future increases in irrigation water requirement challenge the water-food nexus in the northeast farming region of China. Agric. Water Manag. 2019, 213, 594–604. [Google Scholar] [CrossRef]
  13. Wu, D.; Fang, S.; Li, X.; He, D.; Zhu, Y.; Yang, Z.; Xu, J.; Wu, Y. Spatial-temporal variation in irrigation water requirement for the winter wheat-summer maize rotation system since the 1980s on the North China Plain. Agric. Water Manag. 2019, 214, 78–86. [Google Scholar] [CrossRef]
  14. Yang, X.; Jin, X.; Chu, Q.; Pacenka, S.; Steenhuis, T.S. Impact of climate variation from 1965 to 2016 on cotton water requirements in North China Plain. Agric. Water Manag. 2021, 243, 106502. [Google Scholar] [CrossRef]
  15. Liu, W.; Yang, H.; Tang, Q.; Liu, X. Understanding the Water–Food–Energy Nexus for Supporting Sustainable Food Production and Conserving Hydropower Potential in China. Front. Environ. Sci. 2019, 7, 50. [Google Scholar] [CrossRef]
  16. Jia, K.; Yang, Y.; Dong, G.; Zhang, C.; Lang, T. Variation and determining factor of winter wheat water requirements under climate change. Agric. Water Manag. 2021, 254, 106967. [Google Scholar] [CrossRef]
  17. Cao, G.; Zheng, C.; Scanlon, B.R.; Liu, J.; Li, W. Use of flow modeling to assess sustainability of groundwater resources in the North China Plain. Water Resour. Res. 2013, 49, 159–175. [Google Scholar] [CrossRef]
  18. Chen, J.; Jönsson, P.; Tamura, M.; Gu, Z.; Matsushita, B.; Eklundh, L. A simple method for reconstructing a high-quality NDVI time-series data set based on the Savitzky–Golay filter. Remote Sens. Environ. 2004, 91, 332–344. [Google Scholar] [CrossRef]
  19. Ren, S.; Qin, Q.; Ren, H. Contrasting wheat phenological responses to climate change in global scale. Sci. Total Environ. 2019, 665, 620–631. [Google Scholar] [CrossRef]
  20. Döll, P.; Siebert, S. Global modeling of irrigation water requirements. Water Resour. Res. 2002, 38, 8-1–8-10. [Google Scholar] [CrossRef]
  21. Allen, R.G.; Pereira, L.S.; Raes, D.; Smith, M. Crop Evapotranspiration-Guidelines for Computing Crop Water Requirements; Irrigation and Drainage Paper No. 56; Food and Agriculture Organization of the United Nations: Rome, Italy, 1998. [Google Scholar]
  22. Liu, Y.; Luo, Y. A consolidated evaluation of the FAO-56 dual crop coefficient approach using the lysimeter data in the North China Plain. Agric. Water Manag. 2010, 97, 31–40. [Google Scholar] [CrossRef]
  23. Zhang, B.; Liu, Y.; Xu, D.; Zhao, N.; Lei, B.; Rosa, R.D.; Paredes, P.; Paço, T.A.; Pereira, L.S. The dual crop coefficient approach to estimate and partitioning evapotranspiration of the winter wheat–summer maize crop sequence in North China Plain. Irrig. Sci. 2013, 31, 1303–1316. [Google Scholar] [CrossRef]
  24. Liu, Y.; Chen, Q.; Ge, Q.; Dai, J. Spatiotemporal differentiation of changes in wheat phenology in China under climate change from 1981 to 2010. Sci. China Earth Sci. 2018, 61, 1088–1097. [Google Scholar] [CrossRef]
  25. Lobell, D.B.; Ortiz-Monasterio, J.I.; Asner, G.P.; Matson, P.A.; Naylor, R.L.; Falcon, W.P. Analysis of wheat yield and climatic trends in Mexico. Field Crops Res. 2005, 94, 250–256. [Google Scholar] [CrossRef]
  26. Gao, J.; Yang, X.; Zheng, B.; Liu, Z.; Zhao, J.; Sun, S.; Li, K.; Dong, C. Effects of climate change on the extension of the potential double cropping region and crop water requirements in Northern China. Agric. For. Meteorol. 2019, 268, 146–155. [Google Scholar] [CrossRef]
  27. Li, C.; Wu, P.T.; Li, X.L.; Zhou, T.W.; Sun, S.K.; Wang, Y.B.; Luan, X.B.; Yu, X. Spatial and temporal evolution of climatic factors and its impacts on potential evapotranspiration in Loess Plateau of Northern Shaanxi, China. Sci. Total Environ. 2017, 589, 165–172. [Google Scholar] [CrossRef]
  28. Liu, X.Y.; Li, Y.Z.; Hao, W.P. Trend and causes of water requirement of main crops in North China in recent 50 years. Trans. Chin. Soc. Agric. Eng. 2005, 21, 155–159. [Google Scholar]
  29. Yin, Y.; Wu, S.; Dai, E. Determining factors in potential evapotranspiration changes over China in the period 1971–2008. Chin. Sci. Bull. 2010, 55, 3329–3337. [Google Scholar] [CrossRef]
  30. Jiang, Y.; Luo, Y.; Zhao, Z.C. Review of research on wind resources changes in China and in the world. Sci. Technol. Rev. 2009, 27, 96–104. (In Chinese) [Google Scholar]
  31. Guo, H.; Xu, M.; Hu, Q. Changes in near-surface wind speed in China: 1969–2005. Int. J. Climatol. 2011, 31, 349–358. [Google Scholar] [CrossRef]
  32. Liu, C.; Liu, X.; Zheng, H.; Zeng, Y. Change of the solar radiation and its causes in the Haihe River Basin and surrounding areas. J. Geogr. Sci. 2010, 20, 569–580. [Google Scholar] [CrossRef]
  33. Fan, Z.-X.; Thomas, A. Decadal changes of reference crop evapotranspiration attribution: Spatial and temporal variability over China 1960–2011. J. Hydrol. 2018, 560, 461–470. [Google Scholar] [CrossRef]
Figure 1. Study area: the location of the meteorological stations (a) and crop regions of winter wheat (b) in the North China Plain.
Agronomy 12 01987 g001
Figure 2. Trends in Tmin (a), Tmax (b), wind (c), RH (d), Rn (e), Pe (f), Phe (g) and IR (h) and each impact factor in 2000–2020 (p < 0.05 indicates significance; p < 0.01 indicates high significance).
Agronomy 12 01987 g002
Figure 3. The average (ac) and trends (df) distribution of the irrigation water requirements in P1 (a,d), P2 (b,e) and P3 (c,f) stages of winter wheat from 2000 to 2020.
Agronomy 12 01987 g003
Figure 4. Probability of exceedance (%) of irrigation requirements (IR) in P1 (a), P2 (b) and P3 (c) stages of winter wheat from 2000 to 2020 (negative value of IR indicates no irrigation demands).
Agronomy 12 01987 g004
Figure 5. Each factor on the path analysis chart for the irrigation water requirements of winter wheat in spatial distribution in P1 (ac), P2 (df) and P3 (gi) stages in subregions I (a,d,g), II (b,e,h) and III (c,f,i) (DPC represents the direct path coefficients, OC represents the overall correlation coefficients and the rest are indirect path coefficients).
Agronomy 12 01987 g005
Figure 6. Interannual variation in each factor on the path analysis chart for the irrigation water requirement of winter wheat in P1 (ac), P2 (df) and P3 (gi) stages in subregions I (a,d,g), II (b,e,h) and III (c,f,i) (DPC represents the direct path coefficients, OC represents the overall correlation coefficients and the rest are indirect path coefficients).
Agronomy 12 01987 g006
Figure 7. Average relative contribution of each factor to the irrigation water demand in P1, P2 and P3 stages of winter wheat in subregions I (a), II (b) and III (c).
Agronomy 12 01987 g007
Table 1. Partial correlation coefficient and significance between IR and various factors in spatial distribution in P1, P2 and P3 stages of winter wheat.
Subregion ISubregion IISubregion III
FactorsP1P2P3P1P2P3P1P2P3
Tmin0.217 **0.209 **0.408 **0.486 **0.222 **0.282 **0.587 **0.381 **0.260 **
Tmax0.697 **0.599 **0.455 **0.556 **0.704 **0.344 **0.269 **0.514 **0.400 **
wind0.887 **0.537 **0.694 **0.905 **0.885 **0.695 **0.941 **0.841 **0.797 **
RH−0.750 **−0.825 **−0.907 **−0.885 **−0.930 **−0.918 **−0.932 **−0.972 **−0.906 **
Rn0.165 *0.778 **0.702 **−0.157 *0.805 **0.608 **0.793 **0.821 **0.813 **
Pe−0.946 **−0.843 **−0.895 **−0.755 **−0.595 **−0.797 **−0.925 **−0.638 **−0.751 **
Phe0.931 **0.961 **0.989 **0.935 **0.947 **0.976 **0.940 **0.948 **0.982 **
Note: * indicates significance (p < 0.05); ** indicates high significance (p < 0.01).
Table 2. Partial correlation coefficients and significance of interannual variation between IR and various factors in P1, P2 and P3 stages of winter wheat.
Subregion ISubregion IISubregion III
FactorsP1P2P3P1P2P3P1P2P3
Tmin0.1360.3280.0420.0530.480−0.006−0.089−0.1280.080
Tmax0.612 *0.1060.674 **0.539 *0.0500.765 **0.3480.813 **0.661 *
wind0.711 **0.753 **0.804 **0.797 **0.777 **0.879 **0.841 **0.792 **0.842 **
RH−0.924 **−0.888 **−0.939 **−0.910 **−0.753 **−0.966 **−0.886 **−0.879 **−0.964 **
Rn0.651 *0.743 **0.688 **0.617 *0.738 **0.772 **0.552 *0.831 **0.926 **
Pe−0.991 **−0.950 **−0.986 **−0.974 **−0.914 **−0.986 **−0.955 **−0.893 **−0.953 **
Phe0.901 **0.974 **0.989 **0.679 **0.942 **0.993 **0.1020.964 **0.988 **
Note: * indicates significance (p < 0.05); ** indicates high significance (p < 0.01).
Publisher’s Note: MDPI stays neutral with regard to jurisdictional claims in published maps and institutional affiliations.

