Article

Bacterial Community and Chemical Composition of Mixed Fresh Cactus Forage and Buffel Grass Hay during Aerobic Exposure

1
Department of Animal Science, Federal University of Paraíba, Areia 58397-000, Paraíba, Brazil
2
Brazilian Agricultural Research Corporation, EMBRAPA Semiarid, Petrolina 56302-970, Pernambuco, Brazil
3
National Institute of Semiarid, INSA, Campina Grande 58400-240, Paraíba, Brazil
4
Department of Animal Science, Federal University of Sao Francisco Valley, Petrolina 56304-917, Pernambuco, Brazil
5
Department of Animal Science, Federal University of Maranhão, Chapadinha 65500-000, Maranhão, Brazil
*
Author to whom correspondence should be addressed.
Agronomy 2022, 12(8), 1927; https://doi.org/10.3390/agronomy12081927
Submission received: 1 June 2022 / Revised: 12 August 2022 / Accepted: 13 August 2022 / Published: 16 August 2022

Abstract

:
The chemical composition of cactus forage becomes a favorable culture medium for accelerated microbial activity when exposed to air, as it contains high content of non-fiber carbohydrates and water. Thus, the aim of this study was to evaluate the bacterial community dynamics of different mixtures, using fresh forage of cactus and buffel grass hay as a function of the period of exposure to air. The experimental design used was a 5 × 5 factorial completely randomized (five levels of cactus forage × five times of exposure to air), with five replications. The peak of Escherichia coli population growth was after 16.06 h of exposure to air, observed in treatments of 90% and 100% cactus forage. There was an increase in microbial richness and uniformity of all treatments after six hours. The most abundant genera were Weissella, Lactobacillus, Bacteroides, Pseudomonas, Sphingobacterium, and Sphingomonas. The diet with 100% cactus forage showed a predominance of Weissella, Lactobacillus, and Leuconostoc. With 20% cactus forage, there was a greater apparent abundance of Pseudomonas, Sphingomonas, and Sphingobacterium. Aerobic exposure of mixtures of cactus forage with buffel grass hay increases the proliferation of microorganisms with pathogenic potential in the diet. Aerobic exposure of mixtures of cactus forage with buffel grass hay increases the proliferation of microorganisms with pathogenic potential in the diet. Therefore, an exposure period of fewer than six hours with 20% cactus forage is recommended to minimize levels of E. coli. Avoiding negative effects of the multiplication of pathogenic microorganisms on animal and human health.

1. Introduction

Cactus forage is extremely important for animal feed in arid and semi-arid regions. In periods of food shortage, large proportions of this forage are fed to ruminants. Some studies indicate that large amounts of cactus forage in the diet can cause digestive disorders, and its supply to ruminants as the only forage source is not recommended [1,2]. However, other studies have shown that cactus forage can be used as a basis for feeding ruminants without negative effects on the animal [3,4,5].
Several factors can be associated with these nutritional disorders, such as low dry matter content, high non-fiber carbohydrate content, and the presence of oxalate. However, a factor that can also lead to these nutritional disorders is the post-harvest management of cactus forage. Harvest management also influences cactus forage quality for animal nutrition, such as the poor sanitary quality of the food before being offered to the animals, and the time of exposure to air after harvesting [6].
The chemical composition of cactus forage, when cut, becomes a favorable culture medium for accelerated microbial activity when exposed to air, as it contains high content of non-fiber carbohydrates (640–710 g/kg DM), total digestible nutrients (460–620 g/kg DM), mineral matter (120–250 g/kg DM), and moisture (850–900 g/kg DM), in addition to the presence of buffering substances (oxalic, malic, citric, malonic, succinic, and tartaric acids) [7,8,9], which prevent the sudden drop in pH at ensiling, keeping the environment conducive to microbial activity.
There is a great number of microorganisms in fresh plants, whether epiphytic and/or developed in the harvest and post-harvest process, as forage contamination can occur at any point in the production technology applied [10]. Thus, contamination by microorganisms can occur during feeding, with multiplication occurring when the material is exposed to oxygen for many hours [6,11,12].
The interaction of microorganisms with food determines the microbial activity in the fresh forage. Many forages are excellent media for the development of different microorganisms and, if conditions are favorable for microbial growth, will promote chemical and sensory changes in these foods [13].
Thus, the nutritional composition of the diet and time of exposure of fresh foods to air have a significant influence on the incidence of different bacteria in the food and in the gastrointestinal tract of ruminants [5,14,15].
Our hypothesis is that high levels of cactus forage exposed to air can promote the growth of some bacteria which are related to nutritional disorders in sheep and this effect may occur a few hours after air exposure. Thus, the aim of this study was to evaluate the bacterial community dynamics of the different mixtures, using fresh forage of cactus and buffel grass hay as a function of the period of exposure to air.

2. Materials and Methods

2.1. Local Conditions

The experiment was conducted in September 2020 in the Forage Laboratory of the Center for Agricultural Sciences belonging to the Federal University of Paraíba (UFPB), Campus II, located in the municipality of Areia, state of Paraíba, (6°57′46″ S, 35°41′31″ W), and in the Environmental Microbiology Laboratory, National Institute of the Semi-Arid (INSA), located in Campina Grande, state of Paraíba (7°16′36.6″ S, 35°57′58.6″ W).

2.2. Treatments and Experimental Design

The experimental design used was completely randomized, in a 5 × 5 factorial arrangement (five levels of cactus forage × five exposure times), with 5 replications, 25 experimental units. Thus, the treatments were: 20% cactus forage and 80% buffel grass hay, 60% cactus forage and 40% buffel grass hay; 80% cactus forage and 20% buffel grass hay; 90% cactus forage and 10% buffel grass hay; and 100% cactus forage a fresh forage basis. Each experimental treatment was exposed to air for 0, 3, 6, 12, and 24 h.
Cactus forage of the Palmepa-PB1 variety (Nopalea cochenillifera Salm Dyck), in fresh form, was chopped in a stationary forage machine to particles of approximately 2 cm2. After weighing cactus forage and hay, forages, approximately 200 g, were manually and without compression homogenized and placed in aluminum (length: 27 cm; width: 18 cm; height: 3.5 cm) trays according to the treatment and repetition. Samples were then placed in a bacteriological incubator at a controlled temperature of 30 °C for 24 h air exposure. The temperature of 30 °C was chosen because it represents the average temperature in the summer season in the semi-arid region of the state of Paraíba, Brazil.
Cactus forage came from the experimental area of the Paraíba Company for Research, Rural Extension and Land Regularization–EMPAER in Alagoinha (south latitude 6°57′00″; longitude 35°32′42″, west of Greenwich, and at an altitude of around 133 m), state of Paraíba, Brazil. Cactus forage was planted with a density of 100,000 plants ha−1 spaced in a single row with 1.5 m between rows and 15 plants per linear meter in August 2018 with the respective basal fertilization level: manure cattle (30 tons/hectare) and ash (resulting from wood combustion) (16 tons/hectare). At the beginning of the rainy season in 2020, in March, the cactus forage crop was fertilized with an additional 10 tons of cattle manure ha−1. The cactus forage was cut in the second year of establishment, in the vegetative phase, from the second cladode, leaving the primary cladode.
Buffel grass (Cenchrus ciliaris L.) hay was harvested manually at the flowering stage, then ground to 2 cm particles using a stationary chopper. The buffel grass pasture was located on private property in the municipality of São José dos Cordeiros, state of Paraíba, Brazil (latitude: 07°38′88″ S; longitude: 36°79′13″). The municipality is part of the micro-region of Western Cariri and has a semi-arid climate. The chemical composition of cactus forage and buffel grass hay is listed in Table 1.

2.3. Chemical Analysis

The chemical analysis was carried out in the Food Laboratory of the National Institute of the Semi-Arid (INSA), located in the municipality of Campina Grande, state of Paraíba, and in the Forage Laboratory, belonging to the CCA-UFPB, Areia.
Samples for chemical analysis of cactus forage and hay were dried in a forced ventilation oven at 55 °C for 72 h (Method INCT-CA G-001/1), and later ground in a Wiley knife mill (Wiley Mill, Arthur H. Thomas, PA, USA) with a 1 mm mesh sieve.
Composition analyses for dry matter (DM; Method 934.01), mineral matter (MM; Method 942.05), crude protein (CP; Method 954.01), ether extract (EE; Method 920.39), and lignin (Method 973.18) were carried out according to the Association of Official Analytical Chemists—AOAC (2016) [16].
Neutral detergent fiber (aNDFom) was determined using the ANKOM fiber analyzer (ANKOM200 Fiber Analyzer—ANKOM Technology Corporation, Fairport, NY, USA) with heat-stable α-amylase and sodium sulfite and correcting ash residue. Non-fiber carbohydrates (NFCs) were calculated by the equation NFC = 100 − (%CP + %EE + %Ash + %FDN), proposed by Sniffen et al. [17].
The forage buffering capacity (BC) was determined according to the methodology proposed by Playne and McDonald [18]. To determine the water-soluble carbohydrates (WSCs), the concentrated sulfuric acid method was used, as described by Dubois et al. [19], with adaptations from Corsato et al. [20].
For the determination of ammonia nitrogen (NH3-N) and pH in the samples, the methodology described by Bolsen et al. [21] was used.
During evaluation, the internal and surface temperatures of each experimental unit were measured using two digital immersion thermometers (Digital Thermometer PLUS Waterproof Skewer Type with Alarm −50 + 300 °C Division 1 °C Incoterm 9791.16.2.01). For surface temperature, the thermometer was placed horizontally on the surface of the forage mass (approximately 200 g), waiting for a few seconds for temperature stabilization. For checking the internal temperature, the thermometer was placed inside the sample mass, waiting for a few seconds for temperature stabilization.

2.4. Microbial Populations

Escherichia coli (E. coli) populations were quantified in plant material samples. After homogenization, 25 g of sample was taken manually with a sterile glove to avoid contamination at times 0, 3, 6, 12, and 24 h from all cactus forage levels. Samples were mixed with 225 mL of peptone water (a ratio of 16.1 g of the medium in 1 L of distilled water) and placed in Stomacher digital homogenizer (SL-299) for 1 mi. Afterward, the material was stored in a cooler with ice and sent to the Environmental Microbiology Laboratory at INSA for analysis.
Then, 1 mL of mixture was collected, and 9 mL of peptone water was added, following the technique of serial dilution up to 10−7, in duplicate. For each dilution, the spread-plate technique was used, where 100 μL aliquots were deposited on the surface of the culture medium, contained in Petri dishes, and spread with a Drigalski loop. Eosin Methylene Blue Agar (EMB Levine) was used, which inhibits the growth of Gram-positive bacteria and determines whether the bacterium is a lactose fermenter or not, where E. coli colonies are easily identifiable because they present metallic green color
After this step, plates were incubated in a bacteriological incubator (11 L, model 15 × 29 × 25CM(A-L-P) SSB-11L) at 35 °C (±0.5) for 24 h. Plates considered susceptible to the population were those with values between 30 and 300 colony-forming units (CFU) in a Petri dish.

2.5. Analysis of the Bacterial Community of Silages by 16s rRNA Marker Gene Sequencing (Metataxonomics) Using High-Throughput Sequencing

Metataxonomic analysis of bacterial communities was carried out at the Laboratory of Animal Products, belonging to the Animal Science Department of the CCA/UFPB. Analyses were carried out in three of the five treatments: the lowest cactus level (20% cactus forage and 80% buffel grass hay), intermediate level (60% cactus forage and 40% buffel grass hay), and the highest level (100% cactus forage). In addition, the three air exposure times were analyzed for bacterial communities: 0 (initial time), 6 (intermediate time), and 24 h (final time).
DNA of the samples was extracted using the commercial kit (Power Soil DNA Isolation kit, MoBio, Carlsbad, CA, USA), as recommended by the manufacturer. The V3–V4 region of the 16S rRNA gene was amplified by PCR (95 °C for 3 min, followed by 25 cycles at 95 °C for 30 s, 55 °C for 30 s, 72 °C for 30 s, and a final extension at 72 for 5 min) using 16S Amplicon PCR Forward Primer = 3′ TCGTCGGCAGCGTCAGATGTGTATAAGAGACAGCCTACGGGNGGCWGCAG ′ and 16S Amplicon PCR Reverse Primer = 5′-GTCTCGTGGGCTCGGAGATGTGTATAAGAGACAGGACTACHVGGGTATCTAATCC 3′. PCR reactions were run in triplicate, in a final volume of 25 µL containing 12.5 µL of 2× KAPA HiFi Hotstart ReadyMix, 5 µL of each primer, and 2.5 ng template DNA. Purified PCR products were quantified by fluorometry using Qubit 3.0 (Life Invitrogen).
The library was prepared using the adapters from the “Nextera XT Sample Prep Kit” (Illumina, CA, USA). Subsequently, DNA fragments were purified with Agencourt AMPure XP reagent (Beckman). After purification, the library was validated on the Fragment Analyzer (Agilent Technologies). Paired-end sequencing was performed on Miseq using the V2 kit for 2 × 250 bp (Illumina, CA, USA), according to the manufacturer’s recommendations.
Raw, demultiplexed, and paired sequences were processed by the QIIME 2 v.19.7 platform [22], where they were joined, selected by the maximum and minimum sizes (200–500 bp), Phred score minimum of 20, and de-replicated through VSEARCH [23]. Chimeric sequences were removed using UCHIME [24]. Clustering was performed using the de novo method, with 99% similarity between the centroid groups, in which it was possible to obtain the operational taxonomic unit (OTU).
The number of sequences per sample was normalized to 14,900 reads, in order to obtain the alpha (uniformity wealth) and beta (principal component analysis) ecological diversities, aligned by mafft [25], which were then used for the construction of the phylogenetic tree by FastTree2 [26]. Visualizations of the taxonomic composition, mainly relative abundance and alpha diversity, were performed by the phyloseq v.1.8.2 package [27] of the R v.3.5.7 program. The taxonomic classification was assigned using the naïve Bayes method on the trained database of SILVA v. 132 with 99% for the V3–V4 region [28].
Alpha diversity was evaluated by estimating the ecological indices of richness and evenness of the communities; Chao1 and Shannon were used, respectively. For beta diversity, we proceeded through the graphical view of the principal coordinate analysis (PcoA), being the unweighted qualitative metric of choice for constructing the basal distance matrix for the analysis, generated from UniFrac [29].

2.6. Statistical Analysis

E. coli population was log-transformed and presented as colony-forming units/g natural matter. Values obtained were tested by analysis of variance, along with the other variables (ANOVA), and the degrees of freedom were split from linear and polynomial regression for cactus forage levels and exposure time to air, at a significance level of 5% in the SAS® statistical software.
Alpha diversity indices were evaluated using the paired Kruskal–Wallis test, while the dissimilarity between treatments was checked by the permutational multivariate analysis of variance (PERMANOVA).

3. Results

There was an interaction between the levels of cactus forage and the time of exposure to air (p < 0.001) for internal temperature, surface temperature, pH, and E. coli count (Table 2).
The internal temperature (Figure 1A) reached its maximum peak at 32 °C, after 12 h of aerobic exposure. According to the slope of the curve, the aerobic exposure time resulted in a greater influence on the internal temperature than the cactus forage levels. In Figure 1A, a higher temperature was observed at the concentration of 46.66% cactus forage. At the highest levels of cactus forage (80 and 100%), lower internal temperatures were found. The maximum surface temperature was 31 °C (Figure 1B) after 11 h of aerobic exposure, when there was 41.21% cactus forage. There was a quadratic effect of both cactus forage levels and air exposure time on pH values.
The maximum pH (6.95) was observed at a concentration of 35.72% cactus forage and air exposure time of 3.14 h (Figure 2).
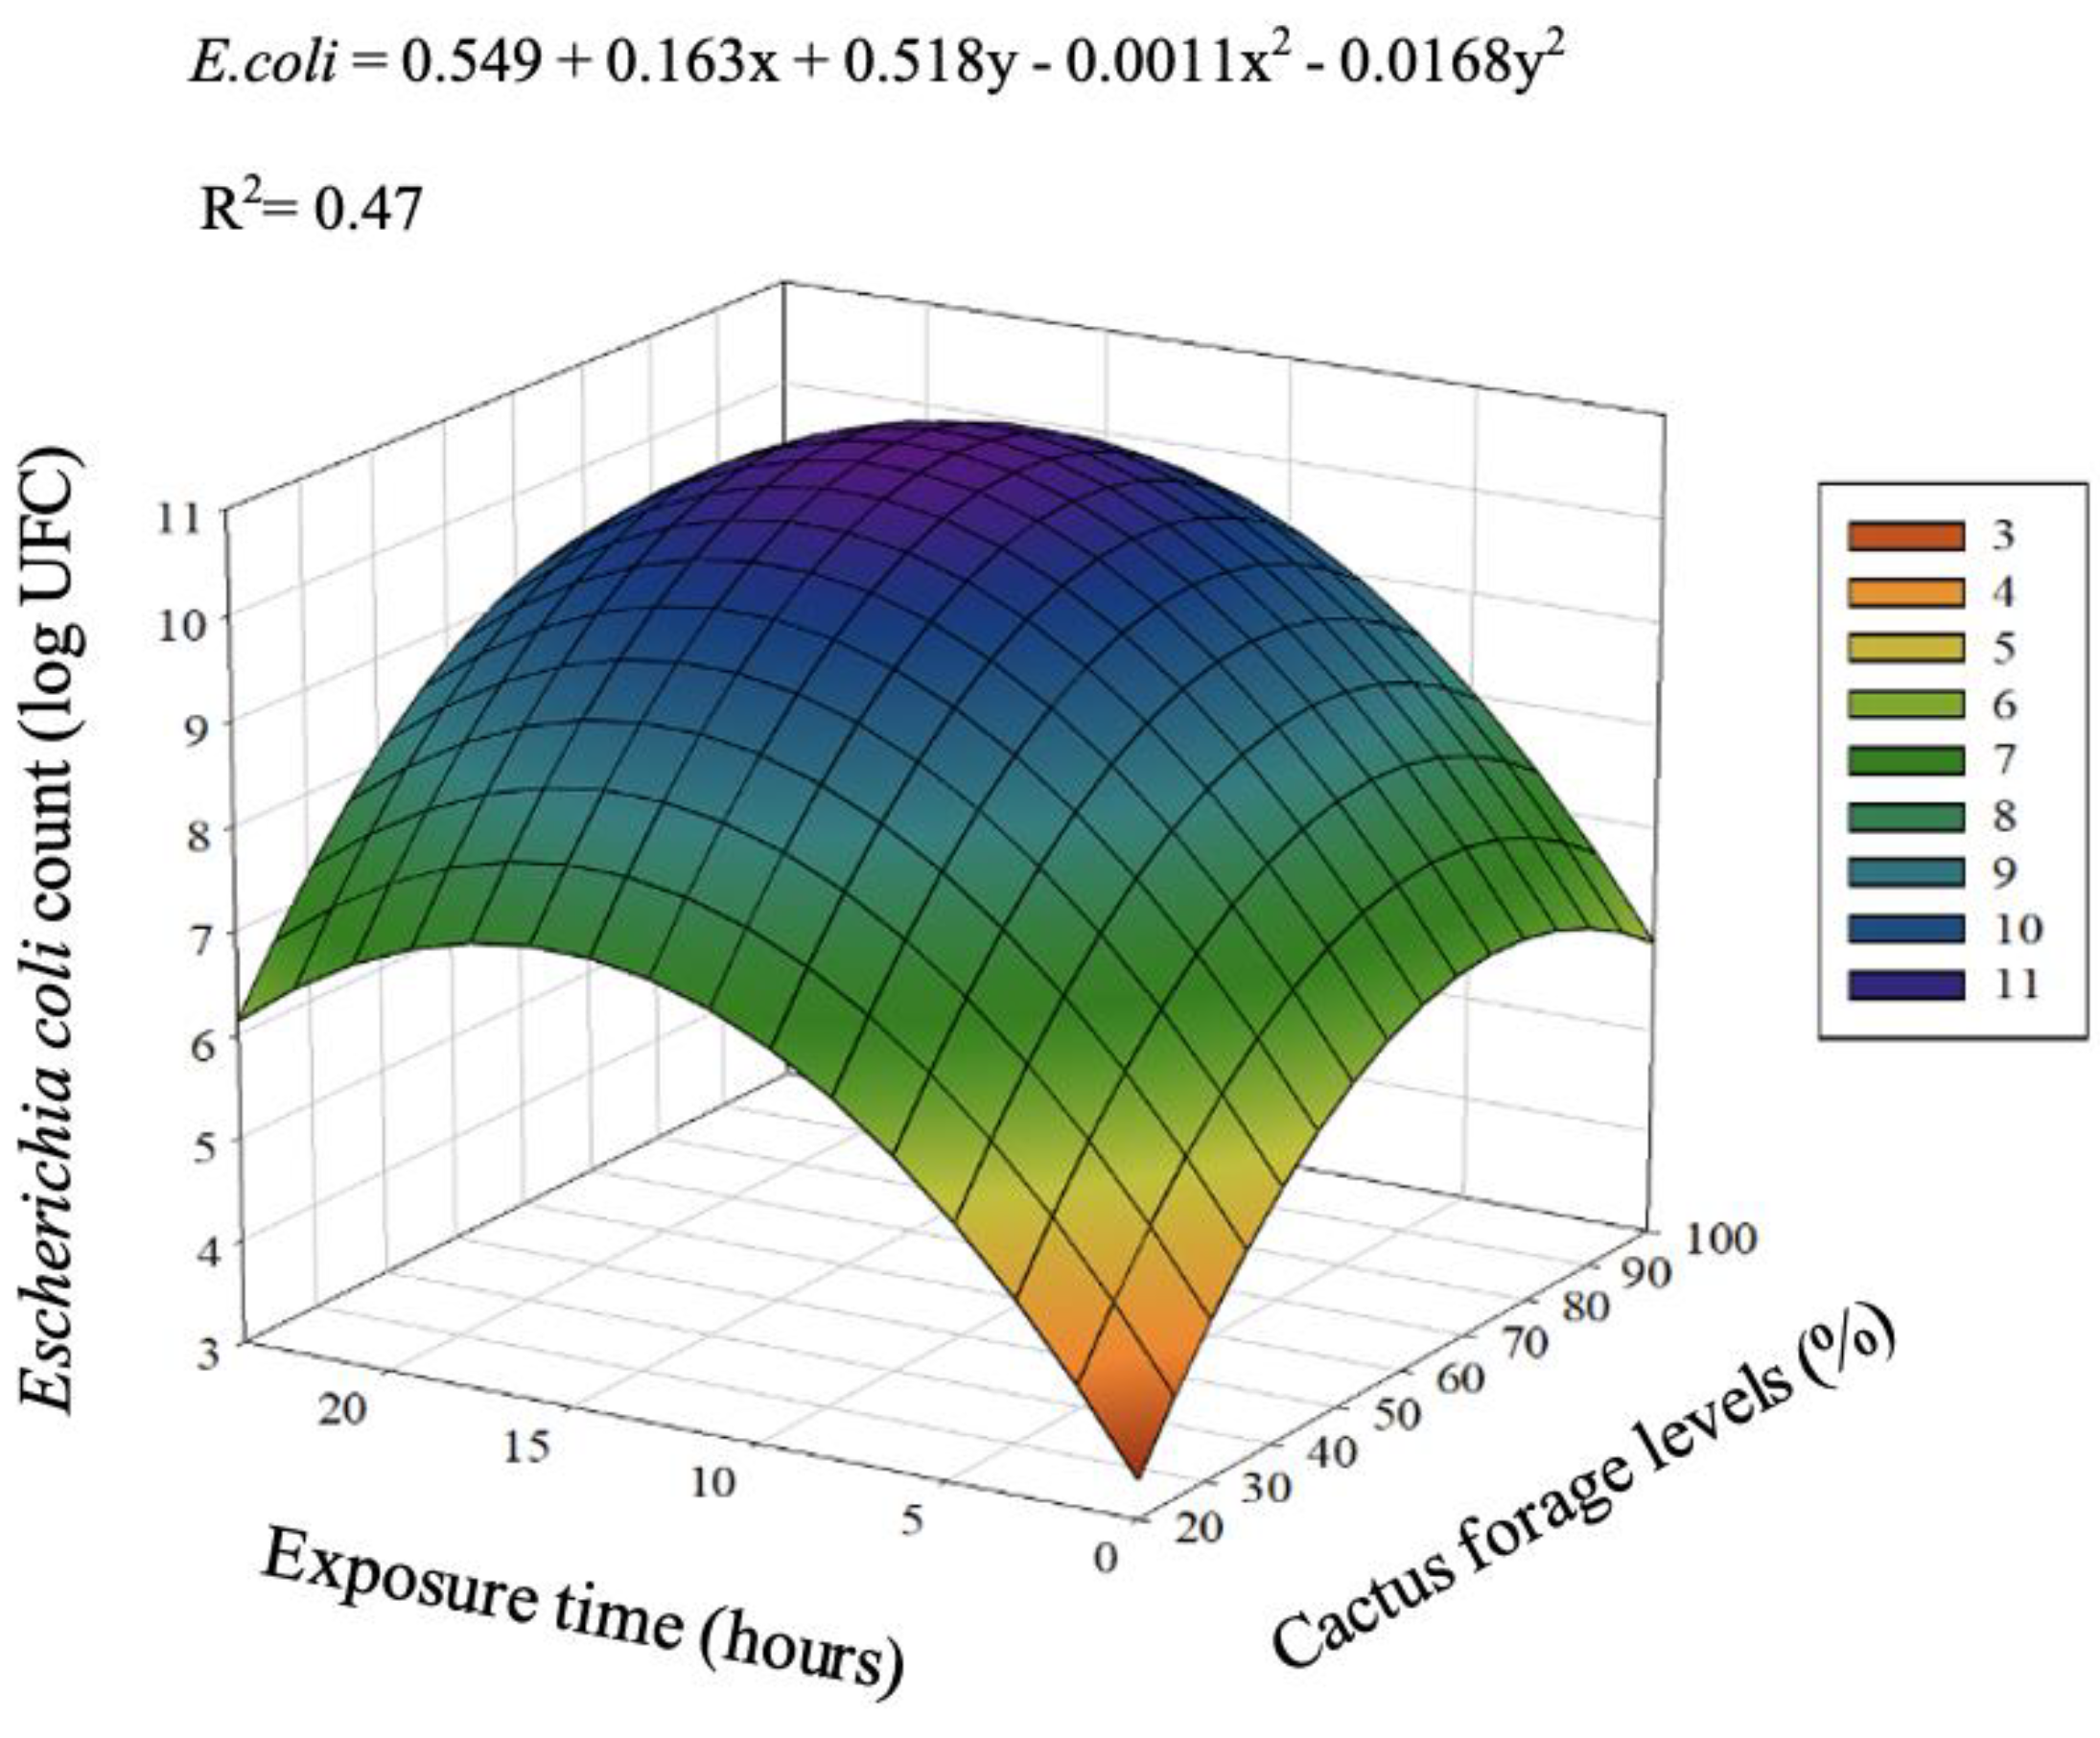
For E. coli population, there was an interaction effect between cactus forage levels and air exposure time (p < 0.001). The growth pool of this bacterium peaked at 16.06 h of exposure to air (Figure 3).
For chemical composition, there was an interaction of cactus forage levels and time of exposure to air for DM (p < 0.001), CP (p < 0.001), BC (p < 0.001), WSC (p < 0.001), and ammonia nitrogen (p < 0.001) (Table 3).
There was a linear decreasing effect over time of exposure to air for all cactus forage levels for DM. With 20% cactus forage, there was a greater loss of DM (28.77%), while with 100% cactus forage, there were lower losses of DM (4.82%). For crude protein values, there was a quadratic effect, with a decline in the CP concentration up to 8.43 h. NH3-N increased up to 12 h of exposure to air for the 80 and 90% cactus forage levels (Table 3). For CHO values, a decreasing linear effect was found when cactus forage concentration was increased throughout the exposure to air (Table 3). For buffering capacity, there was a linear for ancreasing effect for the 90 and 100% cactusfor aage levels as a function of the time of exposure to air (Table 3).
The spatial distribution of cactus forage levels by principal coordinate analysis (PCoA) showed that distinct and well-segregated groups were formed for different cactus forage levels (Figure 4). The level of 100% cactus forage showed greater dissimilarity of bacteria compared to 60% and 20% cactus forage (Figure 4).
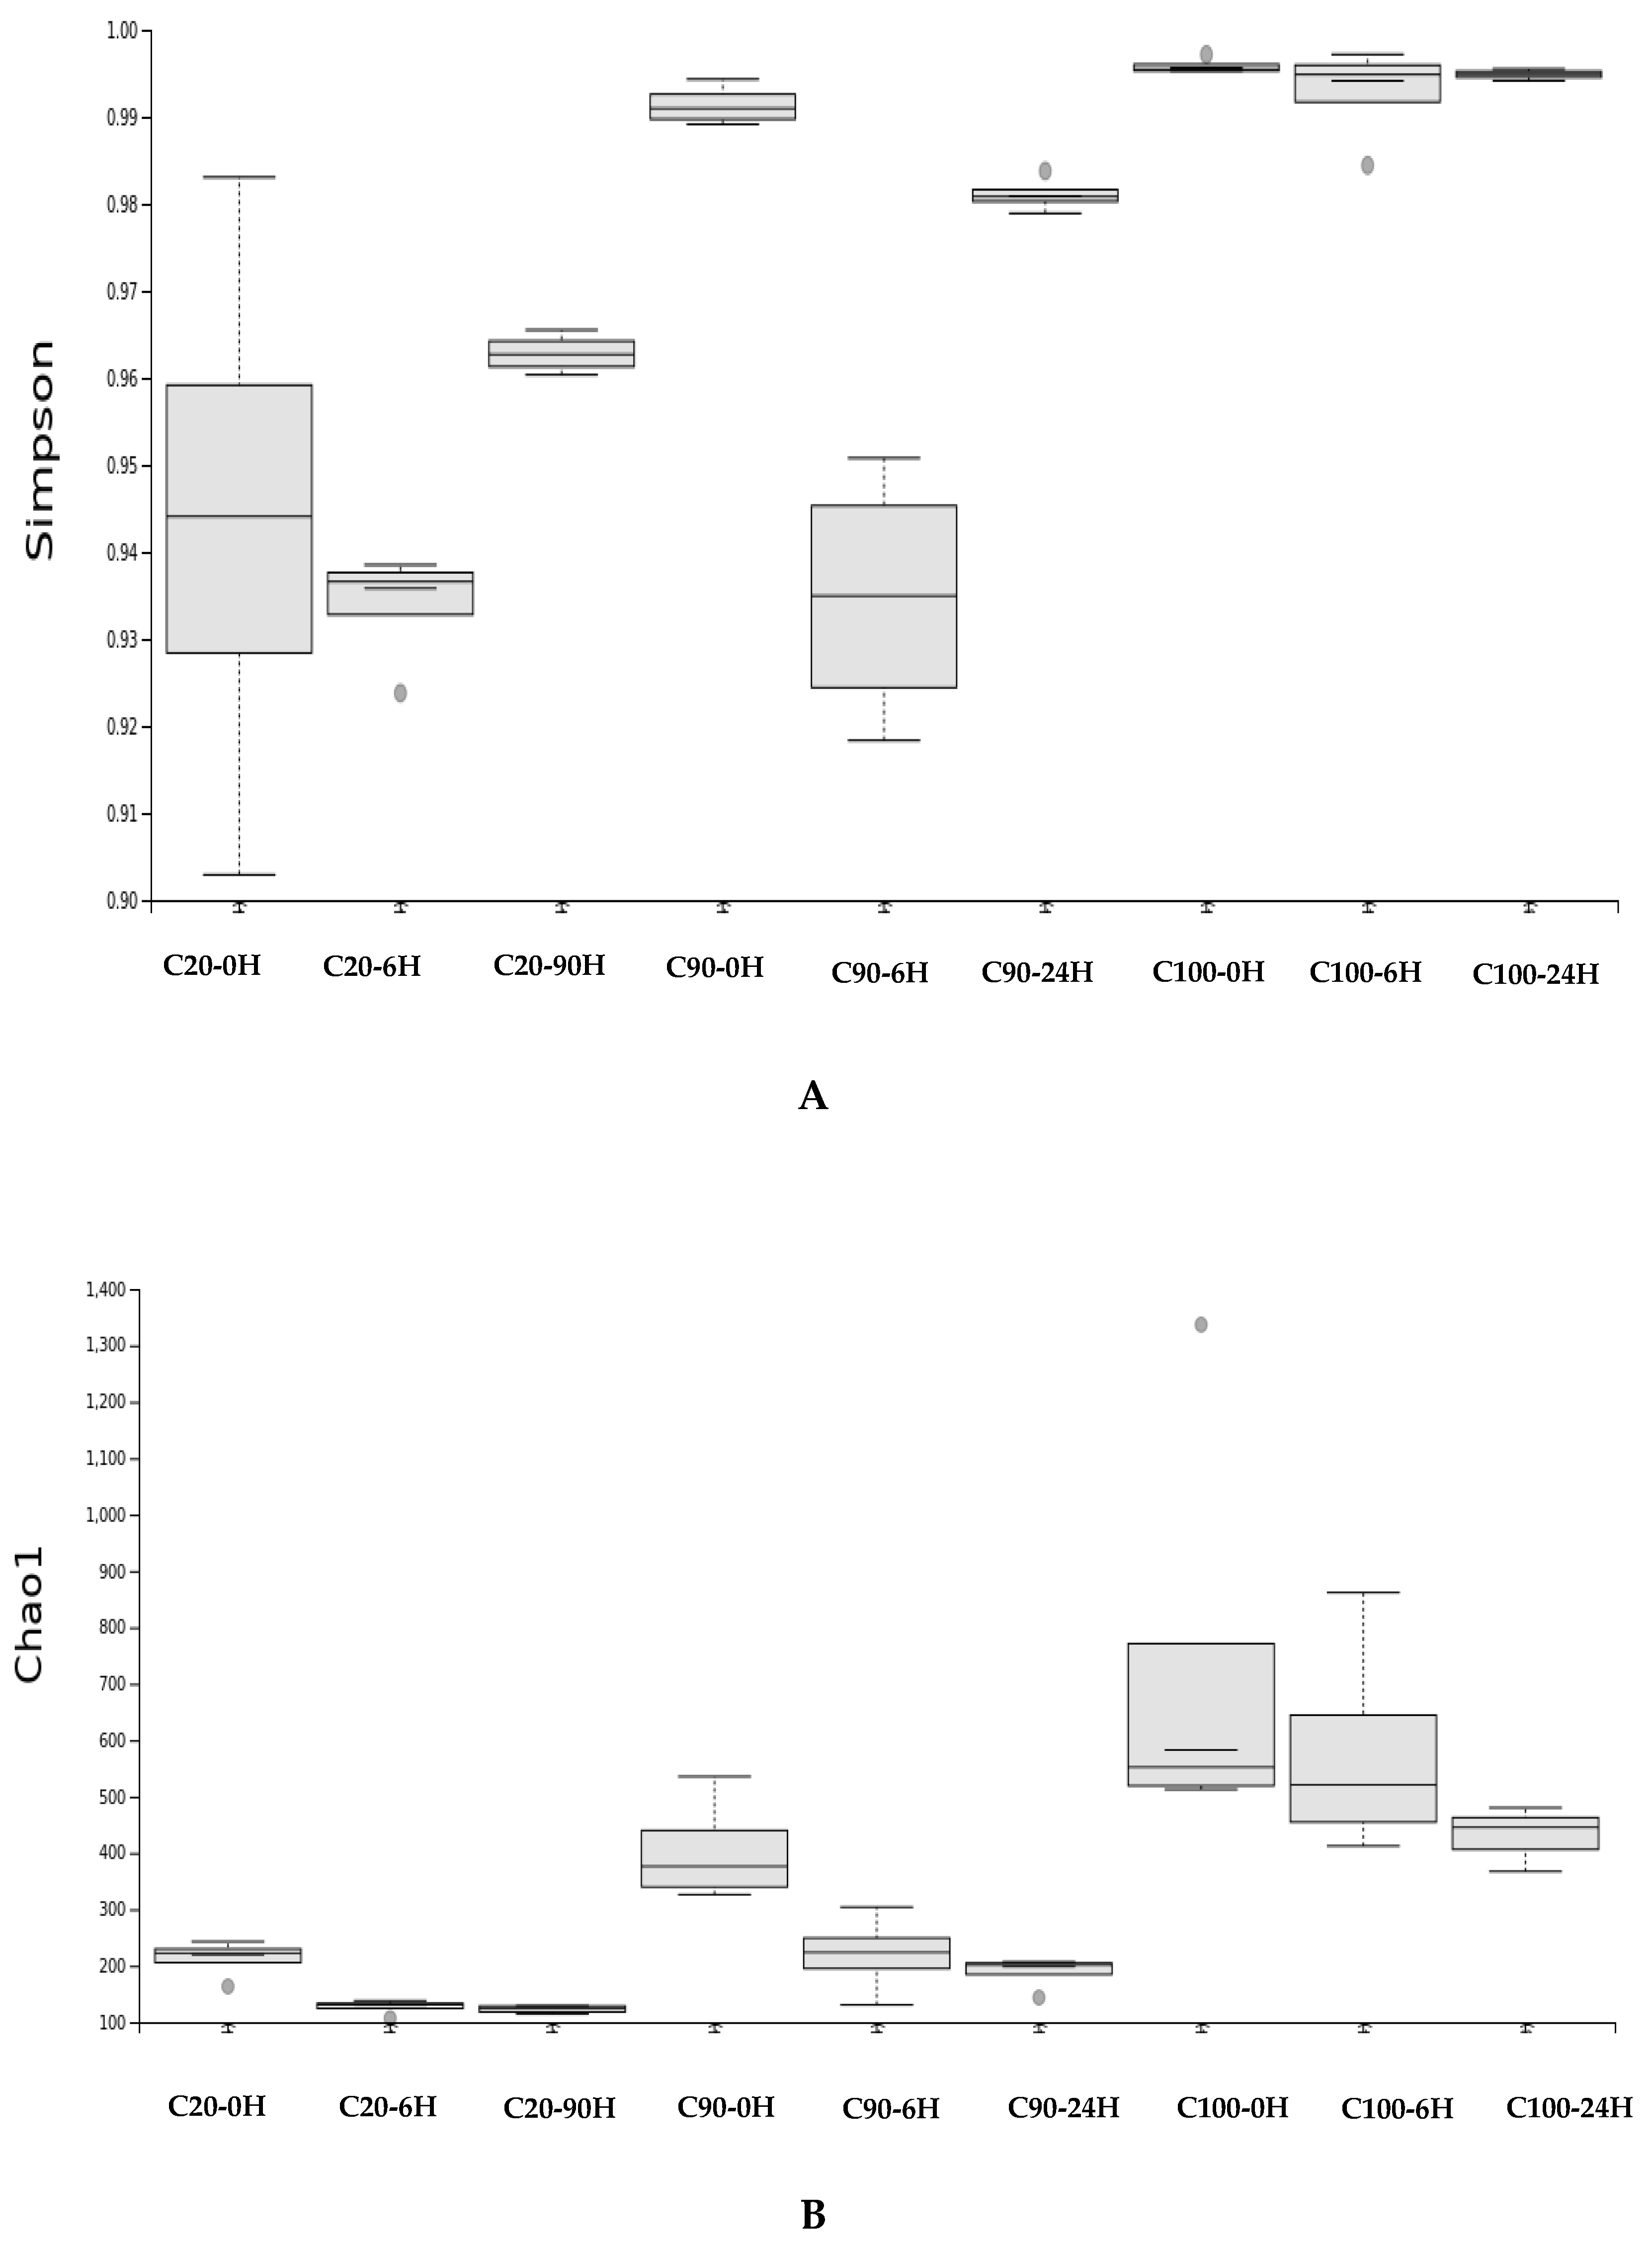
After six hours, there was an increase in microbial richness and evenness at all levels (Figure 5). At time zero, the highest level of cactus forage (100%) had low values of alpha diversity (Simpson, Chao1), unlike mixtures with 60% and 20% cactus forage, where there was high microbial diversity in the first hours of exposure.
The taxonomic diversity of bacterial communities was characterized by the abundance of two phyla, the most abundant: Bacteroidetes and Firmicutes (Figure 6). There was a decrease in the proportion of Bacteroidetes and an increase in Firmicutes in the 100% cactus forage diet after 6 h of exposure to air, with Firmicutes remaining abundant until 24 h.
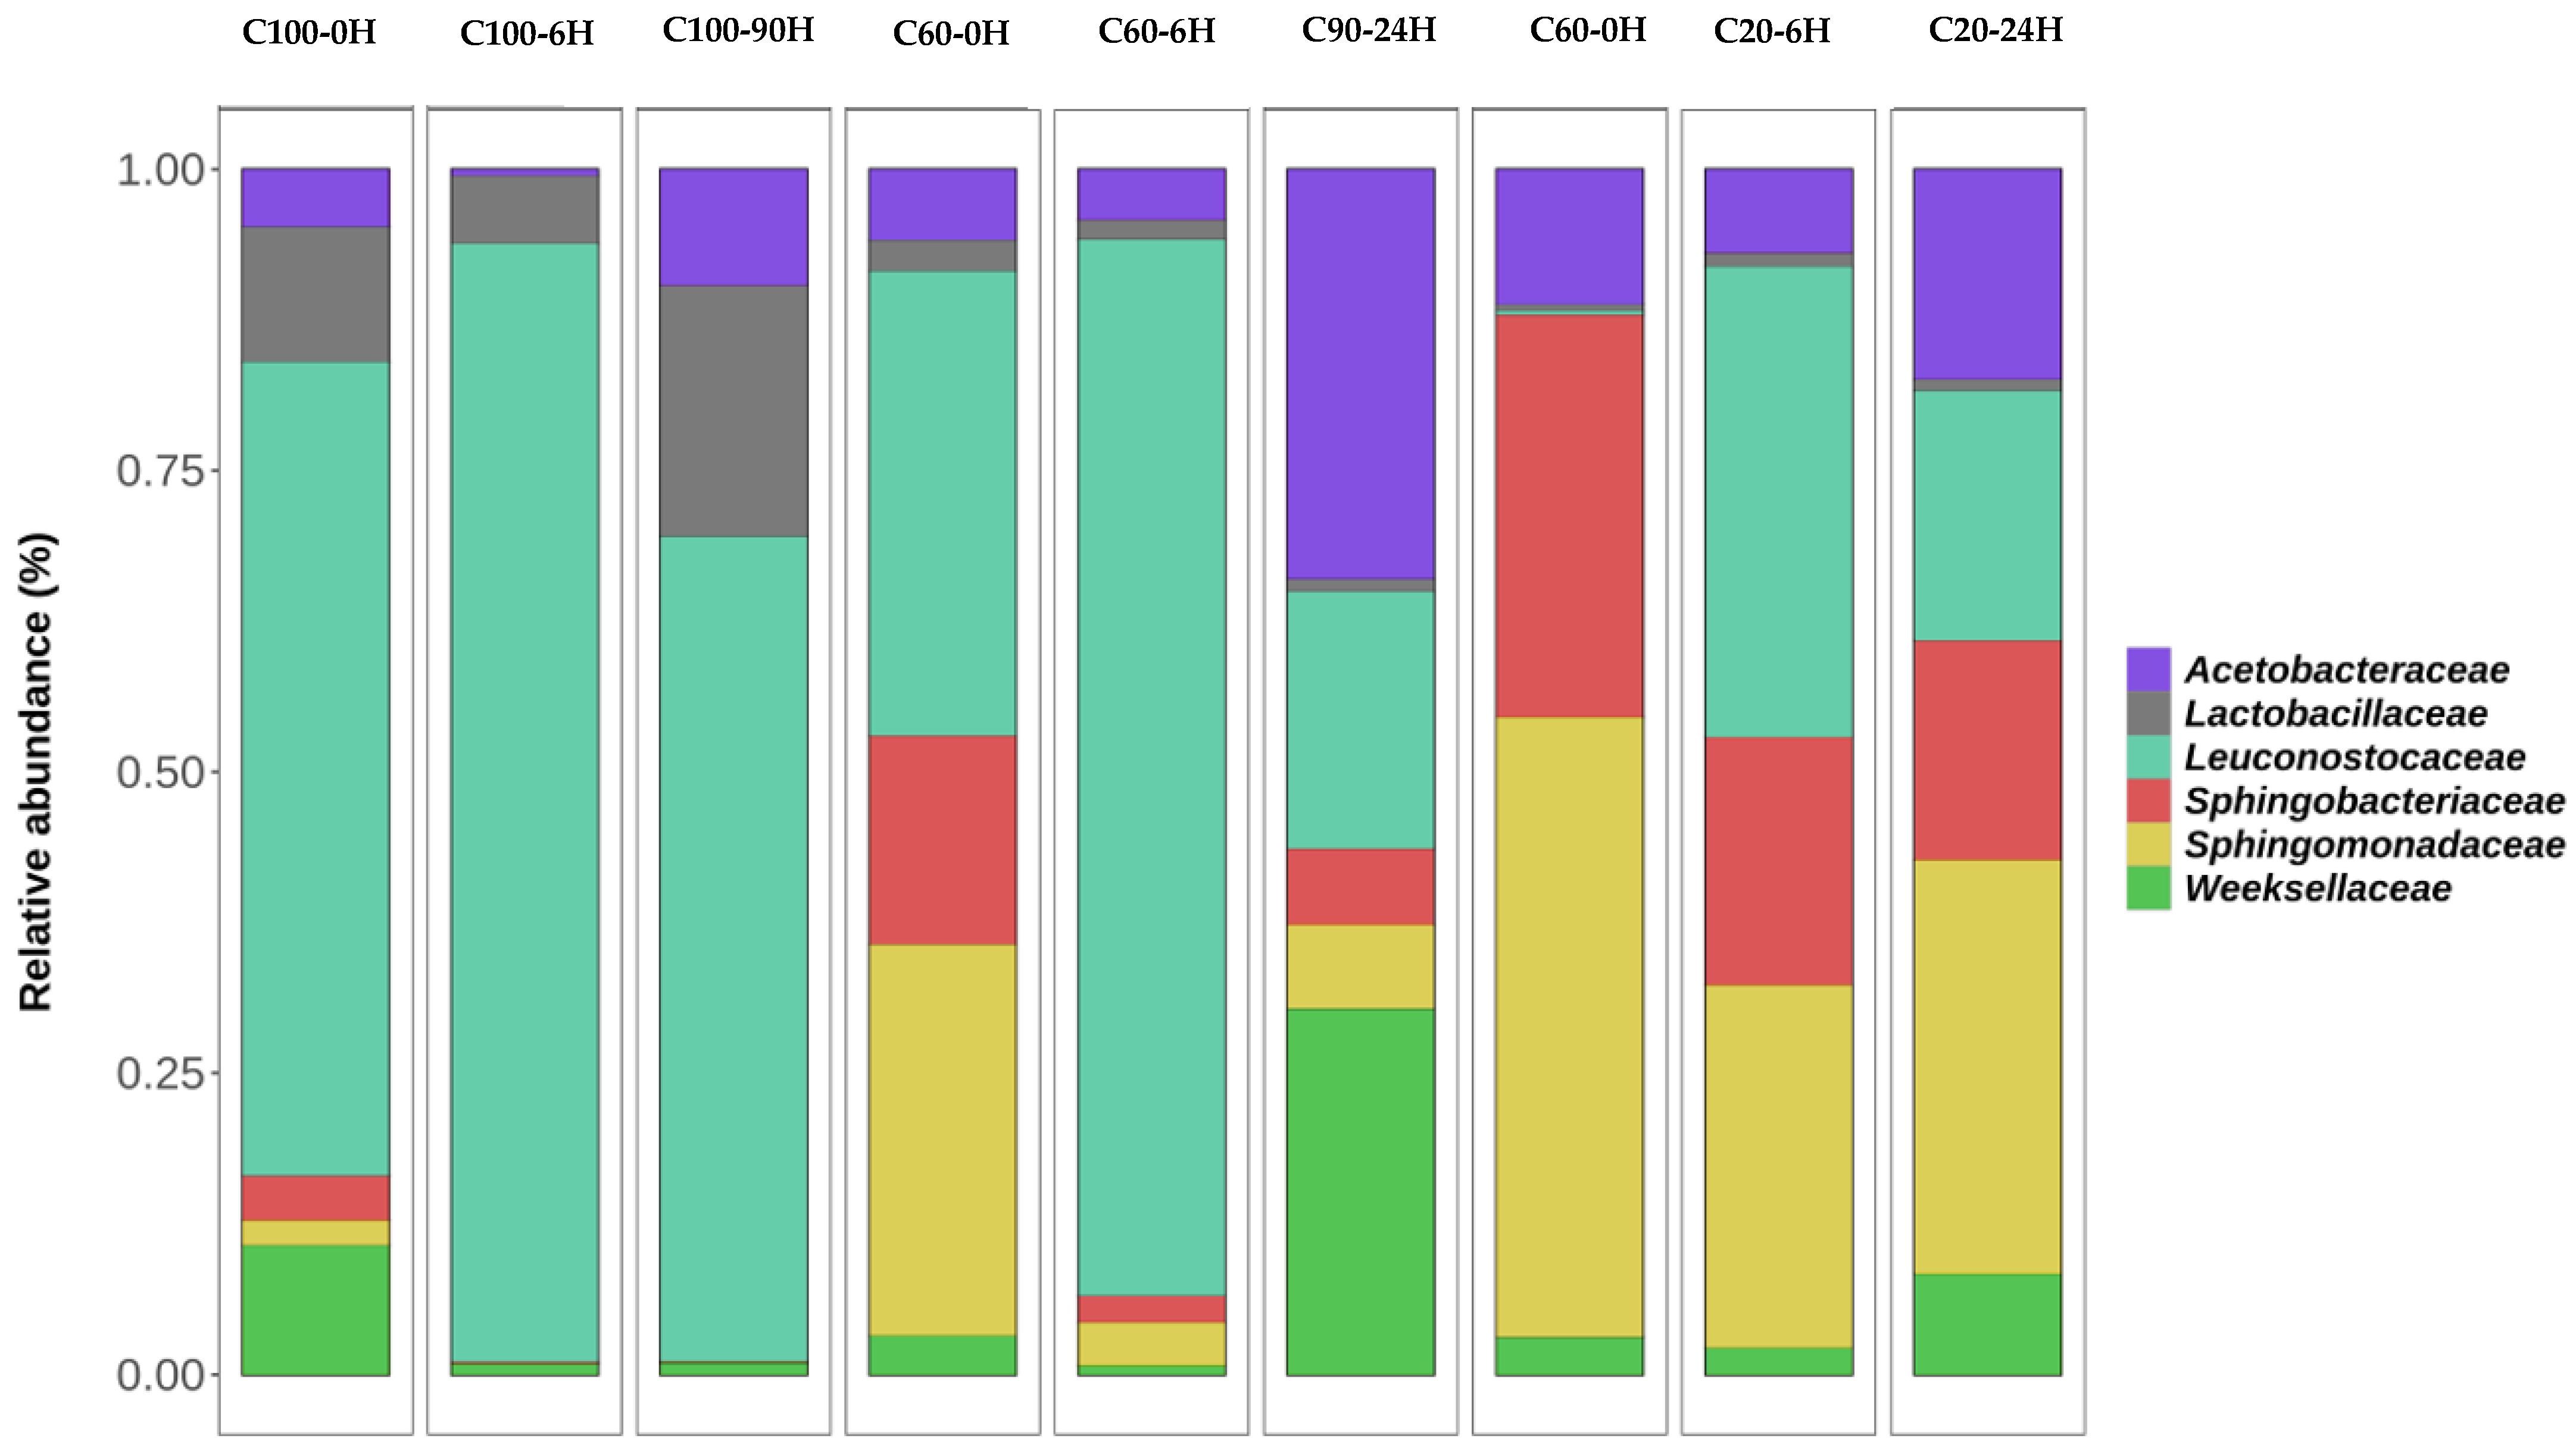
As for the family level, seven families were identified, in which Leuconostocaceae, Sphingomonadaceae, and Sphingobacteriaceae were the most abundant (Figure 7). At 100% cactus forage level, higher proportions of Leuconostocaceae and Lactobacillaceae were found, especially after six hours, where there was a reduction of Acetobacteraceae, Sphingobacteriaceae, Weeksellaceae, and Sphingomonadaceae. When there was 20% cactus forage, there was a greater abundance of Sphingomonadaceae, Sphingobacteriaceae, Spirosomaceae, and Leuconostocaceae.
The most abundant genera were Weissella, Lactobacillus, Bacteroides, Pseudomonas, Sphingobacterium, and Sphingomonas (Figure 8). In the diet with 100% and 60% cactus forage after 6 h, a greater predominance of Weissella was observed, while with 20% cactus forage, an apparent abundance of Weissella, Sphingomonas, and Pseudomonas was verified.

4. Discussion

The results indicated an increase in internal temperature at almost all levels of cactus forage within 12 h. According to Paulino et al. [6], the process of producing internal heat in chopped cactus forage is similar to the process occurring in silages, with high availability of residual sugars, where the exposure of the material to air and the presence of a large amount of substrate and moisture are ideal conditions for the proliferation of microorganisms, which generate heat, thus increasing the internal temperature.
At all levels of cactus forage, the low pH indicated acidity (pH > 4.5) [30]. The high pH associated with the greater penetration of oxygen into the mass may explain the greater microbial activity at the lower levels of cactus forage (20% cactus forage). The higher microbial activity with an increasing level of cactus forage is due to higher substrate (carbohydrates) and water availability. E. coli is a Gram-negative and very versatile bacterium that multiplies very quickly in different substrates and environments, being able to quickly multiply at temperatures between 10 °C and 45 °C and pH between 4.4 and 9.5 [30]. The ambient temperature used was 30 °C, and the pH observed in the cactus forage levels was low, which favors its growth, especially in the lower and intermediate levels of cactus forage.
At 20% cactus forage, there was no growth of E. coli at times 0 and 3 h after exposure to air. This lack of population may be related to the lower moisture content of the hay, which makes the medium initially less favorable for bacterial growth. However, from 6 h exposure to air, there was a greater growth of E. coli population at lower levels of cactus forage, a fact that was previously explained by the high pH and presence of air in the medium.
Some pathogenic microorganisms can occur in the plant epidermis and internalize in the plant after processing [31]. According to Zárate-Castrejón et al. [11], some bacteria can produce biofilms that allow them to adhere and survive in the wax of cactus forage cladodes and remain until harvest and offer to the animals.
The internalization of bacteria into plant tissues can occur through penetration into roots, seeds, and fruits, and through management, irrigation, and fertilization, which are vehicles for these microorganisms, which can migrate and survive in the edible aerial tissues of plants [32,33]. Thus, when chopping cactus forage to supply the animals, there is a faster access of contaminating microorganisms to plant nutrients, and with this, they can multiply at a higher speed, due to access to larger amounts of substrate for growth.
Regarding the chemical composition, within up to 8.43 h of exposure to air, there was a reduction in CP, but after 12 h, there was an increase in the concentration. Some bacteria are able to degrade proteins, promoting their reduction in the food, which justifies the decrease in CP in the first 6 h of exposure to air [34].
The content of NH3-N is related to proteolysis resulting from the growth of proteolytic microorganisms, such as enterobacteria [35]. These microorganisms degrade glucose, lactic acid, proteins and free amino acids, generating ammonia nitrogen [36], increasing over time.
After 12 h of exposure to air, there was an increase in CP values, presumably this increase is due to the consumption of other nutrients, especially carbohydrates, and can also be linked to an increase in ammonia content. Carbohydrates are used as substrate by aerobic bacteria due to the release of substrates and maintenance of a high pH, as discussed above, which explains a more pronounced reduction of carbohydrates in mixtures with higher proportions of cactus forage [37].
An Increase in buffering capacity over time was found for the highest proportions of cactus forage. This increase is related to the presence of buffering substances (oxalic, malic, citric, malonic, succinic, tartaric acids, and water as buffering substances that prevent lowering pH), in addition to the release of ammonia nitrogen by proteolytic activity, as previously discussed [7,38].
Regarding the cactus forage levels’ effect on the chemical composition, higher NFC and lower NDF contents are probably because of the chemical composition of cactus compared with buffel grass hay, since the cactus forage presents more NFC and less NDF than buffel grass hay. In relation to the EE reduction over time, probably some microorganisms could metabolize EE, such as E. coli, Lactobacillus plantarum, Weissella, and Pseudomanas [39,40].
When adding cactus forage to the diet, the microbial community was modified, and the time of exposure to air promoted large modifications. The characteristics inherent to the foods have a strong influence on the microbial type and diversity capable of developing in the medium, for example, a pH close to neutrality, and a high concentration of carbohydrates, which was the case with intermediate levels of cactus forage, favor the growth of a high diversity of bacteria, including E. coli [41].
Regarding the characterization of bacterial groups at the phylum level, with 20% cactus forage, there was a greater predominance of Proteobacteria and Bacteroidetes. Proteobacteria comprise a phylum of Gram-negative bacteria and include a wide variety of pathogens, such as Escherichia, Salmonella, Vibrio, and Helicobacter [42]. E. coli, a species of this phylum, can be divided into two large groups: commensal and pathogenic. The latter have specific virulence and pathogenicity mechanisms, being able to cause serious infections and diseases, including intestinal ones, thus the presence of this microorganism is undesirable in the diet [43].
The level of 60% cactus forage provided an instability in the abundance of phyla over time, when compared to the other levels. Microorganisms have a high adaptive capacity, with specialized groups for growth, according to water availability, pH, chemical composition, redox potential, and temperature [5]. Moreover, they are able to interact with each other in a positive or antagonistic way, through the production of metabolic and signaling molecules, thus influencing the microbiological diversity of forages [44,45].
The competition of different microorganisms for nutrients can favor or inhibit some species or groups of microorganisms. Lactic acid bacteria can produce lactic acid, or even bacteriocins, which inhibit or eliminate certain pathogenic microorganisms from food [30], which possibly occurred in this study, since six hours after exposure to air, there was a predominance of Weissella. Pereira et al. [46] also investigated the microbial diversity of fresh cactus forage and reported a greater predominance of bacteria of the genus Weissella in the plant. Some Weissella species have shown high technological and probiotic potential [47,48].
Prior to the present research, it was expected that the inclusion of buffel grass hay would control the growth of Gram-negative bacteria, promoting greater preservation of the processed cactus forage, simulating a trough situation. However, changes in the pH of the medium, as well as the presence of oxygen, increased microbial diversity and made the environment susceptible to the growth of Gram-negative bacteria, as well as an increase in the population of E. coli.
This is very relevant because, under farm conditions, cactus forage is always supplied along with other forage, often using hay and dry concentrate feed, which can further favor the growth of opportunistic pathogenic microorganisms in the animal feed and may cause gastrointestinal disorders.
Thus, based on the results of this study, even under laboratory conditions, in which there is a high sanitary control, there was a growth of microorganisms with pathogenic potential, thus requiring greater care with sanitary quality in the handling of feed containing cactus forage in farm environments. Moreover, it is necessary to shorten the time of exposure of the feed in the trough, by more frequently removing leftovers from the trough and/or greater fractionation of the feed for the animal throughout the day, avoiding the pool of undesirable microorganisms, or even pathogens, in the feed, which can cause nutritional disorders to animals, compromising their health and performance.
Nevertheless, the presence of epiphytic microorganisms was also verified in cactus forage with potential to be used as additives in silages or in the form of probiotics in animal feed, emphasizing the abundance of the genus Weissella. Further studies should be performed considering the food safety of cactus forage in diets for ruminants, as well as the isolation and use of beneficial microorganisms that naturally colonize this plant.

5. Conclusions

Aerobic exposure of mixtures of cactus forage with buffel grass hay increases the proliferation of microorganisms with pathogenic potential in the diet. Therefore, an exposure period of fewer than six hours with 20% cactus forage is recommended to minimize levels of E. coli. Avoiding negative effects of the multiplication of pathogenic microorganisms on animal and human health.

Author Contributions

Conceptualization, G.d.A., E.M.S. and J.d.O.; methodology, D.d.S., E.M.S. and J.d.O.; software, H.N. and M.L.; validation, D.d.S., G.d.A. and E.M.S.; formal analysis, D.d.S., É.L., G.L. and E.J.; investigation, D.d.S., G.d.A., E.M.S., J.d.O., R.S., F.N.S., G.S. and C.J.d.O.; resources, E.M.S. and J.d.O.; data curation, D.d.S., G.d.A. and E.J.; writing—original draft preparation, D.d.S., G.d.A., E.M.S. and J.d.O.; writing—review and editing, A.Z. and F.N.S.; visualization, E.M.S., J.d.O., A.Z. and F.N.S.; supervision, G.d.A., E.M.S. and J.d.O.; project administration, E.M.S. and J.d.O.; funding acquisition, G.d.A., E.M.S. and J.d.O. All authors have read and agreed to the published version of the manuscript.

Funding

The research was supported by Foundation for Research Support of the State of Paraíba Pronex edital (finace code 06/2018), the National Council for Scientific and Technological Development (CNPq, Brazil). The Coordination for the Improvement of Higher Education Personnel (CAPES-Brazil, finance code 001) and Foundation for Research Scientific and Technological Development of Maranhão.

Institutional Review Board Statement

Not applicable.

Informed Consent Statement

Not applicable.

Data Availability Statement

Not applicable.

Conflicts of Interest

The authors declare no conflict of interest.

References

  1. Melo, A.A.S.; Ferreira, M.A.; Véras, A.S.C.; Lira, M.A.; Lima, L.E.; Pessoa, R.A.S.; Bispo, S.V.; Cabral, A.M.D.; Azevedo, M. Desempenho leiteiro de vacas alimentadas com caroço de algodão em dieta à base de palma forrageira. Pesq. Agrop. Bra. 2006, 41, 1165–1171. [Google Scholar] [CrossRef]
  2. Marques, O.F.C.; Gomes, L.S.P.; Mourthé, M.H.F.; Braz, T.G.S.; Pires Neto, O.S. Palma forrageira: Cultivo e utilização na alimentação de bovinos. Cad. Ciências Agrárias 2017, 9, 75–93. [Google Scholar]
  3. Costa, R.G.; Treviño, I.H.; Medeiros, G.R.; Medeiros, N.A.; Pinto, T.F.; Oliveira, R.L. Effects of replacing corn with cactus pear (Opuntia fícus indica Mill) on the performance of Santa Inês lambs. Small Rum. Res. 2012, 102, 13–17. [Google Scholar] [CrossRef]
  4. Pinho, R.M.A.; Santos, E.M.; Oliveira, J.S.; Carvalho, G.G.P.; Silva, T.C.; Macêdo, A.J.S.; Corrêa, Y.R.; Zanine, A.M. Does the level of forage neutral detergent fiber affect the ruminal fermentation, digestibility and feeding behavior of goats fed cactus pear? Anim. Sci. J. 2018, 89, 1424–1431. [Google Scholar] [CrossRef] [PubMed]
  5. Barros, L.J.A.; Ferreira, M.A.; Oliveira, J.C.V.; Santos, D.C.; Chagas, J.C.C.; Alves, A.M.S.V.; Silva, A.E.M.; Freitas, W.R. Replacement of Tifton hay by spineless cactus in Girolando post-weaned heifers’ diets. Trop. Anim. Heath Prod. 2017, 50, 149–154. [Google Scholar] [CrossRef]
  6. Paulino, R.S.; Oliveira, J.S.; Santos, E.M.; Pereira, G.A.; Ramos, J.P.F.; César Neto, J.M.; Cruz, G.F.L.; Leite, G.M.; Satake, F.; Silva, A.L.; et al. Spineless cactus use management on microbiological quality, performance, and nutritional disorders in sheep. Trop. Anim. Heath Prod. 2021, 53, 1–14. [Google Scholar] [CrossRef]
  7. Abidi, S.; Ben Salem, H.; Martín-García, A.I.; Molina-Alcaide, E. Ruminal fermentation of spiny (Opuntia amyclae) and spineless (Opuntia ficus indica f. inermis) cactus cladodes and diets including cactus. Anim. Feed Sci. Technol. 2009, 149, 333–340. [Google Scholar] [CrossRef]
  8. Andrade-Montemayor, H.M.; Cordova-Torres, A.V.; Casca, T.G.; Kawas, J.R. Alternative foods for small ruminants in semiarid zones, the case of Mesquite (Proposis laevigata spp.) and Nopal (Opuntia spp.). Small Rumi. Res. 2011, 98, 83–92. [Google Scholar] [CrossRef]
  9. Isaac, A.A. Overview of Cactus (Opuntia Ficus-Indica (L): A Myriad of Alternatives. Stud. Ethno-Med. 2016, 10, 195–205. [Google Scholar] [CrossRef]
  10. Vimalkumar, S.P.; Purohit, H.J.; Raje, D.V.; Parmar, N.; Patel, A.B.; Jones, O.A.H.J.; Joshi, C.G. The effect of a high-roughage diet on the metabolism of aromatic compounds by rumen microbes: A metagenomic study using Mehsani buffalo (Bubalus bubalis). Appl. Microbiol. Biothechnol. 2016, 100, 1319–1331. [Google Scholar] [CrossRef]
  11. Zárate-Castrejón, J.L.; Martínez-Martínez, T.O.; Angeles-Núñez, J.G.; Concha-Valdez, F.G.; Verde-Calvo, J.R.; Guzmán, M.E.R. Survival of Salmonella Enteritidis and Escherichia coli in cactus cladodes under domestic marketing conditions in Mexico. Afr. J. Microbiol. Res. 2016, 10, 1999–2006. [Google Scholar] [CrossRef]
  12. Chaudhry, V.; Runge, P.; Sengupta, P.; Doehlemann, G.; Parker, J.E.; Kemen, E. Shaping the leaf microbiota: Plant–microbe–microbe interactions. J. Exp. Bot. 2020, 72, 36–56. [Google Scholar] [CrossRef]
  13. Robazza, W.S.; Teleken, J.T.; Gomes, G.A. Modelagem Matemática do Crescimento de Microrganismos em Alimentos. Trends Comput. Appl. Math. 2010, 11, 101–110. [Google Scholar] [CrossRef]
  14. Gilbert, R.A.; Tomkins, N.; Padmanabha, J.; Gough, J.M.; Krause, D.O.; Mcsweeney, C.S. Effect of finishing diets on Escherichia coli populations and prevalence of enterohaemorrhagic E. coli virulence genes in cattle faeces. J. Appl. Microbiol. 2005, 99, 885–894. [Google Scholar] [CrossRef]
  15. Guastalli, E.A.L.; Gama, N.M.S.Q.; Buim, M.R.; Oliveira, R.A.; Ferreira, A.J.P.; Leite, D.S. Índice de patogenicidade, produção de hemolisina e sorogrupo de amostras de Escherichia coli isoladas de aves de postura comercial. Ar. Inst. Biol. 2010, 77, 153–157. [Google Scholar] [CrossRef]
  16. Association of Official Analytical Chemists—AOAC. Official Methods of Analysis, 19th.ed.; AOAC: Gaithersburg, MD, USA, 2016. [Google Scholar]
  17. Sniffen, C.J.; O'connor, J.D.; Van Soest, P.J.; Fox, D.G.; Russell, J.B. A net carbohydrate and protein system for evaluating cattle diets: II. Carbohydrate and protein availability. J. Anim. Sci. 1992, 70, 3562–3577. [Google Scholar] [CrossRef]
  18. Playne, M.J.; McDonald, P. The buffering constituents of herbage and of silage. J. Sci. Food Agric. 1996, 17, 264–268. [Google Scholar] [CrossRef]
  19. Dubois, M.; Gilles, K.A.; Hamilton, J.K.; Rebers, P.A.; Smith, F. Colorimetric method for determination of sugars and related substances. Anal. Biochem. 1956, 28, 350–356. [Google Scholar] [CrossRef]
  20. Corsato, C.E.; Scarpare Filho, J.A.; Sales, E.C.J. Teores de carboidratos em órgãos lenhosos do caquizeiro em clima tropical. Rev. Bras. Frut. 2008, 30, 414–418. [Google Scholar] [CrossRef]
  21. Bolsen, K.K.; Lin, C.; Brent, C.R.; Feyerherm, A.M.; Urban, J.E.; Aimutis, W.R. Effects of silage additives on the microbial succession and fermentation process of alfafa and corn silages. J. Dairy Sci. 1992, 75, 3066–3083. [Google Scholar] [CrossRef]
  22. Bolyen, E.; Rideout, J.R.; Dillon, M.R. Reproducible, interactive, scalable and extensible microbiome data science using QIIME 2. Nat. Biotechnol. 2018, 37, 852–857. [Google Scholar] [CrossRef]
  23. Rognes, T.; Flouri, T.; Nichols, B.; Quince, C.; Mahé, F. VSEARCH: A versatile open source tool for metagenomics. PeerJ 2016, 4, e2584. [Google Scholar] [CrossRef]
  24. Edgar, R.C.; Haas, B.J.; Clemente, J.C.; Quince, C.; Knight, R. Uchime improves sensitivity and speed of chimera detection. Bioinformatics 2011, 27, 2194–2200. [Google Scholar] [CrossRef]
  25. Katoh, K.; Misawa, K.; Kuma, K.; Miyata, T. Mafft: A novel method for rapid multiple sequence alignment based on fast Fourier transform. Nucleic Acids Res. 2002, 30, 3059–3066. [Google Scholar] [CrossRef]
  26. Price, M.N.; Dehal, P.S.; Arkin, A.P. FastTree 2–approximately maximum-likelihood trees for large alignments. PLoS ONE 2010, 5, e9490. [Google Scholar] [CrossRef]
  27. Mcmurdie, P.J.; Holmes, S. Phyloseq: An R package for reproducible interactive analysis and graphics of microbiome census data. PLoS ONE 2013, 8, e61217. [Google Scholar] [CrossRef]
  28. Quast, C.; Pruesse, E.; Yilmaz, P.; Gerken, J.; Schweer, T.; Yarza, P.; Peplies, J.; Glöckner, F.O. The SILVA ribosomal RNA gene database project: Improved data processing and web-based tools. Nucleic Acids Res. 2012, 41, D590–D596. [Google Scholar] [CrossRef]
  29. Lozupone, C.; Knight, R. Unifrac: A new phylogenetic method for comparing microbial communities. Appl. Environ. Microbiol. 2005, 71, 8228–8235. [Google Scholar] [CrossRef]
  30. Hoffmann, F.L. Fatores limitantes à proliferação de microorganismos em alimentos. Bras. Aliment. 2001, 9, 23–30. [Google Scholar]
  31. Liu, C.; Hofstra, N.; Franz, E. Impacts of climate change on the microbial safety of pre-harvest leafy green vegetables as indicated by Escherichia coli O157 and Salmonella spp. Int. J. Food Microbiol. 2013, 163, 119–128. [Google Scholar] [CrossRef]
  32. Solomon, E.B.; Yaron, S.; Matthews, K.R. Transmission of Escherichia coli O157:H7 from contaminated manure and irrigation water to lettuce plant tissue and its subsequent internalization. Appl. Environ. Microbiol. 2002, 68, 397–400. [Google Scholar] [CrossRef] [PubMed]
  33. Tang, P.L.; Pui, C.F.; Wong, W.C.; Noorlis, A.; Son, R. Biofilm forming ability and time course study of growth of Salmonella Typhi on fresh produce surfaces. Int. Food Res. J. 2012, 19, 71–76. [Google Scholar]
  34. McDonald, P.; Henderson, N.; Heron, S. The Biochemistry of Silage; John Wiley & Sons: Manchester, UK, 1991; pp. 81–151. [Google Scholar]
  35. Muck, R.E. Microbiologia da silagem e seu controle por meio de aditivos. Rev. Bras. Zoot. 2010, 39, 183–191. [Google Scholar] [CrossRef]
  36. Nascimento, T.V.C.; Carvalho, G.G.P.; Freitas Júnior, J.E.L.; Souza, W.F. Volumosos tratados com asditivos químicos: Valor nutritivo e desempenho de Ruminantes. Arch. Zoot. 2016, 65, 593–604. [Google Scholar]
  37. Macêdo, A.J.S.; Santos, E.M.; Oliveira, J.S.; Perazzo, A.F. Microbiologia de silagens: Revisão de Literatura. Rev. Elect. Veter. 2017, 18, 1–11. [Google Scholar]
  38. Carvalho, C.B.M.; Edvan, R.L.; Carvalho, M.L.A.M.; Reis, A.L.A.; Nascimento, R.R. Uso de cactáceas na alimentação animal e seu armazenamento após colheita. Arch. Zoot. 2018, 67, 440–446. [Google Scholar] [CrossRef]
  39. Dinçer, E.; Kıvanç, M. Lipolytic activity of lactic acid bacteria isolated from Turkish pastırma. Anadolu Univ. J. Sci. Technol. C Life Sci. Biotechnol. 2018, 7, 12–19. [Google Scholar] [CrossRef]
  40. Silva, E.O.O.; Nespolo, C.R.; Sehn, C.P.; Pinheiro, F.C.; Stefani, L.M. Lactic acid bacteria with antimicrobial, proteolytic and lipolytic activities isolated from ovine dairy products. Food Sci. Technol. 2019, 40, 293–299. [Google Scholar] [CrossRef]
  41. Hui, Y. Handbook of Food Science Tecnhnology and Engineering; CRC Press: Boca Raton, FL, USA, 2006; Volume 149, pp. 8–17. [Google Scholar]
  42. Trabulsi, L.R.; Alterthum, F.; Martinez, M.B.; Campos, L.C.; Gompertz, O.F.; Rácz, M.L. Microbiologia, 5th ed.; Atheneu: São Paulo, Brazil, 2008. [Google Scholar]
  43. Kaper, J.B.; Nataro, J.P.; Mobley, H.L.T. Pathogenic Escherichia coli. Nat. Rev. Microbiol. 2004, 2, 123–138. [Google Scholar] [CrossRef]
  44. Remenant, B.; Jaffres, E.; Dousset, X.; Pilet, M.F.; Zagorec, M. Bacterial spoilers of food: Behavior, fitness and functional properties. Food Microbiol. 2015, 45, 45–53. [Google Scholar] [CrossRef]
  45. Gram, L.; Ravn, L.; Rasch, M.; Bruhn, J.B.; Christensen, A.B.; Givskov, M. Food Spoilage—Interactions between food spoilage bacteria. Int. J. Food Microbiol. 2002, 78, 79–97. [Google Scholar] [CrossRef]
  46. Pereira, G.A.; Santos, E.M.; Araújo, G.G.L.; Oliveira, J.S.; Pinho, R.M.A.; Zanine, A.M.; Souza, A.F.N.; Macedo, A.J.S.; Neto, J.M.C.; Nascimento, T.V.C. Isolation and identification of lactic acid bacteria in fresh plants and in silage from Opuntia and their effects on the fermentation and aerobic stability of silage. J. Agric. Sci. 2020, 10, 684–692. [Google Scholar] [CrossRef]
  47. Fusco, V.; Quero, G.M.; Cho, G.S.; Kabisch, J.; Meske, D.; Neve, H.; Bockelmann, W.; Franz, C.M. The genus Weissella: Taxonomy, ecology and biotechnological potential. Front. Microbiol. 2015, 6, 1–22. [Google Scholar] [CrossRef]
  48. Fessard, A.; Remize, F. Why are Weissella spp. not used as commercial starter cultures for food fermentation? Fermentation 2017, 3, 38. [Google Scholar] [CrossRef]
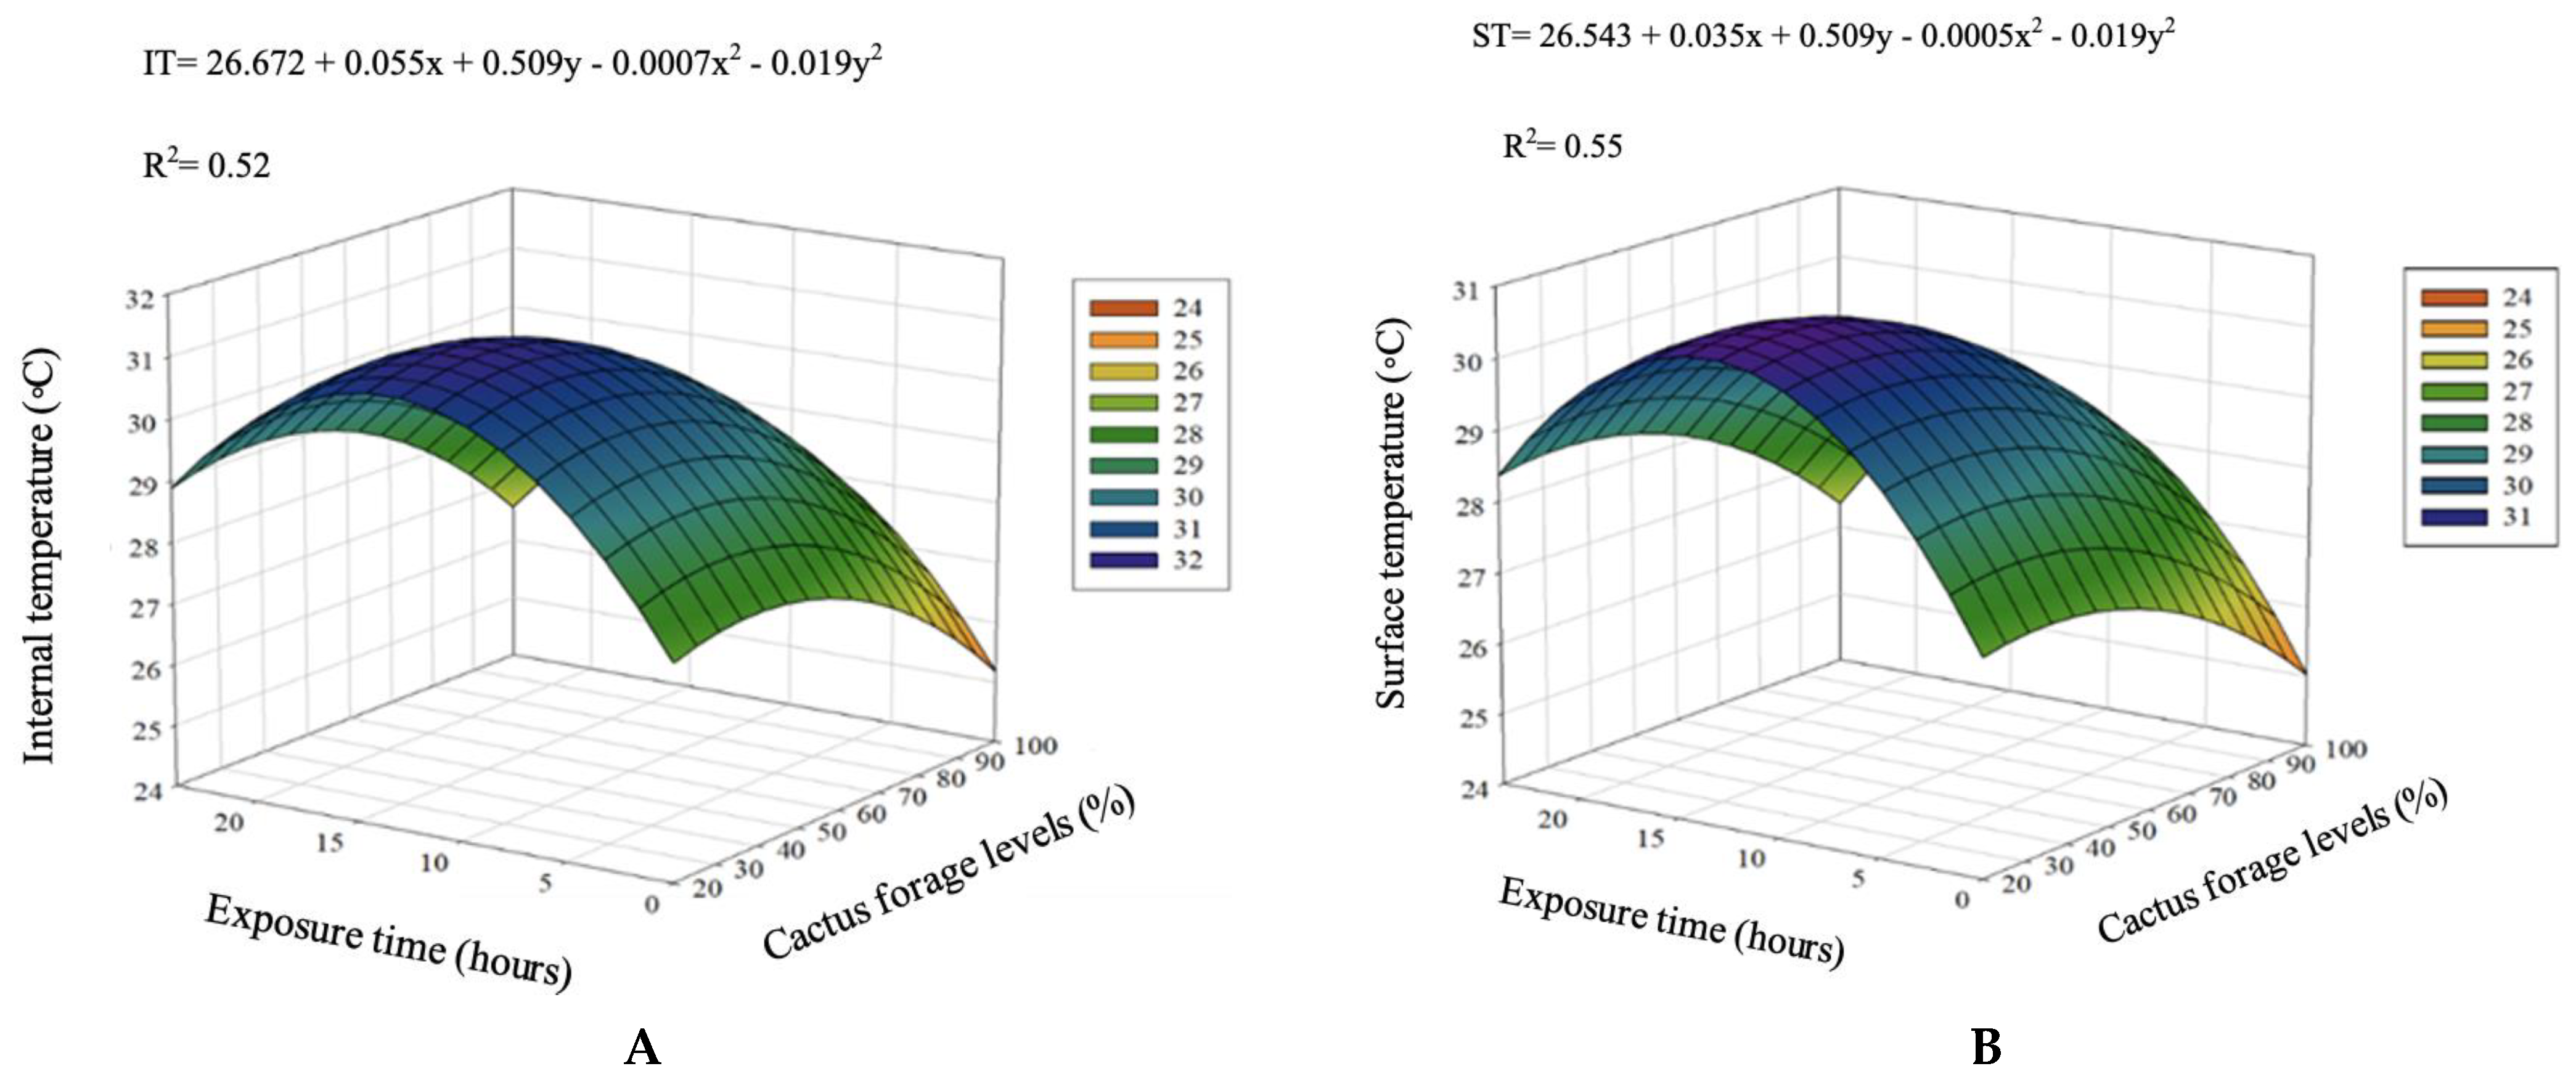
Figure 1. Internal temperature (A) and surface temperature (B) as a function of cactus forage levels and time of exposure to air.
Agronomy 12 01927 g001
Figure 2. Potential of hydrogen (pH) as a function of cactus forage levels and time of exposure to air.
Agronomy 12 01927 g002
Figure 3. Escherichia coli population as a function of cactus forage levels and time of exposure to air.
Agronomy 12 01927 g003
Figure 4. Beta diversity represented by a 3D PCoA graph showing the degree of dissimilarity based on the unweighted UniFrac distance matrix. C100 = 100% cactus forage; C60 = 60% cactus forage and 40% buffel grass hay; C20 = 20% cactus forage and 80% buffel grass hay; 0H = 0 h; 6H = 6 h and 24H = 24 h of exposure to air.
Agronomy 12 01927 g004
Figure 5. Box plots representing alpha diversity through the Simpson (A) and Chao 1 (B) uniformity index. T1 = 100% cactus forage; C100 = 100% cactus forage; C60 = 60% cactus forage and 40% buffel grass hay; C20 = 20% cactus forage and 80% buffel grass hay; 0H = 0 h; 6H = 6 h and 24H = 24 h of exposure to air.
Agronomy 12 01927 g005
Figure 6. Relative abundance of the main bacterial phyla of cactus forage and buffel grass hay levels at different times of exposure to air. C100 = 100% cactus forage; C60 = 60% cactus forage and 40% buffel grass hay; C20 = 20% cactus forage and 80% buffel grass hay; 0H = 0 h; 6H = 6 h and 24H = 24 h of exposure to air.
Agronomy 12 01927 g006
Figure 7. Relative abundance of the main bacterial families of cactus forage and buffel grass hay levels at different times of exposure to air. C100 = 100% cactus forage; C60 = 60% cactus forage and 40% buffel grass hay; C20 = 20% cactus forage and 80% buffel grass hay; 0H = 0 h; 6H = 6 h and 24H = 24 h of exposure to air.
Agronomy 12 01927 g007
Figure 8. Relative abundance of the main bacterial genera of cactus forage and buffel grass hay levels at different times of exposure to air. T1 = 100% cactus forage; T4 = 60% cactus forage and 40% buffel grass hay; T5 = 20% cactus forage and 80% buffel grass hay; 0H = 0 h; 6H = 6 h and 24H = 24 h of exposure to air.
Agronomy 12 01927 g008
Table 1. Chemical composition of cactus forage and buffel grass hay.
Feeds, g/kg DMCactus ForageBuffel Grass Hay
Dry matter 166.41867.44
Organic matter918.59929.52
Crude protein78.3349.41
Ether extract15.6810.76
aNDFom-NDF 2382.82821.23
Lignin (sa) 318.4248.62
NFC 4441.7748.11
1 g/kg as natural matter; 2 neutral detergent fiber assayed with a heat-stable amylase and expressed exclusive of residual ash; 3 lignin determined by solubilization of cellulose with sulfuric acid; 4 non-fiber carbohydrates.
Table 2. Mean values of internal temperature (IT), surface temperature (ST), potential of hydrogen (pH), and Escherichia coli population as a function of cactus forage levels and time of exposure to air.
ItemCactus Forage Levels %Time, HoursOverall Average (C)p-Value 1p-Value 2
0361224CTC × TT
LQ
IT, °C2028.6030.9826.6828.8827.2230.47<0.001<0.001<0.001<0.0010.397
6026.5829.2831.8228.6428.8429.03<0.001<0.001<0.001<0.0010.044
8025.0030.5029.4432.6429.0429.32<0.001<0.001<0.001<0.001<0.001
9025.0227.9627.0029.4428.8427.65<0.001<0.001<0.0010.0360.001
10024.7627.5427.4028.7427.2227.13<0.001<0.001<0.0010.6790.163
Overall Average (T)25.9929.2528.4731.6728.23
ST, °C2028.1630.6029.4627.7627.9828.79<0.001<0.001<0.001<0.0010.682
6026.3827.5231.0428.3227.5628.16<0.001<0.001<0.001<0.0010.848
8024.5229.5228.8831.7627.5428.44<0.001<0.001<0.001<0.001<0.001
9024.5827.2826.8829.1228.0827.19<0.001<0.001<0.001<0.0010.001
10024.3026.6027.0028.5626.7626.64<0.001<0.001<0.0010.1210.493
Overall Average (T)25.5928.3028.6529.1027.58
pH207.177.386.946.316.396.84<0.001<0.001<0.001<0.0010.923
606.356.947.037.066.416.76<0.001<0.001<0.001<0.001<0.001
806.286.926.966.436.166.55<0.001<0.001<0.001<0.001<0.001
906.356.416.786.496.476.50<0.001<0.001<0.001<0.001<0.001
1005.705.945.995.925.905.89<0.001<0.001<0.001<0.001<0.001
Overall Average (T)6.376.726.746.446.276.51
Escherichia coli (Log CFU 3/g)
200.000.009.728.778.645.43<0.001<0.001<0.001<0.001<0.001
607.479.289.658.918.998.86<0.001<0.001<0.001<0.001<0.001
807.049.069.518.618.198.48<0.001<0.001<0.001<0.0010.026
906.798.699.309.138.838.55<0.001<0.001<0.0010.0290.170
1006.478.349.169.059.028.41<0.001<0.001<0.0010.2030.144
Overall Average (T)5.557.079.478.898.73
1 C = cactus forage levels; T = time (hours); C × T = interaction of cactus forage levels × time. 2 L = linear effect; Q = quadratic effect. 3 CFU = colony-forming unit. Standard error of mean (SEM): C = 0.13; T = 0.12; pH = 0.01; Escherichia coli = 0.14. Significance level of 5%.
Table 3. Dry matter (DM), crude protein (CP), soluble carbohydrates (CHOs), ammonia nitrogen (N-NH3), and buffering capacity (BC) as a function of cactus forage levels and time of exposure to air as dry matter (DM).
ItemCactus Forage Levels %Time, HoursOverall Average (C)p-Value 1p-Value 2
0361224CTC × TT
LQ
Dry matter, g/kg20828.9810.4777.7727.6590.4747.0<0.001<0.001<0.0010.0000. 359
60432.1431.4431.1397.8388.1416.1<0.001<0.001<0.0010.0120.754
80280.7262.2239.1237.4226.9249.3<0.001<0.001<0.0010.0190.202
90148.0148.2148.3138.5136.1143.8<0.001<0.001<0.0010.0000.773
10066.465.864. 663.463.264.7<0.001<0.001<0.0010.0000.002
Overall Average (T)231.8227.0272.8312.9280.9
Crude protein, g/kg DM2050.349.348.949.357.551.1<0.001<0.0010.000<0.001<0.001
6057.455.353.353.954.554.9<0.001<0.0010.000<0.001<0.001
8061.160.659.064.264.361.8<0.001<0.0010.000<0.001<0.001
9065.164.263.967.272.566.6<0.001<0.0010.000<0.001<0.001
10078.376.475.877.779.077.3<0.001<0.0010.000<0.001<0.001
Overall Average (T)62.461.260.262.365.6
WSC 3, g/kg DM201.751.041.000.920.841.11<0.001<0.001<0.0010.0290.090
601.781.631.130.910.841.26<0.001<0.001<0.0010.0020.084
802.541.760.750.730.661.29<0.001<0.001<0.001<0.001<0.001
903.162.550.570.480.381.43<0.001<0.001<0.001<0.001<0.001
1006.053.740.760.660.542.35<0.001<0.001<0.001<0.001<0.001
Overall Average (T)3.062.140.840.740.65
NH3-N 4, %N total200.0100.0100.0100.0160.0100.011<0.001<0.001<0.0010.3810.267
600.0100.0100.0290.0200.0130.016<0.001<0.001<0.0010.7250.000
800.0230.0060.0160.0290.0200.019<0.001<0.001<0.0010.0570.891
900.0260.0130.0100.0530.0200.024<0.001<0.001<0.0010.0390.000
1000.0660.0200.0260.0130.0600.037<0.001<0.001<0.001<0.001<0.001
Overall Average (T)0.0270.0120.0180.0260.025
BC 5, mg/100 g DM200.0100.0100.0100.0100.0100.010<0.001<0.001<0.0010.9970.997
600.0100.0200.0100.0130.0160.014<0.001<0.001<0.0010.9970.825
800.0200.0300.0230.0200.0200.023<0.001<0.001<0.0010.0860.719
900.0360.0460.0430.0660.0600.050<0.001<0.001<0.001<0.001<0.001
1000.0900.1100.1160.1460.1760.128<0.001<0.001<0.001<0.001<0.001
Overall Average (T)0.0330.0430.0400.0510.056
1 C = cactus forage levels; T = time (hours); C × T = interaction of cactus forage levels × time. 2 L = linear effect; Q = quadratic effect. 3 WSC = water-soluble carbohydrates, 4 NH3-N = ammonia nitrogen, in percentage of total nitrogen 5 BC = buffering capacity. Standard error of mean (SEM): DM = 0.68; crude protein = 0.06; CHO = 0.12; N-NH3 = 0.001; TC = 0.001. Significance level of 5%. There was no interaction between cactus forage levels and time of exposure to air for EE, NDF, and NFC. The increase in cactus forage levels promoted a linear decrease in the EE and NDF contents and a linear increase in the NFC content (Table 4). In relation to the time of air exposure, there was a linear reduction in the EE content. There was no effect of time for NDF (p = 0.458) and NFC (p = 0.659), with mean values 659.38 g/kg and 110.68 g/kg, respectively.
Table 4. Ether extract (EE), neutral detergent fiber (NDF), and non-fiber carbohydrates (NFCs) as a function of cactus forage and time of exposure to air as dry matter (DM).
Item 1, g/kg DM Cactus Forage Levels %Time, HoursSEM 2p-Value 3p-Value 4
T
206080901000361224CTC × TLQ
EE16.621.816.511.515.720.619.917.414.110.10.11<0.001<0.0010.762<0.0010.372
FDN788.5768.5713.5647.0382.8667.6686.0655.8635.6651.91.95<0.0010.4580.4270.2780.335
NFC54.644.374.3106.5273.7102.892.3113.3132.6112.319.13<0.0010.6590.56950.4730.314
1 EE = ether extract; NDF = neutral detergent fiber; NFC = non-fiber carbohydrates; 2 SEM = standard error of mean; 3 C = cactus forage levels; T = time (hours); C × T = interaction of cactus forage levels × time. 4 L = linear effect of time; Q = quadratic effect of time. Significance level of 5%.
Publisher’s Note: MDPI stays neutral with regard to jurisdictional claims in published maps and institutional affiliations.