Article

Defense Response to Fusarium Infection in Winter Wheat Varieties, Varying in FHB Susceptibility, Grown under Different Nitrogen Levels

by
Magdalena Matić
1,
Rosemary Vuković
2,*,
Karolina Vrandečić
1,3,*,
Ivna Štolfa Čamagajevac
2,
Jasenka Ćosić
1,
Ana Vuković
2,
Krešimir Dvojković
4 and
Dario Novoselović
3,4
1
Faculty of Agrobiotechnical Sciences, Josip Juraj Strossmayer University of Osijek, Vladimira Preloga 1, 31000 Osijek, Croatia
2
Department of Biology, Josip Juraj Strossmayer University of Osijek, Cara Hadrijana 8/A, 31000 Osijek, Croatia
3
Centre of Excellence for Biodiversity and Molecular Plant Breeding (CoE CroP-BioDiv), Svetošimunska Cesta 25, 10000 Zagreb, Croatia
4
Department for Cereal Breeding and Genetics, Agricultural Institute Osijek, Južno Predgrađe 17, 31000 Osijek, Croatia
*
Authors to whom correspondence should be addressed.
Agronomy 2022, 12(8), 1746; https://doi.org/10.3390/agronomy12081746
Submission received: 15 June 2022 / Revised: 18 July 2022 / Accepted: 22 July 2022 / Published: 25 July 2022

Abstract

:
Fusarium head blight and inadequate nitrogen fertilization can cause numerous biochemical changes in wheat. The main aim of this study was to determine the effects of Fusarium inoculation and a broader range of different nitrogen fertilization on the defense response in the spikes of four wheat varieties, varying in FHB susceptibility. Total soluble phenolics content, activities of enzymes involved in phenol metabolism (PAL and PPO), and total antioxidant capacity were determined as indicators of defense response. In both growing seasons, Fusarium inoculation altered PHE content in wheat spikes, indicating involvement of PHE in the defense response to Fusarium attack. Increased PHE content in the partially resistant varieties (Apache and Graindor) indicates involvement of PHE in the defense response and better disease tolerance in the more resistant varieties. Breeding wheat varieties with enhanced PHE synthesis could be a promising strategy to control FHB. To the best of our knowledge, this is the first study that emphasizes the effects of Fusarium infection and a broader range of different nitrogen fertilization on PHE and enzymes involved in PHE metabolism. In addition, this is the first study using the FRAP method to determine the antioxidant capacity of wheat tissues under the influence of Fusarium infection and different nitrogen fertilization.

1. Introduction

Fusarium head blight (FHB) is one the most extensively studied fungal diseases of wheat and other small grain cereals because of its impact on yield and quality, but more importantly because of its potential to produce mycotoxins, that are harmful to humans and animals [1]. Yield losses in wheat production occur due to the sterility of infected florets or because the grains obtained from the infected spikes become small, shriveled, and light in test weight. Among the numerous Fusarium mycotoxins, deoxynivalenol (DON) and zearalenone (ZEA) are the most abundant and most studied mycotoxins [2]. The intensity and severity of FHB infection and mycotoxin contamination are strongly influenced by meteorological conditions during the growing season [3,4]. Therefore, the severity of the infection and mycotoxin concentrations vary considerably from year to year. Wheat is most susceptible to FHB infections at the flowering stage, and the overlap of the flowering stage with humid weather conditions favors the development of the disease and mycotoxin accumulation [5,6,7]. Fusarium graminearum and Fusarium culmorum are among the most common species causing FHB in Europe, but their prevalence may vary throughout the growing season [8]. F. graminearum has been associated with warmer and humid conditions, while F. culmorum occurs in niches with cooler and humid conditions [9].
During the life cycle, plants produce many different secondary metabolites that play essential roles in plant growth, signal transduction, and response to stress conditions. The most abundant and important secondary metabolites are phenolic compounds. Phenolics are aromatic compounds with one or more hydroxyl groups attached to the aromatic benzene ring. Phenolics are classified, mainly according to the differences in their chemical structure, into flavonoids, phenolic acids, tannins, stilbenes, and lignans [10]. In plants, phenolics can be divided into two groups: the preformed phenolics, which are synthesized during normal development, and the induced phenolics, which are synthesized in response to various abiotic and biotic stress conditions [11]. Concerning the biotic stress, pathogen attack causes a multitude of biochemical changes in plants associated with stress signaling and activation of defense mechanisms, including various non-enzymatic components that include phenolic compounds, flavonoids, lignins, tannins, phytoalexins, and enzymes for phenol metabolism such as phenylalanine ammonia-lyase (PAL; EC 4.3.1.24) and polyphenol oxidase (PPO; EC 1.14.18.1) [12]. Due to their chemical structure, phenolic compounds have strong antioxidant and antiradical activity expressed by various mechanisms [12,13,14]. Different assays can measure the antioxidant and antiradical activity of phenolic compounds, although ferric reducing antioxidant power assay (FRAP) has proven to be a useful method for screening the total antioxidant capacity (TAC) of different phenolic compounds [15].
The phenylpropanoid pathway provides precursors for a wide range of phenolic compounds and is an important regulation point between primary and secondary plant metabolism [16]. PAL is the primary enzyme in the phenylpropanoid pathway that catalyzes the deamination of L-phenylalanine to trans-cinnamic acid, thus providing precursors for the synthesis of several defense-related secondary compounds such as phenols, lignin, and salicylic acid [17]. The accumulation of phenolics in plant tissues is considered to be the first response to various internal and external factors such as trauma, wounding, drought, and pathogen attack [18].
The accumulated phenolics can be oxidized to antimicrobial quinones by the action of PPO, a copper-containing enzyme that catalyzes the oxidation of phenolics, using molecular oxygen as an electron acceptor. Plant PPOs are involved in numerous biological functions, including enzymatic browning of crops and their end products [19], a defense mechanism against plant pathogens, and detoxification of reactive oxygen species (ROS) [20,21,22]. Increased synthesis and activity of PPO can be used as a biochemical marker of the degree of resistance and/or susceptibility of plants to various negative abiotic and biotic stress conditions [19,20,23].
Nitrogen plays an important role in wheat production as a key nutrient for growth, development, high crop yields, and quality [24]. The role of nitrogen in plant growth and development is irreplaceable as it is a major component of plant cells, proteins, nucleic ac-ids, enzymes, and photosynthetic pigments. Nitrogen can alter a plant’s biochemical de-fence response and increase susceptibility to various pathogens, although its role in host–pathogen interactions is still extremely complex [25]. There are conflicting results in the literature regarding the effect of N fertilization on FHB severity and incidence. Some studies found that an increase in nitrogen supply may lead to an increase in FHB occurrence and mycotoxin concentrations [26,27], while other studies reported that FHB was more severe under partial nitrogen deficiency condition [28]. The different response of the plant to different nitrogen fertilizations may be due to the use of different forms of nitrogen, and the effect of specific forms of nitrogen on disease severity depends on many factors and is not the same for all plant–pathogen interactions [29].
It is known that various abiotic and biotic stress conditions cause numerous biochemical changes in wheat. During pathogen attacks, plants employ various defense strategies to combat stress conditions. In our previous studies, we investigated the effects of Fusarium inoculation under two levels of nitrogen fertilization on antioxidant defense response, measuring the activities of antioxidant enzymes (catalase, ascorbate peroxidase, glutathione reductase), PHE, and chloroplast pigments content [30,31]. In the present study, due to their importance in the defense response to various types of stress, PHE and enzymes related to phenolics metabolism (PAL and PPO), as well as total antioxidant capacity of wheat tissues, were investigated. In addition, the present study included a broader range of different nitrogen fertilization, and the experiment was conducted during two growing seasons to gain insight into the influence of climatic conditions. The aims of this study were: (i) to determine the effect of nitrogen fertilization and climate conditions on FHB severity, (ii) to determine and focus on the effects of Fusarium inoculation and a broader range of different nitrogen fertilization on PHE content and enzymes involved in phenol metabolism (PAL and PPO), (iii) to determine the variety-specific defense response, and (iv) to find a parameter that could serve as a good biomarker for breeding more resistant wheat varieties to the studied stress conditions. To the best of our knowledge, this is the first study that emphasizes the effects of Fusarium infection and a broader range of different nitrogen fertilization on PHE and enzymes involved in PHE metabolism. In addition, this is the first study using the FRAP method to determine the antioxidant capacity of wheat tissue under the influence of Fusarium infection and different nitrogen fertilization.

2. Materials and Methods

2.1. Field Trial

A field trial with four winter wheat varieties was set up during two consecutive growing seasons, 2018/2019 and 2019/2020, in the experimental field of the Agricultural Institute Osijek (45°33′ N and 18°40′ E). Four winter wheat varieties were selected based on their varying levels of susceptibility to FHB: Srpanjka (very early maturity, short statured variety and moderately susceptible to Fusarium sp., the most widespread variety in Croatia until the year 2014), Sofru (early type maturity, high-yielding and susceptible to Fusarium sp., the second most widespread variety in Croatia today), Apache (medium type maturity, very adaptable and stable variety with excellent resistance to Fusarium sp.), and Graindor (medium to late type of maturity, high yielding and excellent resistance to Fusarium sp.). The experiment was set up in a split-split-plot factorial design in two replicates with nitrogen fertilization levels as main plots and four wheat varieties as sub-plots, and Fusarium infection was applied at a sub-sub-plots level. Basic fertilization of 74 kg N ha−1, 80 kg P2O5 ha−1, and 120 kg K2O ha−1 was the same for all plots and was applied by adding 100 kg ha−1 of urea (46% N; 100% of amide-N form) and, before the planting, adding 400 kg ha−1 NPK (7:20:30; 8.5% of ammonium-N and 6.5% of nitrate-N forms). Nitrogen treatments consisted of a different level of nitrogen supplementation applied manually as a top-dressing with KAN fertilizers (27% N) during tillering (Zadok’s scale 23–25) and stem extension (Zadok’s scale 33–35) growth stages at rates of 0, 35, 70, and 140 kg N ha−1 per treatment (Table 1). KAN fertilizers contain two forms of nitrogen (13.5% of ammonium-N and 13.5% of nitrate-N). Within each subplot, 50 wheat spikes were randomly selected for inoculation and 50 spikes were left to natural infection. Inoculated and non-inoculated wheat spikes were spatially separated within the subplot. Thus, a total of 32 subplots and 64 sampling sites was established. The soil type was Eutric Cambisol and the size of the experimental plot was 7.56 m2. The previous crop for both growing seasons was soybean, and the cereals were grown in the experimental field every second year. All other cultural practices, including the use of herbicides, insecticides, and fungicides to control major weeds, insects, and foliar diseases, were typical for commercial wheat production in Croatia.

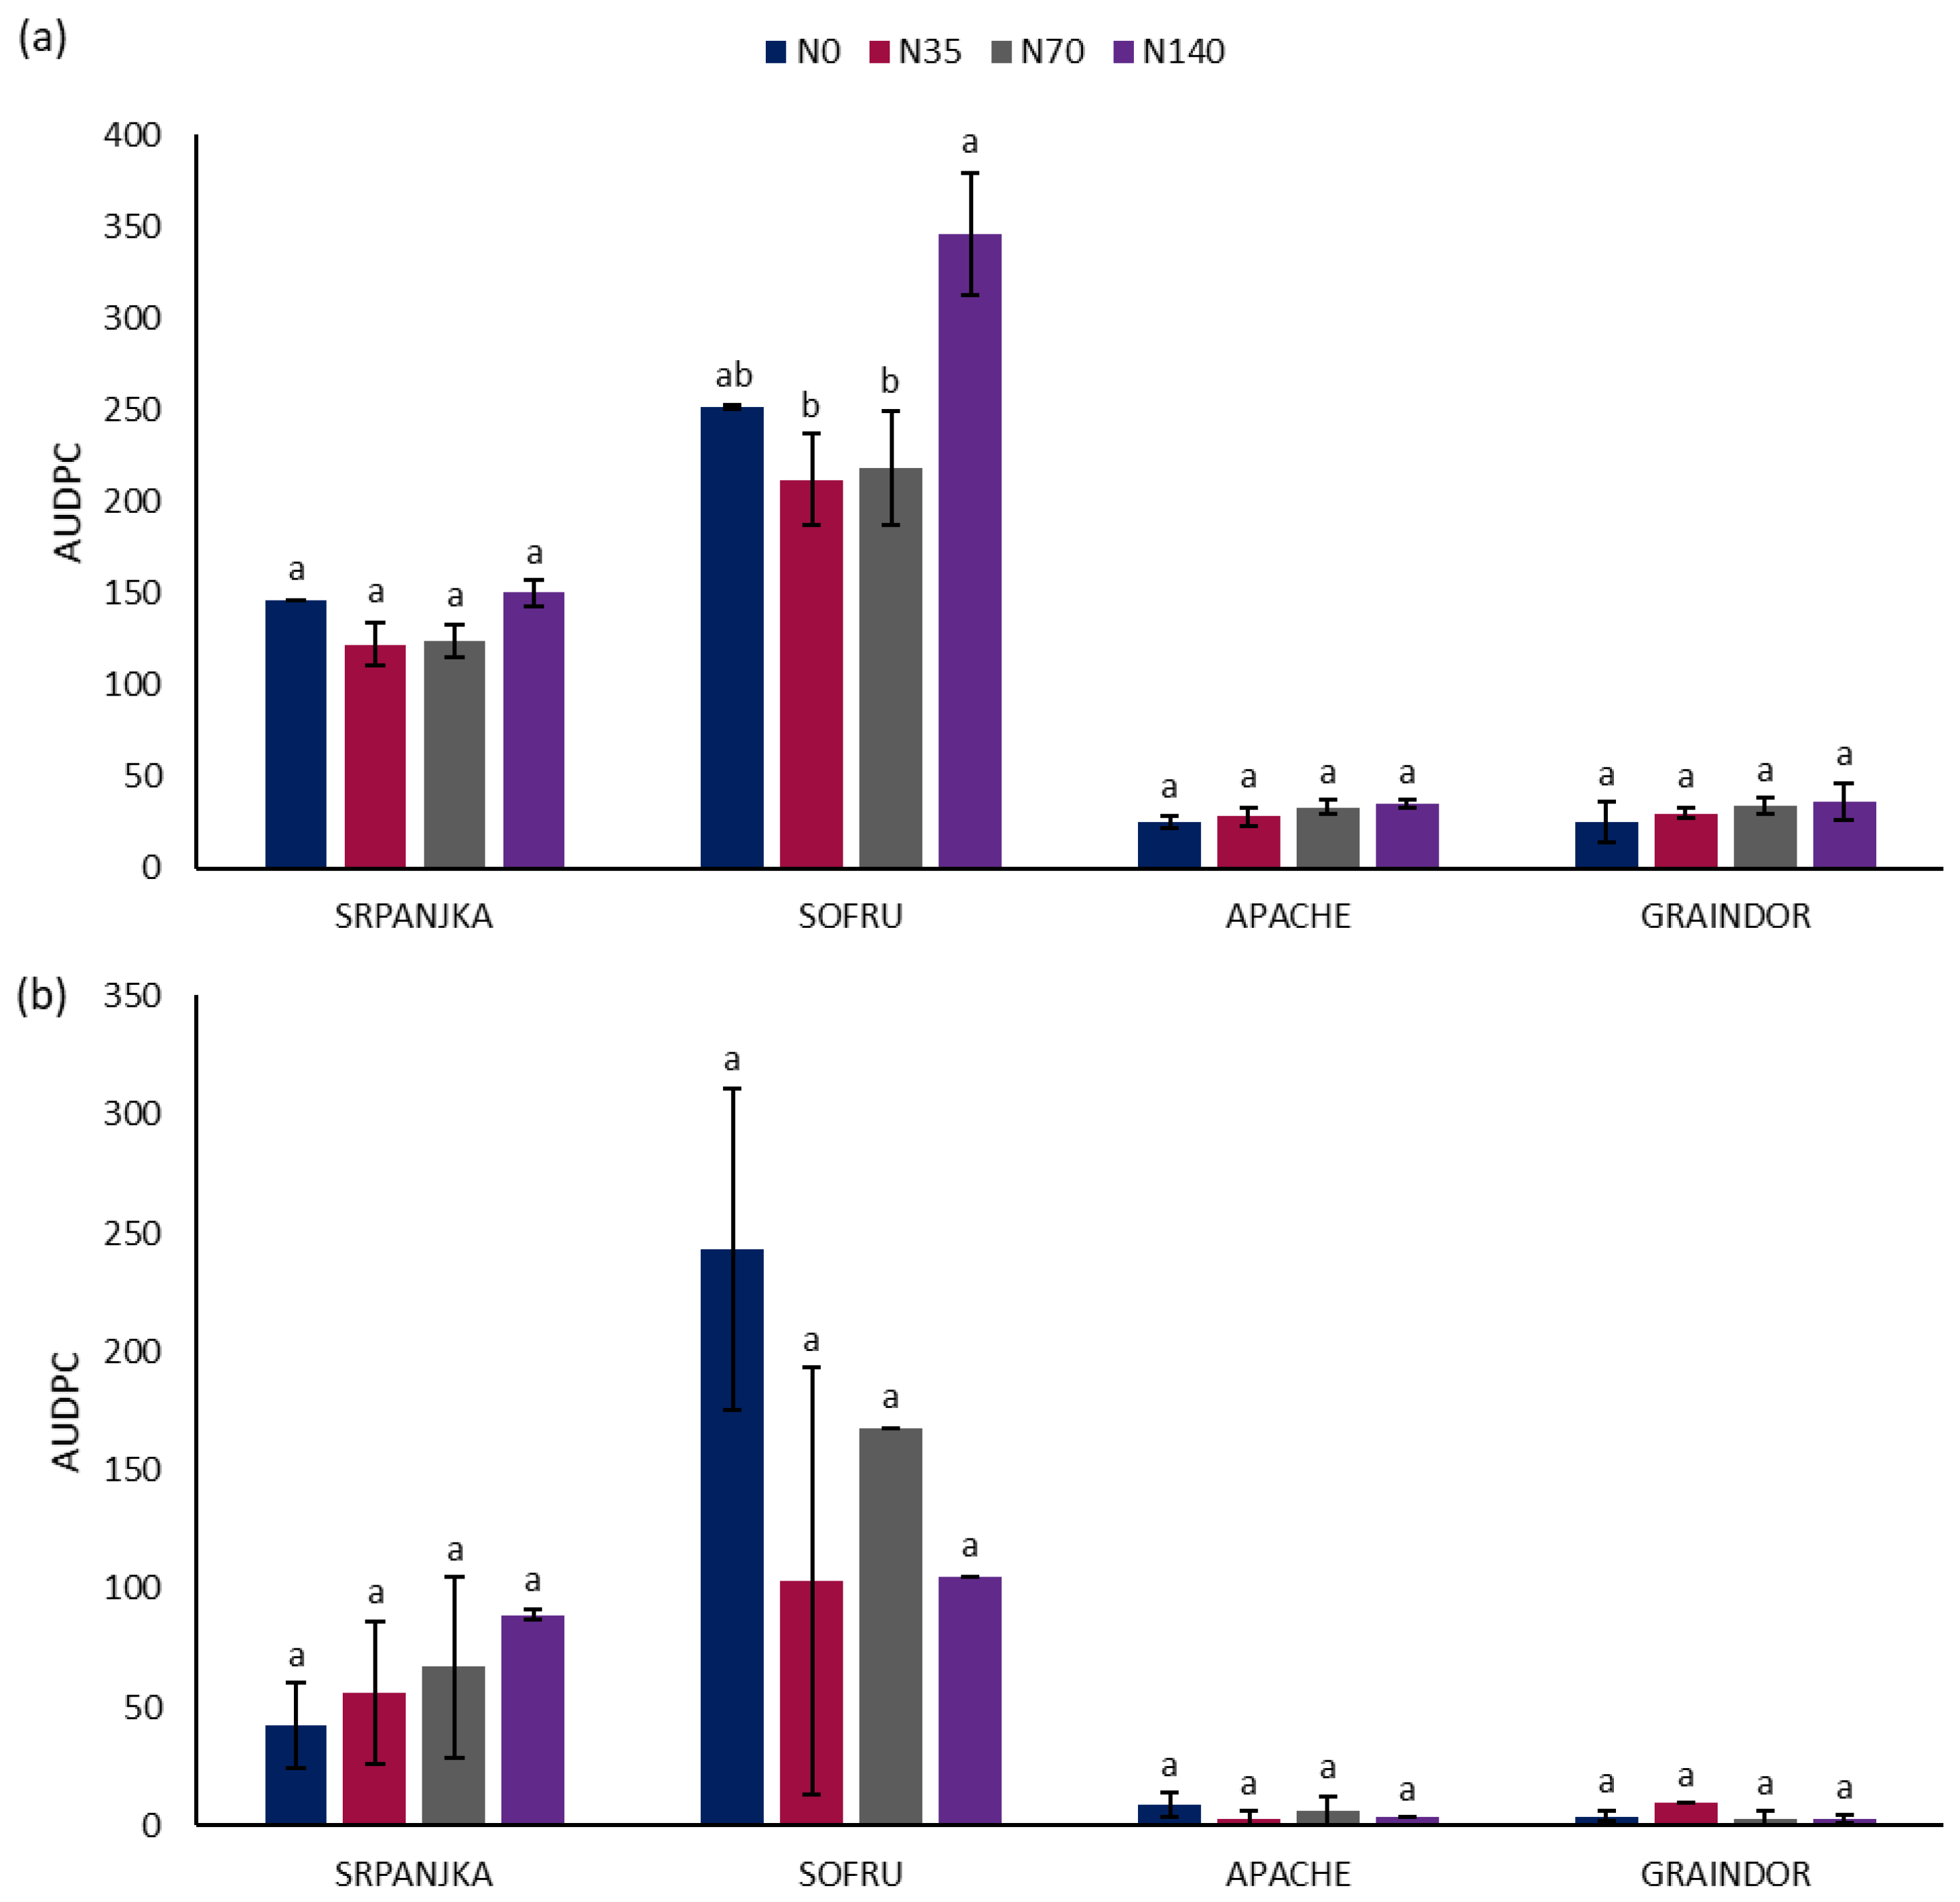
2.2. Inoculum Production, Inoculation Procedure, and FHB Evaluation

A conidial suspension of two species of the genus Fusarium, F. graminearum (IFA 65) and F. culmorum, was used for wheat infection. The slightly modified method of Snijders and Van Eeuwijk was used to prepare the inoculum [32]. A mixture of wheat and oats (2:1, v/v) was soaked in water overnight, and the next day the excess water was decanted and the mixture was autoclaved. After autoclaving at 120 °C for 20 min, the mixture was inoculated with F. graminearum conidia (IFA 65). The inoculated grains were incubated at 25 °C for two weeks and then in the refrigerator (4 °C) for three weeks to promote conidia formation. After incubation, conidia were washed with sterile H2O and counted under a microscope using a Bürker–Türk chamber. The same procedure was repeated to obtain a conidial suspension of F. culmorum. The conidia concentration in the suspension used for inoculation was adjusted to 1 × 10⁶ mL−1.
For each variety, 50 wheat spikes were randomly selected for inoculation and 50 spikes were left to natural infection. Hand sprayer inoculation with Fusarium suspension was performed individually on each variety when 50% of the plants per plot had reached anthesis (Zadok’s scale 65). Inoculations were performed in the morning and were repeat-ed after 48 h. To maintain optimal humidity for infection, spikes were covered with plastic bags for 48 h. FHB severity (percentage of infected spikelets per spike) was assessed using a linear scale (0–100%) on days 10, 14, 18, 22, 26, and 30 after the inoculation. The area under the disease progress curve (AUDPC) for FHB severity, expressed as general resistance, was calculated.

2.3. Sample Preparation and Measurements

Wheat spikes for measuring the soluble phenolic content, total antioxidant capacity (TAC), and the activities of the enzymes involved in phenol metabolism (PAL and PPO) were sampled 7 days after inoculation. Eight biological replicates were taken, and each replicate consisted of four wheat spikes. The collected samples were immediately frozen in liquid nitrogen and stored at −80 °C. The wheat spikes were ground using a TissueLyser (Qiagen Retsch GmbH, Hannover, Germany) for 1 min at 30 Hz. The obtained fine powder was weighed into microtubes for further analysis.

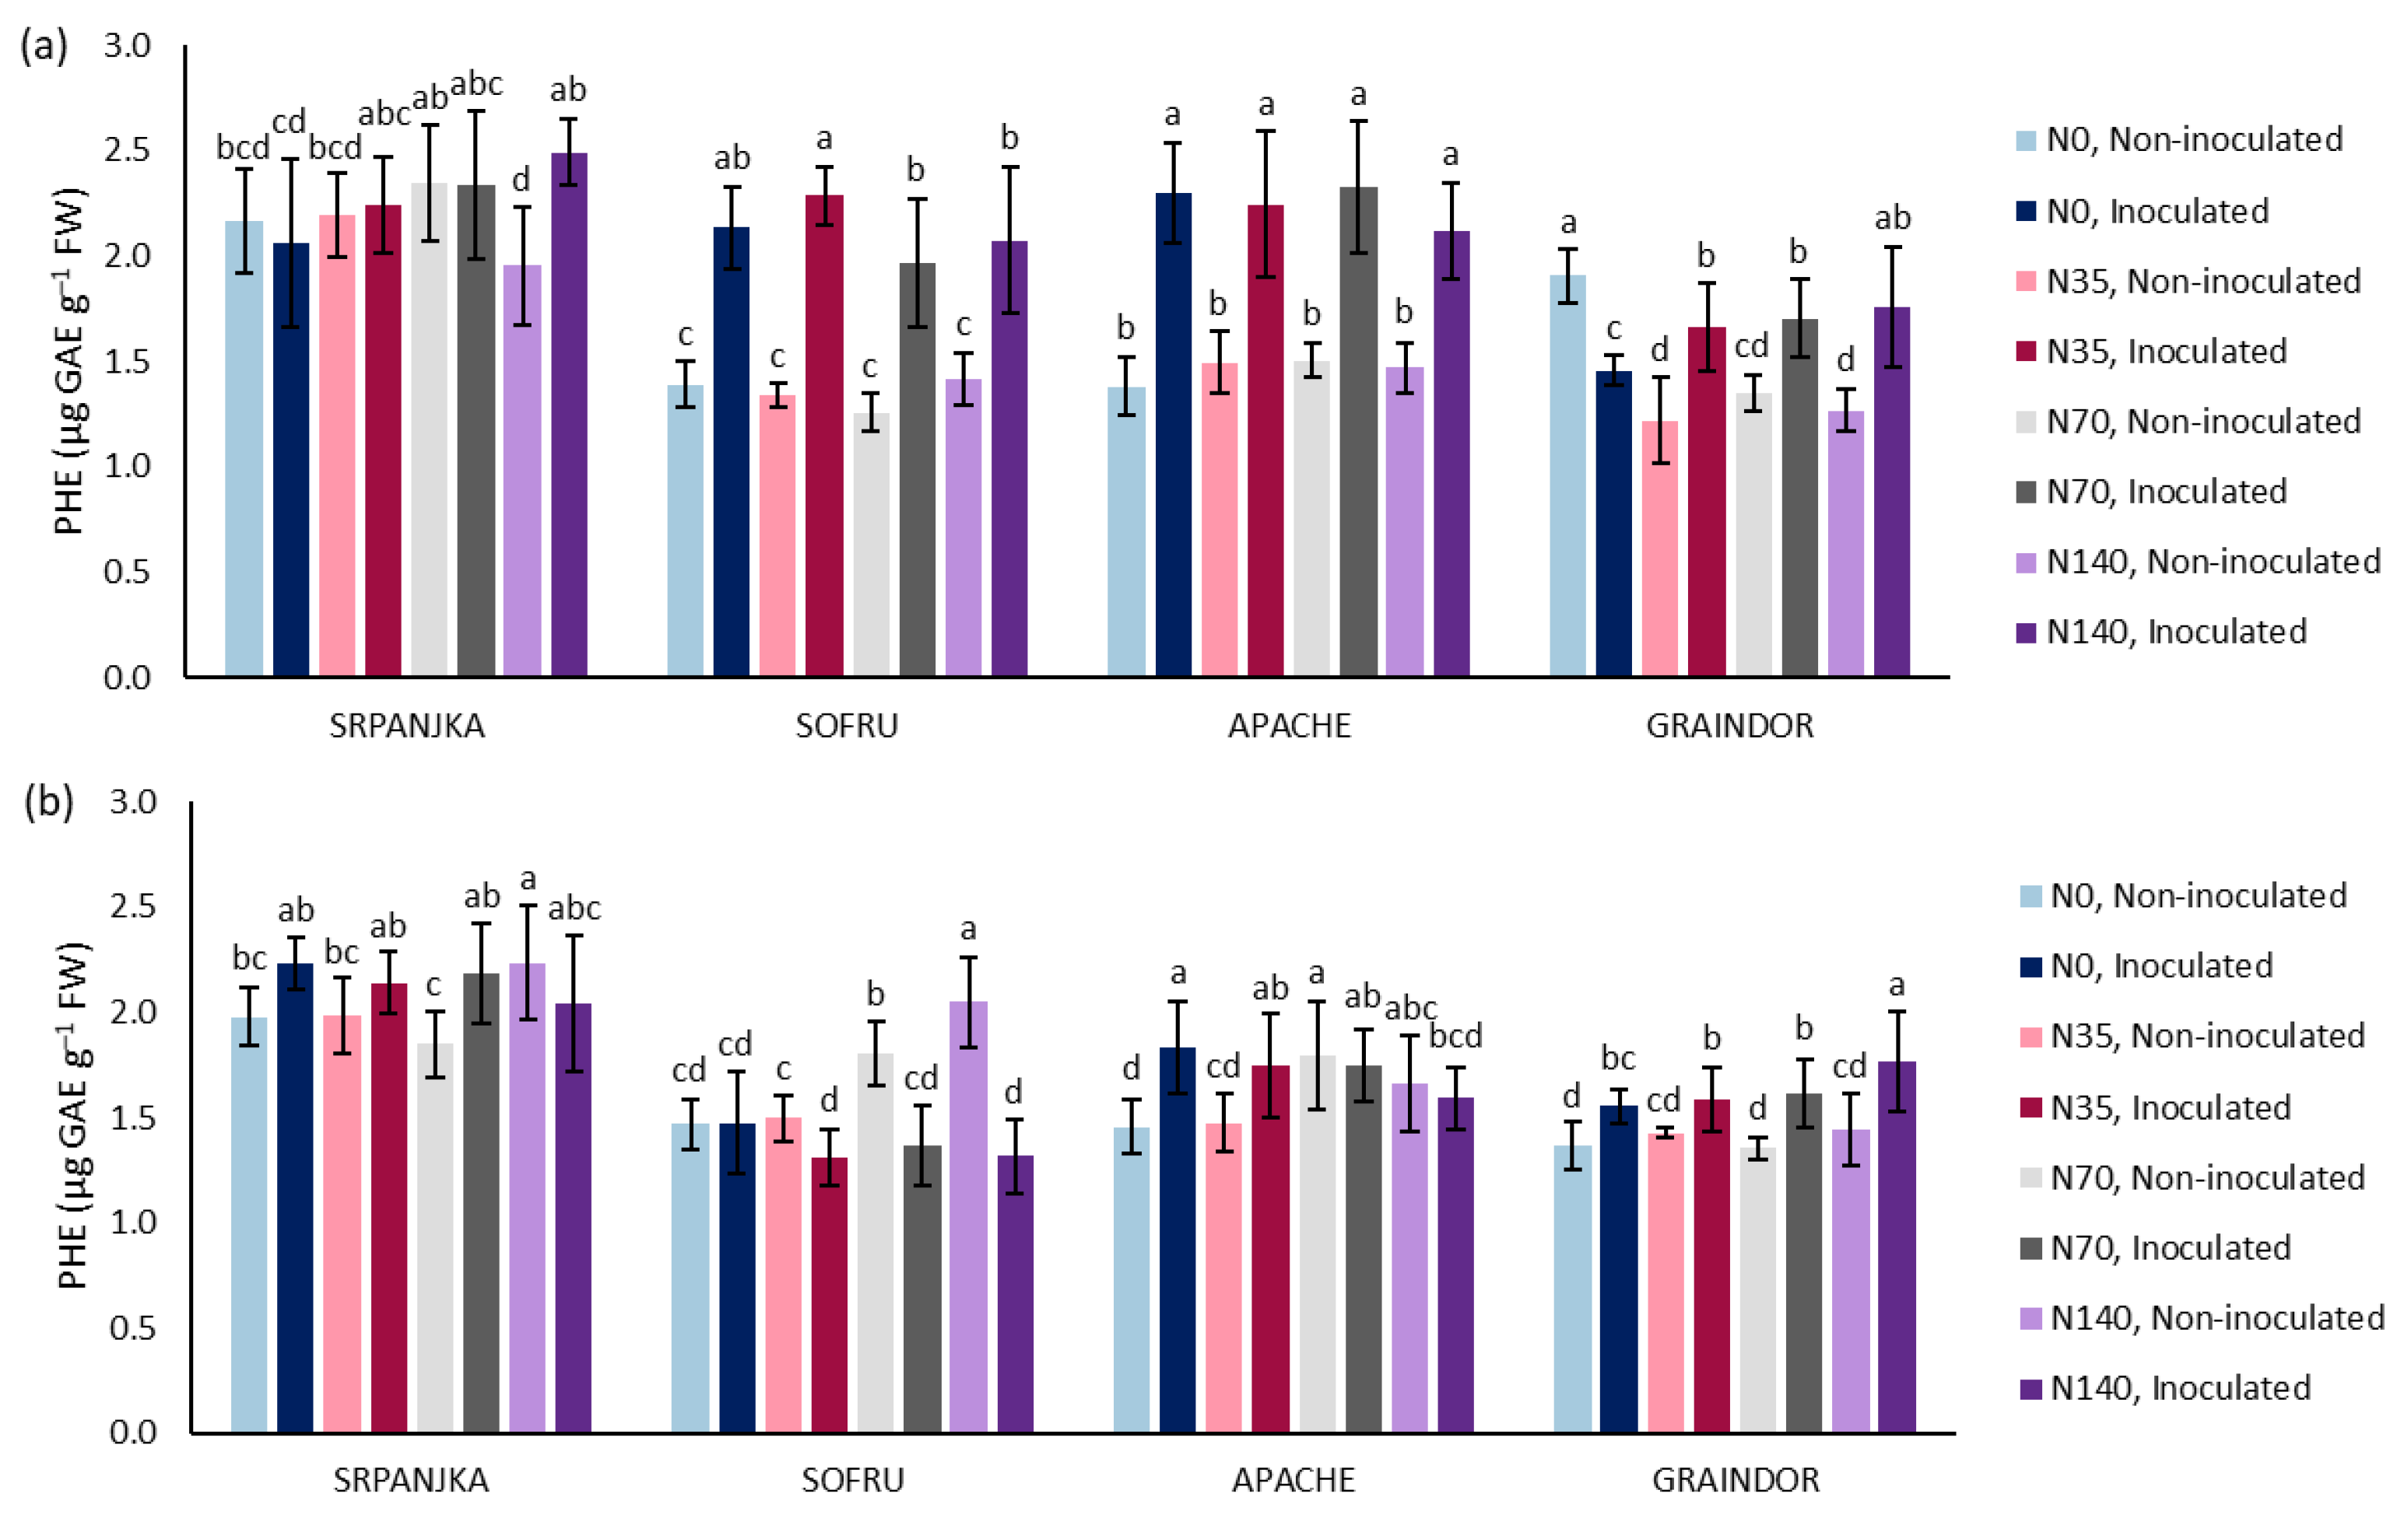
2.4. Determination of the Soluble Phenolic Content

Powdered wheat tissue was homogenized on ice with 1 mL of 80% ethanol (1:10, w/v), and phenolic compounds were extracted in a water bath at 80 °C for 30 min. After extraction, the samples were centrifuged at 21,000× g at 4 °C for 10 min, and the supernatant was used for further measurements. The soluble phenolic content was determined by the Folin–Ciocalteu method [33]. The reaction mixture contained 20 µL of the sample, 1.58 mL of H2O, 100 µL of Folin–Ciocalteu reagent, and 300 µL of the saturated Na2CO3 solution. The reaction mixture was incubated in a water bath at 37 °C for 60 min, after which the absorbance was measured at 765 nm. Soluble phenolic content was calculated from a standard curve using gallic acid as a standard and expressed as microgram gallic acid equivalents (GAE) per gram of fresh weight (µg GAE g−1 FW).

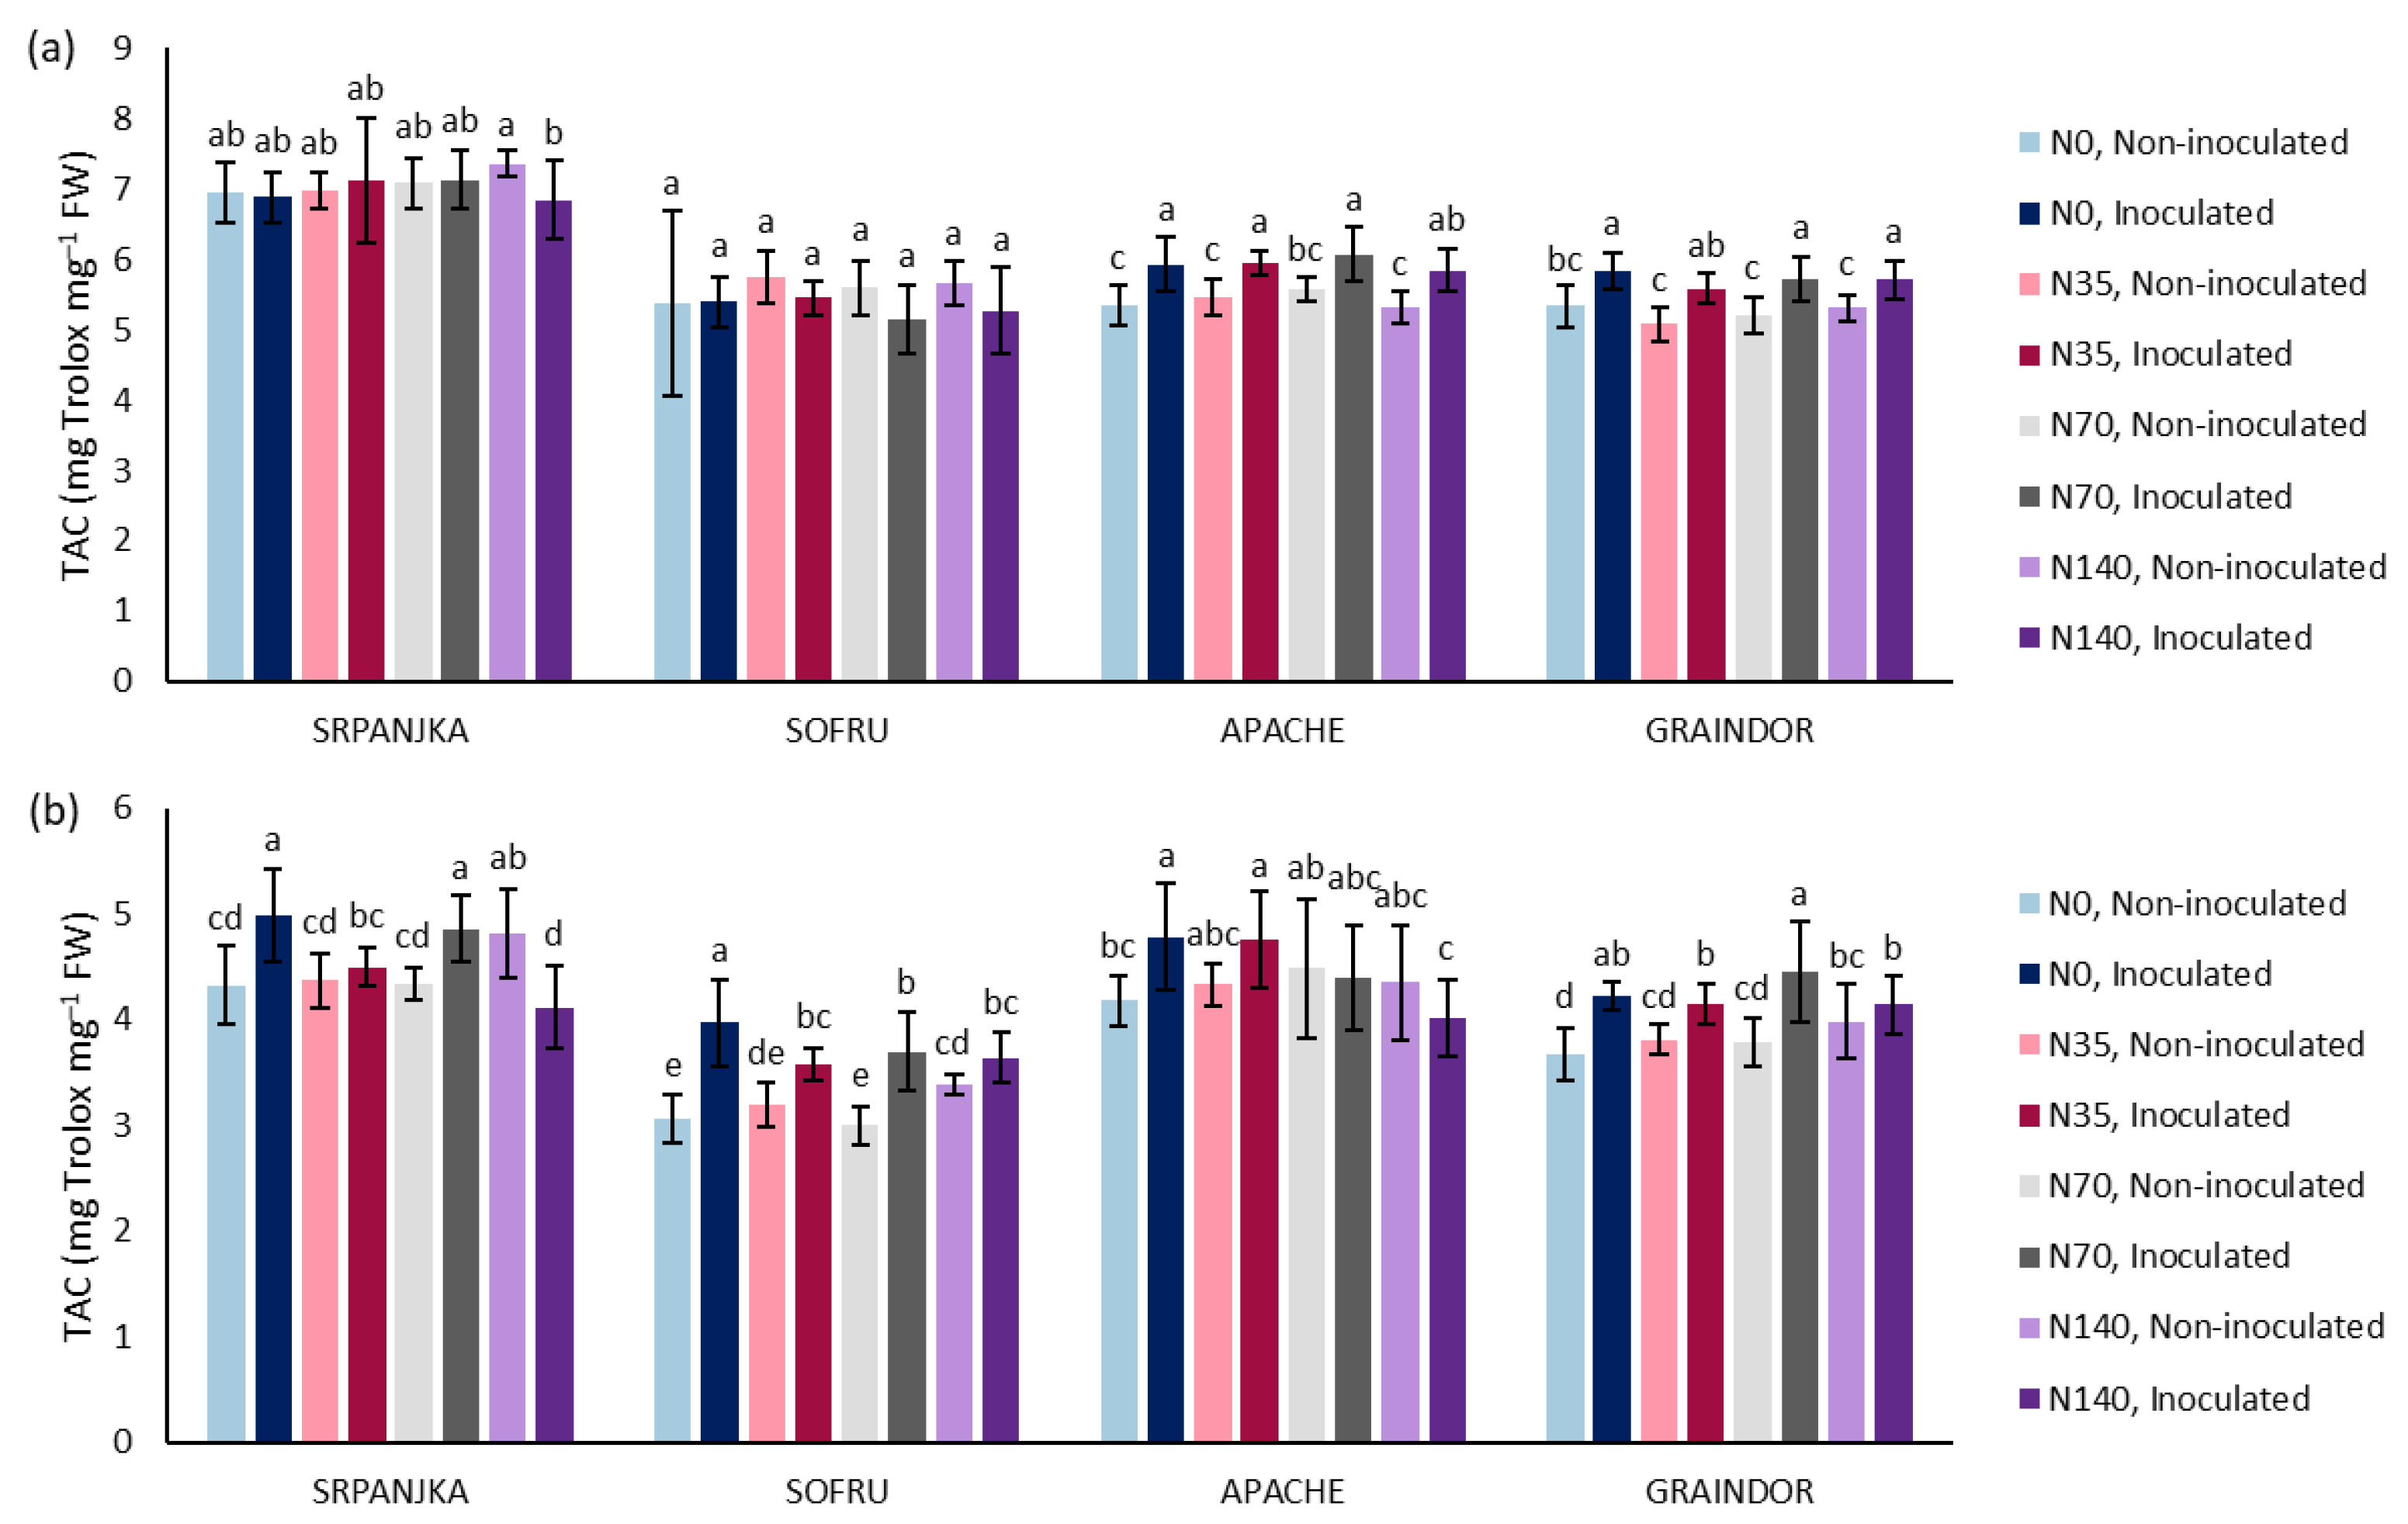
2.5. Determination of Total Antioxidant Capacity (TAC)

The TAC of wheat spikes tissue was determined using the ferric reducing antioxidant power (FRAP) assay according to Benzie and Straint, modified for microplate assay [34]. A FRAP assay was performed in 96-well plates with the FRAP reagent comprising 300 mM of sodium acetate buffer solution, pH 3.6, 10 mM TPZT in 40 mM HCl, and 20 mM FeCl3 hexahydrate. Each sample was tested in triplicate. Absorbance was recorded using a Tecan Spark microplate reader at 593 nm after 3.5 min incubation at room temperature. Antioxidant capacity was calculated from a standard curve using 10 mM Trolox as a standard. Results were expressed as the FRAP value in milligram equivalents of Trolox per milligram of fresh weight (mg Trolox mg−1 FW).

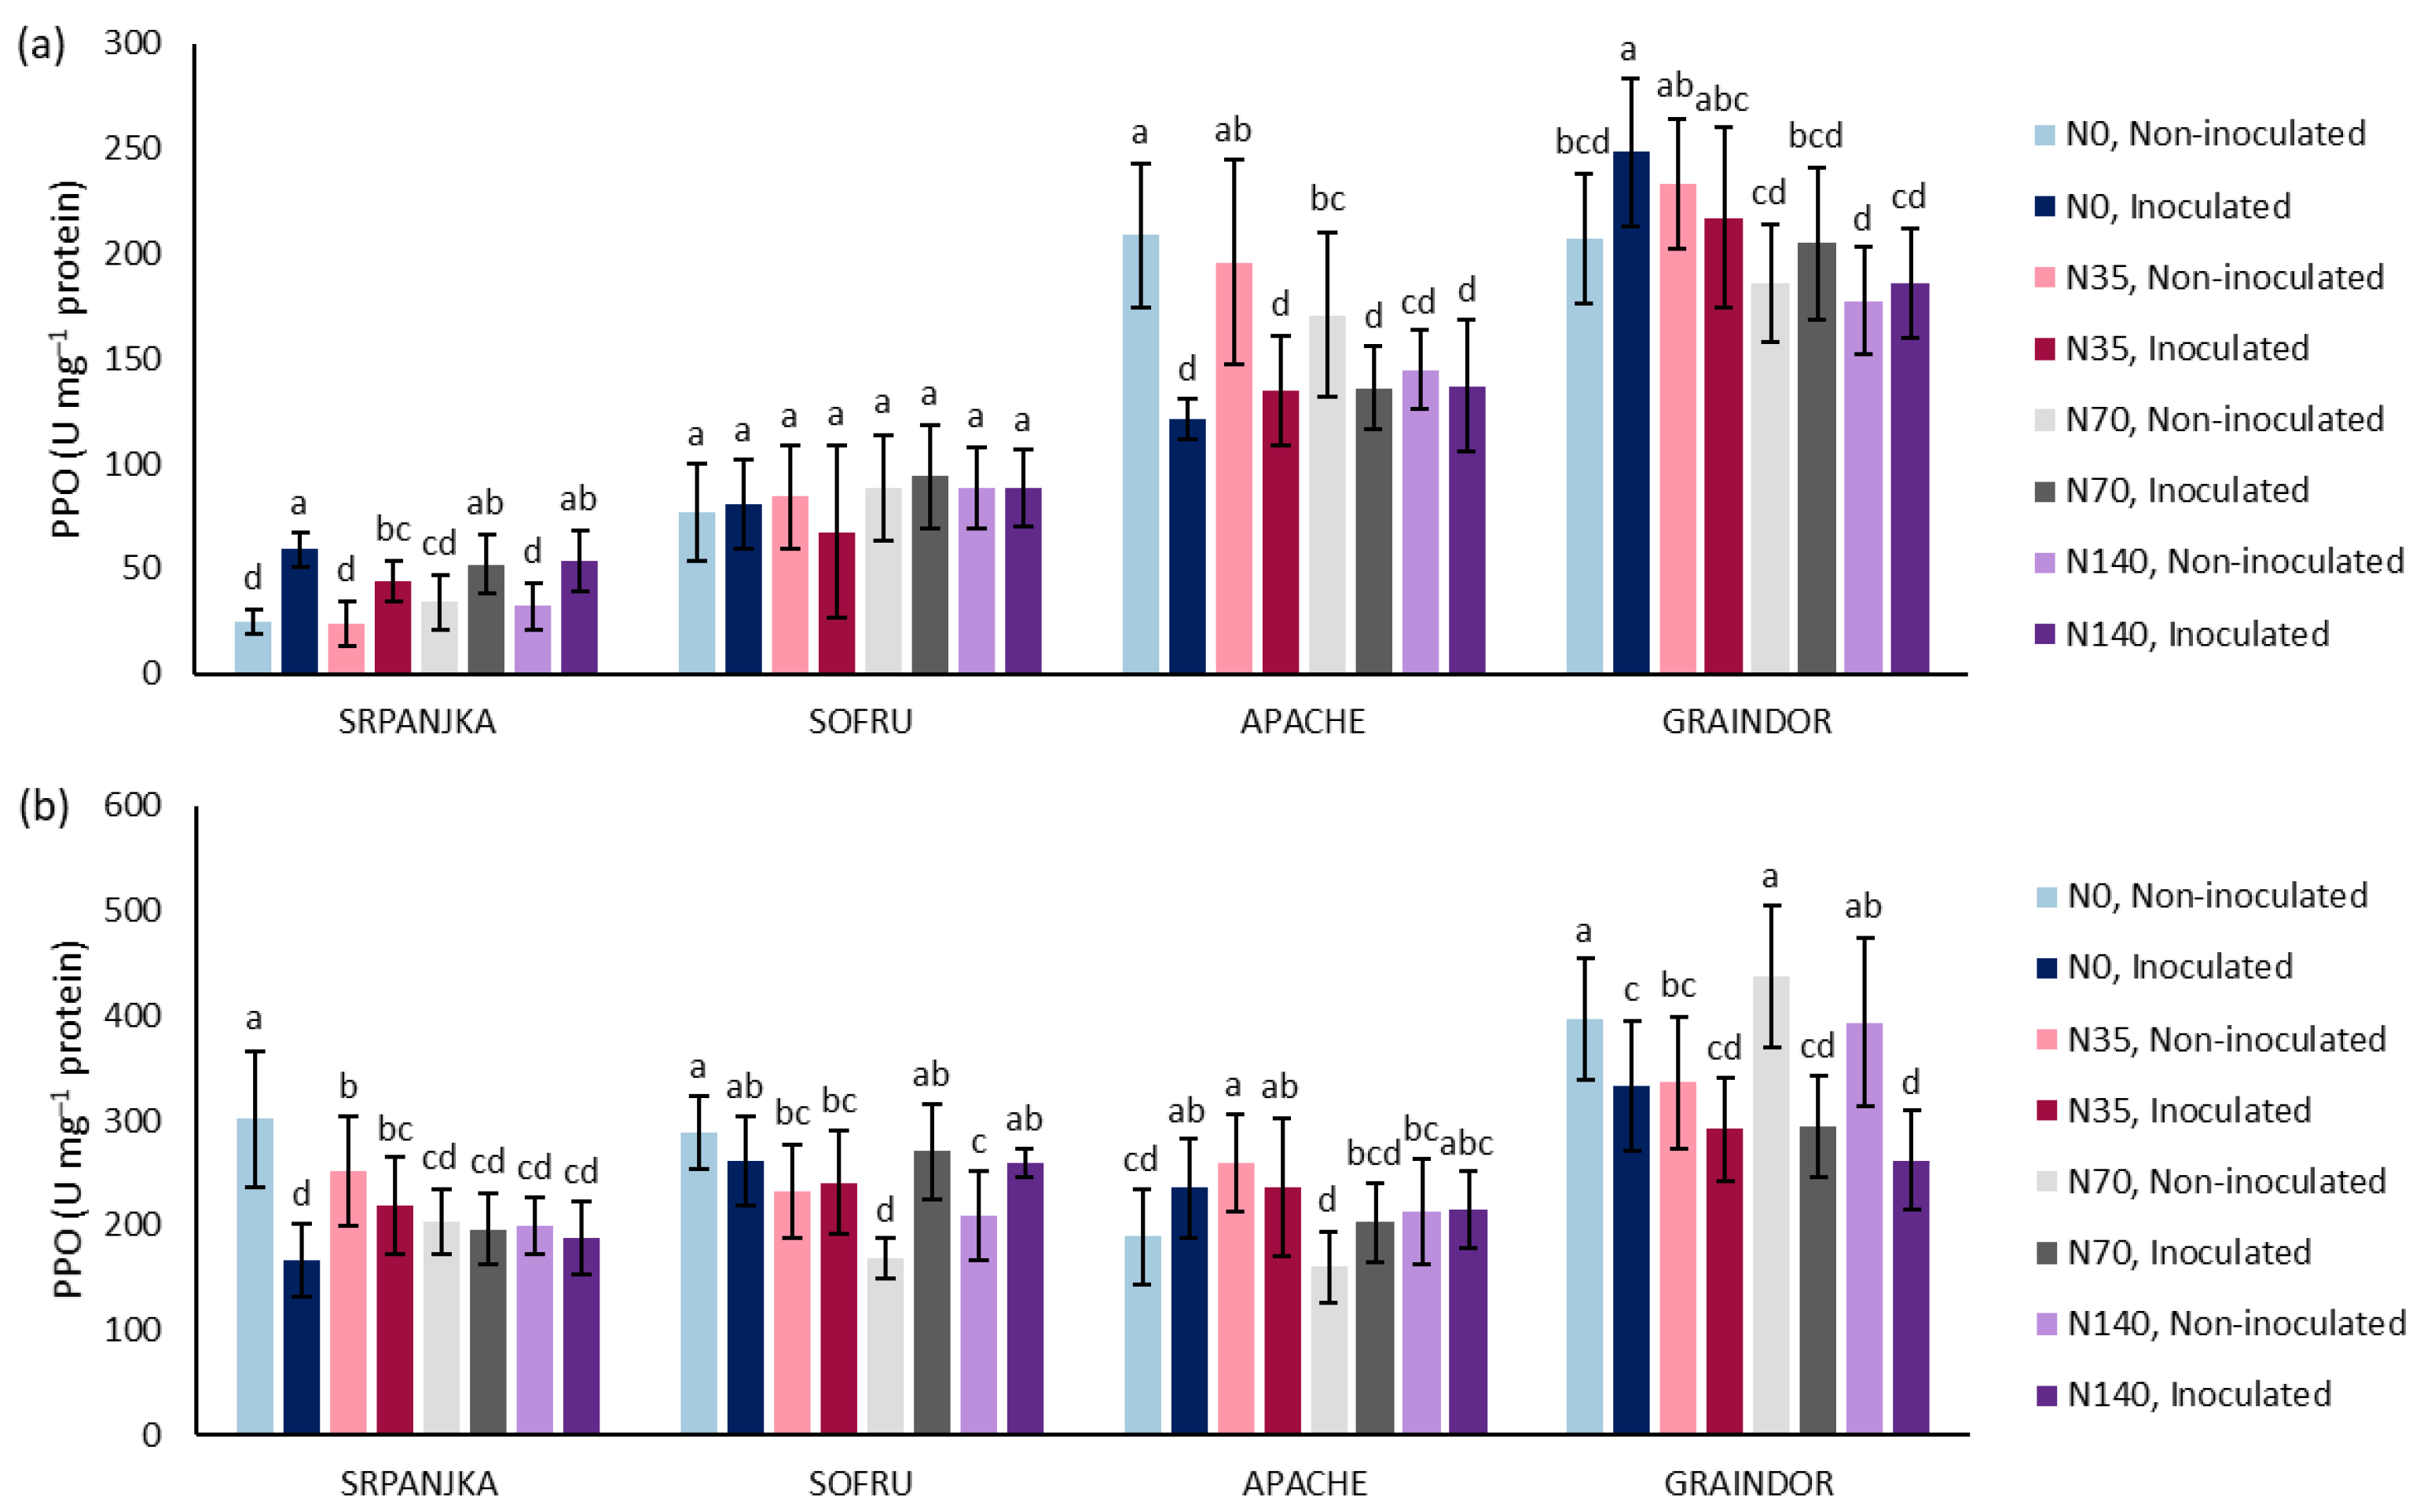
2.6. Determination of PPO and PAL Activities

Protein extracts for enzyme activity determination were prepared by homogenizing wheat spike tissue powder with different extraction buffers (1:5, w/v). For PPO extraction, 100 mM potassium phosphate buffer, pH 7.0 (1:5, w/v), containing 1 mM ethylenediaminetetraacetic acid (EDTA) and 0.2% (w/v) polyvinylpyrrolidone was used, while 150 mM Tris–HCl buffer, pH 8.5, containing 0.2% (w/v) polyvinylpyrrolidone was used for PAL extraction. The homogenized samples were then centrifuged at 21,000× g at 4 °C for 15 min, and the supernatants were used for the spectrophotometric determination of the enzymes PPO and PAL.
Protein content in the tissue extracts was determined by the method of Bradford [35]. The assay was performed in 96-well plates, where 5 μL of diluted protein extracts was added to 250 µL of Bradford reagent (Sigma-Aldrich, St. Louis, MO, USA). After incubation for 5 min at 25 °C with shaking at 550 rpm on a PST-100 HL Thermo-Shaker (Biosan, Riga, Latvia), absorbance was recorded using a Spark multimode microplate reader with SparkControl software (Tecan, Männedorf, Switzerland). The protein concentration was calculated from a standard curve using bovine serum albumin as a protein standard. The obtained protein concentrations were used for calculations of the specific enzyme activities.
The microplate assay for PPO activity was based on the coupling reaction between the benzoquinone derivative, generated during the PPO-catalyzed oxidation of L-3,4-dihydroxyphenylalanine, and L-ascorbic acid to obtain dehydro-ascorbic acid [36]. The reaction mixture consisted of 0.17 mM L-3,4-dihydroxyphenylalanine, 0.07 mM L-ascorbic acid, 0.002 mM EDTA, and protein extract in 50 mM potassium phosphate buffer, pH 6.5, in a final volume of 0.3 mL. Spectrophotometric rate determination was performed on a Spark multimode microplate reader with SparkControl software (Tecan, Männedorf, Switzerland). The decrease in absorbance was monitored at 265 nm every 15 s for 3 min at room temperature. Each sample was measured in triplicate. The PPO activity was calculated using a molar extinction coefficient (ε = 2.5 mM cm−1) and expressed in U mg−1 protein.
PAL activity was determined by the modified method based on Havir and Hanson [37]. The PAL assay mixture comprised 2 mM L-phenylalanine as a substrate and protein extract in 150 mM Tris–HCl buffer, pH 8.5, in a final volume of 1.5 mL. The protein sample was added after a 10 min pre-incubation period at 40 °C. The increase in absorbance due to the production of trans-cinnamic acid was monitored at 270 nm over 5 min every 30 s at 40 °C, using a UV-VIS spectrophotometer Perkin Elmer Lambda 25 equipped with PTP Peltier system and UV WinLab software package (PerkinElmer, Waltham, MA, USA). The PAL activity was calculated using a molar extinction coefficient (ε = 19.73 mM cm−1) and expressed in U mg−1 protein.

2.7. Determination of DON and ZEA

Non-inoculated and inoculated wheat spikes from the 2019/2020 growing season were manually harvested. Obtained grains per replication were pooled, ground, and used for the determination of DON and ZEA. Mycotoxin analyses were performed in the ac-credited laboratory (Eurofins Croatiakontrola, Zagreb, Croatia). DON and ZEA were extracted from the grain samples with deionized water, and the obtained extracts were purified using immunoaffinity columns DONStar® IAC (Romer Labs Diagnostic GmbH, Tulln, Austria). The mycotoxin concentrations were determined by high-performance liquid chromatography coupled with a detection diode array (HPLC-DAD). The chromatographic separation has been performed on an Agilent Zorbax C18 column (150 mm × 4.6 mm i.d., 5 μm).

2.8. Statistical Analysis

All data analyses were performed using the SAS Enterprise Guide 7.1 (SAS Institute Inc., Cary, NC, USA) software. Biochemical assays were carried out in eight replicates and their results were expressed as mean ± standard deviation (SD). Factorial analysis of variance (ANOVA) was performed, and statistically significant differences among the treatments in each variety were separately determined using the Fisher’s LSD test (p ≤ 0.05). For correlation analyses, Pearson’s coefficient was used.

3. Results and Discussion

FHB severity, expressed as general resistance, varied under the effect of variety, nitrogen treatment, and year (Figure 1). Variety-specific differences in FHB severity in both growing seasons were clearly evident (Figure 1). The average AUDPC for disease severity per variety (regardless of N level) in 2018/2019 ranged from 257 (Sofru) to 136 (Srpanjka), 31 (Graindor), and 30 (Apache). An almost similar trend was present in 2019/2020, where the average AUDPC for disease severity per variety (regardless of N level) ranged from 155 (Sofru) to 64 (Srpanjka), 6 (Apache), and 5 (Graindor). Non-inoculated wheat varieties did not show any FHB symptoms. Therefore, scoring for general FHB resistance was not made for the non-inoculated wheat varieties. In the present study, the Sofru variety showed higher AUDPC values for general FHB resistance in both growing seasons, indicating higher FHB susceptibility. The higher AUDPC values for general FHB resistance in the Sofru variety could be related to the presence of awns, since the Sofru variety was the only variety with awns used in this study. However, this cannot be proven with certainty, as Mesterhazy reported that wheat varieties with awns were more susceptible to FHB when tested under the natural epidemic conditions in the field, although this trait had no effect on FHB severity in conditions of artificial inoculations [38]. Compared to the Sofru variety, lower average AUDPC values for general FHB resistance were observed in the Srpanjka variety in both growing seasons. Therefore, the Srpanjka variety was classified as moderately susceptible to FHB. In the present study, Apache and Graindor varieties were classified as partially resistant to FHB due to lower average AUDPC values for general FHB resistance in both growing seasons. Our results are in accordance with previous studies that evaluated FHB resistance in the same varieties and in which varieties’ resistance to FHB was well characterized [8,39].
Meteorological data for the Osijek area were obtained from the Croatian Meteorological and Hydrological Service (DHMZ). The annual precipitation during the 2018/2019 and 2019/2020 growing seasons was 531.3 and 408.6 mm, and annual average temperatures were 10.9 and 11.1 °C, respectively (Figure S1 in Supplementary Materials). In May, during the pre-anthesis and anthesis stage, total precipitation was 150.8 mm in 2019 and 53.3 mm in 2020, while the mean daily temperature was 14.0 °C in 2019 and 15.3 °C in 2020. In June, during grain development, total precipitation was 112.8 mm in 2019 and 73.5 mm in 2020, while the mean daily temperature was 23.1 °C in 2019 and 20.2 °C in 2020.
In general, wheat is most susceptible to FHB at the anthesis stage, while warm and moist conditions during this period promote disease development [3]. Differences in the FHB severity can be observed between two growing seasons in which different climatic conditions prevailed (Figure 1). Overall, for all varieties and all nitrogen levels, higher AUDPC values were found in the 2018/2019 growing season compared to 2019/2020. Higher levels of FHB disease in the 2018/2019 growing season may be due to the much heavier rainfall and associated higher humidity in May 2019. In May, during the pre-anthesis and anthesis stage, total precipitation was almost three times higher in 2019 than in 2020 (Figure S1 in Supplementary Materials). Krnjaja et al. [40] reported similar results and pointed out that climatic conditions, especially intense precipitation during anthesis, cause a higher FHB index and a higher occurrence of FHB-causing species. In 2018/2019, higher AUDPC values were recorded in the inoculated wheat varieties grown under higher nitrogen supplementation level (N140). Higher nitrogen fertilization can increase FHB intensity by changing crop characteristics, especially by increasing crop density and altering the microclimate of the canopy [26]. A denser canopy has a more humid microclimate that favors disease development. However, in both growing seasons, application of different nitrogen fertilization levels did not significantly affect FHB severity. In our previous study, in some varieties (Ficko, Galloper, and Felix), high nitrogen resulted in an increase in visual FHB symptoms, whereas in variety U-1, high nitrogen resulted in a decrease in visual FHB symptoms [30], suggesting a variety-specific response to nitrogen fertilization. The literature contains numerous and sometimes conflicting data on the effects of nitrogen on infection and disease development in various plant–pathogen interactions [25,29]. However, the contrasting results may not be surprising, because the effect of nitrogen in different plant–pathogen interactions is extremely complex and depends on the type of host plant and pathogen, as well as on the different amount and form of nitrogen. Different forms of nitrogen (ammonium vs. nitrate) appear to have different effects on plant disease resistance, at least in part, by utilizing different assimilation and metabolic pathways [25]. In the present study, both ammonium and nitrate forms of nitrogen were used, which are part of the standard agronomic practice in applying mineral fertilizers in wheat production in Croatia, so it was not possible to determine how each form of nitrogen affects the FHB’s severity. Although numerous and conflicting studies are available for wheat, several studies reported that different levels of nitrogen fertilization have no significant effect on FHB and mycotoxin concentrations and that adaptation of nitrogen fertilization represents no relevant tool in managing FHB in practical wheat cultivation [26,40].
The determination of DON and ZEA concentrations was measured only in the growing seasons 2019/2020. It was additionally done to test the impact of the three main factors (wheat variety, Fusarium, and nitrogen treatment) on the mycotoxin’s concentrations. The concentrations of mycotoxins in the grains of the non-inoculated wheat varieties were be-low the detection limit of 100 µg kg−1 for DON and 8 µg kg−1 for ZEA. Therefore, only the concentrations of DON and ZEA in the grains of the inoculated wheat varieties were shown (Table 2). Regardless of the treatment, high concentrations of DON were found in all inoculated wheat samples. More precisely, the levels of DON exceeded the European limit for unprocessed wheat of 1250 µg kg−1 as set by the European Commission [41]. On average, the Sofru variety had the highest DON concentration (1680.40 ± 157.10), followed by Srpanjka (1668.03 ± 130.71), Apache (1667.03 ± 97.28), and Graindor (1532.05 ± 232.35) varieties. These values of DON concentration are in accordance with the disease severity. On average, the highest DON concentration was recorded in the inoculated wheat varieties that had grown at N0 (1724.48 ± 37.27), which was in accordance with the highest disease severity detected at N0 in season 2019/2020.
As for ZEA, mycotoxin concentrations in all samples of the inoculated wheat varieties did not exceed the tolerance limit (100 µg kg−1) set by the European Commission [41]. In fact, the concentrations of ZEA were below the detection limit in almost all samples of the inoculated wheat varieties. On average, the highest concentrations of ZEA were detected in Srpanjka and Sofru varieties, which was in accordance with the highest disease severity in these varieties.
Analysis of variance for variety, nitrogen, and Fusarium treatment effects on the measured parameters in the 2018/2019 and 2019/2019 growing seasons is shown in Table 3 and Table 4. In the 2018/2019 growing season (Table 3), wheat variety significantly affected all tested biochemical parameters (p ≤ 0.001), while Fusarium treatment affected the PHE content (p ≤ 0.001) and TAC (p ≤ 0.01). Nitrogen treatment only significantly affected PPO activity (p ≤ 0.05). Variety × nitrogen treatment interaction was significant for PHE content, PAL, and PPO activity, while variety × Fusarium treatment interaction was significant for all tested parameters. Nitrogen × Fusarium treatment interaction was significant only for PHE content. Three-factor interaction between the variety, nitrogen, and Fusarium treatment was significant for PHE content and PPO activity.
In the 2019/2020 growing season (Table 4), wheat variety significantly affected all tested biochemical parameters (p ≤ 0.001). Nitrogen treatment had a significant effect on PHE content (p ≤ 0.01), PAL, and PPO activity (p ≤ 0.001), while Fusarium treatment affected TAC, PPO activity (p ≤ 0.001), and PAL activity (p ≤ 0.01). Variety × nitrogen treatment interaction was significant for PHE content, TAC, and PPO activity, while variety × Fusarium treatment interaction was significant for all tested parameters (p ≤ 0.001). Nitro-gen × Fusarium treatment interaction was significant for PHE content, TAC, and PAL. Three-factor interaction between the variety, nitrogen, and Fusarium treatment was significant for all tested parameters.
In 2018/2019, the PHE content was most significantly affected by Fusarium treatment and wheat variety (Table 3). A trend of increased PHE content in the inoculated plants, compared to non-inoculated at almost all N levels, was found in the Sofru, Apache, and Graindor varieties (Figure 2a). A significant increase in PHE content due to Fusarium infection in the Sofru variety ranged from 46% at N140 to 71% at N35, in the Apache variety from 44% at N140 to 67% at N0, and in the Graindor variety from 26% at N70 to 39% at N140. In the Srpanjka variety, Fusarium infection caused a significant increase in PHE content only at N140.
In 2019/2020, the PHE content was significantly affected by wheat variety and nitro-gen treatment, although some significant differences have also been found for the effect of Fusarium treatment (Table 4). In the Srpanjka variety, Fusarium infection caused a significant increase in PHE content only at N70 (Figure 2b). In the Apache variety, Fusarium infection caused a significant increase in PHE content by 25% and 19% at N0 and N35, respectively. A trend of increased PHE content in the inoculated plants, compared to non-inoculated at all N levels, was found in the Graindor variety, where the increase in PHE content ranged from 10% at N35 to 23% at N140. Unlike in the previously mentioned varieties, in the Sofru variety, Fusarium infection caused a significant decrease in PHE content by 13%, 24%, and 36% at N35, N70, and N140, respectively. In the present study, the effect of nitrogen on PHE content was much more pronounced in 2019/2020. When examining the differences between N0 and N140 and between non-inoculated and inoculated plants, N0 caused a decrease in PHE content in the Srpanjka, Sofru, and Apache varieties in 2019/2020. Similarly, in our previous study, low nitrogen level caused a decrease in PHE content in two varieties (BC Mandica and Isengrain) [30]. All this indicates the great influence of climatic conditions and the variety itself on PHE content.
In both growing seasons, Fusarium inoculation altered the PHE content in wheat spikes, indicating the involvement of PHE in the defense response to Fusarium attack. Many studies confirm the involvement of PHE in the protective mechanisms against FHB, where increased phenolic synthesis in plant tissue indicates better adaptability and tolerance [11,42,43]. As reported by Chowdhary et al. [44], the plant defense mechanism against pathogens occurs in two stages: in the first response, there is a rapid accumulation of phenols at the infection site, which slows down the growth of the pathogen, and in the second response, plants biosynthesize specific stress-related substances (simple phenols, phenolic phytoalexins, hydroxycinnamic acids, etc.) that restrict the pathogen at the infected site.
In the present study, during both growing seasons, Fusarium infection led to an increase in PHE content in the partially resistant varieties (Apache and Graindor), indicating the involvement of PHE in the defense response and better disease tolerance in the more resistant varieties. These results are in accordance with the results reported by Gunnaiah and Kushalappa [42]. Gunnaiah and Kushalappa [42] found that in the resistant wheat cultivar Sumai-3, the resistance was due to the accumulation of metabolites belonging to the phenylpropanoid pathway that reduced pathogen advance by increasing host cell wall thickening and also reduced pathogen growth by antifungal and/or antioxidant properties, which in turn reduced subsequent mycotoxin biosynthesis. On the other hand, the PHE content in the Sofru variety differs between the growing seasons. In the 2018/2019 growing season, the PHE content was increased in the inoculated wheat spikes, while in 2019/2020, the PHE content was decreased at almost all N levels in the inoculated compared to the non-inoculated plants. In both growing seasons, the Sofru variety showed the most pronounced FHB symptoms compared to the other inoculated varieties. Therefore, PHE failed to prevent the spread of the pathogen and the development of the disease in the Sofru variety.
Comparing the two growing seasons, more pronounced changes in PAL activity were observed in 2019/2020. Due to favorable climatic conditions (higher total rainfall) during 2018/2019, a high level of FHB pressure disabled the differentiation of varieties depending on differences in PAL activity. In 2018/2019, the PAL activity was significantly affected only by wheat variety, although some significant differences have also been found for the effect of Fusarium treatment (Table 3). Those differences were found in the Graindor variety, where Fusarium infection caused a significant increase in the PAL activity by 34% and 29% at N70 and N140, respectively (Figure 3a).
In 2019/2020, the PAL activity was significantly affected by all three main factors: wheat variety, Fusarium treatment, and nitrogen treatment (Table 4). In the Srpanjka variety, Fusarium infection caused a significant increase in PAL activity by 65% and 31% at N0 and N35, respectively (Figure 3b). In the Apache variety, Fusarium infection caused a significant increase in PAL activity by 37% at N70 and N140. Increased PAL activities in the inoculated plants compared to non-inoculated plants at all N levels were found in the Graindor variety (Figure 3b), where the increase in PAL activity ranged between 17% at N35 and 156% at N0. In the Graindor variety, classified as a partially resistant variety, increased PAL activity and less symptoms of the FHB disease may indicate the importance of PAL in the defense response. On the contrary, Sofru variety showed a significant decrease in PAL activity in the inoculated plants at all N levels, ranging from 41% (N35) to 60% (N0). In 2019/2020, the Sofru variety exhibited the most pronounced symptoms of FHB infection, and a severe infection could cause inhibition of PAL activity. Although a different pathogen was used, Riaz et al. reported that PAL was present in both the resistant and susceptible wheat varieties, but the PAL activity was more pronounced in the varieties that were more resistant to Puccinia triticina infection [45].
PAL is the main enzyme in the metabolism of phenylpropanoids and is involved in the synthesis of several secondary metabolites, including phenols (coumarins, flavonoids, lignins), phenolic derivatives, and lignin [12]. Consequently, inhibition of PAL activity could lead to decreased synthesis of molecules involved in the defense response and enhanced susceptibility to pathogens [16]. Considering the stated theoretical knowledge about the mechanism of PAL action, PAL and PHE content should be positively correlated. However, a weak negative correlation between PHE and PAL was found in 2018/2019 (Table 5), while in 2019/2020, a weak positive correlation was found (Table 6).
When the correlations between PHE content and PAL activity were observed in each variety separately, positive correlation was found in Sofru variety (r = 0.40, p ≤ 0.01) in 2018/2019. In 2019/2020, a positive correlation was found between PHE content and PAL activity in Sofru (r = 0.57, p ≤ 0.001) and Graindor (r = 0.63, p ≤ 0.001) varieties. In 2019/2020, Fusarium infection caused a decrease in PAL activity in the Sofru variety, which was associated with lower PHE content. It is supposed that severe FHB infection in the Sofru variety caused inhibition of PAL activity, resulting in reduced PHE synthesis. During both growing seasons, positive correlations between PHE content and PAL activity were found in the Graindor variety. The increase in PAL activity has consequently led to increased PHE synthesis. Thus, both PAL and PHE, as products of its activity, contribute to greater FHB tolerance in more resistant varieties. The Srpanjka variety, which was classified as moderately susceptible to FHB, did not show significant changes in either PHE content nor in PAL activity.
In 2018/2019, the PPO activity was significantly influenced by wheat variety and nitrogen treatment, although some significant differences have also been found for the effect of Fusarium treatment (Table 3). Observing the changes in PPO activity in each variety separately, in the Srpanjka variety, Fusarium treatment caused an increase in PPO activity at all N levels, ranging from 53% at N70 to 140% at N0 (Figure 4a). In the Graindor variety, Fusarium infection caused a significant increase in PPO activity only at N0. Alternatively, decreased PPO activity was found in the Apache variety, where Fusarium infection caused a significant decrease of 42%, 31%, and 21% at N0, N35, and N70, respectively.
In 2019/2020, the PPO activity was significantly influenced by all three main factors: wheat variety, Fusarium treatment, and nitrogen treatment (Table 4). Fusarium infection tended to decrease PPO activity in the Srpanjka variety, although a significant decrease was found only at N0. A trend of decreased PPO activity was also found in the Graindor variety, where Fusarium infection caused a significant decrease by 16%, 33%, and 33% at N0, N70, and N140, respectively. Unlike in the previously mentioned varieties, in the Sofru and Apache varieties, Fusarium infection caused a significant increase in the PPO activity. More precisely, in the Sofru variety, Fusarium infection caused a significant increase in the PPO activity by 60% at N70 and 24% at N140, while in the Apache variety, increase in the PPO activity was detected only at N0.
To date, the role of PPO in plant defense against pathogens has been recognized, although the exact information about the actual mechanism is still unknown. The proposed mechanisms of action: (1) direct toxicity of quinones, (2) reduced bioavailability and alkylation of cellular proteins to the pathogen, (3) cross-linking of quinones with protein or other phenolics, forming physical barriers, and (4) production of ROS, which are known to play an important role in defense signaling [19].
In 2018/2019, the Graindor variety had the highest PPO activity at all N levels, while the PPO activity was lowest in the Srpanjka variety (four to five times lower depending on N level). Similar results were reported in other studies, where PPO activity was higher in the spikes of wheat varieties resistant to F. graminearum than in the more susceptible varieties [21,22]. Pathogen-induced high PPO activity is often associated with increased resistance to pathogens, highlighting the role of PPO in plant defense against pathogens [20,46,47].
A moderate negative correlation was found between PHE content and PPO activity in both growing seasons (Table 5 and Table 6). Since PPO catalyzes the oxidation of phenolic compounds to highly reactive quinones under different stress conditions, this could explain the negative correlation between these two variables.
In 2018/2019, TAC was significantly affected by wheat variety and Fusarium treatment (Table 3). A significant increase in TAC due to Fusarium infection was found in the inoculated plants of the Apache and Graindor varieties at all N levels (Figure 5a). In the Apache variety, a significant increase in TAC ranged from 9% at N35 and N70 to 11% at N0, while in the Graindor variety, it ranged from 8% at N140 to 10% at N35 and N70. Unlike Graindor and Apache, in the Srpanjka variety, Fusarium infection caused a significant decrease in TAC at N140, while no significant changes were observed in the Sofru variety (Figure 5a).
In 2019/2020, TAC was significantly affected by wheat variety and Fusarium treatment (Table 4). A trend of increased TAC in the inoculated plants compared to non-inoculated plants at almost all N levels was found in the Sofru and Graindor varieties (Figure 5b). In the Sofru variety, a significant increase in TAC ranged from 12% (N35) to 30% (N0), while in the Graindor variety, it ranged from 8% at N35 to 18% at N70. In the Apache variety, Fusarium infection caused a significant increase in TAC by 14% only at N0. In the Srpanjka variety, Fusarium infection caused a significant increase in TAC by 15% (N0) and 12% (N70) and a decrease by 14% at N140.
A moderate positive correlation was found between PHE content and TAC in both growing seasons (Table 5 and Table 6). The significant correlations between PHE content and TAC indicate a high contribution of PHE to the antioxidant capacity of winter wheat subjected to different environmental stress conditions. This result is consistent with the previous study by Atanasova-Penichon et al. [48], in which the phenolics were highlighted as the main contributors to the total antioxidant capacity of cereal grains.

4. Conclusions

In the present study, we found a variety-specific response of winter wheat to FHB during cultivation at different nitrogen fertilization levels. The Sofru variety showed higher AUDPC values for general FHB resistance in both growing seasons, indicating higher FHB susceptibility. Lower average AUDPC values for general FHB resistance were observed in the Srpanjka variety in both growing seasons. Therefore, the Srpanjka variety was classified as moderately susceptible to FHB. The Apache and Graindor varieties were classified as partially resistant varieties, due to lower average AUDPC values for general FHB resistance in both growing seasons. No significant differences were found for the effect of nitrogen on FHB severity. The FHB severity was more affected by the prevailing climatic conditions during growing seasons, especially heavy precipitation during anthesis.
In both growing seasons, Fusarium inoculation altered the PHE content in wheat spikes, indicating the involvement of PHE in the defense response to Fusarium attack. Increased PHE content in the partially resistant varieties (Apache and Graindor) indicates the involvement of PHE in the defense response and better disease tolerance in the more resistant varieties. In addition, positive correlations between PHE content and PAL activity were reported in the Graindor variety. Thus, both PAL and PHE contribute to greater FHB tolerance in more resistant varieties. Significant correlations were also found between PHE content and TAC, indicating a high contribution of PHE to the antioxidant capacity of winter wheat subjected to different environmental stress conditions. In summary, breeding wheat varieties with enhanced PHE synthesis could be a promising strategy for controlling FHB.
Due to the still unclear and complex role of nitrogen in wheat infection with FHB, it would be interesting for future research to obtain information on how the timing of application and different forms of nitrogen may affect and modulate the plant’s immune response to FHB. In addition, future research should include more parameters, such as measurements of different types of phenolic compounds (phenolic acids, anthocyanins, flavonoids) or different phytohormones (salicylic acid, jasmonic acid, abscisic acid, and indole acetic acid), which are important compounds in plant defense mechanisms against various abiotic and biotic stress conditions.

Supplementary Materials

The following supporting information can be downloaded at: https://www.mdpi.com/article/10.3390/agronomy12081746/s1, Figure S1: Climate diagrams for two wheat growing seasons, 2018/2019 (a) and 2019/2020 (b), in Osijek, Croatia.

Author Contributions

Conceptualization, M.M., R.V., K.V., J.Ć., K.D. and D.N.; formal analysis, M.M. and R.V.; investigation, M.M., R.V., I.Š.Č., A.V. and D.N.; resources, R.V., K.V., I.Š.Č. and D.N.; writing—original draft preparation, M.M.; writing—review and editing, R.V., K.V., J.Ć., I.Š.Č. and D.N.; visualization, M.M., R.V., K.V., J.Ć., I.Š.Č. and D.N.; funding acquisition, D.N. All authors have read and agreed to the published version of the manuscript.

Funding

This research was funded by the Croatian Science Foundation, grant number IP-2016-06-2178, and partly by a grant of the EU project K.K. 01.1.1.01.0005 Biodiversity and Molecular PlantBreeding, Centre of Excellence for Biodiversity and Molecular Plant Breeding (CoE CroP-BioDiv), Zagreb, Croatia.

Institutional Review Board Statement

Not applicable.

Informed Consent Statement

Not applicable.

Data Availability Statement

The dataset used and/or analyzed during the current study is available from the corresponding authors on reasonable request.

Acknowledgments

The authors wish to thank the Croatian Meteorological and Hydrological Service (DHMZ) for providing the meteorological data. Furthermore, the authors thank the company Eurofins Croatiakontrola for the mycotoxin analysis. Last, but not least, we are grateful to Marc Lemmens for providing the Fusarium graminearum (IFA65) strain.

Conflicts of Interest

The authors declare no conflict of interest. The funders had no role in the design of the study; in the collection, analyses, or interpretation of data; in the writing of the manuscript, or in the decision to publish the results.

References

  1. Buerstmayr, M.; Steiner, B.; Buerstmayr, H. Breeding for Fusarium head blight resistance in wheat—Progress and challenges. Plant Breed. 2019, 139, 429–454. [Google Scholar] [CrossRef]
  2. Bottalico, A.; Perrone, G. Toxigenic Fusarium species and mycotoxins associated with head blight in small-grain cereals in Europe. Eur. J. Plant Pathol. 2002, 108, 611–624. [Google Scholar] [CrossRef]
  3. Birr, T.; Hasler, M.; Verreet, J.-A.; Klink, H. Composition and Predominance of Fusarium Species Causing Fusarium Head Blight in Winter Wheat Grain Depending on Cultivar Susceptibility and Meteorological Factors. Microorganisms 2020, 8, 617. [Google Scholar] [CrossRef] [PubMed]
  4. Czaban, J.; Wróblewska, B.; Sułek, A.; Mikos, M.; Boguszewska, E.; Podolska, G.; Nieróbca, A. Colonisation of winter wheat grain by Fusarium spp. and mycotoxin content as dependent on a wheat variety, crop rotation, a crop management system and weather conditions. Food Addit. Contam. Part A 2015, 32, 874–910. [Google Scholar] [CrossRef]
  5. Parry, D.W.; Jenkinson, P.; McLeod, L. Fusarium ear blight (scab) in small grain cereals-a review. Plant Pathol. 1995, 44, 207–238. [Google Scholar] [CrossRef]
  6. Bai, G.; Shaner, G. Management and resistance in wheat and barley to Fusarium head blight. Annu. Rev. Phytopathol. 2004, 42, 135–161. [Google Scholar] [CrossRef]
  7. Marzec-Schmidt, K.; Börjesson, T.; Suproniene, S.; Jędryczka, M.; Janavičienė, S.; Góral, T.; Karlsson, I.; Kochiieru, Y.; Ochodzki, P.; Mankevičienė, A.; et al. Modelling the Effects of Weather Conditions on Cereal Grain Contamination with Deoxynivalenol in the Baltic Sea Region. Toxins 2021, 13, 737. [Google Scholar] [CrossRef]
  8. Španić, V.; Dvojković, K.; Babic, J.; Drezner, G.; Zdunić, Z. Fusarium Head Blight Infestation in Relation to Winter Wheat End-Use Quality—A Three-Year Study. Agronomy 2021, 11, 1648. [Google Scholar] [CrossRef]
  9. Xu, X.M.; Nicholson, P.; Thomsett, M.A.; Simpson, D.; Cooke, B.M.; Doohan, F.M.; Brennan, J.; Monaghan, S.; Moretti, A.; Mule, G.; et al. Relationship between the fungal complex causing fusarium head blight of wheat and environmental conditions. Phytopathology 2008, 98, 69–78. [Google Scholar] [CrossRef] [Green Version]
  10. Zhang, Y.; Cai, P.; Cheng, G.; Zhang, Y. A Brief Review of Phenolic Compounds Identified from Plants: Their Extraction, Analysis, and Biological Activity. Nat. Prod. Commun. 2022, 17, 1934578X2110697. [Google Scholar] [CrossRef]
  11. Pratyusha, S. Phenolic Compounds in the Plant Development and Defense: An Overview. In Plant Stress Physiology-Perspectives in Agriculture; IntechOpen: London, UK, 2022. [Google Scholar] [CrossRef]
  12. Kaur, S.; Samota, M.K.; Choudhary, M.; Choudhary, M.; Pandey, A.K.; Sharma, A.; Thakur, J. How do plants defend themselves against pathogens-Biochemical mechanisms and genetic interventions. Physiol. Mol. Biol. Plants 2022, 28, 485–504. [Google Scholar] [CrossRef] [PubMed]
  13. Zeb, A. Concept, mechanism, and applications of phenolic antioxidants in foods. J. Food Biochem. 2020, 44, e13394. [Google Scholar] [CrossRef] [PubMed]
  14. Kiani, R.; Arzani, A.; Maibody, S.A.M.M. Polyphenols, flavonoids, and antioxidant activity involved in salt tolerance in wheat, Aegilops cylindrica and their amphidiploids. Front. Plant Sci. 2021, 12, 493. [Google Scholar] [CrossRef] [PubMed]
  15. Spiegel, M.; Kapusta, K.; Kołodziejczyk, W.; Saloni, J.; Żbikowska, B.; Hill, G.A.; Sroka, Z. Antioxidant Activity of Selected Phenolic Acids–Ferric Reducing Antioxidant Power Assay and QSAR Analysis of the Structural Features. Molecules 2020, 25, 3088. [Google Scholar] [CrossRef]
  16. Huang, J.; Gu, M.; Lai, Z.; Fan, B.; Shi, K.; Zhou, Y.; Yu, J.; Chen, Z. Functional analysis of the Arabidopsis PAL gene family in plant growth, development, and response to environmental stress. Plant Physiol. 2010, 153, 1526–1538. [Google Scholar] [CrossRef] [Green Version]
  17. Duba, A.; Goriewa-Duba, K.; Wachowska, U.; Głowacka, K.; Wiwart, M. The Associations between Leaf Morphology, Phenylalanine Ammonia Lyase Activity, Reactive Oxygen Species, and Fusarium Resistance in Selected Species of Wheat with Different Ploidy Levels. Plants 2019, 8, 360. [Google Scholar] [CrossRef] [Green Version]
  18. Bhattacharya, A.; Sood, P.; Citovsky, V. The roles of plant phenolics in defence and communication during Agrobacterium and Rhizobium infection. Mol. Plant Pathol. 2010, 11, 705–719. [Google Scholar] [CrossRef]
  19. Taranto, F.; Pasqualone, A.; Mangini, G.; Tripodi, P.; Miazzi, M.M.; Pavan, S.; Montemurro, C. Polyphenol Oxidases in Crops: Biochemical, Physiological and Genetic Aspects. Int. J. Mol. Sci. 2017, 18, 377. [Google Scholar] [CrossRef] [Green Version]
  20. Raj, S.N.; Sarosh, B.R.; Shetty, H.S. Induction and accumulation of polyphenol oxidase activities as implicated in development of resistance against pearl millet downy mildew disease. Funct. Plant Biol. 2006, 33, 563–571. [Google Scholar] [CrossRef]
  21. Sorahinobar, M.; Niknam, V.; Ebrahimzadeh, H.; Soltanloo, H. Differential antioxidative responses of susceptible and resistant wheat cultivars against Fusarium head blight. Intl. J. Farm. Allied Sci. 2015, 4, 239–243. [Google Scholar]
  22. Mohammadi, M.; Kazemi, H. Changes in peroxidase and polyphenol oxidase activities in susceptible and resistant wheat heads inoculated with Fusarium graminearum and induced resistance. Plant Sci. 2002, 162, 491–498. [Google Scholar] [CrossRef]
  23. Lebeda, A.; Luhova, L.; Sedlarova, M.; Jancova, D. The role of enzymes in plant-fungal pathogens interactions. J. Plant. Dis. Prot. 2001, 108, 89–111. [Google Scholar]
  24. Hawkesford, M.J. Reducing the reliance on nitrogen fertilizer for wheat production. J. Cereal Sci. 2014, 59, 276–283. [Google Scholar] [CrossRef] [Green Version]
  25. Sun, Y.; Wang, M.; Mur, L.A.J.; Shen, Q.; Guo, S. Unravelling the Roles of Nitrogen Nutrition in Plant Disease Defences. Int. J. Mol. Sci. 2020, 21, 572. [Google Scholar] [CrossRef] [Green Version]
  26. Lemmens, M.; Haim, K.; Lew, H.; Ruckenbauer, P. The effect of nitrogen fertilization on Fusarium head blight development and deoxynivalenol contamination in wheat. J. Phytopathol. 2004, 152, 1–8. [Google Scholar] [CrossRef]
  27. Heier, T.; Jain, S.K.; Kogel, K.-H.; Pons-Kühnemann, J. Influence of N-fertilization and fungicide strategies on Fusarium head blight severity and mycotoxin content in winter wheat. J. Phytopathol. 2005, 153, 551–557. [Google Scholar] [CrossRef]
  28. Chai, X.; Zhou, T.; Liu, Y. Effects of nitrogen deficiency induced by straw decomposition after incorporation into soil on the autophagy and pathogenicity of Fusarium graminearum based on an off-line simulation. J. Phytopathol. 2021, 169, 239–246. [Google Scholar] [CrossRef]
  29. Huber, D.M.; Watson, R.D. Nitrogen form and plant disease. Annu. Rev. Phytopathol. 1974, 12, 139–165. [Google Scholar] [CrossRef]
  30. Matić, M.; Vuković, R.; Vrandečić, K.; Štolfa Čamagajevac, I.; Ćosić, J.; Vuković, A.; Sabljić, K.; Sabo, N.; Dvojković, K.; Novoselović, D. Oxidative Status and Antioxidative Response to Fusarium Attack and Different Nitrogen Levels in Winter Wheat Varieties. Plants 2021, 10, 611. [Google Scholar] [CrossRef]
  31. Matić, M.; Vuković, R.; Vrandečić, K.; Štolfa Čamagajevac, I.; Vuković, A.; Ćosić, J.; Dvojković, K.; Novoselović, D. The Effect of Nitrogen Fertilization and Fusarium culmorum Inoculation on the Biomarkers of Oxidative Stress in Wheat Flag Leaves. Poljoprivreda 2021, 27, 15–24. [Google Scholar] [CrossRef]
  32. Snijders, C.H.A.; Van Eeuwijk, F.A. Genotype x strain interactions for resistance to Fusarium head blight caused by Fusarium culmorum in winter wheat. Theor. Appl. Genet. 1991, 81, 239–244. [Google Scholar] [CrossRef] [PubMed]
  33. Folin, O.; Ciocalteu, V. On tyrosine and tryptophane determinations in proteins. J. Biol. Chem. 1927, 73, 627–650. [Google Scholar] [CrossRef]
  34. Benzie, I.F.F.; Strain, J.J. The ferric reducing ability of plasma (FRAP) as a measure of “antioxidant power”: The FRAP assay. Anal. Biochem. 1996, 239, 70–76. [Google Scholar] [CrossRef] [PubMed] [Green Version]
  35. Bradford, M.M. A rapid and sensitive method for the quantitation of microgram quantities of protein utilizing the principle of protein-dye binding. Anal. Biochem. 1976, 72, 248–254. [Google Scholar] [CrossRef]
  36. Marumo, K.; Waite, J.H. Optimization of hydroxylation of tyrosine and tyrosine-containing peptides by mushroom tyrosinase. Biochim. Biophys. Acta 1986, 872, 98–103. [Google Scholar] [CrossRef]
  37. Havir, E.A.; Hanson, K.R. [72a] L-phenylalanine ammonia-lyase (potato tubers). Meth. Enzymol. 1970, 17, 575–581. [Google Scholar] [CrossRef]
  38. Mesterházy, A. Types and components of resistance to Fusarium head blight of wheat. Plant Breed. 1995, 114, 377–386. [Google Scholar] [CrossRef]
  39. Španić, V.; Ćosić, J.; Zdunić, Z.; Drezner, G. Characterization of agronomical and quality traits of winter wheat (Triticum aestivum L.) for Fusarium head blight pressure in different environments. Agronomy 2021, 11, 213. [Google Scholar] [CrossRef]
  40. Krnjaja, V.; Mandić, V.; Lević, J.; Stanković, S.; Petrović, T.; Vasić, T.; Obradović, A. Influence of N-fertilization on Fusarium head blight and mycotoxin levels in winter wheat. Crop Prot. 2015, 67, 251–256. [Google Scholar] [CrossRef]
  41. European Commission. Commission Regulation (EC) No 1881/2006 of 19 December 2006 setting maximum levels for certain contaminants in foodstuffs. Off. J. Eur. Union 2006, L364/5–L364/24. [Google Scholar]
  42. Gunnaiah, R.; Kushalappa, A.C. Metabolomics Deciphers the Host Resistance Mechanisms in Wheat Cultivar Sumai-3, against Trichothecene Producing and Non-Producing Isolates of Fusarium graminearum. Plant Physiol. Biochem. 2014, 83, 40–50. [Google Scholar] [CrossRef] [PubMed]
  43. Chrpová, J.; Orsák, M.; Martinek, P.; Lachman, J.; Trávníčková, M. Potential Role and Involvement of Antioxidants and Other Secondary Metabolites of Wheat in the Infection Process and Resistance to Fusarium spp. Agronomy 2021, 11, 2235. [Google Scholar] [CrossRef]
  44. Chowdhary, V.; Alooparampil, S.; Pandya, R.V.; Tank, J.G. Physiological Function of Phenolic Compounds in Plant Defense System. In Phenolic Compounds-Chemistry, Synthesis, Diversity, Non-Conventional Industrial, Pharmaceutical and Therapeutic Applications; IntechOpen: London, UK, 2021. [Google Scholar] [CrossRef]
  45. Riaz, A.; Riaz, A.; Rattu, A.U.R.; Tahir, M.I.; Azeem, M. Phenylalanine ammonia-lyase (PAL) and peroxidase activity in brown rust infected tissues of Pakistani wheat cultivars. Pak. J. Bot. 2014, 46, 1101–1107. [Google Scholar]
  46. Chen, C.; Belanger, R.R.; Benhamou, N.; Paulitz, T.C. Defense enzymes induced in cucumber roots by treatment with plant growth-promoting rhizobacteria (PGPR) and Pythium aphanidermatum. Physiol. Mol. Plant Pathol. 2000, 56, 13–23. [Google Scholar] [CrossRef]
  47. Deborah, S.D.; Palaniswami, A.; Vidhyasekaran, P.; Velazhahan, R. Time-course study of the induction of defense enzymes, phenolics and lignin in rice in response to infection by pathogen and non-pathogen. J. Plant Dis. Prot. 2001, 108, 204–216. [Google Scholar]
  48. Atanasova-Penichon, V.; Barreau, C.; Richard-Forget, F. Antioxidant secondary metabolites in cereals: Potential involvement in resistance to Fusarium and mycotoxin accumulation. Front. Microbiol. 2016, 22, 566. [Google Scholar] [CrossRef] [Green Version]
Figure 1. The area under the disease progress curve (AUDPC) for general FHB resistance in 2018/2019 (a) and 2019/2020 (b). Values are means of two replicates ± standard error (SE). Different letters above the bars indicate significant differences according to Fisher’s LSD test (p ≤ 0.05) among different nitrogen levels in each variety separately.
Agronomy 12 01746 g001
Figure 2. Soluble phenolic (PHE) content in spikes of four wheat varieties under different Fusarium (non-inoculated and inoculated) and nitrogen treatments (0, 35, 70, and 140 kg N ha−1) in 2018/2019 (a) and 2019/2020 (b). Values are means of eight replicates ± standard deviation (SD). Different letters above the bars indicate significant differences according to Fisher’s LSD test (p ≤ 0.05) among treatments in each variety separately.
Agronomy 12 01746 g002
Figure 3. Phenylalanine ammonia-lyase (PAL) activity in spikes of four wheat varieties under different Fusarium (non-inoculated and inoculated) and nitrogen treatments (0, 35, 70, and 140 kg N ha−1) in 2018/2019 (a) and 2019/2020 (b). Values are means of eight replicates ± standard deviation (SD). Different letters above the bars indicate significant differences according to Fisher’s LSD test (p ≤ 0.05) among treatments in each variety separately.
Agronomy 12 01746 g003
Figure 4. Polyphenol oxidase (PPO) activity in spikes of four wheat varieties under different Fusarium (non-inoculated and inoculated) and nitrogen treatments (0, 35, 70, and 140 kg N ha−1) in 2018/2019 (a) and 2019/2020 (b). Values are means of eight replicates ± standard deviation (SD). Different letters above the bars indicate significant differences according to Fisher’s LSD test (p ≤ 0.05) among treatments in each variety separately.
Agronomy 12 01746 g004
Figure 5. Total antioxidant capacity (TAC) in spikes of four wheat varieties under different Fusarium (non-inoculated and inoculated) and nitrogen treatments (0, 35, 70, and 140 kg N ha−1) in 2018/2019 (a) and 2019/2020 (b). Values are means of eight replicates ± standard deviation (SD). Different letters above the bars indicate significant differences according to Fisher’s LSD test (p ≤ 0.05) among treatments in each variety separately.
Agronomy 12 01746 g005
Table 1. Soil nitrogen (N) content (kg ha−1) in Osijek in 2018/2019 and 2019/2020 year.
LocationSoil TypeSeasonResidual Soil N
(kg N ha−1)
Basic N Fertilization
(kg N ha−1)
N Top-Dressing
(kg N ha−1)
Total N
(kg N ha−1)
OsijekEutric
Cambisol
2018/2019 and 2019/20202074094
35129
70164
140234
Table 2. The concentrations of mycotoxins deoxynivalenol (DON) and zearalenone (ZEA) in the grains of inoculated wheat varieties in the growing seasons 2019/2020.
Fusarium Inoculated Wheat VarietiesNitrogen TreatmentDON Concentration (µg kg−1)ZEA Concentration (µg kg−1)
SrpanjkaN01691.30˂8
N351504.80˂8
N701822.5016.30
N1401653.5019.90
SofruN01769.90˂8
N351623.1049.80
N701487.9017.30
N1401940.70˂8
ApacheN01739.90˂8
N351761.60˂8
N701590.90˂8
N1401575.70˂8
GraindorN01696.80˂8
N351702.00˂8
N701206.70˂8
N1401522.70˂8
Table 3. Analysis of variance (three-way ANOVA) for measured biochemical parameters under different nitrogen and Fusarium treatments in spikes of four different winter wheat varieties in the 2018/2019 growing season.
MS
Source of VariationdfPHETACPALPPO
VARIETY (V)35.31 ***36.95 ***75.43 ***354,684.34 ***
N LEVEL (N)30.01 ns0.04 ns0.64 ns2586.77 *
FUSARIUM (F)114.08 ***1.66 **0.27 ns688.89 ns
V × N90.15 **0.21 ns2.67 ***2957.68 ***
V × F32.01 ***2.62 ***3.05 **15,940.55 ***
N × F30.30 ***0.19 ns0.02 ns1789.18 ns
V × N × F90.31 ***0.11 ns1.56 ns1941.68 *
ns—not significant, *, **, and ***—significant at the level of probability p ≤ 0.05, 0.01, and 0.001, respectively. Df, degrees of freedom; MS, mean sum of squares; PHE, phenolics; TAC, total antioxidant capacity; PAL, phenylalanine ammonia-lyase; PPO, polyphenol oxidase.
Table 4. Analysis of variance (three-way ANOVA) for measured biochemical parameters under different nitrogen and Fusarium treatments in spikes of four different winter wheat varieties in the 2019/2020 growing season.
MS
Source of VariationdfPHETACPALPPO
VARIETY (V)34.46 ***15.53 ***26.35 ***238,480.99 ***
N LEVEL (N)30.17 **0.12 ns7.88 ***13,153.02 ***
FUSARIUM (F)10.11 ns6.70 ***13.50 **34,039.71 ***
V × N90.09 **0.23 *1.89 ns8876.24 ***
V × F31.05 ***0.66 ***237.92 ***56,574.48 ***
N × F30.40 ***1.99 ***4.86 *4996.04 ns
V × N × F90.15 ***0.27 *14.94 ***11,892.92 ***
ns—not significant, *, **, and ***—significant at the level of probability p ≤ 0.05, 0.01, and 0.001, respectively. Df, degrees of freedom; MS, mean sum of squares; PHE, phenolics; TAC, total antioxidant capacity; PAL, phenylalanine ammonia-lyase; PPO, polyphenol oxidase.
Table 5. Pearson correlation coefficients (r) and corresponding significance levels between the measured biochemical parameters in 2018/2019.
PHETACPALPPO
PHE1
TAC0.53 ***1
PAL−0.21 ***−0.44 ***1
PPO−0.48 ***−0.53 ***0.17 **1
**, and ***—significant at the level of probability p ≤ 0.05, 0.01, and 0.001, respectively. PHE, phenolics; TAC, total antioxidant capacity; PAL, phenylalanine ammonia-lyase; PPO, polyphenol oxidase.
Table 6. Pearson correlation coefficients (r) and corresponding significance levels between the measured biochemical parameters in 2019/2020.
PHETACPALPPO
PHE1
TAC0.57 ***1
PAL0.33 ***0.16 *1
PPO−0.44 ***−0.20 **−0.30 ***1
*, **, and ***—significant at the level of probability p ≤ 0.05, 0.01, and 0.001, respectively. PHE, phenolics; TAC, total antioxidant capacity; PAL, phenylalanine ammonia-lyase; PPO, polyphenol oxidase.
Publisher’s Note: MDPI stays neutral with regard to jurisdictional claims in published maps and institutional affiliations.

