Article

Suitability of Early Blight Forecasting Systems for Detecting First Symptoms in Potato Crops of NW Spain

1
Department of Vegetal Biology and Soil Sciences, Faculty of Sciences, University of Vigo, As Lagoas, 32004 Ourense, Spain
2
Flakkebjerg Research Center, Department of Agroecology, Aarhus University, Forsøgsvej 1, 4200 Slagelse, Denmark
*
Author to whom correspondence should be addressed.
Agronomy 2022, 12(7), 1611; https://doi.org/10.3390/agronomy12071611
Submission received: 10 June 2022 / Revised: 30 June 2022 / Accepted: 2 July 2022 / Published: 4 July 2022
(This article belongs to the Special Issue Epidemiology and Control of Fungal Diseases of Crop Plants)

Abstract

:
In recent years, early blight epidemics have been frequently causing important yield loses in potato crop. This fungal disease develops quickly when weather conditions are favorable, forcing the use of fungicides by farmers. A Limia is one of the largest areas for potato production in Spain. Usually, early blight epidemics are controlled using pre-established schedule calendars. This strategy is expensive and can affect the environment of agricultural areas. Decision support systems are not currently in place to be used by farmers for managing early blight. Thus, the objective of this research was to evaluate different early blight forecasting models based on plant or/and pathogen requirements and weather conditions to check their suitability for predicting the first symptoms of early blight, which is necessary to determine the timings of the first fungicide application. For this, weather, phenology and symptomatology of disease were monitored throughout five crop seasons. The first early blight symptoms appeared starting the flowering stage, between 37 and 40 days after emergence of plants. The forecasting models that were based on plants offered the best results. Specifically, the Wang-Engel model, with 1.4 risk units and Growing Degree-Days (361 cumulative units) offeredthe best prediction. The pathogen-based models showed a conservative forecast, whereas the models that integrated both plant and pathogen features forecasted the first early blight attack markedly later.

1. Introduction

Early blight caused by Alternaria solani (Ellis & Martin) Jones & Grout and Alternaria alternata is recognized as a serious problem for the quality and production of potatoes (Solanum tuberosum L.). Alternaria species are foliar pathogens that cause a relatively slow destruction of host tissues through a reduction of photosynthetic potential. However, in potato crops, when the disease is not controlled, yield losses higher than 50% have been denoted [1,2,3]. Furthermore, special attention is currently being paid to Alternaria species, as warmer temperature due to climate change, may favor an increase in their global hotspots [4,5,6].
Alternaria species overwinters as mycelium, conidia or chlamydospores on decaying plant debris for considerable amounts of time [7]. Once the spores are produced, they are spread by wind and deposited in other plants and when environmental conditions are favorable, the infection can occur. According to various researchers, high temperatures and interrupted wet periods, mainly fostered by storm days, are the most influential weather conditions for Alternaria conidia [3,5,6,8,9,10,11,12]. Furthermore, plants with weakened tissues and plants reaching senescence are more susceptible to Alternaria infections than healthy and green tissues [3,12]. The initial symptoms of early blight consist of small brown to black spots, which develop in a somewhat irregular shape usually with concentric rings [3,13]. A. solani is the main responsible for the early blight disease, whereas A. alternata merely acts as a secondary invader [7,14]. Under field conditions, the symptoms of both species are often indistinguishable, due to the fact that they can be isolated simultaneously from the same lesion [15]. Furthermore, the symptoms closely resemble symptoms caused by deficiencies and ozone damages, further complicating the identification [14].
The use of fungicides is the common method to control early blight in potato plants. Farmers often apply fungicide based on a pre-established calendar schedule and regardless of environmental conditions [4,12,16,17]. Nevertheless, in most cases, several unnecessary fungicide applications are done, since there is neither monitoring of the disease progression nor the ability to forecast the weather-based risk for early blight attacks. Over-application favors supplementary selection pressure for more pesticide-tolerant genotypes, creating additionally detrimental impacts on the environment and human health [6]. Therefore, the effectiveness of the applications is highly dependent on the timing, the stage of disease progression and weather conditions.
The European Green Deal was approved in 2020 by the European Commission with the essential objective of reducing the use of pesticides to 50% by 2030. Therefore, reducing pesticides is a major focus of global agricultural sustainability efforts. The use of multiple pest control methods designed to reduce or replace the application of synthetic pesticides defines integrated pest management. These practices involve regular monitoring, considering appropriate decision thresholds, a combination of approaches for specific pesticide management, and the inclusion of broader agroecosystem considerations. One of the most important strategies in this integrated management is the use of forecasting models, with precise thresholds adapted to the pathogen and environmental conditions of the crop. Forecasting models can contribute significantly to rationalizing fungicide use because the application is adjusted to the risk of disease development [18]. These strategies are already being applied among farmers aiming to minimize the use of pesticides to control early and late blight in potatoes from some areas [4,12,18,19,20,21,22].
Landschoot et al. [23] proposed to subdivide Alternaria forecasting models for potato crops into three categories: plant-based, pathogen-based and plant-pathogen-based. Plant-based models predict the susceptibility of the host crop and presume that Alternaria inoculum is abundantly present. These models also consider that potato plants are more susceptible in the senescence or tuberization stages than younger potato plants (in their vegetative stage). Therefore, plant-based models such as Growing Degree Days (GDDs) [19] and Physiological Days (P-Days) [24,25] estimate the crop’s developmental stages. Pscheidt and Stevenson [25] suggested that P-days developed by Sands et al. [24] to predict potato yield, could also be used to predict potato development and thus time the onset of early blight. Similarly, Franc et al. [19] adopted the GDD model. Both GDD and P-days simulate the growth of potato plants based on thermal time. The Wang Engel (WE) model [26], has been suggested as better at simulating the growth and development of potatoes [27]. The WE model simulates crop development by considering the nonlinear effects of environmental factors (such as temperature and photoperiod) on development of pathogen and uses a multiplicative approach [27].
Pathogen-based models consider one or more stages in the pathogen’s life cycle and assume that the crop is always susceptible. These models aim to predict the behavior of the pathogen by studying the weather relationships that favor fungal growth, infection and dispersal. Models such as TOMCAST (Tomato Forecaster), FAST (Forecast System for A. solani in Tomatoes) [28] and IWP (Interrupted Wetting Period) [8] are pathogen-based models, which use weather factors for forecasting early blight.
Management programs based on favorable meteorological conditions for the sporulation, dispersion and infectiousness of the pathogen should be a challenge in the coming years. In order to develop sustainable and effective tools to minimize the use of pesticides in potato crops, weather data, in addition to, phenological and early blight disease observations from the environments of different potato growing seasons have been recorded. This research aims to verify the effectiveness of various epidemiological models for potato early blight in an important potato-producing region of Northwest Spain. The infection risk values were calculated and compared with the occurrence of symptomatology in the field. At the same time, the effectiveness of each forecasting model for the study area was evaluated.

2. Materials and Methods

2.1. Period and Study Area

The study was carried out in a potato field planted with Agria cultivar throughout five growing seasons (from 2017 to 2021). The field was situated in A Limia (Galicia, Northwest Spain). This area is a plateau with an average altitude of 640 m above sea level and is mainly used for agricultural activities, with potato and cereal crop yielding being the most important. The climate is oceanic, with a continental influence that increases the daily and annual thermal amplitudes. Potato crops are usually grown from April or May to September or October, depending on the weather conditions for each year. In this study, the sowing date was between 22 April 2017 to the end of May 2020 (Table 1). The plants were totally dead and ready to harvest from mid-August 2017 to mid-September 2018.

2.2. Weather Monitoring

The weather variables were recorded by the weather station i-METOS (Pessl Instruments, Weiz, Austria) placed at 1.5 m height in the study field. This weather station recorded the following parameters: temperature (T), relative humidity (RH), rainfall, and leaf wetness (LW) at hourly intervals and the daily mean, as well as the minimum and maximum values for each parameter were calculated.

2.3. Phenological Monitoring and First Early Blight Symptoms Detection

The phenological stages of the potato crops were monitored from their planting until their senescence, at weekly intervals. Three main phenological stages were differentiated, the vegetative stage started when at least 50% of the plants had emerged to the beginning of flowering, the reproductive stage started from when at least 50% of the flowers had opened, until the beginning senescence and the senescence stage started from when at least 50% of the plants had become yellow, until plant death.
The potato plants in the plots were visually inspected for typical early blight symptoms on weekly transects. When the first early blight lesions were detected, the date was recorded.

2.4. Description of the Forecasting Models Used

Early blight forecast models based on plant development, pathogen favorable conditions and plant-pathogen-based models were applied, following the original proposals (Table 2).
The risk units of each model were accumulated from the emergence of the potato plants to the end of each growing season. For the calculation of P-Days and GDDs, the accumulated temperatures until they reached the reference units were considered (Table 2). The WE model was measured as daily growth rate (r). The risk units according to the IWP model, corresponded to days according to the requirements of the original model. For the TOMCAST model, the risk units were established according to disease severity values (DSV), as proposed by different authors. The TOMCAST + Maturity model considered the DSV (TOMCAST) and the accumulated P-Days. The models tested are detailed in the following sections.

2.4.1. Plant-Based Models

The forecasting models based on plant development were P-Days, GDDs and WE. The original proposal was considered, with some further modifications (Table 2).
The P-Days model estimated the age of the potato plants using minimum, maximum and optimum temperatures of 7, 30 and 21 °C, respectively [23]. The P-Days value was calculated each day according to potato development [24]. The GDD model was calculated according to Franc et al.´s [19] proposals, with a base temperature of 7 °C as seen in the following equations:
GDDs = maxT   +   minT 2     baseT   If   maxT   +   minT 2     baseT     0
GDDs = 0   If   maxT   +   minT 2     baseT   <   0
The WE model, described by Streck et al. [27], was used to predict when potato plants were more susceptible to early blight infection. The model considered the three developmental stages of the potato life cycle: the vegetative phase, from emergence (EM) until tuber initiation (TI), the tuberization phase, from TI until the beginning of senescence (BS) and the senescence phase, from BS until harvest (HA). The model calculated the daily developmental rate (r). The developmental stage (DS) was then calculated by accumulating r. DS of 0, 1, 1.8 and 2 marks for EM, TI, BS and HA, respectively [27]. Environmental factors affect r vary during the developmental stage. During the vegetative and senescence stages, r depends only on temperature; whereas r is dependent on both temperature and photoperiod in the tuberization stage [27]. The photoperiod or day length was estimated according to Forsythe et al.´s [33] proposals. In addition, DS = 1.4 at 50% of tuberization phase was used to predict the occurrence of the first symptoms of early blight. Different thresholds reported in the literature for timing the onset of early blight based on P-Days and GDD models were evaluated. They are shown as follows: 300 P-Days, 330 P-Days, 361 GDDs, 375 GDDs, 417 GDDs, 625 GDDs and 1000 GDDs. For the WE model, there was no reported threshold for predicting the onset of early blight. For this study, two thresholds of DS were selected (1 and 1.4) for predicting the onset of early blight. These thresholds were selected because they were periods in the tuberization phase, in which early blight has been reported to start [4].

2.4.2. Pathogen-Based Models

The IWP model considers RH as the fundamental factor for the infection and spread of Alternaria. An IWP-95% day occurred when RH was higher than 95% for six consecutive hours at night, and there were six h or less where RH was lower than 80% [8]. When six IWP days are reached there is risk of early blight infection (6 IWP) (Table 2). The IWP model also was tested with an RH threshold of 88% (6 IWP 88%).
The TOMCAST model estimates the favorability of the weather to early blight attacks by assigning disease severity values (DSV). The DSV values range from 0 (no risk) to 4 (high risk) [20]. DSVs are estimated based on the total leaf wetness levels per day as well as the average temperature during the leaf wetness hours. The original TOMCAST model [20] had a minimum temperature of 13 °C, which was modified recently to 10 °C [4,11] (Table 2). DSVs were accumulated until a predefined threshold for predicting early blight attacks. For this study, three TOMCAST thresholds were evaluated: 10, 20 and 25, named TOMCAST (10), TOMCAST (20) and TOMCAST (25), respectively.

2.4.3. Plant-Pathogen-Based Model

The TOMCAST model was applied in combination with the P-Days model, considering together the pathogen development conditions (TOMCAST) and the physiological age of the plant (P-days) [4]. The model combining both was called TOMCAST (25) + Maturity, and this model recommended fungicide applications after at least 330 accumulated P-Days and at least 25 accumulated DSVs since emergence, in accordance with the TOMCAST model [4].

2.5. Statistical Analysis

The Root Mean Square Error (RMSE) was calculated using Equation (3) to assess the accuracy of the tested models for predicting the onset of early blight. The x and x ¯ variables were the observed and predicted onset of early blight for the growing seasons and N was the number of observations (five for this study).
RMSE = 1 N i = 1 N ( x i x ¯ i ) 2
The 95% confidence intervals (CI) were calculated according to Equation (4) for the predicted onset ( x ¯ ) of the early blight for each model in the studied area. The SD and N variables were the standard deviation and number of observations, respectively. The Z was the value of confidence level at 95% (1.96).
CI = x ¯   ±   z S D N
The risk period of early blight according to the CI calculated for the five years of study for each model was estimated. The lower value was a critical value at which the plants could be infected by Alternaria.
Finally, the days of prediction obtained in each model and based on the first symptom of early blight were statistically compared through an analysis of variance (ANOVA) according to the Bonferroni test (p < 0.05).

3. Results

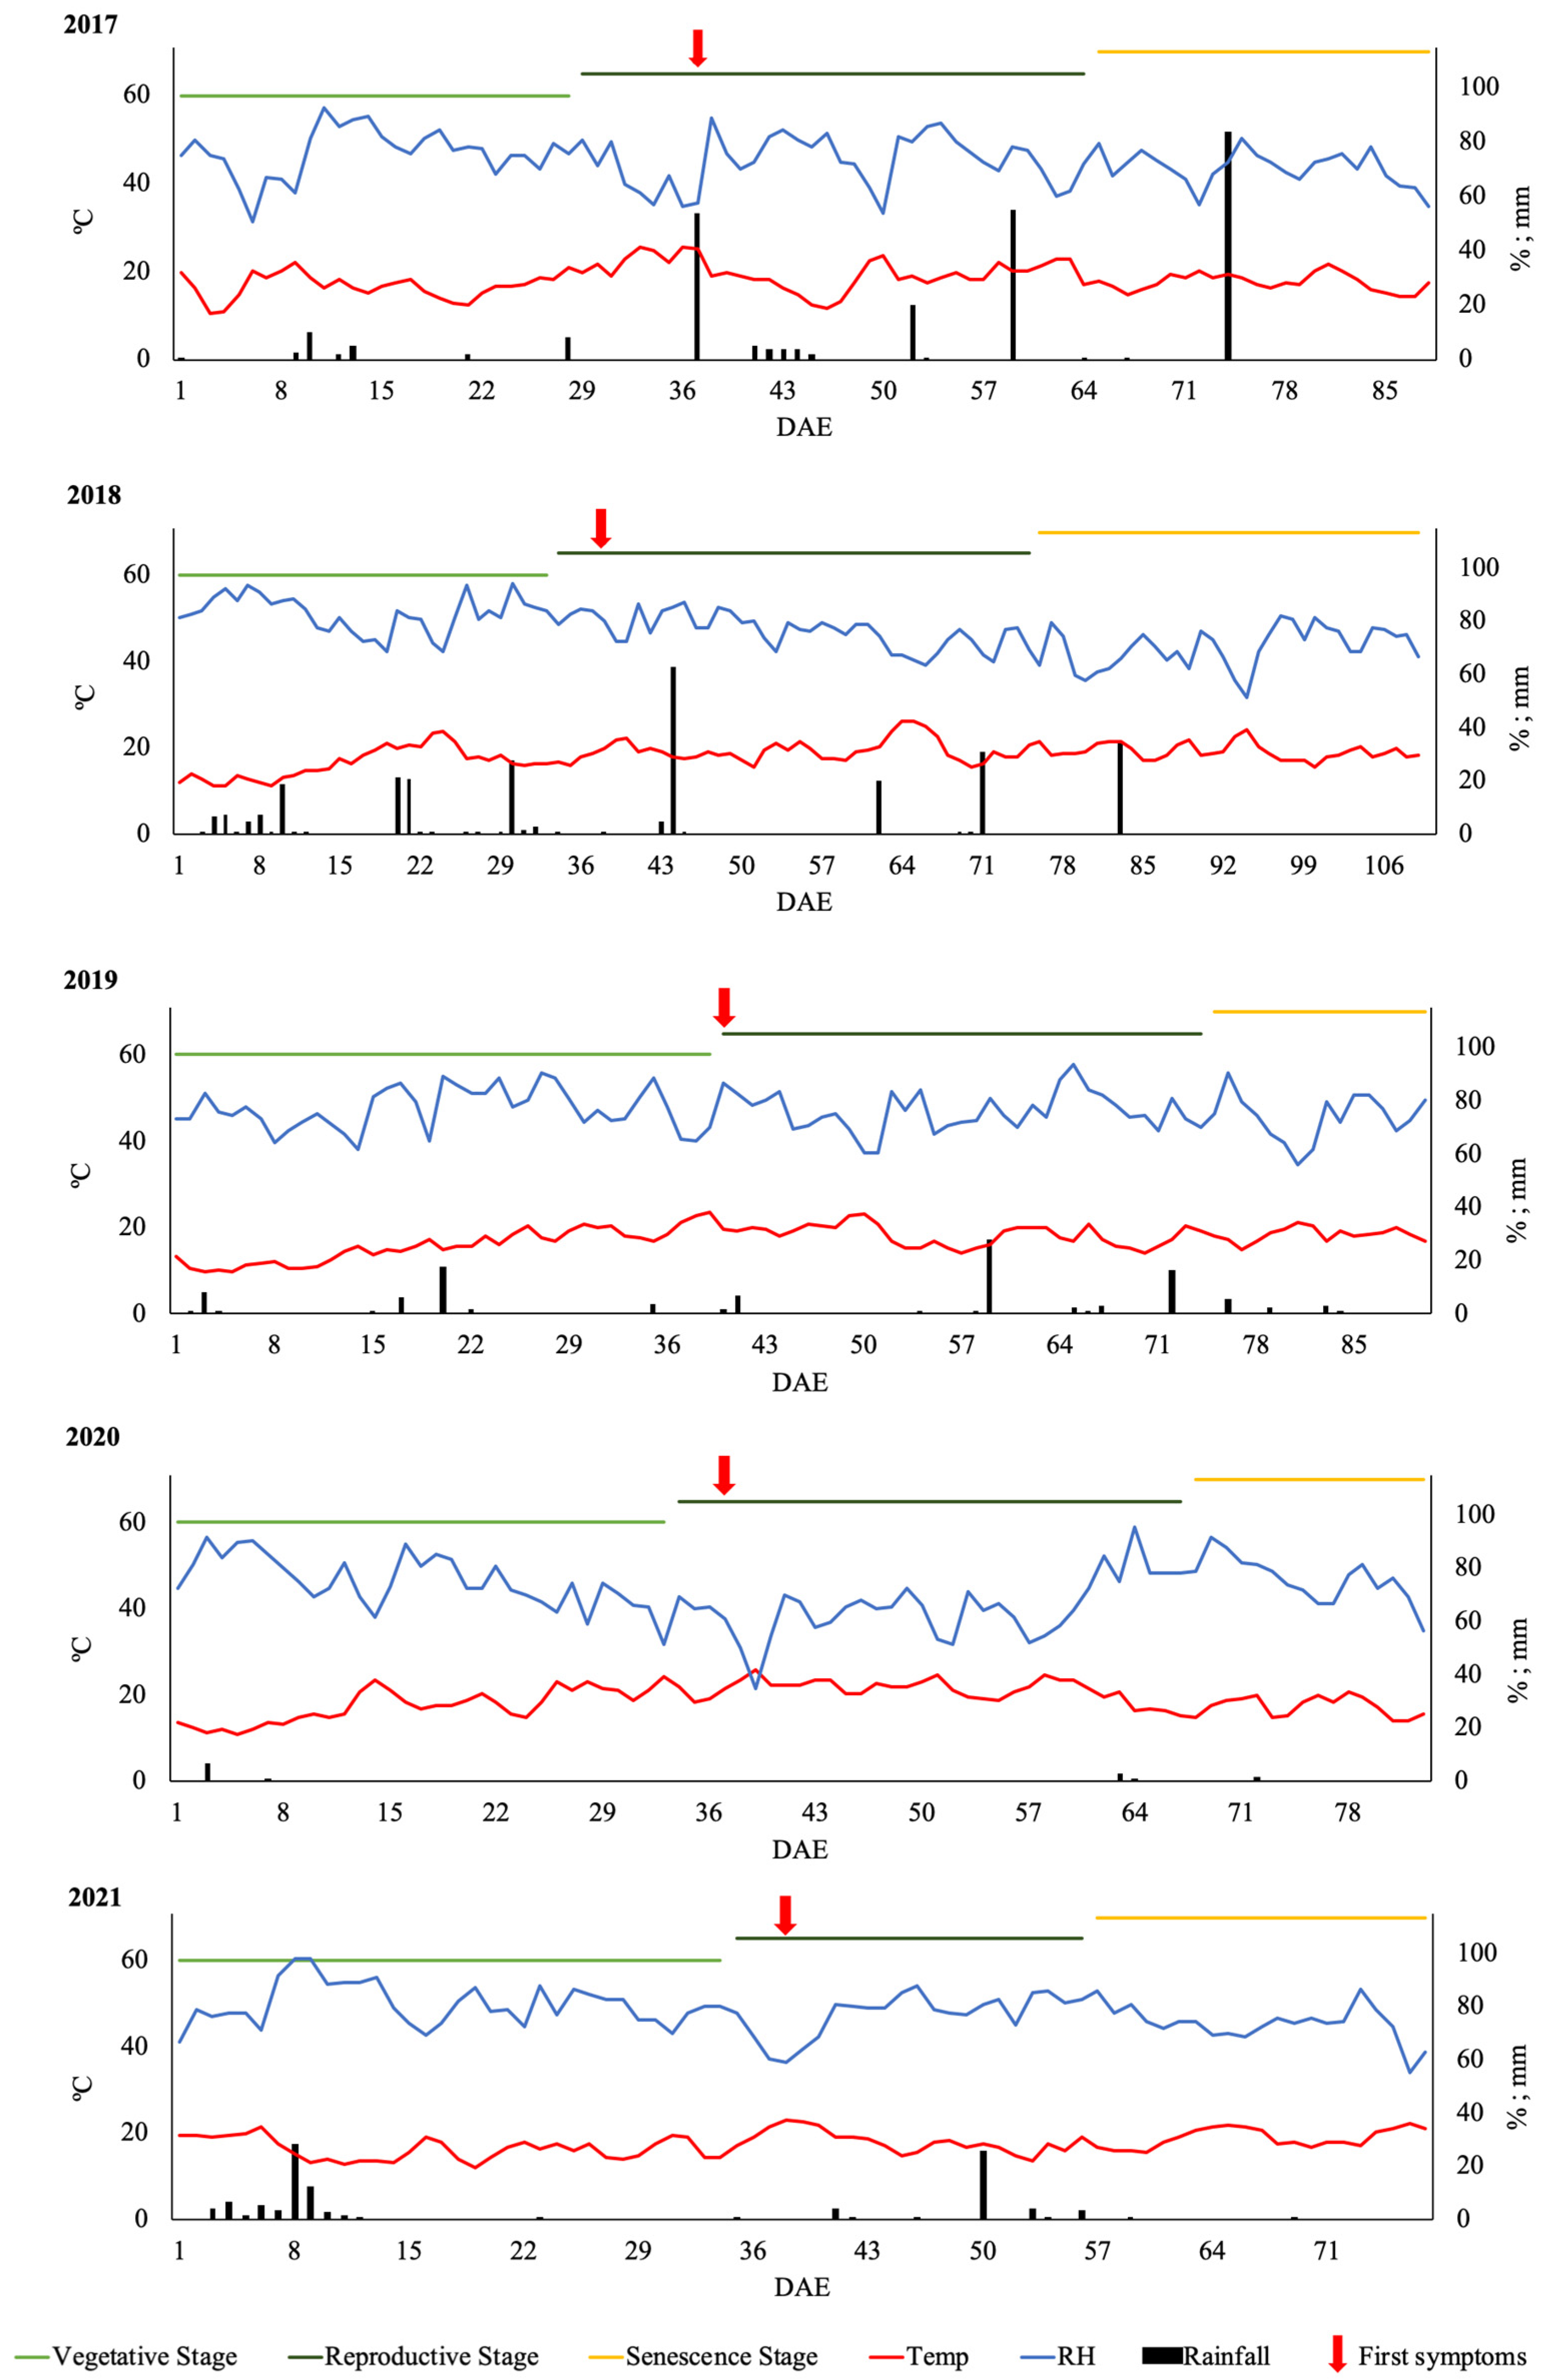
3.1. Phenological Development, First Symptoms of Early Blight and Weather Parameters during Potato Growing Seasons

The potatoes planted in 2020 had the earliest emergence levels, while those planted in 2017 were delayed almost 22 days (Table 1 and Table 3). Planting dates varied from 22 April (2017) to 26 May (2020) during the five years studied. The year 2020 was the latest planting year and emergence occurred at around 15 days. Similar times of emerge occurred in 2018, in which potatoes planted on 15 May emerged on 1 June (15 days). The year of 2017 was the earliest planting year and emergence occurred 22 days after planting. The first crop season to reach the reproductive stage quickest after emergence was the season of 2017 (13 June) and these plants only needed 29 days after emergence to flower (Figure 1). On the other hand, the potatoes planted in 2019 showed delays in flowering until 40 days after emerging (DAE) (13 July). The senescence stage arrived early in the year 2021, in just 59 DAE. However, 2018 was the longest crop season and senescence was reached at 76 days after emergence (Table 3).
The first symptoms of early blight appeared between 37 and 40 DAE depending on the growing seasons (Table 3). These DAEs in which first symptoms were observed coincided with the beginning of the flowering phase (reproductive stage).
Regarding the weather conditions of the growing seasons, 2020 had the higher daily temperature (mean value of 18.9 °C) and lower daily RH (mean value of 71.4%), together with 2020 (mean value of 71.1%). On the other hand, 2019 and 2021 crop seasons registered the lowest mean daily temperature of 17.1 °C and 17.7 °C, respectively and 2021 was the crop season with the lowest RH (78.1%). The highest amounts of rainfall were registered in 2017 and 2018 (305.8 mm and 296.8 mm) with a total of 23 and 37 rainy days, respectively. The crop season of 2020 was when the least rainy days occurred (8 days) and the total rainfall was 15.2 mm.

3.2. Warning Risk of Early Blight Models According to First Symptoms

Some of the models based on plant-age showed similar plant growth behavior throughout all the different years of the study, except 2017 year, in some instances (Figure 2). When comparing with the appearance of first symptoms using the WE model (1.4), 361 GDDs and 375 GDDs showed a good adjustment, between seven days before and two days after first symptoms. The 417 GDDs model together with the P-Days model at 300 and 330 units saw a delayed the onset of first symptoms from 2 to 11 days, respectively. However, the WE model (1), 625 GDDs and 1000 GDDs varied greatly. The WE model (1.4) predicted the first symptoms with in an interval of two days before and one day after in all the studied years. Concerning the options checked for the GDDs model, the best result was at a value of 361, predicting the disease in an interval of four days before and one day after the first visible symptoms, in 2017 and 2019, respectively. These deviations were highlighted in the year 2020 for the TOMCAST model. Models based on the development conditions of pathogen were most conservative, finding risk levels deviations of up to 37 days, in comparison with first symptoms observed in the field. The value of 10 and 20 DSVs for the TOMCAST model showed more accurate predictions. The TOMCAST (25) + Maturity model gave a late prediction of the onset of the first symptoms (Figure 2).
The differences in the number of days predicted for each model tested were evaluated according to the Bonferroni multiple comparison test. The 1000 GDDs model presented significant differences with all the models (p < 0.05) (Figure 2). The WE model (1), 6 IWP, 6 IWP (88%) and TOMCAST (10) models showed significant differences with TOMCAST (25) and TOMCAST (25) + Maturity (p < 0.05). On the other hand, the following models presented significantly similar mean values: the WE model (1.4), GDDs (375, 417 and 625), 330 P-days, TOMCAST (20), TOMCAST (25) and TOMCAST (25) + Maturity (p > 0.05).

3.3. Accuracy of Forecasting Models for Determining the Onset of First Symptoms of Early Blight

Some important differences in the accuracy of the date of the onset of first symptoms were observed (Figure 3). Generally, the plant-based models had the lowest RMSE. The only exception was the GDD (1000) model, which was the least accurate model for predicting the onset of early blight. The WE model (1.4) was the most accurate, as evidenced by its lower RMSE compared to the other models. For the pathogen-based models, TOMCAST (25) was the most accurate model. However, combing TOMCAST (25) with a plant-based model (P-Days) resulted in a more accurate prediction of the onset of early blight than the sole use of the TOMCAST and other pathogen-based models.

3.4. Improving Accuracy of Early Blight Models in A Limia

The early blight models were adjusted to improve their accuracy by considering the dates of appearance of the first symptoms and the weather conditions of the study area. According to the sequence of growing seasons, the results showed critical cumulative units for P-Days higher than 258 and for GDDs higher than 364 (Table 4). The WE model limit was higher in 2019, but it was established a mean value of 1.4 for the area. In the case of the IWP model, seasonal values varied from 17 to 34, with a mean value of 24, but when the RH is settled at 88% (IWP 88%) a lower confidence interval (32 to 34) compared to the original IWP model (18 to 29) was found, being more accurate. The TOMCAST model showed a high confidence interval of between 13 and 30. Finally, the plant-pathogen-based model (TOMCAST + Maturity) had the critical mean values of 22 + 270, with high variations in the values of the TOMCAST model, as expected (Table 4).
Considering the results obtained for the P-Days model, the spray will be recommended between 258 and 271 units (Table 4). For GDDs, it would be advisable to carry out the sprays between 364 units and 384 accumulated units. For the WE model, this critical interval was between the values of 1.36 and 1.40. For the models based on the pathogen, the original IWP, the first symptoms can appear in over 18 units, whereas, if we consider the IWP model (88%), the critical period was between 32 and 33 accumulated units. Finally, the TOMCAST model recommended treatment between 13 and 22 units. However, if this model is to be combined with the plant maturity model (TOMCAST + Maturity), it is necessary to accumulate from 13 to 22 TOMCAST units and from 258 to 271 units of the P-Days model (Maturity).

4. Discussion

Potato early blight has been especially destructive in recent years, causing rapid defoliation and premature senescence when left un treated. Without effective control measures, growers risk reduced yields and losing important economical profits during crop seasons. Currently, in the A Limia region, farmers rely on fungicides to manage Alternaria blight during the risk period in the growing seasons, but they must apply fungicide sprays frequently to protect the crops. Early blight can be modeled using predicting systems, which quantify the amount of heat energy available to promote pathogen or host development throughout a season. However, until now, these specific forecasting models have not been adjusted for early blight control in this potato region.
Optimizing fungicide applications by using a disease forecaster may offer an integrated pest management strategy suitable for potato production. In addition, knowing when to start applying treatments allows for the improving of the effectiveness of these treatments towards the control of early blight. Previous reports also found that effective control comparable to a standard application can be achieved when fungicide application starts from the first symptoms [4]. Therefore, the adjustment of the first application of fungicide for the effective control of early blight is the challenge proposed in this research.
It may also be useful to determine the frequency and efficacy of fungicides according to the genotype resistance and phenological stage changes of the cultivar to the Alternaria species. Spraying is recommended when the potato plant response to Alternaria shifts towards increasing susceptibility and this occurs at the initiation of the flowering or reproductive stage [2]. Field observations also demonstrated that necrotic lesions develop primarily in nitrogen-stressed plants [2,30]. Thus, heavy rains or large quantities of over-head irrigation wash the nitrogen fertilizer from the root zone and plants decrease their resistance to early blight.
In the present study, the appearance of first early blight symptoms in the leaflets of the potato plants was similar in each growing season. Specifically, the necrotic spots during the first days of flowering (between 38 and 40 DAE) were observed. Therefore, there is a direct relationship between the physiologic age of the potato plant and susceptibility to early blight. This fact agrees with previous reports [4,18,19,21,24,34]. After the initiation of tuberization, susceptibility increases gradually and mature plants are very susceptible to A. solani, as denoted before by various authors [7,25,34]. Thus, early blight is principally a disease of senescing plants and early sprays have little or no effect on overall suppression of A. solani [2,4,25].
Forecasting methods based on weather requirements must be adjusted to the local conditions of the area to be useful [4,9,31]. The success of the P-Days model in the geographical area tested was achieved with an accumulated value of 271. Some researchers in this field from Denmark [4], USA states such as Wisconsin [25], Colorado [29] or Maine [30] and states in Canada such as South Alberta [21] also required similar values (300 cumulative P-Days). The number of cumulative P-Days until the date of the first lesion at the different locations in Flanders (Belgium) ranged from 585 to 830 [23], higher than the proposed threshold of 300 P-Days [29]. Likewise, for the GDDs models, the first symptoms in the plots at 364 units were accurately predicted. Similar results were reported for the appearance of primary lesions in southern Colorado (at 361 GDD), although those for north-eastern Colorado were superior (at 625 GDD), most likely since it is a region with warmer temperatures compared to A Limia [19,23]. In another study performed in fields from Iran, cumulative values of 642 GDDs or 315 P-Days as thresholds for the first early blight symptoms were established [18].
In the A Limia region, the WE model was adapted to 1.4 units instead of 1 unit to successfully predict the day of the first symptoms (at 50% of the tuberization phase duration). The WE model simulates crop development to consider the nonlinear effects of environmental factors (temperature and photoperiod) on development, using the multiplicative approach [26]. This model considers cardinal temperatures and photoperiods according to latitudes for studying plant development because these parameters influence on potato crop development. The multiplicative approach used in the WE model is more biologically realistic for representing the interactions between plant development and environmental factors [27].
Some authors have reported that although early blight lesions were observed after 300 P-Days in potato fields from Wisconsin, airborne spores, favorable weather for dispersal and infection as well as host susceptibility did not simultaneously occur until 400 P-Days, with late-maturing cultivars [25]. The applicability of IWP, GDDs and P-Days models to use in combination with aerobiological data in Northwest Spain was also evaluated [9,10,31]. The IWP model turned out to be the most accurate, as it predicted Alternaria sporulation several days in advance during crop development. Meno et al. [10] observed that reaching 6 IWP was possible to predict the first peak of Alternaria (greater than 70 conidia/m3) with several days in advance (between 6 and 38 days).
The TOMCAST model was validated for potato early blight in other regions [4,20,21,22,30,32]. In Denmark, thresholds of 15 DSV, 20 DSV and 25 DSV with the TOMCAST model were used for timing fungicide application to control disease attacks, but 15 DSV, 25 DSV and 25 DSV + Maturity models were the most efficient [4,22]. Concretely, models based on maturity were classified as the best models in Denmark, reducing early blight attacks significantly at all locations in which the model was applied. A similar DSV value (of 15) was proposed to combine irrigation and rainfall data for controlling early blight in potato crops of Maine [30] and Southern Alberta (17 DSV) [21]. In Ontario and New Jersey, the TOMCAST model at 20 and 25 DSV resulted in promising results to predict Alternaria [20,32]. The TOMCAST model was supported with aerobiological data to determine the DSV threshold that was favorable for the first symptoms of Alternaria in A Limia [11]. The study revealed that the air Alternaria concentrations were detected with mean temperatures above 10 °C during various hours with leaf wetness, and 10 DSV showed a good forecast to determine the increase of conidia in the air, related to earlier infections [11].
Existing forecast models can be a powerful tool to control early blight epidemics in potato crops with minimal use of pesticide applications. They need to be adjusted to the weather conditions of a crop area to get the best prediction before first symptoms start. At the same time, this practice is committed to sustainable agriculture, contributing to improve farmers’ profits, the quality of commercial products and the health of the environment and ecosystems.

5. Conclusions

The results showed the need to adjust the requirements of reference forecasting models to the local environmental conditions of the area to successfully predict potato early blight in Northwest Spain. Plant-age and the starting of flowering can be considered critical phases for the development of early blight symptoms. Plant-age models were shown to be better models to predict the first symptoms as opposed to pathogen-based models that showed conservative prediction for most of the evaluated models. Among the plant-age models, the adaptation of the WE model (value of 1.4) showed a high precision. Visual assessments of fungal symptomatology are important to validate the forecasting models in a region. This adjustment allows for the prediction of potential epidemics during potato plant development, benefiting farmers with a good adjustment of dates of spraying. An accurate forecast helps to reduce fungicide expenses due to fewer applications and to preserve the environment. Thus, understanding the influence of plant ages will be key in developing a decision support system or strategies to control early blight.

Author Contributions

Conceptualization: L.M., I.K.A., O.E. and M.C.S.; formal analysis: L.M. and O.E.; investigation: L.M. and I.K.A.; data curation: L.M. and I.K.A.; writing—original draft preparation: L.M. and I.K.A.; writing—review and editing: L.M., O.E., I.K.A. and M.C.S.; supervision: I.K.A., O.E. and M.C.S.; project administration: M.C.S.; funding acquisition: M.C.S. All authors have read and agreed to the published version of the manuscript.

Funding

Laura Meno is beneficiary of the pre-PhD contract FPU 17/00267 granted by the Ministry of Education, Culture and Sports from Spain.

Institutional Review Board Statement

Not applicable.

Informed Consent Statement

Not applicable.

Data Availability Statement

Not applicable.

Acknowledgments

The authors appreciate the close collaboration of the farmers of A Limia to carry out this research.

Conflicts of Interest

The authors declare no conflict of interest.

References

  1. Soleimani, M.J.; Kirk, W. Enhance resistance to Alternaria alternata causing potato brown leaf spot disease by using some plant defense inducers. J. Plant Prot. Res. 2012, 52, 83–90. [Google Scholar] [CrossRef]
  2. Shtienberg, D. Alternaria diseases of potatoes: Epidemiology and management under Israeli conditions. In Fourteenth Euroblight Workshop Limassol, Cyprus. PPO–Spec. Rep. 2014, 16, 169–180. [Google Scholar]
  3. Tsedaley, B. Review on early blight (Alternaria spp.) of potato disease and its management options. J. Biol. Agric. Health 2014, 4, 191–199. [Google Scholar]
  4. Abuley, I.K.; Nielsen, B.J. Evaluation of models to control potato early blight (Alternaria solani) in Denmark. J. Crop Prot. 2017, 102, 118–128. [Google Scholar] [CrossRef]
  5. Escuredo, O.; Seijo-Rodríguez, A.; Meno, L.; Rodríguez-Flores, M.S.; Seijo, M.C. Seasonal dynamics of Alternaria during the potato growing cycle and the Influence of weather on the early blight disease in North-West Spain. Am. J. Potato Res. 2019, 96, 532–540. [Google Scholar] [CrossRef]
  6. Jindo, K.; Evenhuis, A.; Kempenaar, C.; Pombo, C.; Zhan, X.; Goitom, M.; Kessel, G. Holistic pest management against early blight disease towards sustainable agriculture. Pest Manag. Sci. 2021, 77, 3871–3880. [Google Scholar] [CrossRef]
  7. Rotem, J. The Genus Alternaria. Biology, Epidemiology and Pathogenicity; American Phytopathological Society: St. Paul, MN, USA, 1994; 326p. [Google Scholar]
  8. Van der Waals, J.E.; Korsten, L.; Aveling, T.A.S.; Denner, F.D.N. Influence of environmental factors on field concentrations of Alternaria solani conidia above a South African potato crop. Phytoparasitica 2003, 31, 353–364. [Google Scholar] [CrossRef]
  9. Escuredo, O.; Seijo, M.C.; Fernández-González, M.; Iglesias, I. Effects of meteorological factors on the levels of Alternaria spores on a potato crop. Int. J. Biometeorol. 2011, 55, 243–252. [Google Scholar] [CrossRef]
  10. Meno, L.; Escuredo, O.; Rodríguez-Flores, M.S.; Seijo, M.C. Interrupted Wet Period (IWP) to forecast the aerial Alternaria in potato crops of A Limia (Spain). Agronomy 2019, 9, 585. [Google Scholar] [CrossRef] [Green Version]
  11. Meno, L.; Escuredo, O.; Rodríguez-Flores, M.S.; Seijo, M.C. Modification of the TOMCAST model with aerobiological data for management of potato early blight. Agronomy 2020, 10, 1872. [Google Scholar] [CrossRef]
  12. Meno, L.; Escuredo, O.; Rodríguez-Flores, M.S.; Seijo, M.C. Looking for a sustainable potato crop. Field assessment of early blight management. Agric. For. Meteorol. 2021, 308, 108617. [Google Scholar] [CrossRef]
  13. Van der Waals, J.E.; Korsten, L.; Aveling, T.A.S. A review of early blight of potato. Afr. Plant Prot. 2001, 7, 91–102. [Google Scholar]
  14. Spoelder, J.; Ellens, R.; Turkensteen, L.J.; Schepers, H. Comparing pathogenicity of Alternaria solani and Alternaria alternata in potato. In Fourteenth Euroblight Workshop Limassol, Cyprus. PPO–Spec. Rep. 2014, 16, 97–102. [Google Scholar]
  15. Leiminger, J.; Bäßler, E.; Knappe, C.; Bahnweg, G.; Hausladen, H. Quantification of disease progression of Alternaria spp. on potato using real-time PCR. Eur. J. Plant Pathol. 2015, 141, 295–309. [Google Scholar] [CrossRef]
  16. Horsfield, A.; Wicks, T.; Davies, K.; Wilson, D.; Paton, S. Effect of fungicide use strategies on the control of early blight (Alternaria solani) and potato yield. Australas. Plant Pathol. 2010, 39, 368–375. [Google Scholar] [CrossRef]
  17. Abuley, I.K.; Nielsen, B.J.; Labouriau, R. Resistance status of cultivated potatoes to early blight (Alternaria solani) in Denmark. Plant Pathol. 2018, 67, 315–326. [Google Scholar] [CrossRef]
  18. Ghahreman, N.; Varshaviana, V.; Javan-Nikkhahb, M.; Liaghata, A. Forecasting of potato early blight disease using different sets of meteorological data. Can. J. Appl. Sci. 2015, 3, 59–66. [Google Scholar]
  19. Franc, G.D.; Harrison, M.D.; Lahman, L.K. A simple day-degree model for initiating chemical control of potato early blight in Colorado. Plant Dis. 1988, 72, 851–854. [Google Scholar] [CrossRef]
  20. Gleason, M.L.; MacNab, A.A.; Pitblado, R.E.; Ricker, M.D.; East, D.A.; Latin, R.X. Disease-warning systems for processing tomatoes in eastern North America: Are we there yet? Plant Dis. 1995, 79, 113–121. [Google Scholar] [CrossRef]
  21. Harms, T.; Howard, R.; Konschuh, M. Evaluation of Early Blight (Alternaria solani) Prediction Techniques for Southern Alberta. n.d. Available online: http://www.demofarm.ca/pdf/early_blight_prediction.pdf (accessed on 15 September 2021).
  22. Abuley, I.K.; Nielsen, B.J. Integrating cultivar resistance into the TOMCAST model to control early blight of potato, caused by Alternaria solani. Crop Prot. 2019, 117, 69–76. [Google Scholar] [CrossRef]
  23. Landschoot, S.; De Reu, J.; Audenaert, K.; Vanhaverbeke, P.; Haesaert, G.; De Baets, B.; Waegeman, W. Potentials and limitations of existing forecasting models for Alternaria on potatoes: Challenges for model improvement. Potato Res. 2017, 60, 61–76. [Google Scholar] [CrossRef]
  24. Sands, P.J.; Hackett, C.; Nix, H.A. A model of the development and bulking of potatoes (Solanum tuberosum L.) I. Derivation from well-managed field crops. Field Crops Res. 1979, 2, 309–331. [Google Scholar] [CrossRef]
  25. Pscheidt, J.W.; Stevenson, W.R. Comparison of forecasting methods for control of potato early blight in Wisconsin. Plant Dis. 1986, 70, 915–920. [Google Scholar] [CrossRef] [Green Version]
  26. Wang, E.; Engel, T. Simulation of phenological development of wheat crops. Agric. Syst. 1998, 58, 1–24. [Google Scholar] [CrossRef]
  27. Streck, N.A.; de Paula, F.L.M.; Bisognin, D.A.; Heldwein, A.B.; Dellai, J. Simulating the development of field grown potato (Solanum tuberosum L.). Agric. For. Meteorol. 2007, 142, 1–11. [Google Scholar] [CrossRef]
  28. Madden, L.; Pennypacker, S.P.; MacNab, A.A. FAST, a forecast system for Alternaria solani on tomato. Phytopathology 1978, 68, 1354–1358. [Google Scholar] [CrossRef] [Green Version]
  29. Gent, D.H.; Schwartz, H.F. Validation of potato early blight disease forecast models for Colorado using various sources of meteorological data. Plant Dis. 2003, 87, 78–84. [Google Scholar] [CrossRef]
  30. Olanya, O.M.; Honeycutt, C.W.; Larkin, R.P.; Griffin, T.S.; He, Z.; Halloran, J.M. The effect of cropping systems and irrigation management on development of potato early blight. Plant Pathol. J. 2009, 75, 367–375. [Google Scholar] [CrossRef]
  31. Iglesias, I.; Rodríguez-Rajo, F.J.; Méndez, J. Evaluation of the different Alternaria prediction models on a potato crop in A Limia (NW of Spain). Aerobiologia 2007, 23, 27–34. [Google Scholar] [CrossRef]
  32. Cowgill, W.P.; Maletta, M.H.; Manning, T.; Tietjen, W.H.; Johnston, S.A.; Nitzsche, P.J. Early blight forecasting systems: Evaluation, modification, and validation for use in fresh-market tomato production in northern New Jersey. HortScience 2005, 40, 85–93. [Google Scholar] [CrossRef] [Green Version]
  33. Forsythe, W.C.; Rykiel, E.J.; Stahl, R.S.; Wu, H.I.; Schoolfield, R.M. A model comparison for daylength as a function of latitude and day of year. Ecol. Modell. 1995, 80, 87–95. [Google Scholar] [CrossRef]
  34. Pscheidt, J.W.; Stevenson, W.R. The critical period for control of early blight (Alternaria solani) of potato. Am. Potato J. 1988, 65, 425–438. [Google Scholar] [CrossRef]
Figure 1. Evolution of weather parameters and phenology for the five crop seasons. Date of first symptoms is marked with arrows. DAE: days after emergence.
Agronomy 12 01611 g001
Figure 2. Differences (in days) between risk predicted and observed first early blight symptoms of the tested models in each growing season. Results of Bonferroni test are showed in grey brackets and different letters indicate significant differences between the models (p < 0.05).
Agronomy 12 01611 g002
Figure 3. RMSE (root mean square error) of each forecasting model in predicting the first day of early blight symptoms.
Agronomy 12 01611 g003
Table 1. Date of planting and emergence of the potato growing seasons.
20172018201920202021
Planting22 April15 May16 May26 May19 May
End of senescence11 August17 September1 September31 August25 August
Table 2. Forecasting models for potato early blight and risk units established by authors in different geographical areas. P-days: Physiological Days; GDD: Growing Degree Days; WE: Wang Engel; IWP: Interrupted Wetting Period.
ModelRisk UnitsGeographical AreaRef.
Plant-based
P-Days300Wisconsin (USA)[25]
South Alberta (Canada) [21]
Colorado (USA)[29]
Maine (USA)[30]
Irán[18]
330Denmark[4]
585–830Flanders (Belgium)[23]
GDDs361–417San Luis Valley (USA)[19]
625Irán[18]
1000Wisconsin (USA)[25]
WE 1Brazil[27]
Pathogen-based
IWP6Spain[31]
South Africa[8]
TOMCAST10Spain[11,12]
15Maine (USA)[30]
15–20–25Denmark[4,17]
17South Alberta (Canada) [21]
20Ontario (Canada)[20]
20–25New Jersey (USA)[32]
Plant-pathogen-based
TOMCAST + Maturity25 + 330Denmark[4]
Table 3. Date of phenology stages and first early blight symptoms during the five crop seasons.
Date (DAE *)
20172018201920202021
Emerging stage16 May (1)1 June (1)4 June (1)10 June (1)10 June (1)
Reproductive stage13 June (29)4 July (34)13 July (40)13 July (34)14 July (35)
Senescence stage19 July (65)15 August (76)17 August (75)14 August (66)7 August (59)
First symptoms21 June (38)8 July (38)13 July (40)16 July (37)17 July (38)
* DAE: Days after emerging.
Table 4. Adjustment of the original models of early blight in A Limia according to weather conditions and first observations of the disease in the field.
20172018201920202021Mean (CI)
DAE of first symptoms3738403738
Plant-based models
P-days260290265257281271 (258–283)
GDDs413385351393376384 (364–404)
WE model1.371.391.471.371.381.40 (1.36–1.43)
Pathogen-based models
IWP181727253424 (18–29)
IWP (88%)313435323233 (32–34)
TOMCAST172918103422 (13–30)
Plant-pathogen-based model
TOMCAST + Maturity17 + 26029 + 29018 + 26510 + 25734 + 28122 + 271
(13 + 258–30 + 283)
DAE: days after emergence; (CI): confidence interval.
Publisher’s Note: MDPI stays neutral with regard to jurisdictional claims in published maps and institutional affiliations.

