
Effect of Different Levels of Zinc and Compost on Yield and Yield Components of Wheat

 ,
,  , ,
, ,  ,
, 
Abstract
:1. Introduction
2. Materials and Methods
2.1. Experimental Site and Design
2.2. Plot Dimensions and Wheat Variety
2.3. Fertilizer and Compost
2.4. Irrigation
- First = crown root initiation (4 acre-inches);
- Second = tillering stage (4 acre-inches);
- Third = heading stage (4 acre-inches);
- Fourth = milky stage/soft dough (4 acre-inches).
2.5. Treatment Plan
2.6. Soil Characterization
2.7. Harvesting and Data Collection
2.8. Statistical Analysis
3. Results
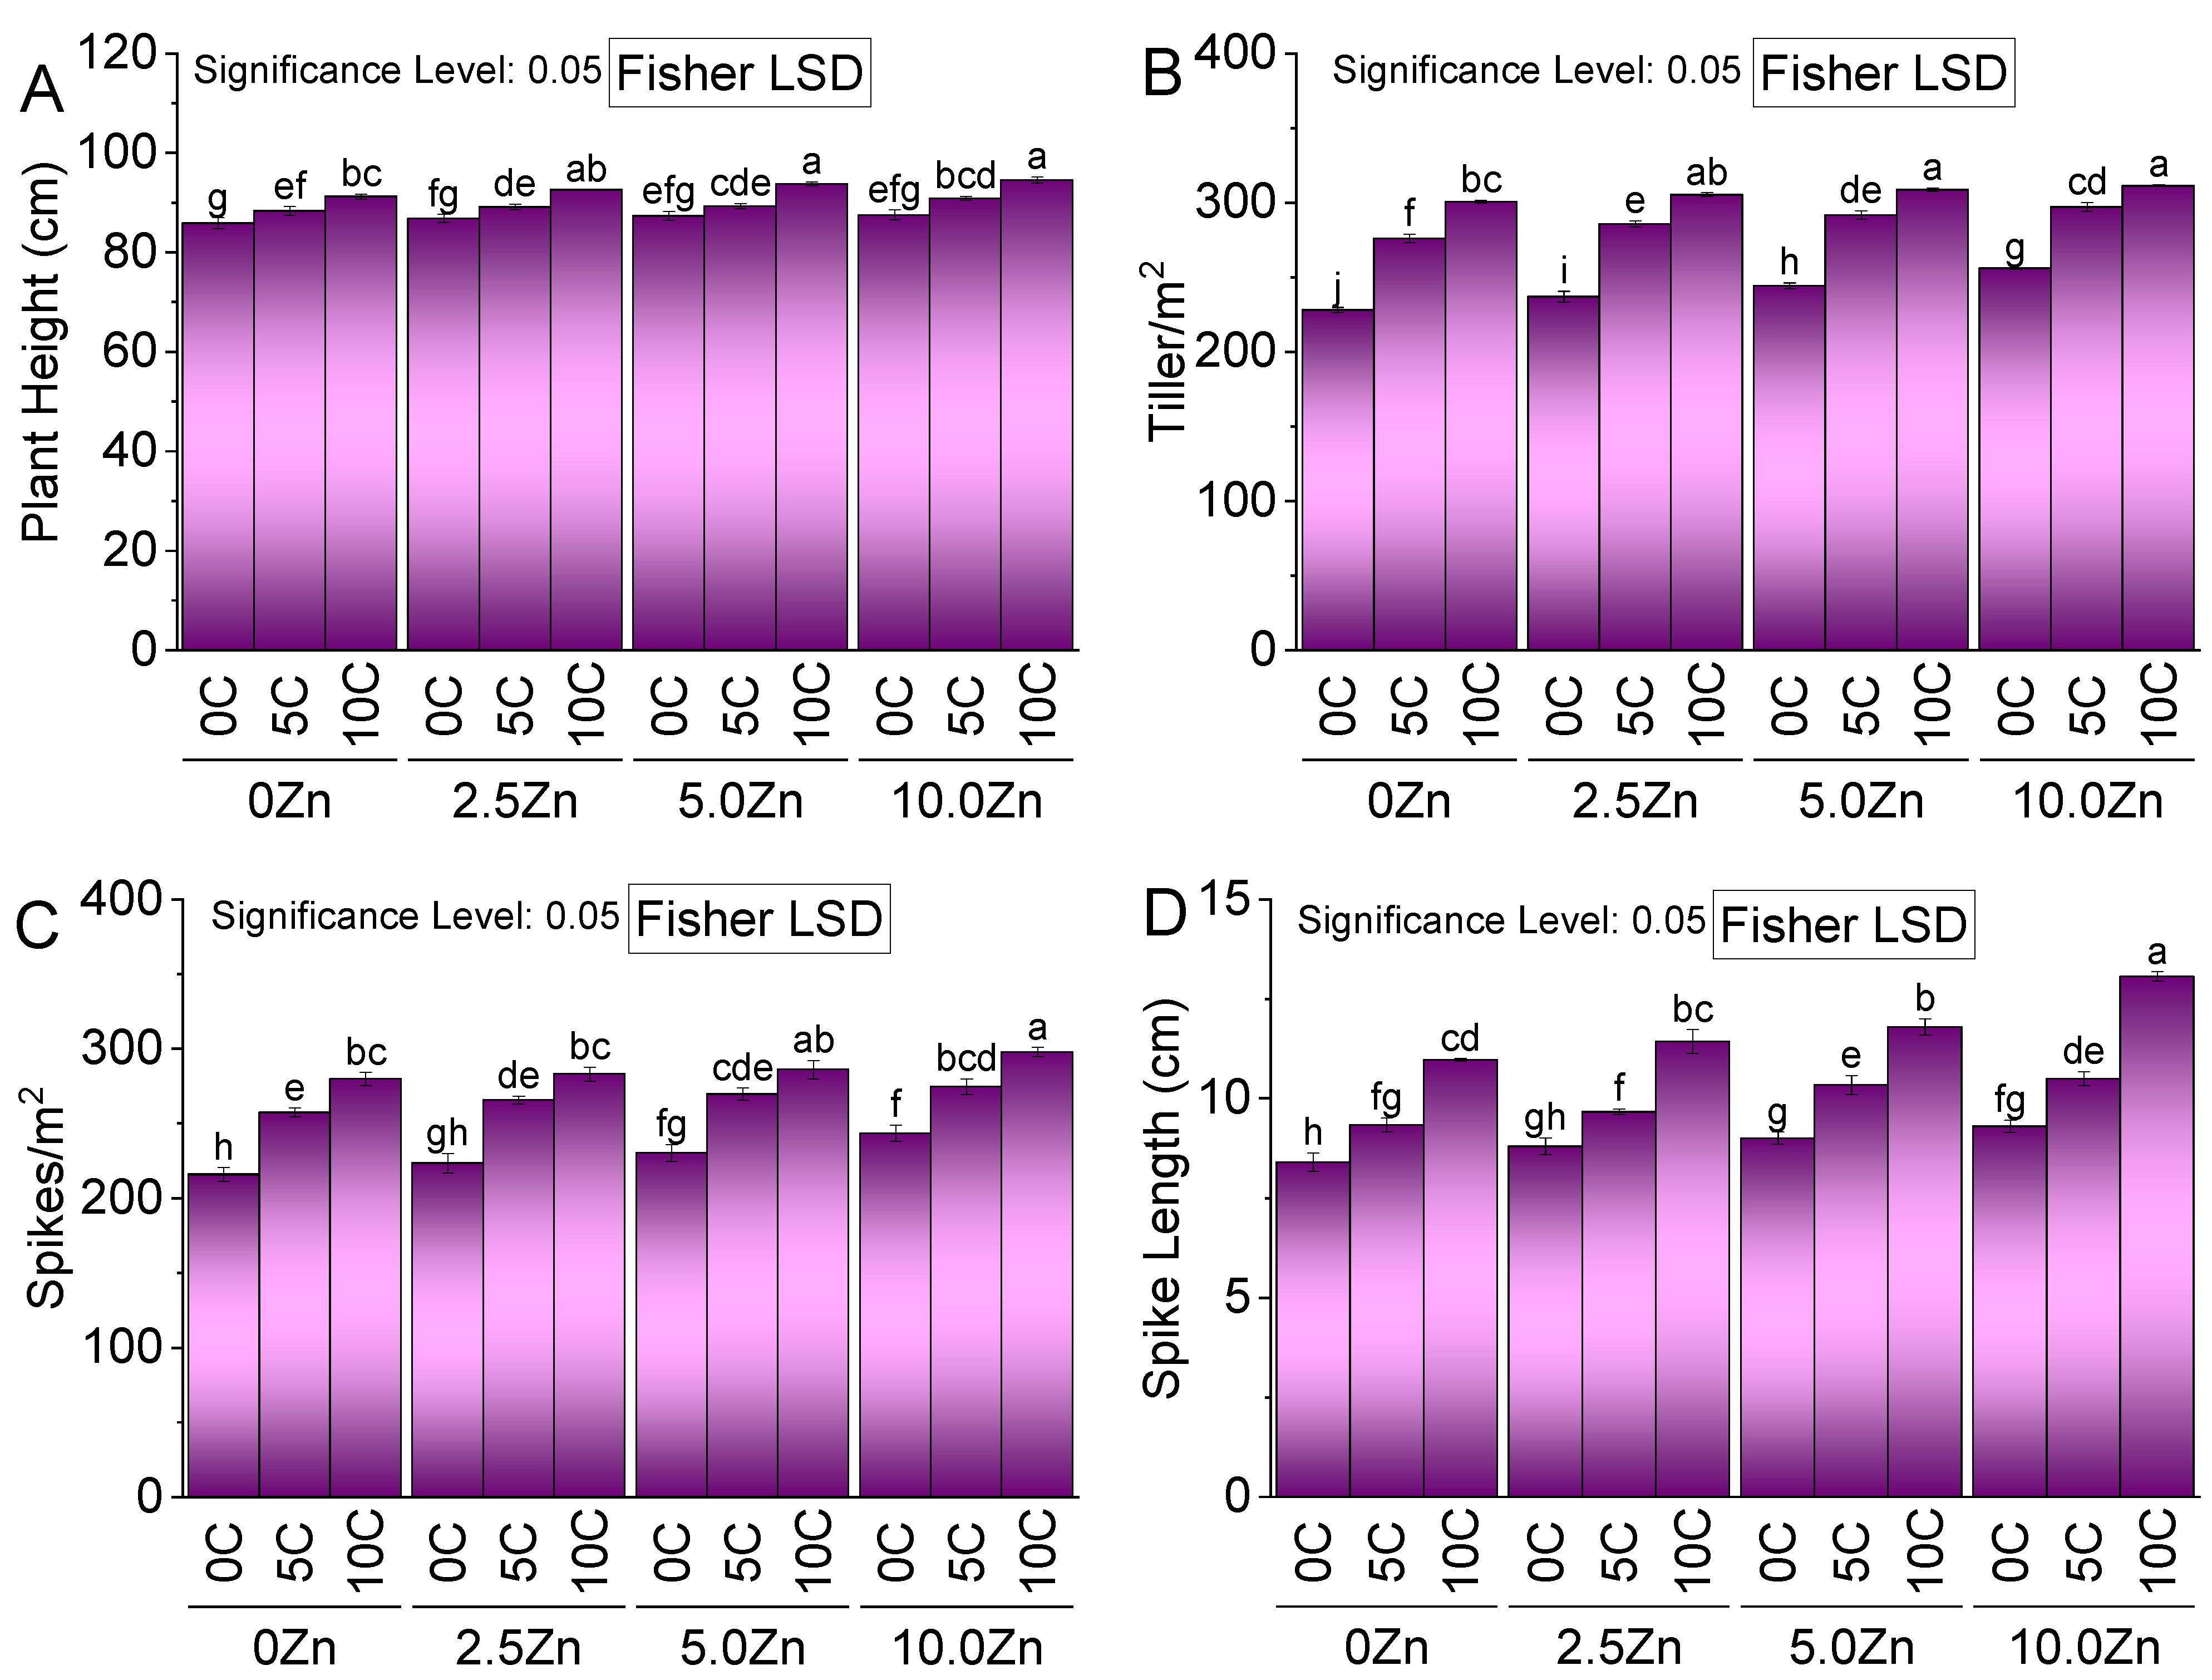
3.1. Plant Height
3.2. Tillers/m2
3.3. Spikes/m2
3.4. Spikes Length

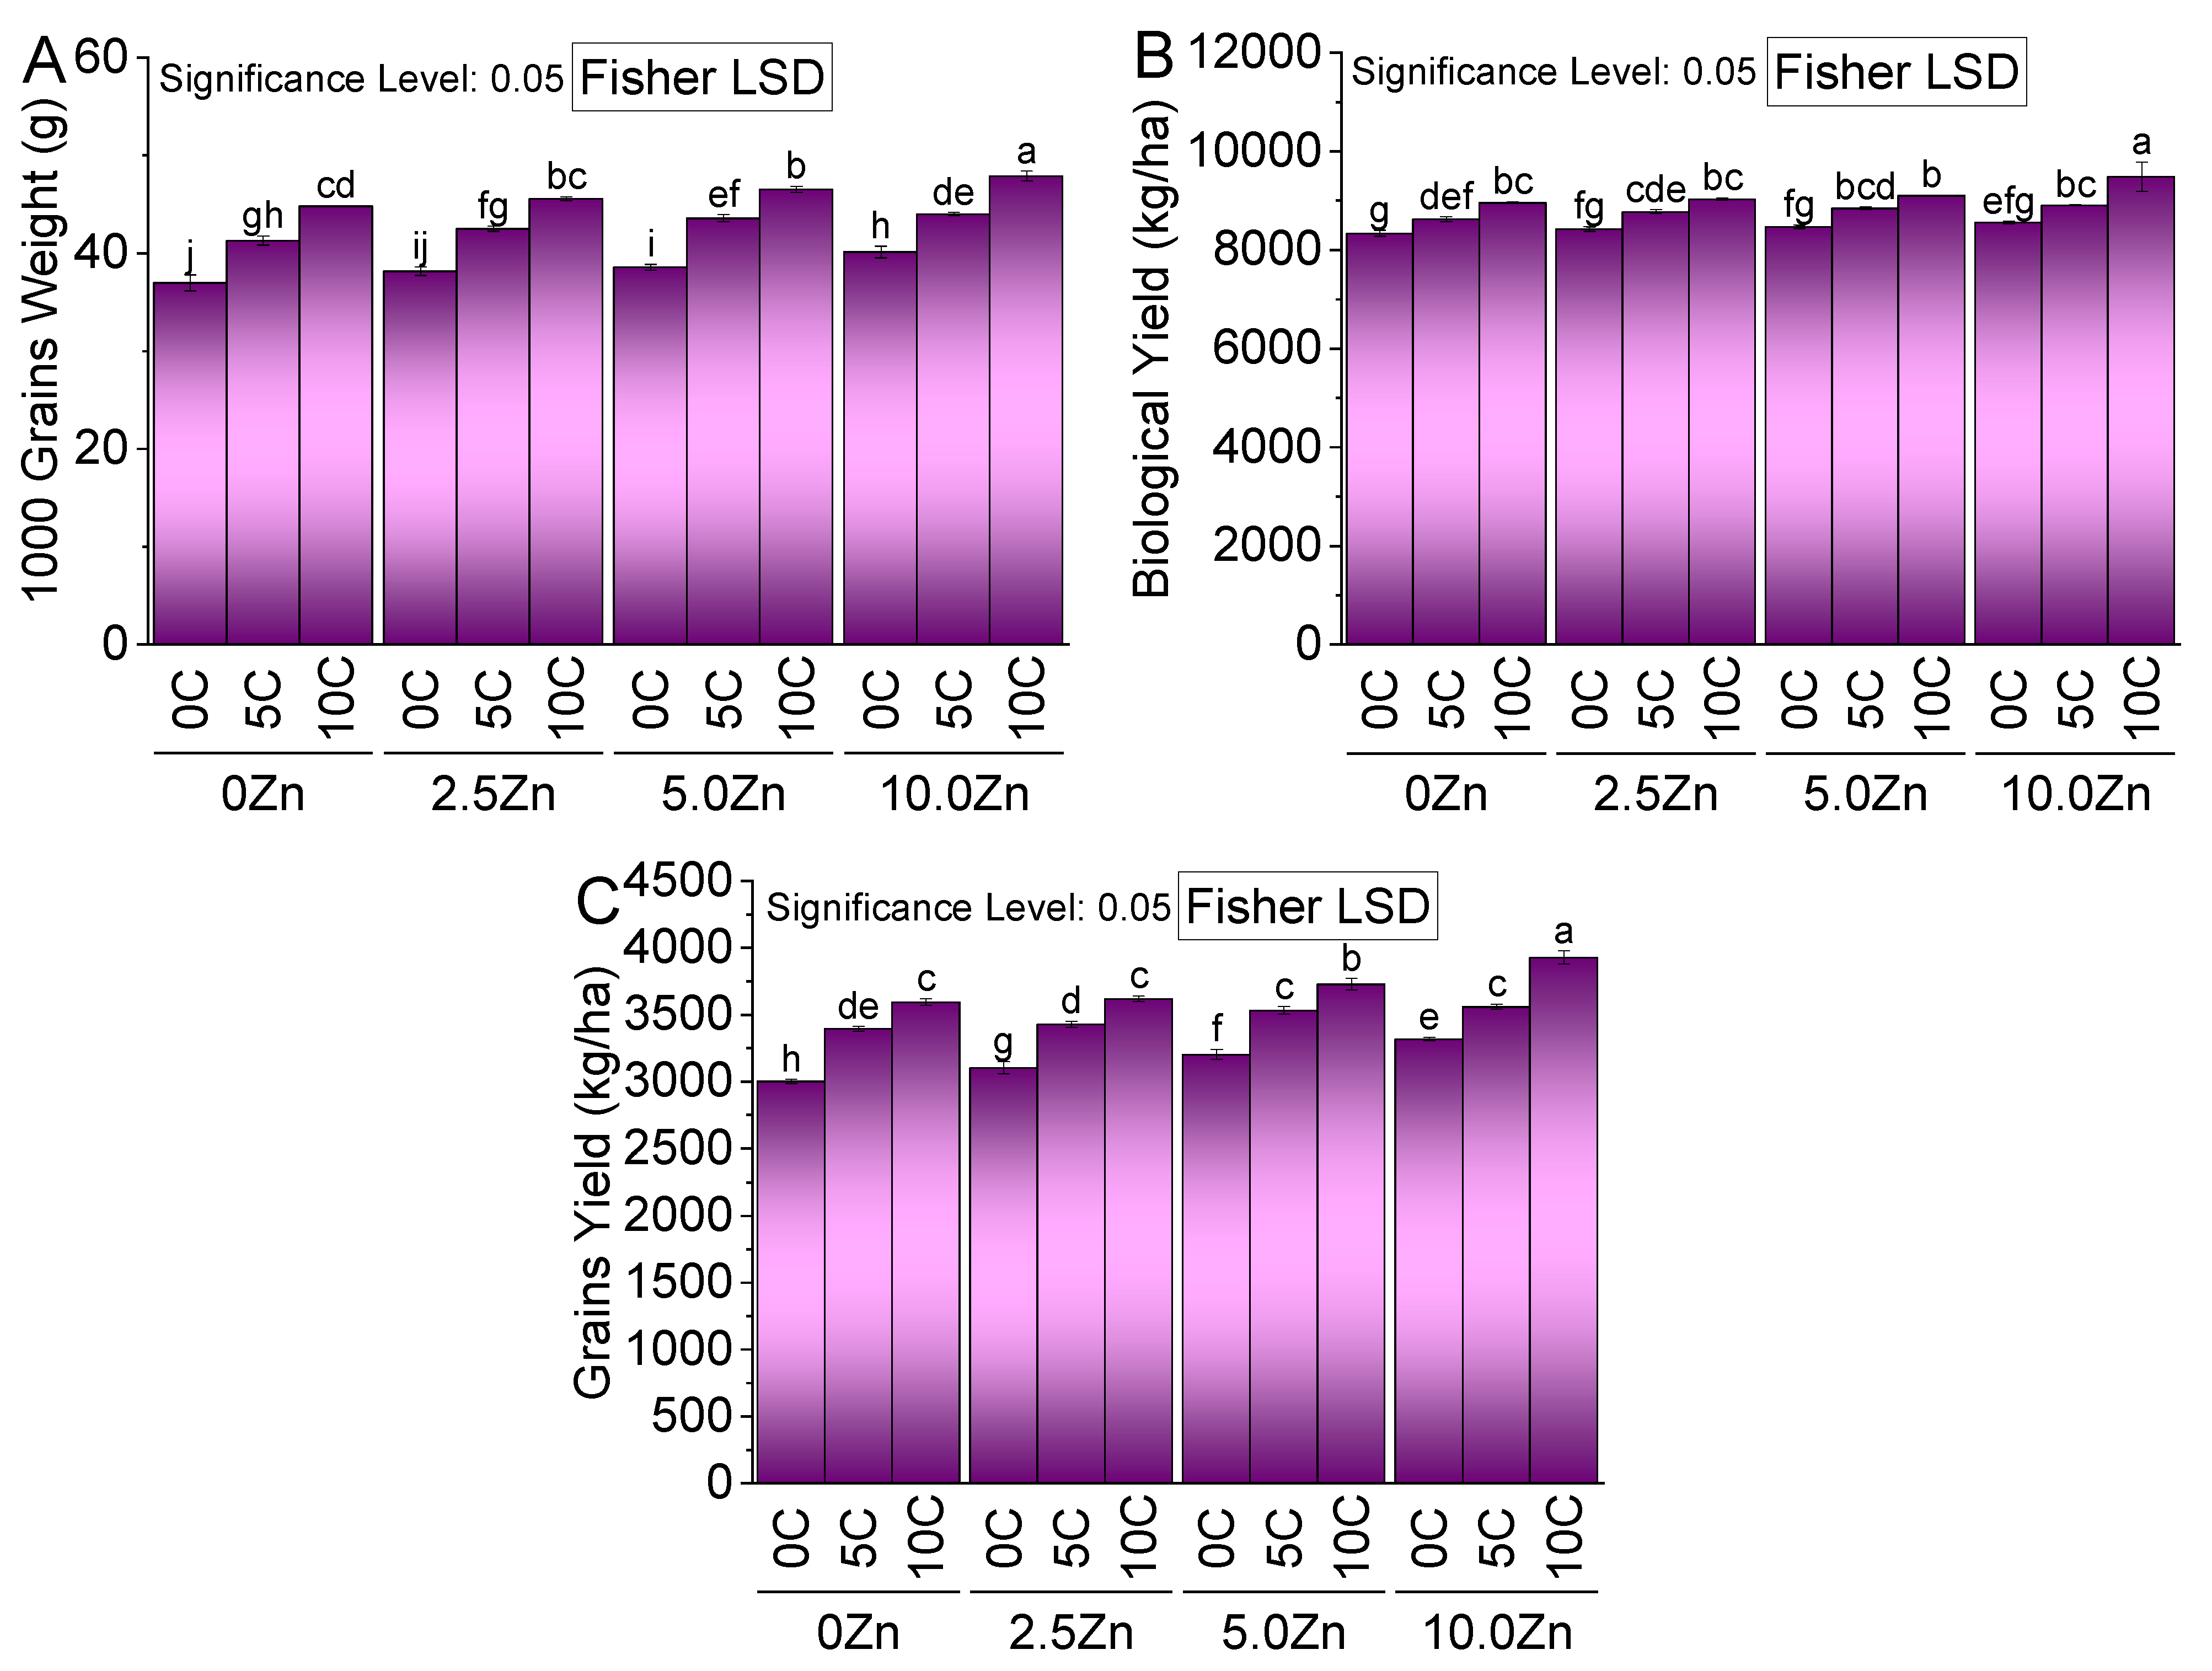
3.5. 1000-Grain Weight
3.6. Biological Yield
3.7. Grain Yield
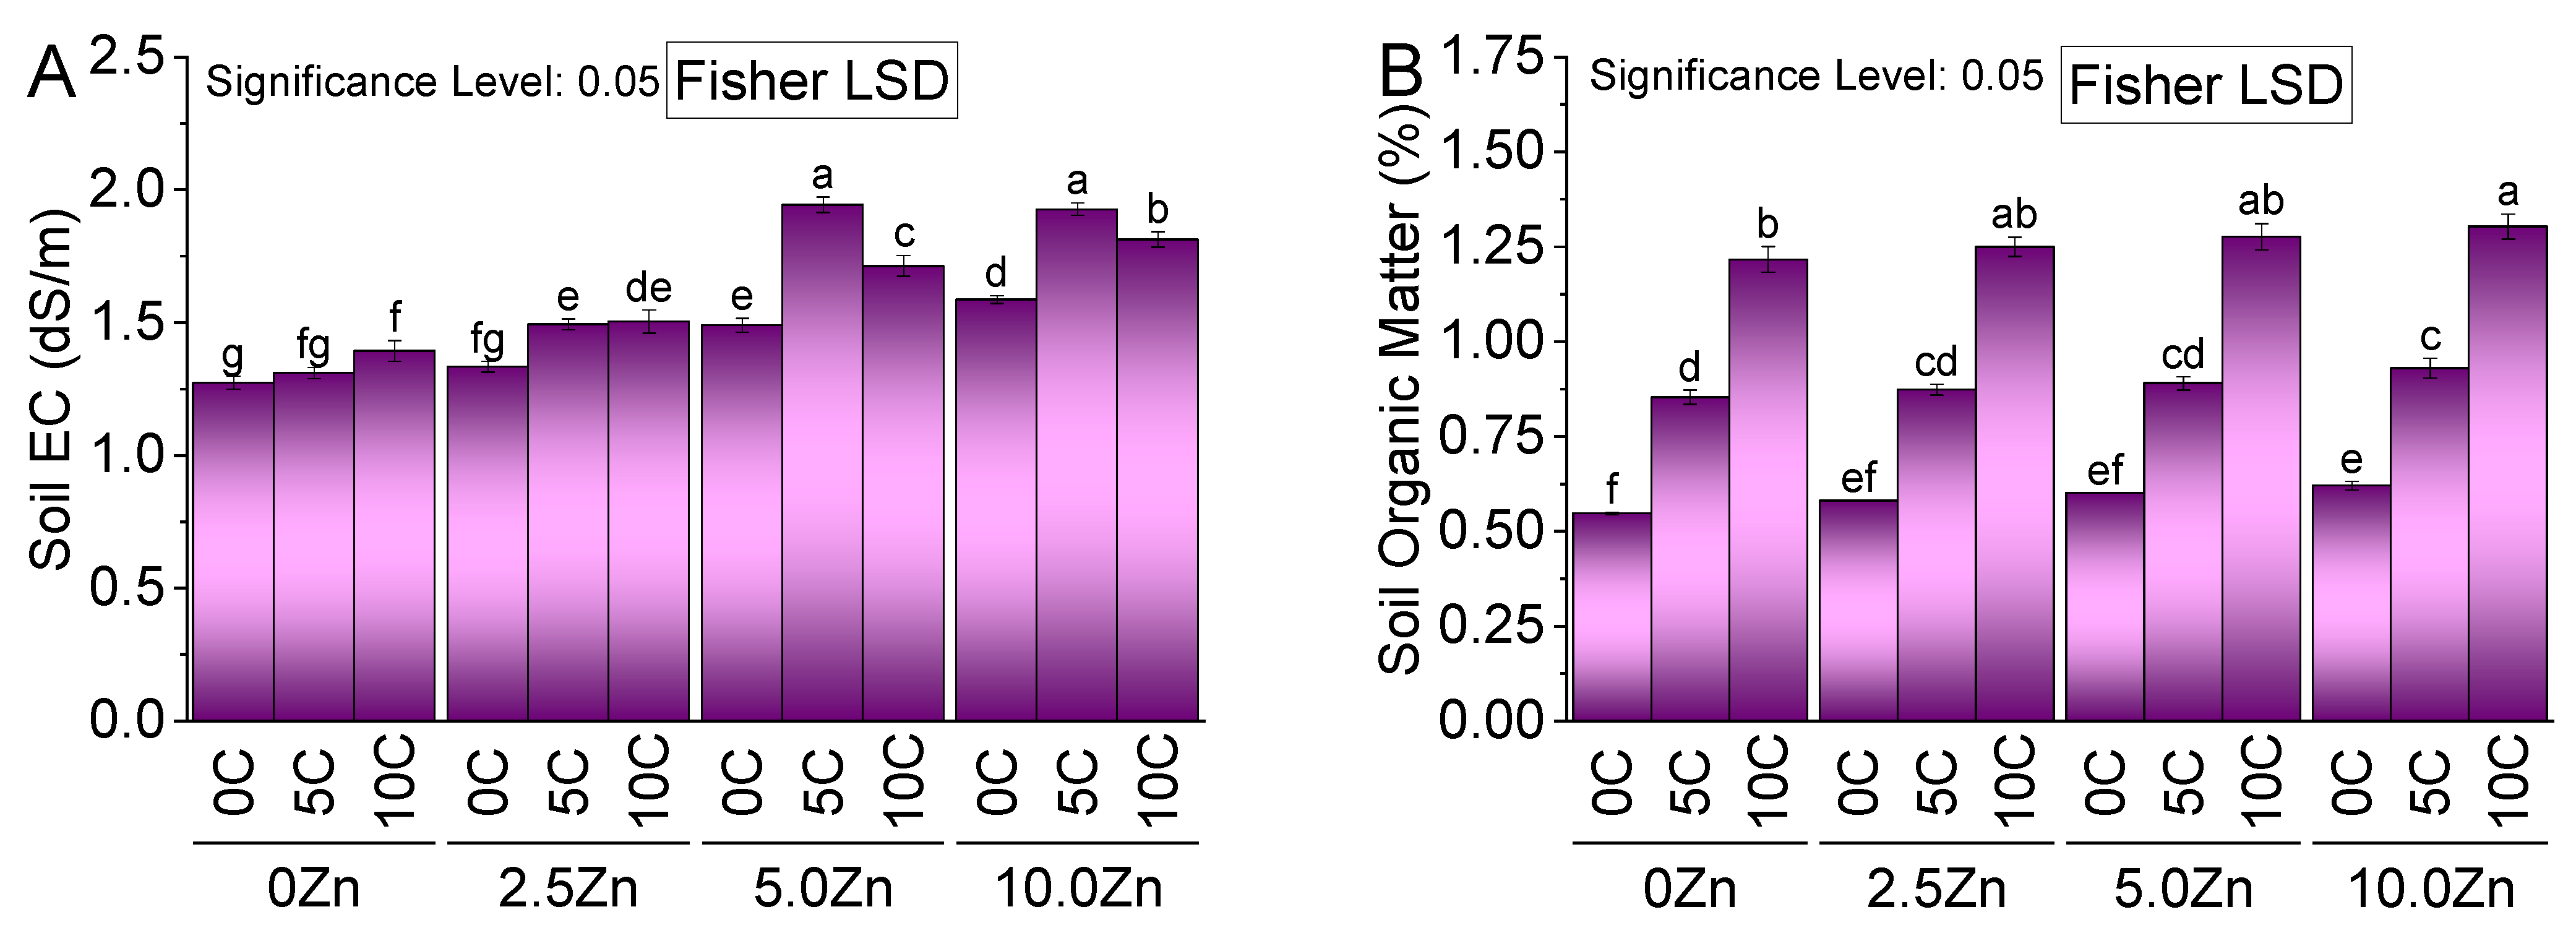
3.8. Soil EC and Organic Matter
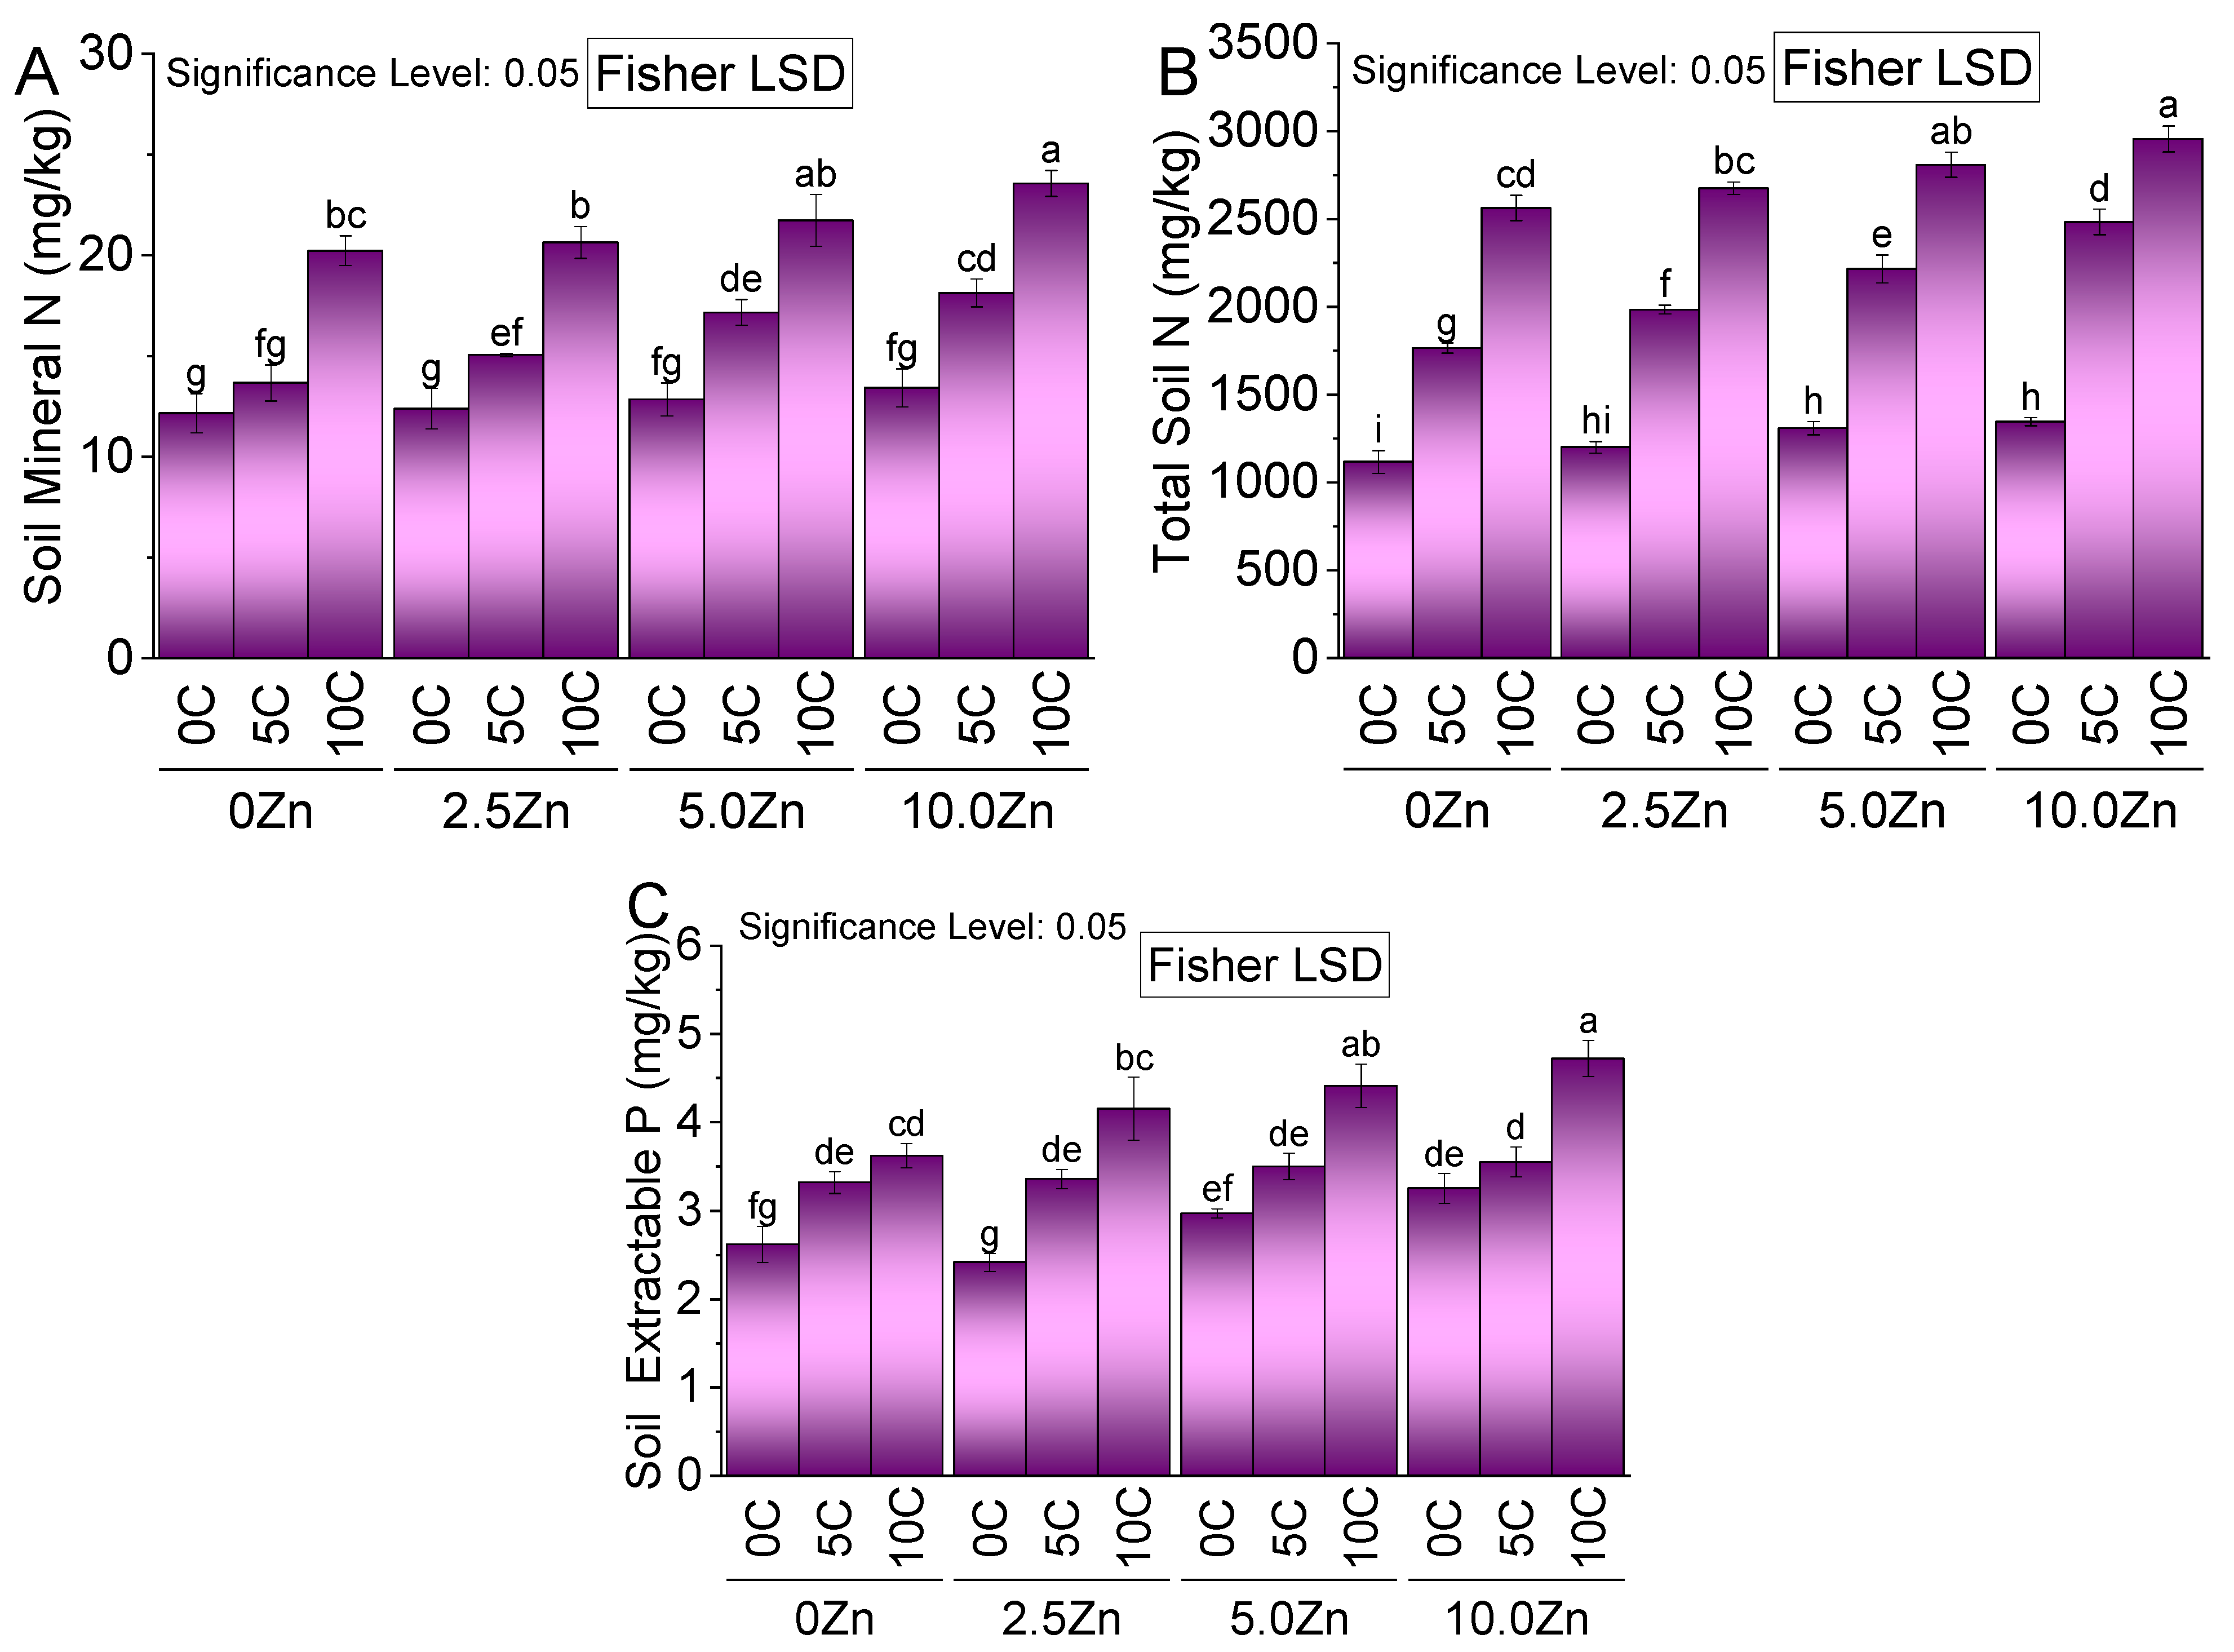
3.9. Soil Mineral Nitrogen
3.10. Soil Total Nitrogen
3.11. Soil Extractable Phosphorus
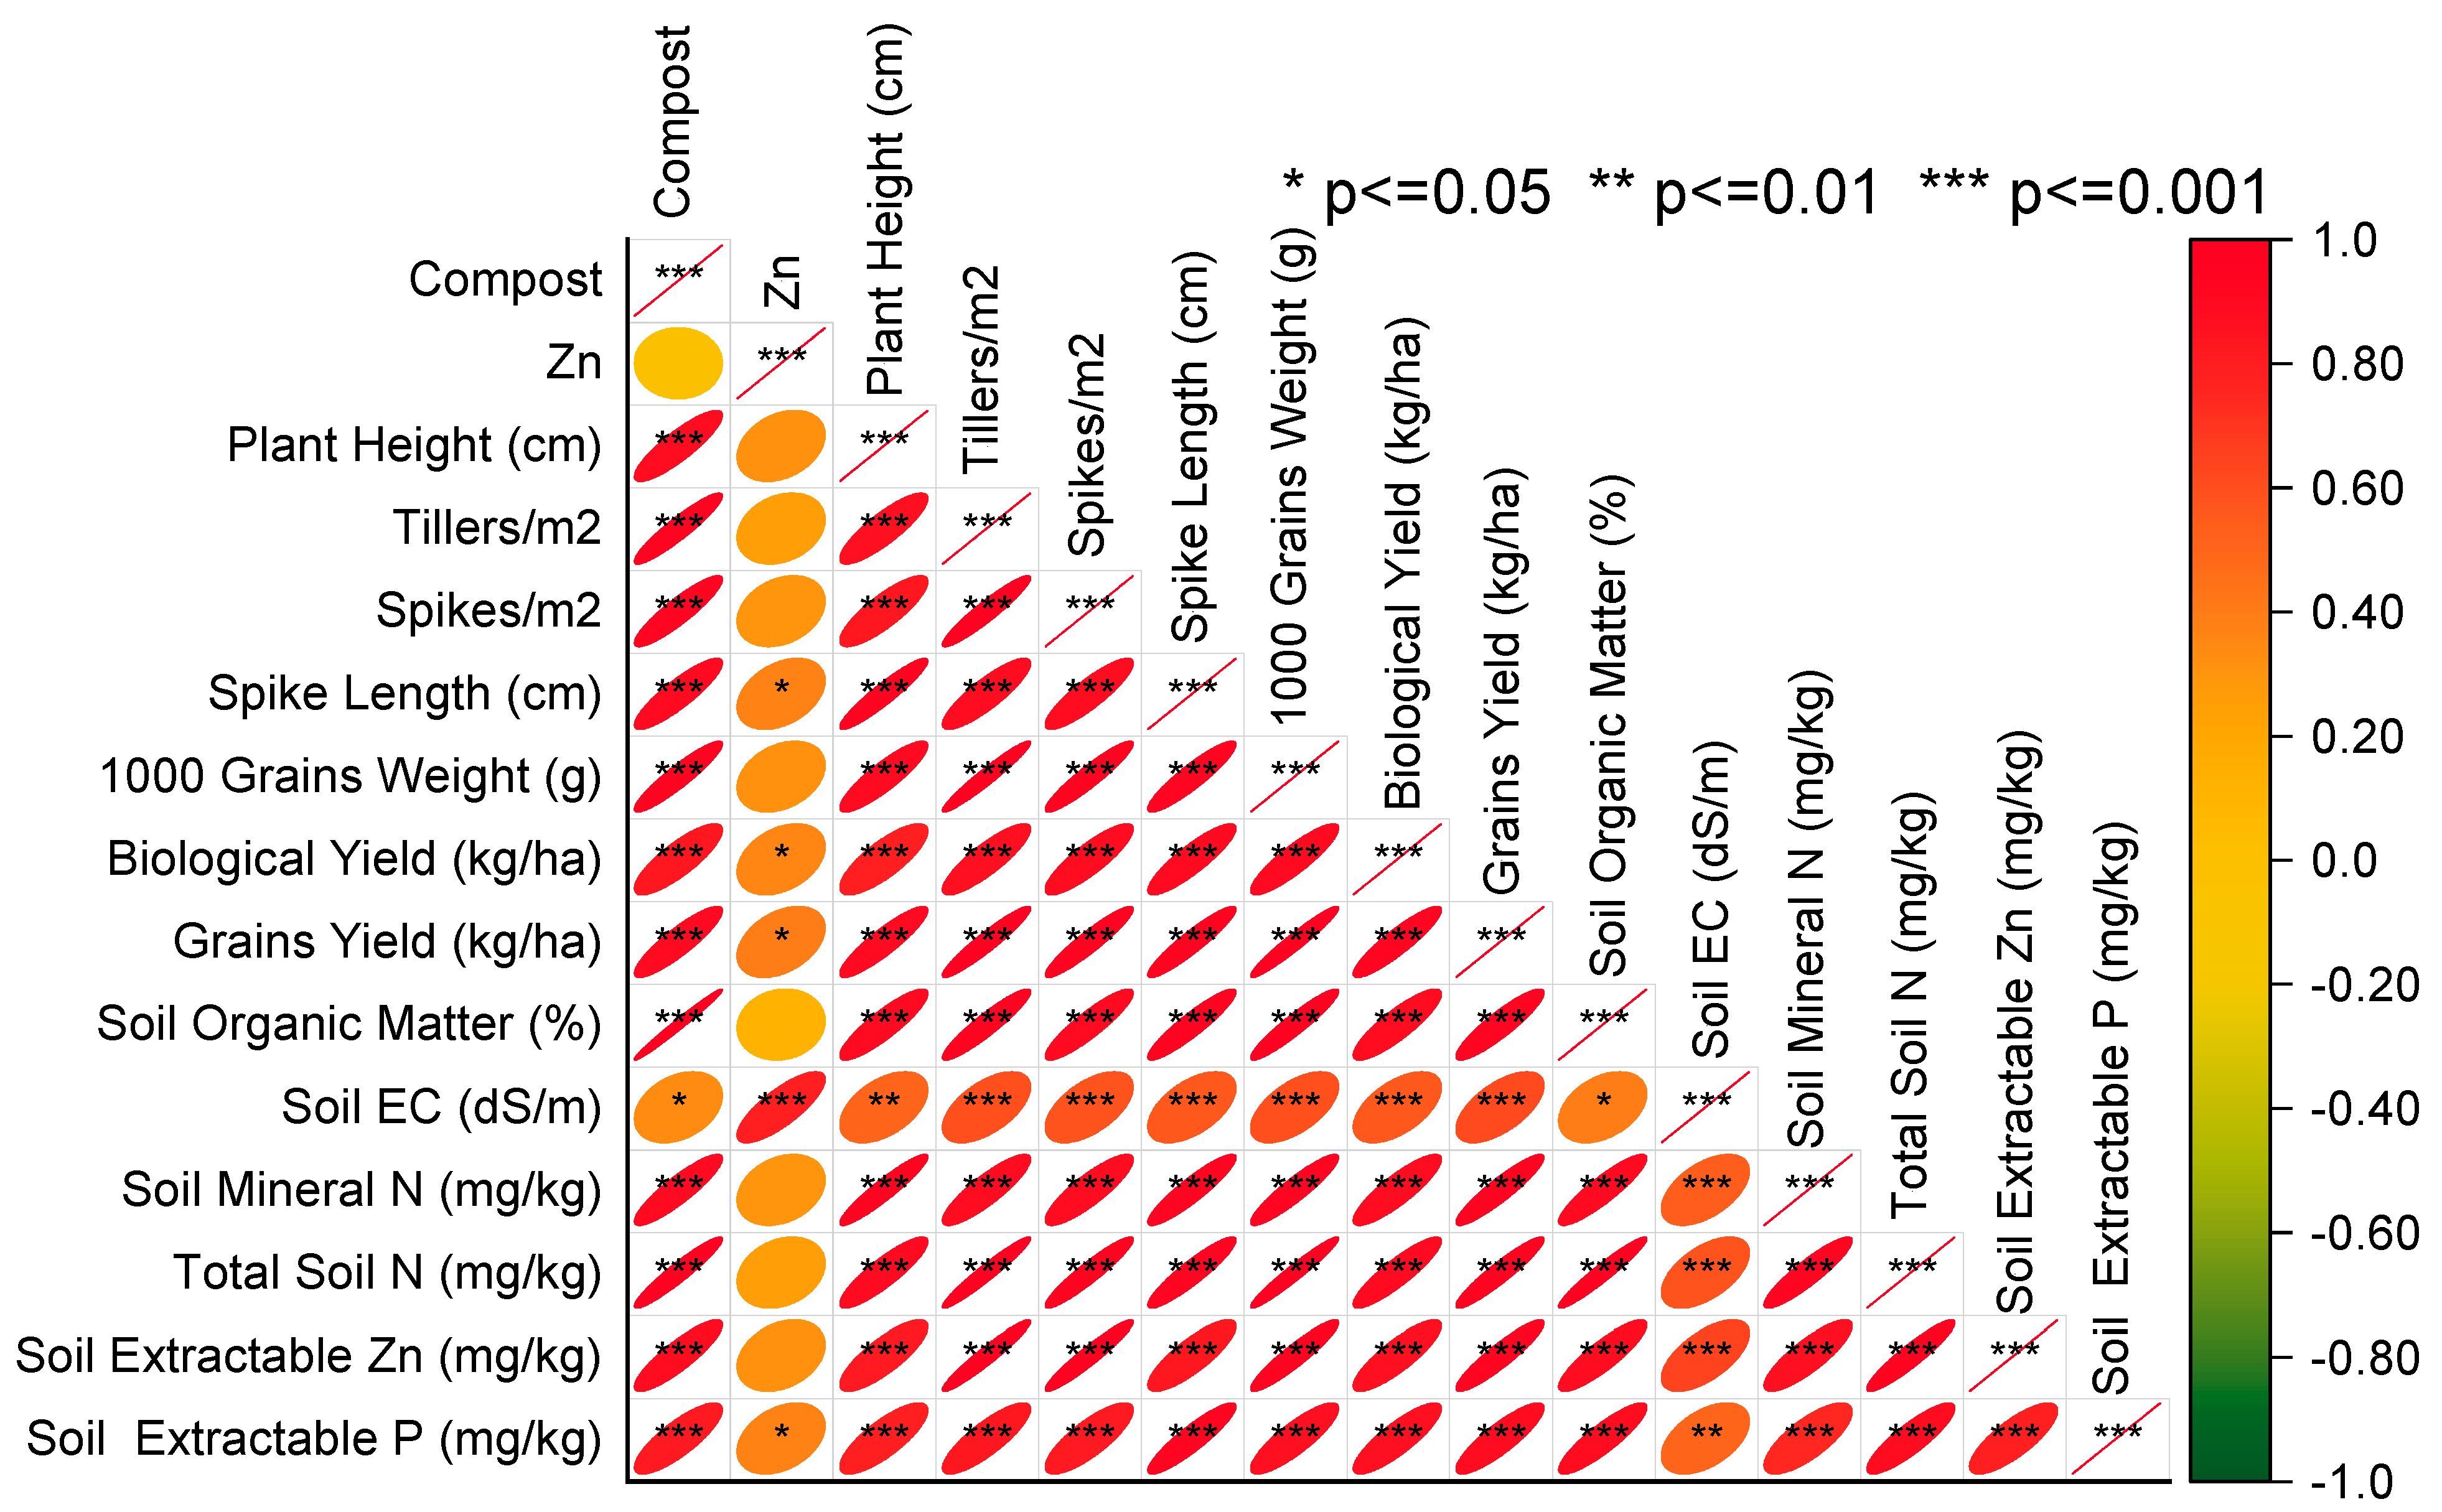
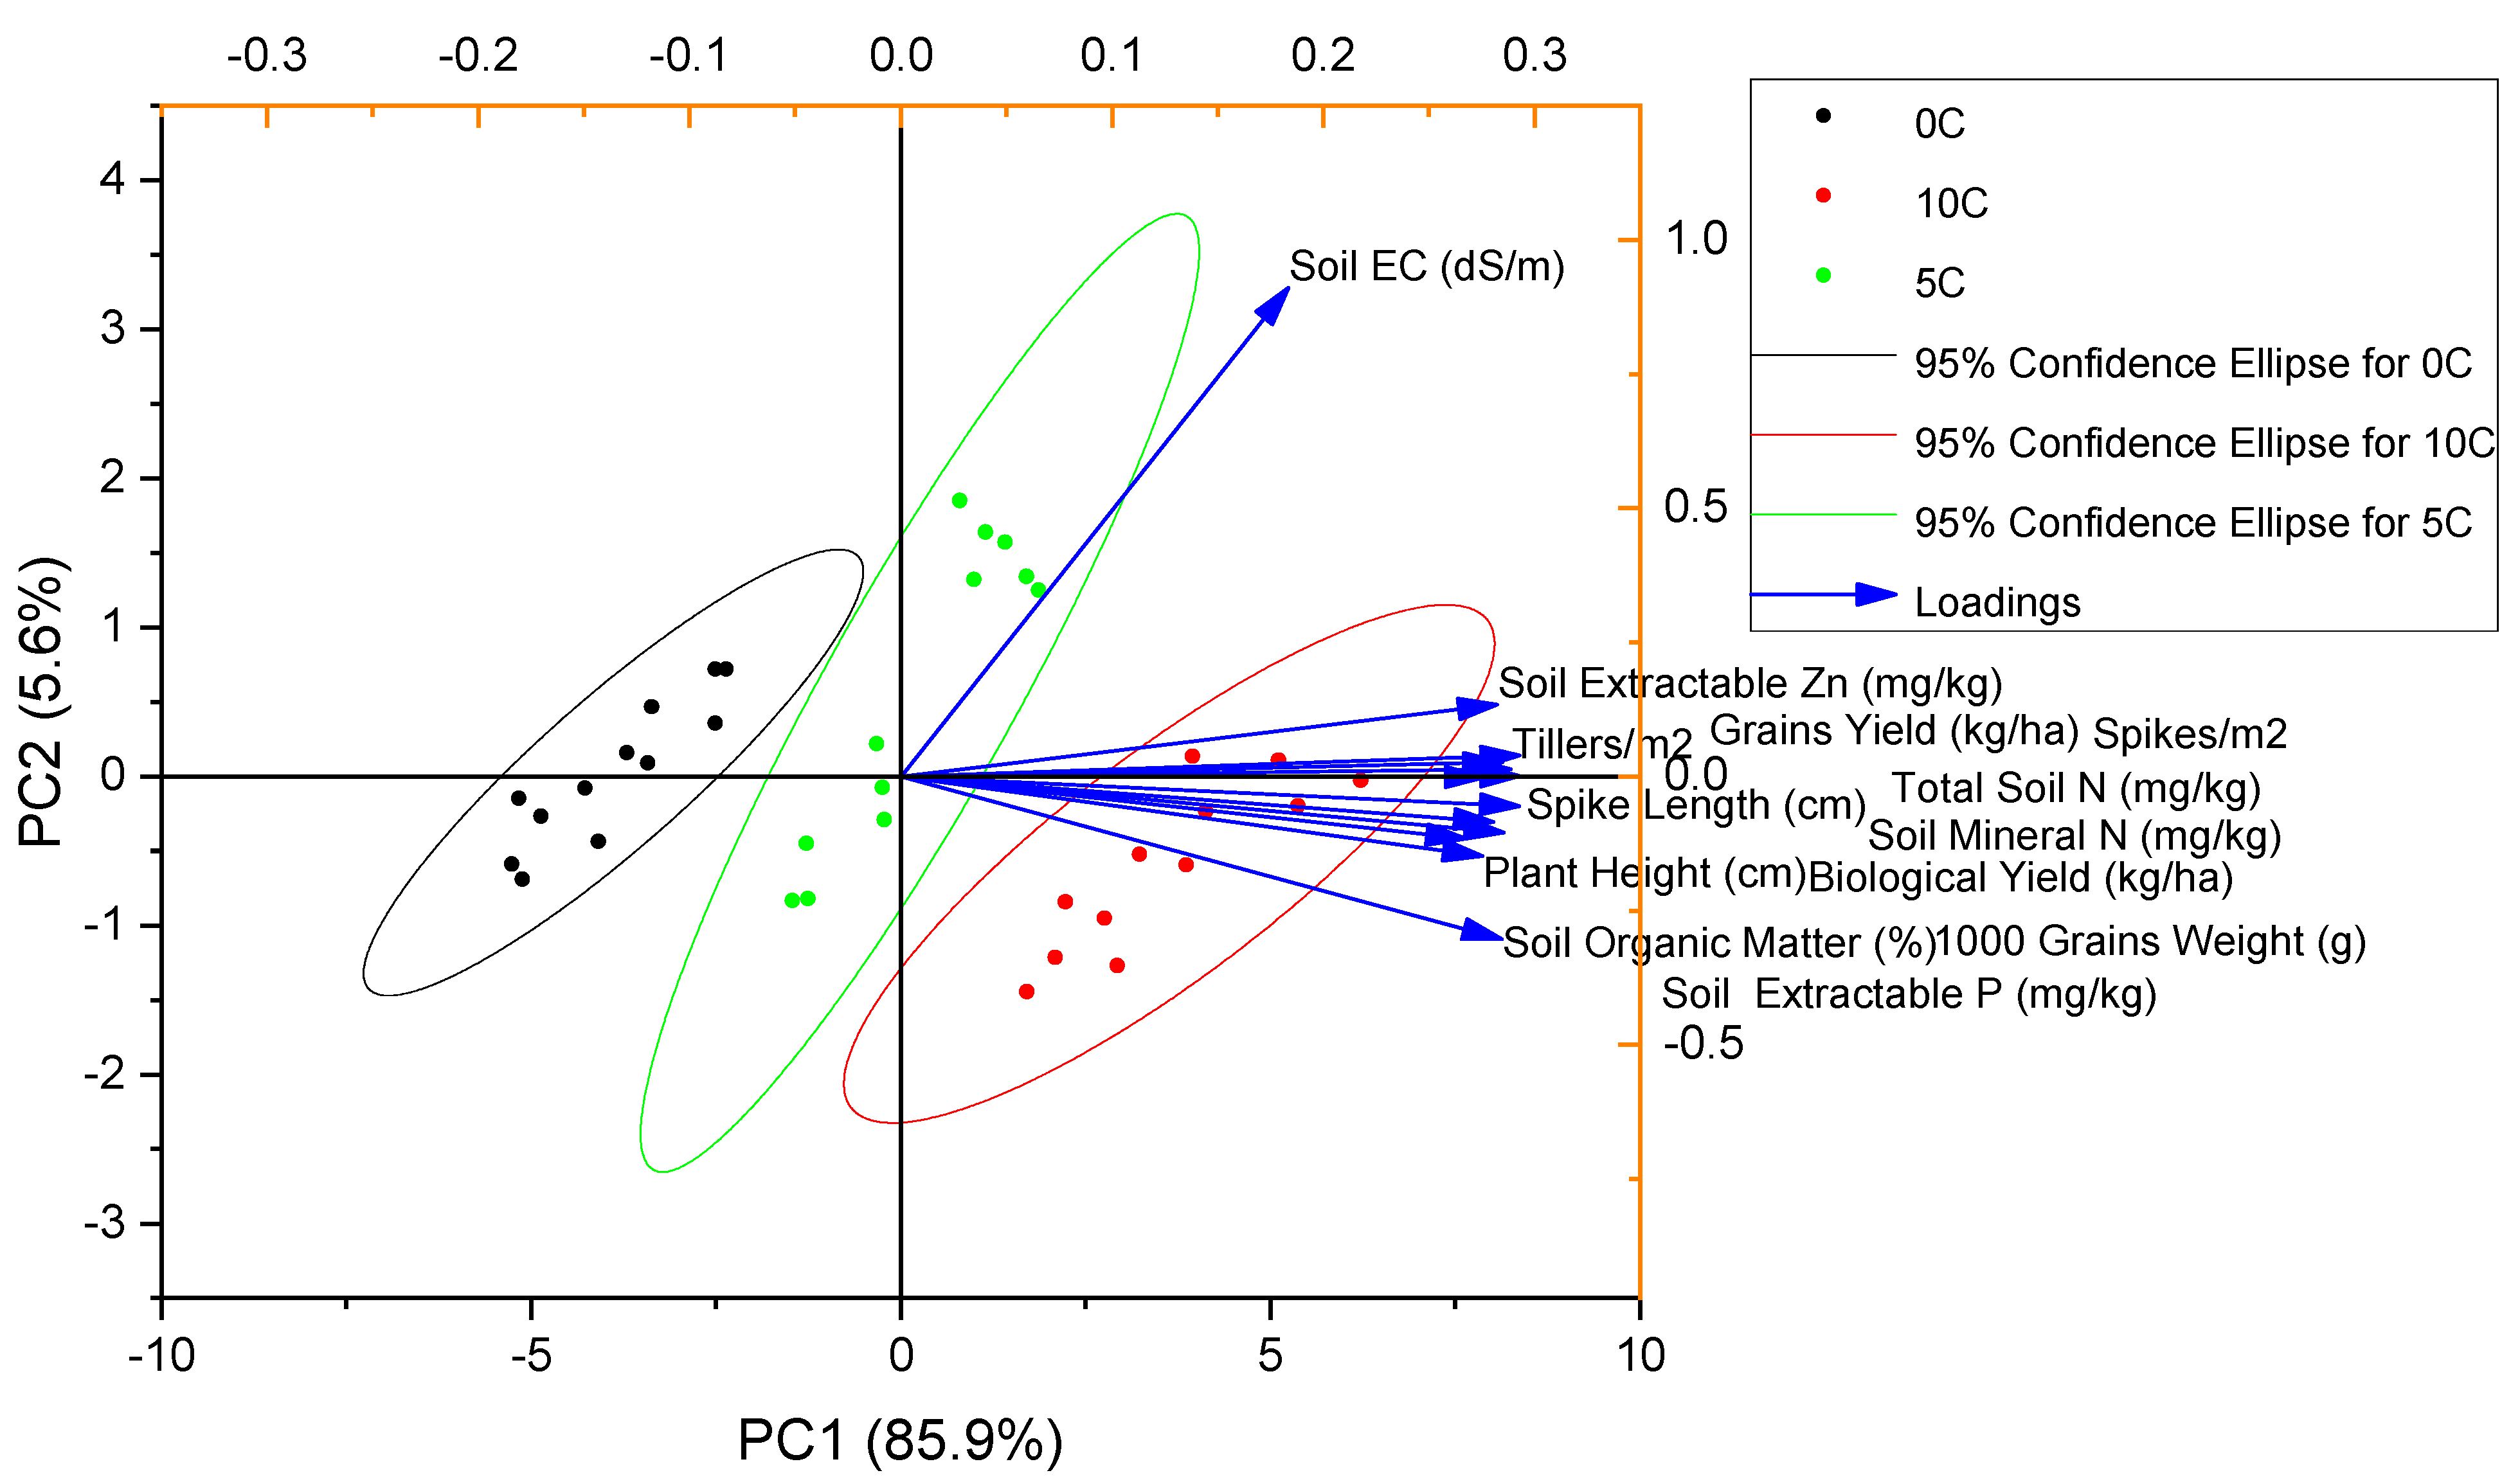
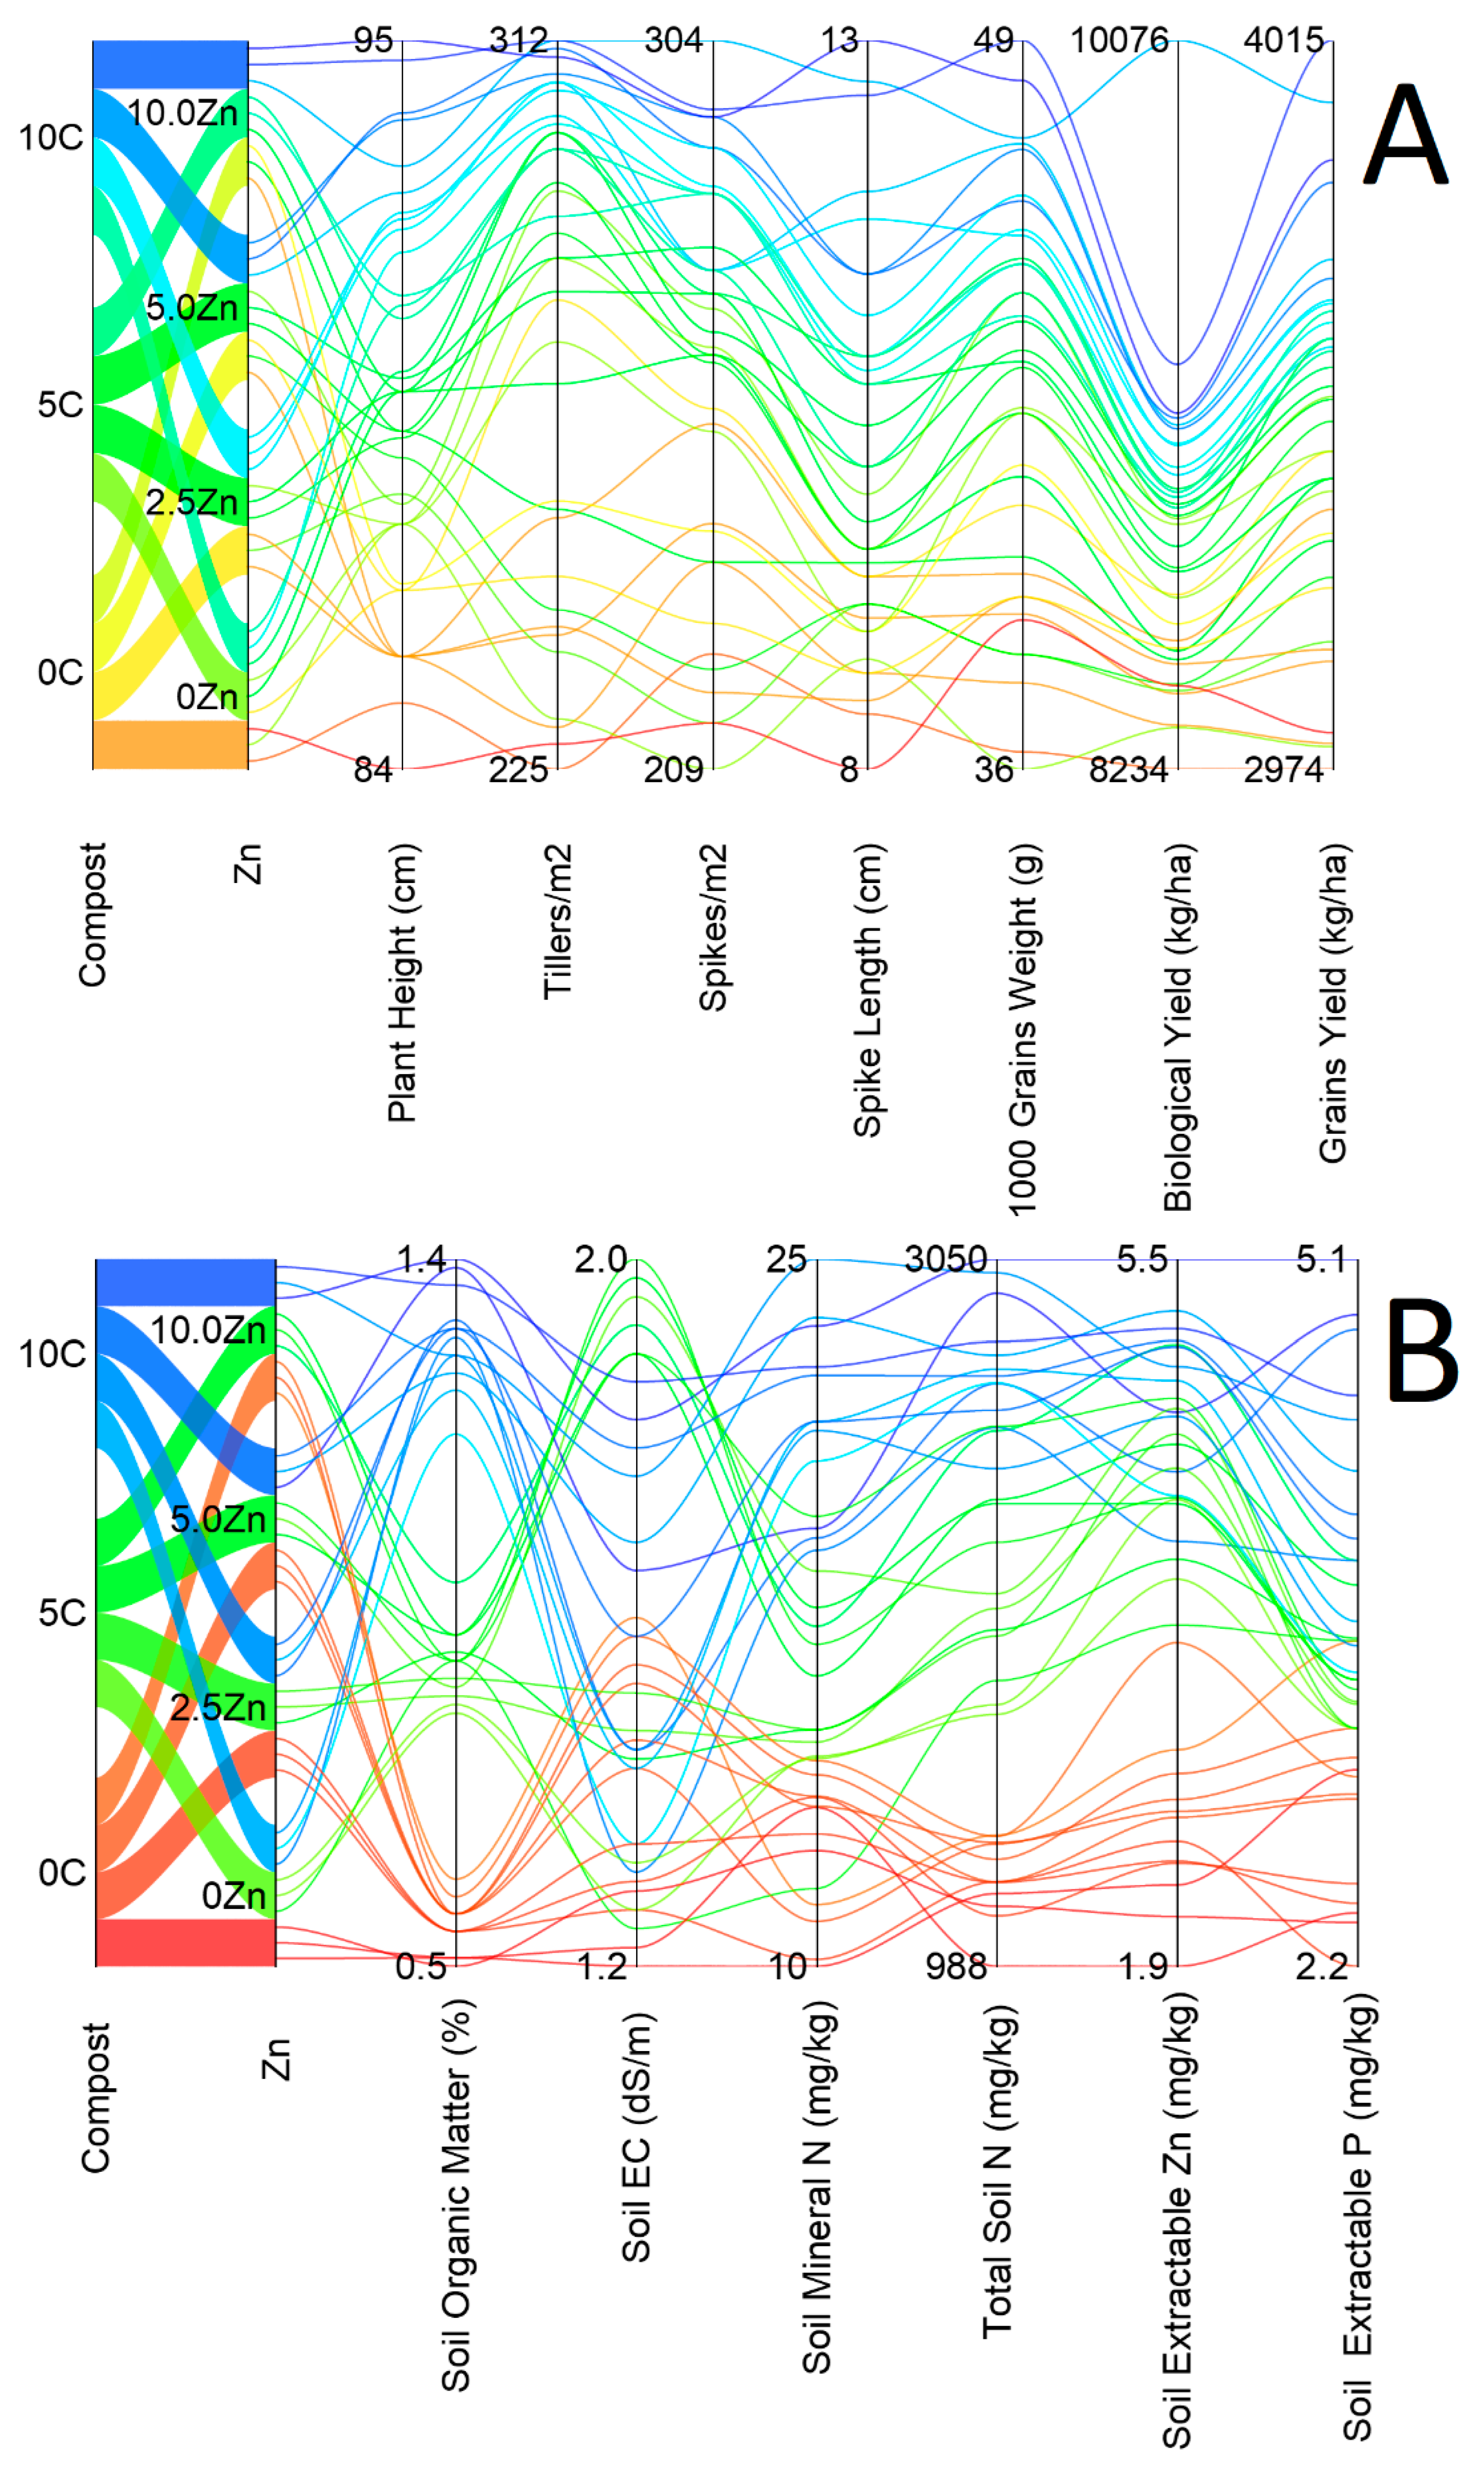
3.12. Pearson Correlation, Principal Component Analysis and Sankey Diagram
4. Discussion
5. Conclusions
Author Contributions
Funding
Acknowledgments
Conflicts of Interest
References
- Gibson, R.S. Zinc Deficiency and Human Health: Etiology, Health Consequences, and Future Solutions. Plant Soil 2012, 361, 291–299. [Google Scholar] [CrossRef]
- Chasapis, C.T.; Loutsidou, A.C.; Spiliopoulou, C.A.; Stefanidou, M.E. Zinc and Human Health: An Update. Arch. Toxicol. 2012, 86, 521–534. [Google Scholar] [CrossRef] [PubMed]
- Stevens, G.; Mascarenhas, M.; Mathers, C. Global Health Risks: Progress and Challenges. Bull. World Health Organ. 2009, 87, 646. [Google Scholar] [CrossRef] [PubMed]
- Alloway, B.J. Soil Factors Associated with Zinc Deficiency in Crops and Humans. Environ. Geochem. Health 2009, 31, 537–548. [Google Scholar] [CrossRef] [PubMed]
- Shaheen, R.; Samim, M.K.; Mahmud, R. Effect of Zinc on Yield and Zinc Uptake by Wheat on Some Soils of Bangladesh. J. Soil Nat. 2007, 1, 7–14. [Google Scholar]
- Kabata-Pendias, A. Trace Elements in Soils and Plants, 3rd ed.; Kabata-Pendias, A., Ed.; CRC Press Inc.: Boca Raton, FL, USA, 2000; ISBN 9781420093681. [Google Scholar]
- Grotz, N.; Guerinot, M. Lou Molecular Aspects of Cu, Fe and Zn Homeostasis in Plants. Biochim. Biophys. Acta BBA-Mol. Cell Res. 2006, 1763, 595–608. [Google Scholar] [CrossRef] [Green Version]
- Chang, H.-B.; Lin, C.-W.; Huang, H.-J. Zinc-Induced Cell Death in Rice (Oryza Sativa L.) Roots. Plant Growth Regul. 2005, 46, 261–266. [Google Scholar] [CrossRef]
- Cakmak, I.; Kutman, U.B. Agronomic Biofortification of Cereals with Zinc: A Review. Eur. J. Soil Sci. 2018, 69, 172–180. [Google Scholar] [CrossRef] [Green Version]
- Marschner, H. Marschner’s Mineral Nutrition of Higher Plants, 3rd ed.; Marschner, P., Ed.; Academic Press: Cambridge, MA, USA, 2011. [Google Scholar]
- Pandey, N. Role of Micronutrients in Reproductive Physiology of Plants. Plant Stress 2010, 4, 1–13. [Google Scholar]
- Nautiyal, N.; Yadav, S.; Singh, D. Improvement in Reproductive Development, Seed Yield, and Quality in Wheat by Zinc Application to a Soil Deficient in Zinc. Commun. Soil Sci. Plant Anal. 2011, 42, 2039–2045. [Google Scholar] [CrossRef]
- Graham, A.W.; McDonald, G.K. Effect of Zinc on Photosynthesis and Yield of Wheat under Heat Stress. In Proceedings of the 10th Australian Agronomy Conference, Hobart, Tasmania, 29 January–1 February 2001; Volume 2. [Google Scholar]
- Memon, M.; Jamro, G.M.; Memon, N.U.N.; Memon, K.S.; Akhtar, M.S. Micronutrient Availability Assessment of Tomato Grown in Taluka Badin, Sindh. Pak. J. Bot. 2012, 44, 649–654. [Google Scholar] [CrossRef]
- Maqsood, M.A.; Hussain, S.; Aziz, T.; Ahmad, M.; Naeem, M.A.; Ahmad, H.R.; Kanwal, S.; Hussain, M. Zinc Indexing in Wheat Grains and Associated Soils of Southern Punjab. Pak. J. Agric. Sci. 2015, 52, 431–438. [Google Scholar]
- Shahbaz, M.; Akhtar, M.J.; Ahmed, W.; Wakeel, A. Integrated Effect of Different N-Fertilizer Rates and Bioslurry Application on Growth and N-Use Efficiency of Okra (Hibiscus Esculentus L.). Turk. J. Agric. For. 2014, 38, 311–319. [Google Scholar] [CrossRef]
- Hashmi, S.; Younis, U.; Danish, S.; Munir, T.M. Pongamia Pinnata L. Leaves Biochar Increased Growth and Pigments Syntheses in Pisum Sativum L. Exposed to Nutritional Stress. Agriculture 2019, 9, 153. [Google Scholar] [CrossRef] [Green Version]
- Zafar-ul-Hye, M.; Tahzeeb-ul-Hassan, M.; Wahid, A.; Danish, S.; Khan, M.J.; Fahad, S.; Brtnicky, M.; Hussain, G.S.; Battaglia, M.L.; Datta, R. Compost Mixed Fruits and Vegetable Waste Biochar with ACC Deaminase Rhizobacteria Can Minimize Lead Stress in Mint Plants. Sci. Rep. 2021, 11, 6606. [Google Scholar] [CrossRef]
- Siedt, M.; Schäffer, A.; Smith, K.E.C.; Nabel, M.; Roß-Nickoll, M.; van Dongen, J.T. Comparing Straw, Compost, and Biochar Regarding Their Suitability as Agricultural Soil Amendments to Affect Soil Structure, Nutrient Leaching, Microbial Communities, and the Fate of Pesticides. Sci. Total Environ. 2021, 751, 141607. [Google Scholar] [CrossRef]
- Ayilara, M.S.; Olanrewaju, O.S.; Babalola, O.O.; Odeyemi, O. Waste Management through Composting: Challenges and Potentials. Sustainability 2020, 12, 4456. [Google Scholar] [CrossRef]
- Zheljazkov, V.D.; Warman, P.R. Source-Separated Municipal Solid Waste Compost Application to Swiss Chard and Basil. J. Environ. Qual. 2004, 33, 542–552. [Google Scholar] [CrossRef]
- Hussain, N.; Hassan, G.; Arshadullah, M.; Mujeeb, F. Evaluation of Amendments for the Improvement of Physical Properties of Sodic Soil. Int. J. Agric. Biol. 2001, 3, 319–322. [Google Scholar]
- Hijbeek, R.; van Ittersum, M.K.; ten Berge, H.F.M.; Gort, G.; Spiegel, H.; Whitmore, A.P. Do Organic Inputs Matter—A Meta-Analysis of Additional Yield Effects for Arable Crops in Europe. Plant Soil 2017, 411, 293–303. [Google Scholar] [CrossRef] [Green Version]
- Lazcano, C.; Gómez-Brandón, M.; Revilla, P.; Domínguez, J. Short-Term Effects of Organic and Inorganic Fertilizers on Soil Microbial Community Structure and Function. Biol. Fertil. Soils 2013, 49, 723–733. [Google Scholar] [CrossRef]
- Blanco-Canqui, H.; Ruis, S.J. No-Tillage and Soil Physical Environment. Geoderma 2018, 326, 164–200. [Google Scholar] [CrossRef]
- Amlinger, F.; Peyr, S.; Geszti, J.; Dreher, P.; Weinfurtner, K.; Nortcliff, S. Evaluierung Der Nachhaltig Positiven Wirkung von Kompost Auf Die Fruchtbarkeit Und Produktivität von Böden. Bundesministerium Für Land-Und Forstwirtschaft. Umw. Wasserwirtsch. 2006, 1–233. [Google Scholar] [CrossRef]
- Aiqing, Z.; Zhang, L.; Ning, P.; Chen, Q.; Wang, B.; Zhang, F.; Yang, X.; Zhang, Y. Zinc in Cereal Grains: Concentration, Distribution, Speciation, Bioavailability, and Barriers to Transport from Roots to Grains in Wheat. Crit. Rev. Food Sci. Nutr. 2021, 1–12. [Google Scholar] [CrossRef] [PubMed]
- Sarfraz, M.; Mehdi, S.M.; Abid, M.; Akram, M. External and Internal Phosphorus Requirement of Wheat in Bhalike Soil Series of Pakistan. Pak. J. Bot 2008, 40, 2031–2040. [Google Scholar]
- Zafar-Ul-Hye, M.; Danish, S.; Abbas, M.; Ahmad, M.; Munir, T.M. ACC Deaminase Producing PGPR Bacillus Amyloliquefaciens and Agrobacterium Fabrum along with Biochar Improve Wheat Productivity under Drought Stress. Agronomy 2019, 9, 343. [Google Scholar] [CrossRef] [Green Version]
- Petersen, R.G.; Calvin, L.D. Sampling. In Methods of Soil Analysis: Part 1 Physical and Mineralogical Methods, 5.1; Klute, A., Ed.; John Wiley & Sons, Inc.: Hoboken, NJ, USA; American Society of Agronomy, Inc.: Madison, WI, USA; Soil Science Society of America, Inc.: Madison, WI, USA, 1986; pp. 33–51. ISBN 9780891188643. [Google Scholar]
- Gee, G.W.; Bauder, J.W. Particle-Size Analysis. In Methods of Soil Analysis: Part 1—Physical and Mineralogical Methods; Klute, A., Ed.; Soil Science Society of America: Madison, WI, USA, 1986; pp. 383–411. [Google Scholar]
- Bremner, M. Nitrogen-Total. In Methods of Soil Analysis Part 3. Chemical Methods-SSSA Book Series 5; Sumner, D.L., Page, A.L., Helmke, P.A., Loeppert, R.H., Soltanpour, P.N., Tabatabai, M.A., Johnston, C.T., Sumner, M.E., Eds.; John Wiley & Sons, Inc.: Madison, WI, USA, 1996; pp. 1085–1121. [Google Scholar]
- Miller, O. Nitric-Perchloric Acid Wet Digestion in an Open Vessel. In Reference Methods for Plant Analysis; Kalra, Y., Ed.; CRC Press: Washington, DC, USA, 1998; pp. 57–62. [Google Scholar]
- Estefan, G.; Sommer, R.; Ryan, J. Methods of Soil, Plant, and Water Analysis: A Manual for the West Asia and North Africa Region, 3rd ed.; Estefan, G., Sommer, R., Ryan, J., Eds.; International Center for Agricultural Research in Dry Areas: Beirut, Lebanon, 2013. [Google Scholar]
- Pratt, P.F. Potassium. In Methods of Soil Analysis: Part 2 Chemical and Microbiological Properties, 9.2; Norman, A.G., Ed.; John Wiley & Sons, Ltd.: Hoboken, NJ, USA, 1965; pp. 1022–1030. [Google Scholar]
- Nelson, D.W.; Sommers, L.E. Total Carbon, Organic Carbon, and Organic Matter. In Methods of Soil Analysis: Part 2 Chemical and Microbiological Properties; Page, A.L., Ed.; American Society of Agronomy; Crop Science Society of America; Soil Science Society of America: Madison, WI, USA, 1982; pp. 539–579. [Google Scholar]
- McLean, E.O. Soil PH and Lime Requirement. In Methods of Soil Analysis: Part 2 Chemical and Microbiological Properties; Page, A.L., Ed.; American Society of Agronomy: Madison, WI, USA; Crop Science Society of America; Soil Science Society of America: Madison, WI, USA, 1982; Volume 9, pp. 199–224. [Google Scholar]
- Chapman, H.D. Cation-Exchange Capacity. In Methods of Soil Analysis: Part 2 Chemical and Microbiological Properties, 9.2; Norman, A.G., Ed.; John Wiley & Sons, Ltd.: Hoboken, NJ, USA, 1965; pp. 891–901. [Google Scholar]
- Rhoades, J.D. Salinity: Electrical Conductivity and Total Dissolved Solids. In Methods of Soil Analysis, Part 3, Chemical Methods; Sparks, D.L., Page, A.L., Helmke, P.A., Loeppert, R.H., Soltanpour, P.N., Tabatabai, M.A., Johnston, C.T., Sumner, M.E., Eds.; Soil Science Society of America: Madison, WI, USA, 1996; Volume 5, pp. 417–435. [Google Scholar]
- Sparks, D.L.; Page, A.L.; Helmke, P.A.; Loeppert, R.H.; Nelson, D.W.; Sommers, L.E. Total Carbon, Organic Carbon, and Organic Matter. In Methods of Soil Analysis Part 3—Chemical Methods; Soil Science Society of America; American Society of Agronomy: Madison, WI, USA, 1996; pp. 961–1010. [Google Scholar]
- Kuo, S. Phosphorus. In Methods of Soil Analysis Part 3: Chemical Methods; Sparks, D.L., Page, A.L., Helmke, P.A., Loeppert, R.H., Soltanpour, P.N., Tabatabai, M.A., Johnston, C.T., Sumner, M.E., Eds.; John Wiley & Sons, Ltd.: Madison, WI, USA, 1996; pp. 869–919. [Google Scholar]
- Hanlon, E.A. Elemental Determination by Atomic Absorption Spectrophotometery. In Handbook of Reference Methods for Plant Analysis; Kalra, Y., Ed.; CRC Press: Washington, DC, USA, 1998; pp. 157–164. [Google Scholar]
- Walkley, A.; Black, I.A. An Examination of the Degtjareff Method for Determining Soil Organic Matter, and a Proposed Modification of the Chromic Acid Titration Method. Soil Sci. 1934, 37, 29–38. [Google Scholar] [CrossRef]
- Steel, R.G.D.; Torrie, J.H. Principles and Procedures of Statistics A Biometrical Approach, 3rd ed.; McGraw Hill Book Company Inc.: New York, NY, USA, 1996; pp. 334–381. [Google Scholar] [CrossRef]
- OriginLab Corporation. OriginPro; OriginLab: Northampton, MA, USA, 2021. [Google Scholar]
- Ramos, F.T.; de Carvalho Dores, E.F.; dos Santos Weber, O.L.; Beber, D.C.; Campelo, J.H., Jr.; de Souza Maia, J.C. Soil Organic Matter Doubles the Cation Exchange Capacity of Tropical Soil under No-till Farming in Brazil. J. Sci. Food Agric. 2018, 98, 3595–3602. [Google Scholar] [CrossRef]
- Adeleke, R.; Nwangburuka, C.; Oboirien, B. Origins, Roles and Fate of Organic Acids in Soils: A Review. S. Afr. J. Bot. 2017, 108, 393–406. [Google Scholar] [CrossRef]
- Macias-Benitez, S.; Garcia-Martinez, A.M.; Caballero Jimenez, P.; Gonzalez, J.M.; Tejada Moral, M.; Parrado Rubio, J. Rhizospheric Organic Acids as Biostimulants: Monitoring Feedbacks on Soil Microorganisms and Biochemical Properties. Front. Plant Sci. 2020, 11, 633. [Google Scholar] [CrossRef]
- Luo, T.; Zhu, Y.; Lu, W.; Chen, L.; Min, T.; Li, J.; Wei, C. Acidic Compost Tea Enhances Phosphorus Availability and Cotton Yield in Calcareous Soils by Decreasing Soil PH. Acta Agric. Scand. Sect. B—Soil Plant Sci. 2021, 71, 657–666. [Google Scholar] [CrossRef]
- El-Sobky, E.-S.E.A. Response of Wheat to Micronutrients Foliar Application, Compost, and N Fertilizer Level. Commun. Soil Sci. Plant Anal. 2021, 52, 1510–1526. [Google Scholar] [CrossRef]
- Mu, X.; Chen, Y. The Physiological Response of Photosynthesis to Nitrogen Deficiency. Plant Physiol. Biochem. 2021, 158, 76–82. [Google Scholar] [CrossRef] [PubMed]
- Cooney, L.J.; Beechey-Gradwell, Z.; Winichayakul, S.; Richardson, K.A.; Crowther, T.; Anderson, P.; Scott, R.W.; Bryan, G.; Roberts, N.J. Changes in Leaf-Level Nitrogen Partitioning and Mesophyll Conductance Deliver Increased Photosynthesis for Lolium Perenne Leaves Engineered to Accumulate Lipid Carbon Sinks. Front. Plant Sci. 2021, 12, 330. [Google Scholar] [CrossRef] [PubMed]
- Yang, J.; Zhang, J.; Wang, Z.; Xu, G.; Zhu, Q. Activities of Key Enzymes in Sucrose-to-Starch Conversion in Wheat Grains Subjected to Water Deficit during Grain Filling. Plant Physiol. 2004, 135, 1621–1629. [Google Scholar] [CrossRef] [Green Version]
- Deng, Y.; Teng, W.; Tong, Y.-P.; Chen, X.-P.; Zou, C.-Q. Phosphorus Efficiency Mechanisms of Two Wheat Cultivars as Affected by a Range of Phosphorus Levels in the Field. Front. Plant Sci. 2018, 9, 1614. [Google Scholar] [CrossRef]
- Chen, X.; Liu, P.; Zhao, B.; Zhang, J.; Ren, B.; Li, Z.; Wang, Z. Root Physiological Adaptations That Enhance the Grain Yield and Nutrient Use Efficiency of Maize (Zea Mays L.) and Their Dependency on Phosphorus Placement Depth. Field Crop. Res. 2022, 276, 108378. [Google Scholar] [CrossRef]
- Huang, X.; Muneer, M.A.; Li, J.; Hou, W.; Ma, C.; Jiao, J.; Cai, Y.; Chen, X.; Wu, L.; Zheng, C. Integrated Nutrient Management Significantly Improves Pomelo (Citrus Grandis) Root Growth and Nutrients Uptake under Acidic Soil of Southern China. Agronomy 2021, 11, 1231. [Google Scholar] [CrossRef]
- Castiglione, S.; Oliva, G.; Vigliotta, G.; Novello, G.; Gamalero, E.; Lingua, G.; Cicatelli, A.; Guarino, F. Effects of Compost Amendment on Glycophyte and Halophyte Crops Grown on Saline Soils: Isolation and Characterization of Rhizobacteria with Plant Growth Promoting Features and High Salt Resistance. Appl. Sci. 2021, 11, 2125. [Google Scholar] [CrossRef]
- Zhang, H.; Wang, R.; Chen, S.; Qi, G.; He, Z.; Zhao, X. Microbial Taxa and Functional Genes Shift in Degraded Soil with Bacterial Wilt. Sci. Rep. 2017, 7, 39911. [Google Scholar] [CrossRef]
- Zafar-ul-Hye, M.; Zahra, M.B.; Danish, S.; Abbas, M.; Rehim, A.; Akbar, M.N.; Iftikhar, A.; Gul, M.; Nazir, I.; Abid, M.; et al. Multi-Strain Inoculation with PGPR Producing ACC deaminase Is More Effective than Single-Strain Inoculation to Improve Wheat (Triticum aestivum) Growth and Yield. Phyton 2020, 89, 405–413. [Google Scholar] [CrossRef]
- Danish, S.; Zafar-ul-Hye, M. Combined Role of ACC Deaminase Producing Bacteria and Biochar on Cereals Productivity under Drought. Phyton 2020, 89, 217–227. [Google Scholar] [CrossRef]
- Danish, S.; Zafar-ul-Hye, M.; Mohsin, F.; Hussain, M. ACC-Deaminase Producing Plant Growth Promoting Rhizobacteria and Biochar Mitigate Adverse Effects of Drought Stress on Maize Growth. PLoS ONE 2020, 15, e0230615. [Google Scholar] [CrossRef] [PubMed] [Green Version]
- Ahmed, N.; Ahsen, S.; Ali, M.A.; Hussain, M.B.; Hussain, S.B.; Rasheed, M.K.; Butt, B.; Irshad, I.; Danish, S. Rhizobacteria and Silicon Synergy Modulates the Growth, Nutrition and Yield of Mungbean under Saline Soil. Pak. J. Bot. 2020, 52, 9–15. [Google Scholar] [CrossRef]
- Zafar-ul-Hye, M.; Shahjahan, A.; Danish, S.; Abid, M.; Qayyum, M.F. Mitigation of Cadmium Toxicity Induced Stress in Wheat by ACC-Deaminase Containing PGPR Isolated from Cadmium Polluted Wheat Rhizosphere. Pak. J. Bot. 2018, 50, 1727–1734. [Google Scholar]
- Singh, A.; Singh, N.Á.; Afzal, S.; Singh, T.; Hussain, I. Zinc Oxide Nanoparticles: A Review of Their Biological Synthesis, Antimicrobial Activity, Uptake, Translocation and Biotransformation in Plants. J. Mater. Sci. 2018, 53, 185–201. [Google Scholar] [CrossRef]
- Cakmak, I. Zinc Deficiency in Wheat in Turkey. In Micronutrient Deficiencies in Global Crop Production; Alloway, B.J., Ed.; Springer: Dordrecht, The Netherlands, 2008; pp. 181–200. ISBN 9781402068607. [Google Scholar]
- Alloway, B.J. Zinc in Soils and Crop Nutrition, 2nd ed.; International Zinc Association Brussels: Belgium, Brussel, 2008. [Google Scholar]
- Yang, X.; Tian, X.; Lu, X.; GaleWilliam, J.; Cao, Y. Foliar Zinc Fertilization Improves the Zinc Nutritional Value of Wheat (Triticum Aestivum L.) Grain. Afr. J. Biotechnol. 2011, 10, 14778–14785. [Google Scholar]
- Faran, M.; Farooq, M.; Rehman, A.; Nawaz, A.; Saleem, M.K.; Ali, N.; Siddique, K.H.M. High Intrinsic Seed Zn Concentration Improves Abiotic Stress Tolerance in Wheat. Plant Soil 2019, 437, 195–213. [Google Scholar] [CrossRef]


| Treatment | T | Abbreviation |
|---|---|---|
| Control (no compost + no zinc) | T1 | 0C + 0Zn |
| 5 t/ha compost | T2 | 5C |
| 10 t/ha compost | T3 | 10C |
| 2.5 kg/ha zinc | T4 | 2.5Zn |
| 2.5 kg/ha zinc + 5 t/ha compost | T5 | 2.5Zn + 5C |
| 2.5 kg/ha zinc + 10 t/ha compost | T6 | 2.5Zn + 10C |
| 5.0 kg/ha zinc | T7 | 5.0Zn |
| 5.0 kg/ha zinc + 5 t/ha compost | T8 | 5.0Zn + 5C |
| 5.0 kg/ha zinc + 10 t/ha compost | T9 | 5.0Zn + 10C |
| 10.0 kg/ha zinc | T10 | 10.0Zn |
| 10.0 kg/ha zinc + 5 t/ha compost | T11 | 10.0Zn + 5C |
| 10.0 kg/ha zinc + 10 t/ha compost | T12 | 10.0Zn + 10C |
| Pre-Experimental Soil | Compost | ||||||
|---|---|---|---|---|---|---|---|
| Properties | Unit | Values | References | Properties | Unit | Values | References |
| Sand | % | 24.5 | [31] | N | % | 2 | [32] |
| Silt | % | 10.5 | P | ppm | 0.8 | [33,34] | |
| Clay | % | 65 | K | ppm | 2 | [33,35] | |
| Soil texture | - | Silt loam | OM | % | 25 | [36] | |
| pH | - | 7.66 | [37] | CEC | 60 | cmolc/kg | [38] |
| EC | dS m−1 | 0.0375 | [39] | C:N | 20:1 | - | [32,40] |
| Organic matter | % | 0.1957 | [36] | ||||
| Total nitrogen | mg kg−1 | 1949.09 | [32] | ||||
| Mineral nitrogen | mg kg−1 | 18.17 | [32] | ||||
| Phosphorus | mg kg−1 | 4.05 | [41] [42] | ||||
| Zinc | mg kg−1 | 0.25 | |||||
Publisher’s Note: MDPI stays neutral with regard to jurisdictional claims in published maps and institutional affiliations. |
© 2022 by the authors. Licensee MDPI, Basel, Switzerland. This article is an open access article distributed under the terms and conditions of the Creative Commons Attribution (CC BY) license (https://creativecommons.org/licenses/by/4.0/).
Share and Cite
Dawar, K.; Ali, W.; Bibi, H.; Mian, I.A.; Ahmad, M.A.; Hussain, M.B.; Ali, M.; Ali, S.; Fahad, S.; Rehman, S.u.; et al. Effect of Different Levels of Zinc and Compost on Yield and Yield Components of Wheat. Agronomy 2022, 12, 1562. https://doi.org/10.3390/agronomy12071562
Dawar K, Ali W, Bibi H, Mian IA, Ahmad MA, Hussain MB, Ali M, Ali S, Fahad S, Rehman Su, et al. Effect of Different Levels of Zinc and Compost on Yield and Yield Components of Wheat. Agronomy. 2022; 12(7):1562. https://doi.org/10.3390/agronomy12071562
Chicago/Turabian StyleDawar, Khadim, Wajid Ali, Hamida Bibi, Ishaq Ahmad Mian, Mian Afaq Ahmad, Muhammad Baqir Hussain, Muqarrab Ali, Shamsher Ali, Shah Fahad, Saeed ur Rehman, and et al. 2022. "Effect of Different Levels of Zinc and Compost on Yield and Yield Components of Wheat" Agronomy 12, no. 7: 1562. https://doi.org/10.3390/agronomy12071562
APA StyleDawar, K., Ali, W., Bibi, H., Mian, I. A., Ahmad, M. A., Hussain, M. B., Ali, M., Ali, S., Fahad, S., Rehman, S. u., Datta, R., Syed, A., & Danish, S. (2022). Effect of Different Levels of Zinc and Compost on Yield and Yield Components of Wheat. Agronomy, 12(7), 1562. https://doi.org/10.3390/agronomy12071562