Article

Analysis of Nitrogen Uptake in Winter Wheat Using Sensor and Satellite Data for Site-Specific Fertilization

by
Matthias Stettmer
1,*,
Franz-Xaver Maidl
2,
Jürgen Schwarzensteiner
3,
Kurt-Jürgen Hülsbergen
2 and
Heinz Bernhardt
1
1
Agricultural Systems Engineering, TUM School of Life Sciences, Technical University of Munich, Dürnast 10, 85354 Freising, Germany
2
Organic Agriculture and Agronomy, TUM School of Life Sciences, Technical University of Munich, Liesel-Beckmann-Straße 2, 85354 Freising, Germany
3
Farmtastic Consulting GmbH, Graf-von-Bray-Straße 14, 94342 Irlbach, Germany
*
Author to whom correspondence should be addressed.
Agronomy 2022, 12(6), 1455; https://doi.org/10.3390/agronomy12061455
Submission received: 11 May 2022 / Revised: 13 June 2022 / Accepted: 14 June 2022 / Published: 17 June 2022
(This article belongs to the Special Issue Nitrogen Cycle in Farming Systems)

Abstract

:
Sensor- and satellite-based determination of nitrogen uptake provides critical data in site-specific fertilization algorithms. Therefore, two basic noncontact measurement methods (sensor and satellite) were investigated in winter wheat, and their precision was evaluated in this study. Nitrogen uptake at four characteristic growth stages (BBCH 31, BBCH 39, BBCH 55, and BBCH 65) was determined using algorithms based on sensor and satellite data. As a reference, nitrogen uptake was determined using biomass samples in the laboratory (ground truth data). The precision of the tested methods was evaluated using statistical indicators (mean, median, minimum, maximum, and standard deviation) and correlation analyses between the nitrogen uptake of the ground truth data and that of the respective method. The results showed moderate to strong correlations with the nitrogen uptake of the ground truth data for both methods (R2 = 0.57–0.83). Both sensor and satellite data best represented nitrogen uptake in BBCH 39 and 55 (R2 = 0.63–0.83). In sum, there were only slight deviations in the absolute amount of nitrogen uptake (≤±15%). Clear deviations can be explained by external influences during measurement. Overall, the investigations showed that the nitrogen uptake could be appropriately determined as a data basis for site-specific fertilization systems using sensor and satellite data.

1. Introduction

Harmonizing successful crop production with environmental protection is a key requirement of modern fertilization systems. A particular focus is placed on nitrogen (N) fertilization. Nitrogen uptake by wheat in the field can vary noticeably. Spatial variability of nitrogen uptake depends on numerous overlapping influencing factors and their interactions (edaphic factors, climatic factors, and agricultural management practices) [1,2,3,4,5,6]. Particularly, soil properties, such as soil texture, available water capacity, humus content, nutrient content, and pH, vary on a very small scale, resulting in varying nitrogen uptakes [7,8,9,10]. This effect can be further intensified by prevalent uniform fertilization due to different nutrient removals in the high- and low-yield zones of a field [11,12,13,14]. This results in small-scale fluctuating nitrogen balances and stocks in soil, causing high nitrate leaching in low-yield zones with overfertilization [5,15]. Therefore, systems adapted to small-scale crop variations for fertilization will be required, which will consider the heterogeneity of fields and their different yield potentials to minimize nitrate losses.
Site-specific nitrogen fertilization is a promising approach to minimizing nitrate leaching [16,17,18,19,20]. The literature shows that this method can balance the nitrogen surplus and improve nitrogen efficiency [21,22,23,24]. In this context, various methods for site-specific nitrogen fertilization have been developed and tested. These approaches can be divided into three categories: “mapping”, “online”, and “mapping + online” [16,25,26]. Site conditions (e.g., soil texture or yield potential) are used with the mapping approach, whereas crop biomass and/or nitrogen uptake are determined by field measurements (sensor/satellite) and algorithms in the online approach. The mapping + online approach is a combination of both. Fertilizer systems based on the mapping + online approach, which uses sensor or satellite data, have been established [16,22,23,27]. These systems use different methods to determine the nitrogen uptake of the crops in the field on a small scale. Based on the determined nitrogen uptake, these fertilizer systems calculate the amount of nitrogen fertilizer to be applied using algorithms and other data, such as the yield potential, quality target, or weather data [28,29]. Studies on this show that the accuracy of determining nitrogen uptake can vary significantly depending on the method [30,31]. For example, the use of different vegetation indices in reflection–optical measurements results in clear differences in nitrogen uptake [32,33,34,35]. The literature shows that some vegetation indices are more or less suitable for determining biomass growth and nitrogen uptake, whereas the suitability of other vegetation indices varies based on the crop’s growth stage [36,37,38]. Studies on this show that the vegetation index red edge inflection point (REIP) can provide robust and accurate data on nitrogen uptake, particularly for winter wheat [4,39,40,41]. The precision of the determination is crucial since current nitrogen uptake is a significant parameter in fertilization algorithms. Deviations in the determination of nitrogen uptake lead to incorrect calculations, resulting in yield losses and environmental pollution [42,43]. Therefore, a precise evaluation of the most recent site-specific fertilization methods, particularly the determination of nitrogen uptake, with ground truth data is crucial for harmonizing successful crop production with environmental protection.
This study examines the accuracy of recording nitrogen uptake with two basic noncontact measurement methods of site-specific nitrogen fertilization in winter wheat. The aim was to evaluate their precision and suitability as important data for site-specific fertilization algorithms. Thus, plot trials were conducted in 2020 and 2021 at two different locations in southern Germany. The trials analyzed the accuracy of the individual methods in mapping the nitrogen uptake of winter wheat at different growth stages (BBCH 31, BBCH 39, BBCH 55, and BBCH 65) in a sub-area, as this is decisive for the precision of the fertilizer applications generated with fertilizer algorithms. Therefore, the following were investigated: (a) how accurately the relative differences in the field were identified by the methods and (b) how accurately the methods estimated absolute nitrogen uptake. In the trial plots, nitrogen uptake was determined using biomass samples (ground truth data) and digital, georeferenced methods (sensor and satellite). Correlation analyses evaluated the relationships among the nitrogen uptake data determined using different methods. Based on the results, the accuracy, precision, and suitability of the tested methods for recording the spatial variability of nitrogen uptake in winter wheat at different growth stages were evaluated.

2. Materials and Methods

2.1. Site and Weather Conditions

Two heterogeneous fields in which the experiments were conducted in 2020 and 2021 were selected. Both fields belong to the Makofen Research Farm (48°81′55″ N 12°74′31″ E), which is 15 km southeast of Straubing (320 m a.s.l.). The trial fields of the Makofen Research Farm are flat and characterized by extremely fertile loess soil. Table 1 shows the most important soil parameters in the trial fields.
Table 2 provides an overview of temperature and precipitation at Makofen Research Farm. The 20-year mean annual precipitation at the trial sites is 781 mm, and the mean annual temperature is 9.5 °C.

2.2. Crop Management

In 2020 and 2021, the RGT Meister winter wheat variety was grown on the trial fields. The previous crop grown in the fields was sugar beets. Sowing, plant protection, and fertilization were conducted uniformly on the trial fields. Fertilization was conducted according to the Fertilizer Ordinance based on the Nmin content at the beginning of the spring growing season (2020: 66 kg N ha−1; 2021: 62 kg N ha−1). Plant protection was conducted according to the infestation situation. Table 3 shows an overview of crop management.

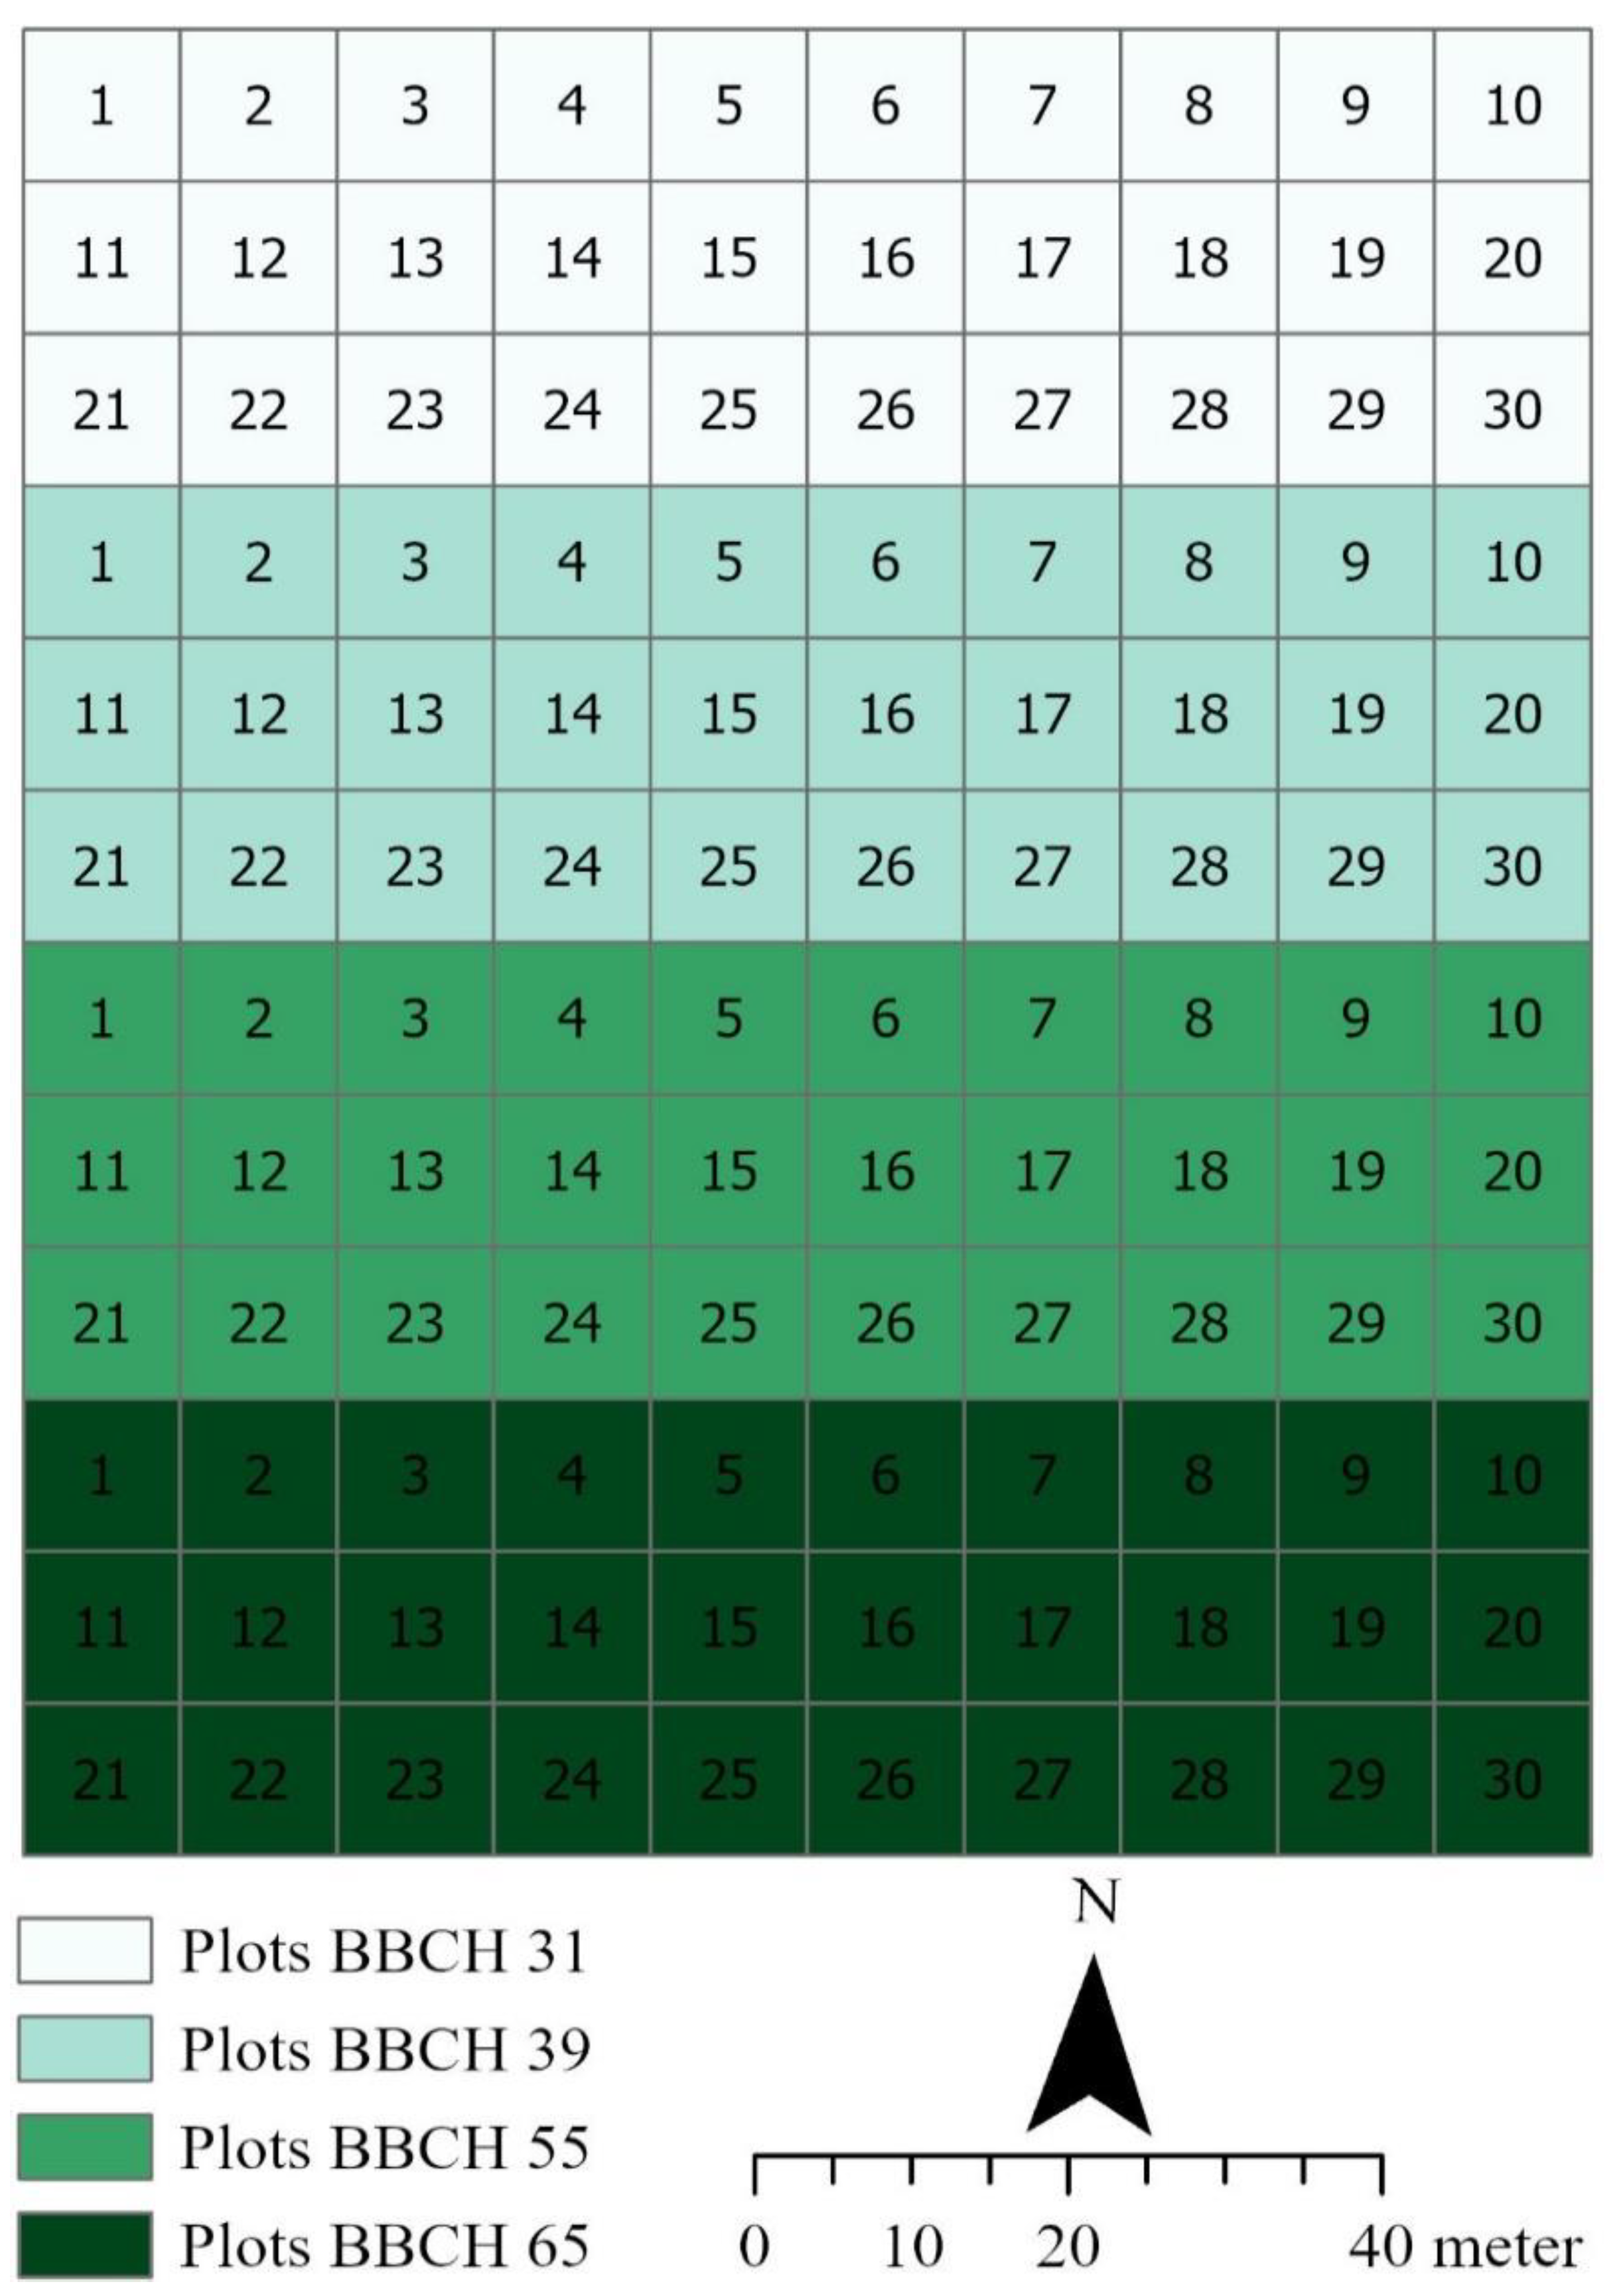
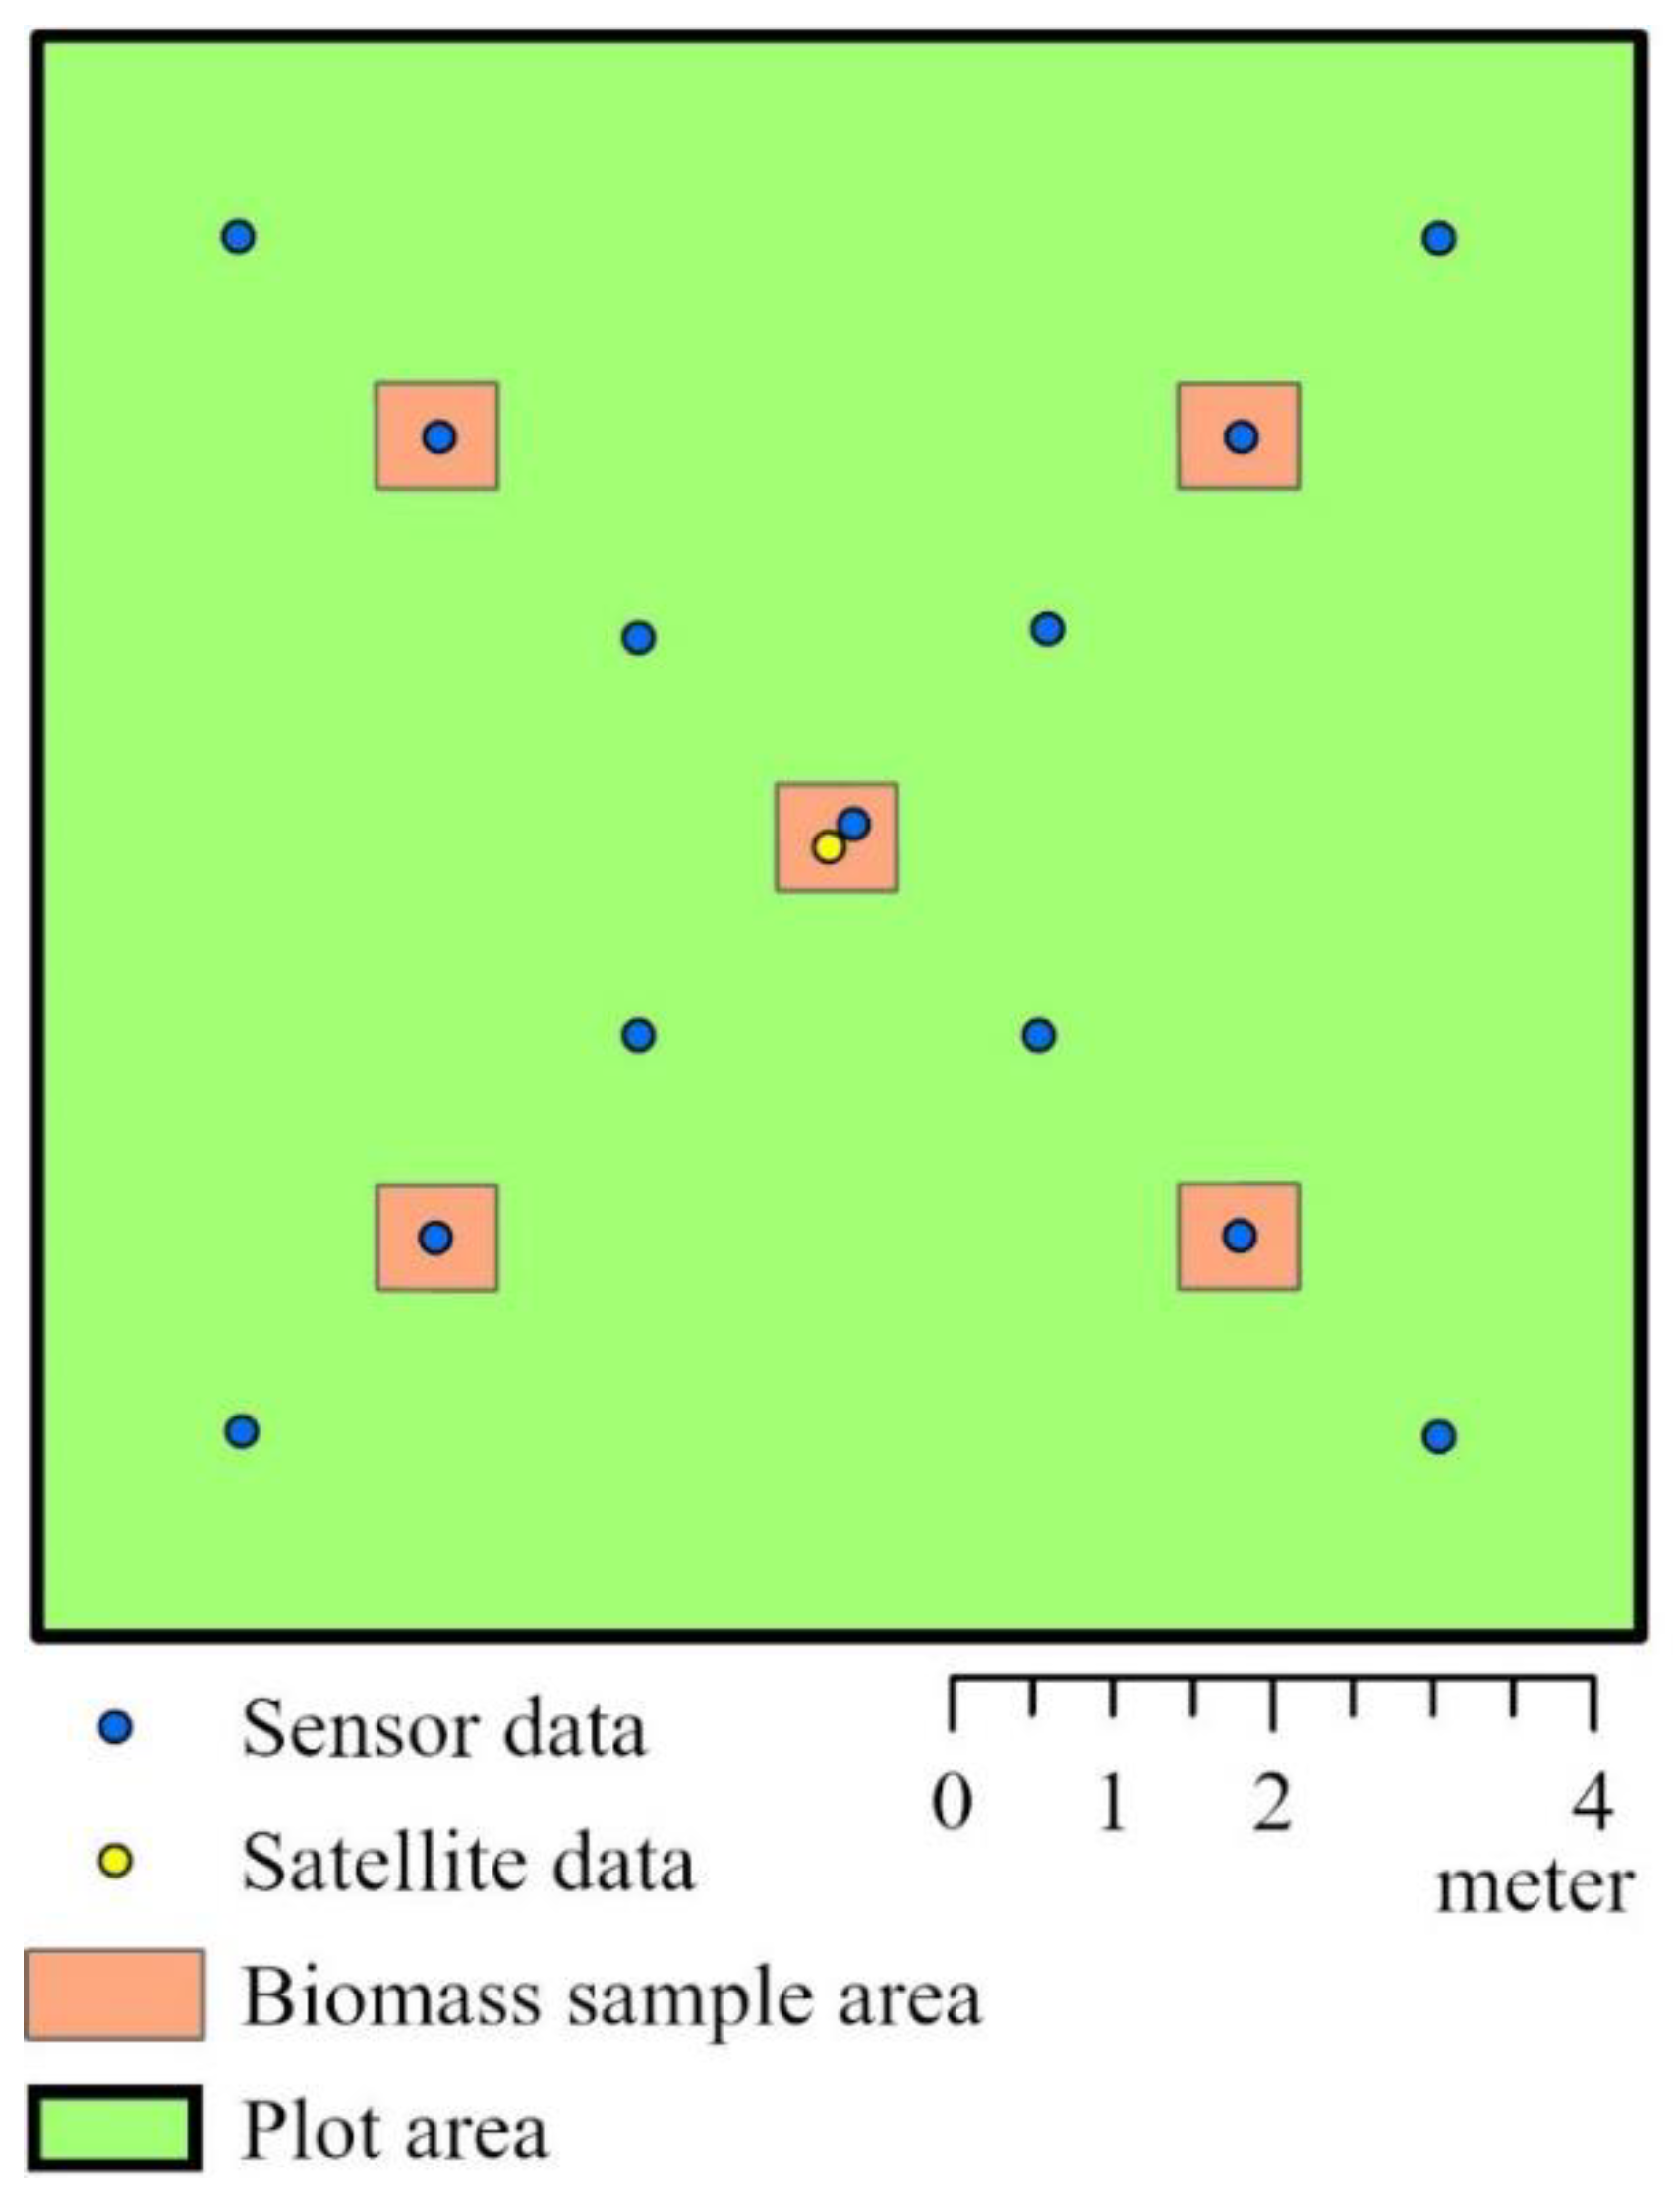
2.3. Experimental Design

The experimental setup was precisely adapted to the 10 m × 10 m grid of the satellite data. Both the plot size (10 m × 10 m) and the trial alignment in the field were based on the satellite data grid. This is critical for the high accuracy of the satellite data [5,44]. New plots were available for each growth stage, since the cutting of the biomass samples in the individual plots would influence the reflection measurements with the sensor and satellite at the subsequent growth stage. The experimental setup was the same in both experimental years, and only the number of plots differed (2020: n = 30; 2021: n = 45). Figure 1 shows the experimental setup in 2020.

2.4. Methods of Determining Nitrogen Uptake

Nitrogen uptake per plot was determined using the following methods:
  • Biomass samples (ground truth data) [45,46];
  • An algorithm based on reflection measurements using a multispectral sensor [28,47];
  • Radiative transfer model (soil–leaf-canopy) based on satellite data [29,48].
Nitrogen uptake was determined using the respective methods in the growth stages, BBCH 31, BBCH 39, BBCH 55, and BBCH 65. Thus, an area of 2.5 m2 of plants was manually cut off in each plot for the ground truth data. These samples were weighed, chopped, and dried at 105 °C. This resulted in the above-ground biomass yield. The Dumas method was used to analyze the nitrogen content of the samples, and the nitrogen uptake of the plot was determined [45,46]. The reflection measurements with the multispectral sensor were conducted in the respective growth stages in the individual plots. The REIP 700 vegetation index was calculated based on these measurements, and the algorithms used to estimate the nitrogen uptake were based on this index considering further data, such as yield potential and variety properties [28]. Depending on the availability, the radiative transfer model used up-to-date satellite data to estimate nitrogen uptake. Based on the satellite data, the radiative transfer model calculated the nitrogen uptake at the respective growth stages considering additional data, such as observational parameters, soil reflectance information, leaf optical properties, and canopy properties [29,48].

2.5. Data Processing

Considering the corresponding methodology, nitrogen uptake was determined using different methods. Point data were generated using digital contactless measuring systems. Next, these point data were visualized using geoinformation system software, ArcGIS [49], and assigned to the digitized plots via their coordinates. Data points on or outside the plot edges were removed. The recorded data points varied in spatial resolution and distribution based on the method. Figure 2 shows the detailed structure and data distribution of a plot. Subsequently, the mean was calculated using all available data points per plot and method. Thus, the nitrogen uptake per plot in kg N ha−1 was determined for each method.

2.6. Descriptive Statistics

The mean, median, minimum, maximum, and standard deviation were calculated for each method using R.

2.7. Correlation Analysis

Correlation analyses based on the nitrogen uptake per plot in kg N ha−1 determined the relationships between the data of the tested digital methods and the ground truth data. The coefficients of determination (R2) were classified as very strong (R2 > 0.9), strong (0.9 > R2 > 0.7), moderate (0.7 > R2 > 0.5), weak (0.5 > R2 > 0.3), or very weak (R2 < 0.3).

3. Results

3.1. Spatial Variation in Nitrogen Uptake in 2020 (Field A)

Different methods for the site-specific determination of nitrogen uptake at characteristic growth stages produced different results in the nitrogen distribution pattern, nitrogen variation, and mean nitrogen uptake in Field A (Figure 3, Table 4). The nitrogen uptake of the biomass samples (ground truth data) in BBCH 31 varied between 33.2 and 64.1 kg N ha−1. The nitrogen uptake estimated by the radiative transfer model based on satellite data in BBCH 31 (23.3–35.8 kg N ha−1) was also characterized by variability; however, the variation was not as great as in those obtained with the other methods, and a significantly lower nitrogen level was noticeable. The nitrogen uptake estimated using algorithms based on sensor data in BBCH 31 (24.6–66.2 kg N ha−1) was more similar to the measured values of the ground truth data. All the methods in BBCH 39 showed almost the same mean nitrogen uptake and a similar nitrogen distribution, but the variation was higher for both satellite and sensor data (Figure 3).
Both the satellite and sensor data in BBCH 55 and 65 showed similar nitrogen distributions, which was consistent with the ground truth data. However, the absolute level of nitrogen uptake was noticeably lower with the satellite data than with the ground truth data, whereas it was higher with the sensor data. A deviation of −20% in the mean nitrogen uptake with the satellite data and +10% with the sensor data was observed in BBCH 55 and 65.

3.2. Spatial Variation in Nitrogen Uptake in 2021 (Field B)

The nitrogen uptake data determined using different digital measuring systems and methods for the examined growth stages in Field B produced results similar to those in Field A (Figure 4, Table 4). Thus, the nitrogen uptake of the ground truth data in BBCH 31 (29.4–63.0 kg N ha−1) varied in a similar range as in 2020. The estimate of nitrogen uptake by the radiative transfer model based on satellite data in BBCH 31 (33.8–47.6 kg N ha−1) was also characterized by variability, but the variation was again lower and at a lower nitrogen level, whereas the estimate from the sensor data (23.5–62.1 kg N ha−1) was similar to the measured values of the ground truth data (Figure 4). All methods in BBCH 39 showed a similar nitrogen distribution; however, the variation was slightly lower with the satellite data and was slightly higher with the sensor data. The satellite and sensor data in BBCH 55 and 65 showed similar nitrogen distribution patterns, which were consistent with the ground truth data. However, it was also noticed that the absolute level of nitrogen uptake was lower with the satellite data than with the ground truth data, whereas it was slightly higher with the sensor data. In BBCH 55 and 65, there were slight deviations from the mean nitrogen uptake of −14% with the satellite data and +5% with the sensor data.

3.3. Correlation between Variables

Table 5 shows the coefficients of determination (R2) of the linear relationships of the nitrogen uptake data determined using various digital methods.

3.3.1. Field A (2020)

Overall, all tested methods achieved similar correlations and could at least moderately map the nitrogen uptake for all growth stages examined. In BBCH 31, the correlation analysis showed a strong relationship between the ground truth data and the estimate from the sensor data (R2 = 0.74). The nitrogen uptake in BBCH 31 determined by the radiative transfer model based on satellite data (R2 = 0.60) was moderately correlated with the ground truth data. In BBCH 39 and 55, both the estimates from the sensor data (R2 = 0.77–0.83) and those from the satellite data (R2 = 0.74–0.80) were strongly correlated with the ground truth data (Figure 5). The results from the sensor and satellite data in BBCH 65 were identical and showed a moderate correlation with the ground truth data (R2 = 0.67).

3.3.2. Field B (2021)

In 2021, the correlations were considerably similar to those of the previous year. All methods except the satellite data in BBCH 31 mapped nitrogen uptake at least moderately. There was a moderate correlation between the ground truth data and the sensor data (R2 = 0.66) in BBCH 31, but only a weak correlation with the satellite data (R2 = 0.48). In BBCH 39 and 55, the estimates from the sensor data (R2 = 0.72–0.76) were strongly correlated with the ground truth data, and with those from the satellite data (R2 = 0.57–0.63) moderately. The results of the sensor (R2 = 0.65) and satellite data (R2 = 0.59) in BBCH 65 were repeatedly similar and showed a moderate correlation with the ground truth data.

4. Discussion

4.1. Discussion of the Methods

This study investigated the recording of nitrogen uptake using two basic noncontact measurement methods of site-specific nitrogen fertilization in winter wheat at characteristic growth stages in heterogeneous fields at two locations in southern Germany. The precision of the methods was tested by comparing the statistical indicators (mean, median, minimum, maximum, and standard deviation) and examining correlative relationships. The aim of this was to identify the variability in nitrogen uptake and analyze its absolute amount.

4.1.1. Site Selection

The expression of the spatial variability of nitrogen uptake has a significant impact on the results of this method’s comparison [50,51]. Therefore, heterogeneous fields were selected for this study. The heterogeneity of the trial sites was assessed based on the soil parameters, biomass maps, and a farm manager’s expertise. Heijting et al. [52] showed that a farm manager’s expertise is a suitable basis for evaluating the heterogeneity of a field. Furthermore, other studies revealed that small-scale variations in the soil properties and crop stands are characteristic of the study region [5,53].

4.1.2. Ground Truth Data

The nitrogen uptake data were determined using two digital methods. Suitable ground truth data (biomass samples) are crucial in evaluating the different estimation methods for comparing the modeled data with the measured data [5]. Therefore, in this study, biomass samples were cut in all plots for each examined growth stage (BBCH 31, BBCH 39, BBCH 55, and BBCH 65), and the nitrogen uptake was determined in the laboratory [45,46]. The biomass samples enabled accurate determination of the nitrogen uptake per plot and the evaluation of the estimates obtained using digital methods. However, the measuring effort for biomass samples is extremely high and a limiting factor for large areas. For example, Mittermayer et al. [5] investigated the variability of nitrogen uptake in an area of 13.1 ha and used 50 biomass samples; the data analysis was conducted using geostatistical methods. Other studies analyzed even larger fields of more than 1000 ha and only compared the sensor and satellite data. Mezera et al. [51] and Gozdowski et al. [54] achieved similar results with both measurement methods and found moderate to strong correlations (R2 = 0.51–0.79). The results of this study confirmed this. For example, both methods correlated strongly (R2 = 0.76) in BBCH 39 in 2020; however, there was a higher variation in absolute nitrogen uptake with both digital methods than with the ground truth data. Because the absolute height of nitrogen uptake is also crucial for site-specific fertilization, the ground truth data of the biomass samples were of immense importance for the precise evaluation of the two digital methods in this study.

4.2. Discussion of the Results

4.2.1. Sensor Data

The nitrogen uptake estimate based on multispectral sensor data, the REIP vegetation index, and a crop-specific algorithm [28] provided reliable results in both test years. The method recognized the spatial nitrogen distribution in all tested growth stages as moderate to strong (R2 = 0.65–0.83). Apart from BBCH 31 in 2020 (−15%), there were only small deviations (≤±10%) in the nitrogen uptake’s mean absolute level. This deviation may have been due to drought stress. There was a pronounced early summer drought at the time of the measurements in BBCH 31. Drought stress, plant diseases, soil compaction, and lack of other nutrients can influence the reflection signature in reflection–optical measurements, resulting in incorrectly interpreted measured values [55,56,57]. Further, the correlation quality of the sensor data typically improved with the increasing growth stage toward a peak in BBCH 39 and then slightly decreased again. Nevertheless, no clear saturation occurred, as, for example, with systems based on simple vegetation indices, such as NDVI or SAVI, and good precision was shown even with high nitrogen uptake [36,38,58]. Similar results were also obtained by Prey and Schmidhalter [38,58], who investigated the sensitivity of different vegetation indices for estimating nitrogen uptake in winter wheat and consistently achieved moderate results with the REIP (R2 = 0.59). Westermeier and Maidl [36] made the same conclusions in their study and even found correlations of up to R2 = 0.9 for the REIP 700 index. Further investigations with reflection–optical sensor measurements presented moderate to very strong correlations with nitrogen uptake in winter wheat at the relevant growth stages (R2 = 0.57–0.89) [4,5,59,60]. Consequently, the sensor data are suitable for both early and late site-specific fertilization measures. In addition, the sensor measurements from BBCH 65 can be used to calculate yield estimates and yield potential maps [61,62]. These results confirm the significant potential of modern sensor technology for recording nitrogen uptake as a basis for site-specific fertilization. The prerequisites for the successful implementation of this method are multispectral sensors with high measurement accuracy, suitable vegetation indices, and science-based algorithms [5,36,38,58,60].

4.2.2. Satellite Data

The nitrogen uptake estimate with the radiative transfer model based on satellite data also achieved good results in both test years. The method identified the spatial nitrogen distribution in all tested growth stages, except in BBCH 31 in 2021 (R2 = 0.48), moderately to strongly (R2 = 0.57–0.80). This deviation can be explained by the dependence of this method on clear, cloud-free satellite images [63,64,65]. In BBCH 31, it was frequently cloudy in 2021, and the availability of cloud-free satellite images was extremely limited. Consequently, older satellite images had to be used to estimate nitrogen uptake, which can result in deviations. The mean absolute level of nitrogen uptake of the satellite data in the years 2020 (≤−20%) and 2021 (≤−15%) showed slightly larger deviations compared to those with the sensor data. An exception to this was BBCH 31 in 2020 (−40%), since there was a significant deviation, which can be explained by drought stress. Drought stress, plant diseases, soil compaction, and a lack of other nutrients can affect the reflection signature of multispectral satellite images in the same way as with the sensor data, resulting in incorrectly interpreted measured values [55,56]. Other literature also presented good results using satellite data. Chen [66] conducted correlation analyses between remote sensing data and the nitrogen concentration in winter wheat at different growth stages and achieved strong correlations (R2 = 0.86). Magney et al. [67] compared satellite data with biomass samples and successfully mapped the nitrogen uptake with high precision (R2 = 0.81). Further investigations into mapping the nitrogen uptake of winter wheat using satellite data also showed good results (R2 = 0.74) [68]. Consequently, with current data availability, satellite data are also suitable as a basis for early and late site-specific fertilization measures. Further, yield estimates and yield potential maps can also be generated using satellite images [29,69]. These results confirm that remote sensing methods can be used to record parameters such as nitrogen uptake with good precision and use them for site-specific fertilization measures.

5. Conclusions

Current nitrogen uptake is a crucial parameter in site-specific fertilization algorithms. The more precisely the nitrogen uptake is determined by noncontact measuring methods, the more precise the result of the site-specific fertilization. The results of these investigations show the suitability of both measurement methods. Nitrogen uptake can be determined appropriately using the tested methods for both BBCH 31 and 39, which are crucial growth stages for yield fertilization, and BBCH 55 and 65, which are relevant for quality fertilization or for deriving yield estimates. Significant deviations, such as those in BBCH 31 in 2020, can be explained by external influences. Further, data generated by sensor measurements close to plants are somewhat more precise, particularly when determining the absolute level of nitrogen uptake. In addition, the sensor technology is unaffected by cloud cover and is particularly superior at times when there are no cloud-free satellite images. On the other hand, the sensor technology is extremely expensive and requires a high level of user qualification. However, with the satellite data, the finished application map is sent to the machine and is, therefore, very easy to use. Furthermore, the satellite data depict the entire field and do not only measure partial areas. In summary, both measurement methods have advantages and disadvantages. However, both methods prove their potential and are suitable for determining the nitrogen uptake for site-specific fertilization systems in winter wheat. Referring to the great relevance of the topic and the environmental effects of inappropriate fertilization, noncontact measuring methods for determining plant parameters such as nitrogen uptake require urgent further investigation to improve the precision, particularly with the absolute level of nitrogen uptake. The focus should be on the higher spatial resolution of satellite data (e.g., 5 m × 5 m) and other wavelengths in reflection–optical measurements to improve and develop vegetation indices.

Author Contributions

Conceptualization, M.S. and F.-X.M.; methodology, M.S. and F.-X.M.; investigation, M.S.; data curation, M.S.; writing—original draft preparation, M.S.; writing—review and editing, F.-X.M., K.-J.H. and H.B.; project administration, J.S.; funding acquisition, J.S. All authors have read and agreed to the published version of the manuscript.

Funding

This research was funded by the European Commission and the State of Bavaria as part of EIP-Agri (EP4-904).

Data Availability Statement

The data presented in this study are available from the corresponding author on reasonable request.

Acknowledgments

We would like to thank VISTA Geowissenschaftliche Fernerkundung GmbH (Gabelsbergerstraße 51, 80333 Munich, Germany) for providing nitrogen uptake data using satellite data and a radiative transfer model.

Conflicts of Interest

The authors declare no conflict of interests.

References

  1. Kucke, M.; Kleeberg, P. Nitrogen balance and soil nitrogen dynamics in two areas with different soil, climatic and cropping conditions. Eur. J. Agron. 1997, 6, 89–100. [Google Scholar] [CrossRef]
  2. Wang, H.; Ju, X.; Wei, Y.; Li, B.; Zhao, L.; Hu, K. Simulation of bromide and nitrate leaching under heavy rainfall and high-intensity irrigation rates in North China plain. Agric. Water Manag. 2010, 97, 1646–1654. [Google Scholar] [CrossRef]
  3. Tarkalson, D.D.; Payero, J.O.; Ensley, S.M.; Shapiro, C.A. Nitrate accumulation and movement under deficit irrigation in soil receiving cattle manure and commercial fertilizer. Agric. Water Manag. 2006, 85, 201–210. [Google Scholar] [CrossRef] [Green Version]
  4. Cao, Q.; Miao, Y.; Shen, J.; Yuan, F.; Cheng, S.; Cui, Z. Evaluating two crop circle active canopy sensors for in-season diagnosis of winter wheat nitrogen status. Agronomy 2018, 8, 201. [Google Scholar] [CrossRef] [Green Version]
  5. Mittermayer, M.; Gilg, A.; Maidl, F.-X.; Nätscher, L.; Hülsbergen, K.-J. Site-specific nitrogen balances based on spatially variable soil and plant properties. Precis. Agric. 2021, 22, 1416–1436. [Google Scholar] [CrossRef]
  6. Strebel, O.; Duynisveld, W.H.M.; Böttcher, J. Nitrate pollution of groundwater in western Europe. Agric. Ecosyst. Environ. 1989, 26, 189–214. [Google Scholar] [CrossRef]
  7. Maidl, F.X.; Brunner, R.; Sticksel, E.; Fischbeck, G. Ursachen kleinräumiger Ertragsschwankungen im bayerischen Tertiärhügelland und Folgerungen für eine teilschlagbezogene Düngung [Reasons of small-scale yield variations in the Bavarian tertiary hill country and conclusions for site-specific fertilization]. J. Plant Nutr. Soil Sci. 1999, 162, 337–342. [Google Scholar] [CrossRef]
  8. Lopez-Lozano, R.; Casterad, M.A.; Herrero, J. Site-specific management units in a commercial maize plot delineated using very high-resolution remote sensing and soil properties mapping. Comput. Electron. Agric. 2010, 73, 219–229. [Google Scholar] [CrossRef] [Green Version]
  9. Farid, H.U.; Bakhsh, A.; Ahmad, N.; Ahmad, A.; Mahmood-Khan, Z. Delineating site-specific management zones for precision agriculture. J. Agric. Sci. 2016, 154, 273–286. [Google Scholar] [CrossRef]
  10. Servadio, P.; Bergonzoli, S.; Verotti, M. Delineation of management zones based on soil mechanical-chemical properties to apply variable rates of inputs throughout a field (VRA). Eng. Agric. Environ. Food 2017, 10, 20–30. [Google Scholar] [CrossRef]
  11. Frogbrook, Z.L.; Oliver, M.A. Identifying management zones in agricultural fields using spatially constrained classification of soil and ancillary data. Soil Use Manag. 2007, 23, 40–51. [Google Scholar] [CrossRef]
  12. Hülsbergen, K.J.; Maidl, F.X.; Forster, F.; Prücklmaier, J. Minderung von Nitratausträgen in Trinkwassereinzugsgebieten durch Optimiertes Stickstoffmanagement am Beispiel der Gemeinde Hohenthann (Niederbayern) mit Intensiver Landwirtschaftlicher Flächennutzung [Reduction of Nitrate Emissions in Drinking Water Catchment Areas through Optimized Nitrogen Management]; Forschungsbericht an das Bayerische Staatsministerium für Ernährung, Landwirtschaft und Forsten, Technische Universität München: Freising, Germany, 2017; Available online: https://www.lfu.bayern.de/wasser/gw_gefaehrdung_schutz/gwschutz_landwirtschaft/pro-jekte_hohenthann/doc/tum_bericht_hohenthann.pdf (accessed on 8 March 2022).
  13. Stamatiadis, S.; Schepers, J.S.; Evangelou, E.; Tsadilas, C.; Glampedakis, A.; Glampedakis, M.; Dercas, N.; Spyropoulos, N.; Dalezios, N.R.; Eskridge, K. Variable-rate nitrogen fertilization of winter wheat under high spatial resolution. Precis. Agric. 2018, 19, 570–587. [Google Scholar] [CrossRef]
  14. Wang, K.; Huggins, D.R.; Tao, H. Rapid mapping of winter wheat yield, protein, and nitrogen uptake using remote and proximal sensing. Int. J. Appl. Earth Obs. Geoinf. 2019, 82, 101921. [Google Scholar] [CrossRef]
  15. Dalgaard, T.; Bienkowski, J.F.; Bleeker, A.; Dragosits, U.; Drouet, J.L.; Durand, P.; Frumau, A.; Hutchings, N.J.; Kedziora, A.; Magliulo, V.; et al. Farm nitrogen balances in six European landscapes as an indicator for nitrogen losses and basis for improved management. Biogeosciences 2012, 9, 5303–5321. [Google Scholar] [CrossRef] [Green Version]
  16. Maidl, F.X.; Schächtl, J.; Huber, G. Strategies for site-specific nitrogen fertilization on winter wheat. In Proceedings of the 7th International Conference on Precision Agriculture and Other Precision Resources Management, Minneapolis, MN, USA, 25–28 July 2004; pp. 1938–1948. [Google Scholar]
  17. Diacono, M.; Rubino, P.; Montemurro, F. Precision nitrogen management of wheat. A review. Agron. Sustain. Dev. 2013, 33, 219–241. [Google Scholar] [CrossRef]
  18. Mulla, D.J. Twenty-five years of remote sensing in precision agriculture: Key advances and remaining knowledge gaps. Biosyst. Eng. 2013, 114, 358–371. [Google Scholar] [CrossRef]
  19. Liu, H.; Whiting, M.L.; Ustin, S.L.; Zarco-Tejada, P.J.; Huffman, T.; Zhang, X. Maximizing the relationship of yield to site-specific management zones with object-oriented segmentation of hyperspectral images. Precis. Agric. 2018, 19, 348–364. [Google Scholar] [CrossRef] [Green Version]
  20. Prücklmaier, J. Feldexperimentelle Analysen zur Ertragsbildung und Stickstoffeffizienz bei Organisch-Mineralischer Düngung auf Heterogenen Standorten und Möglichkeiten zur Effizienzsteigerung Durch Computer- und Sensorgestützte Düngesysteme [Field Experimental Analyses of Yield Effects and Nitrogen Efficiency of Fertilizer Application Systems]. Ph.D. Thesis, Technische Universität München, Munich, Germany, 2020. [Google Scholar]
  21. Peralta, N.R.; Costa, J.L.; Balzarini, M.; Franco, M.C.; Córdoba, M.; Bullock, D. Delineation of management zones to improve nitrogen management of wheat. Comput. Electron. Agric. 2015, 110, 103–113. [Google Scholar] [CrossRef]
  22. Spicker, A.B. Entwicklung von Verfahren der teilflächenspezifischen Stickstoffdüngung zu Wintergerste (Hordeum vulgare L.) und Winterraps (Brassica napus L.) auf Grundlage Reflexionsoptischer Messungen [Development of Sensor-Based Nitrogen Fertilization Systems for Oilseed Rape (Brassica napus L.) and winter barley (Hordeum vulgare L.)]. Ph.D. Thesis, Technische Universität München, Munich, Germany, 2016. [Google Scholar]
  23. Vinzent, B.; Fuß, R.; Maidl, F.X.; Hülsbergen, K.J. Efficacy of agronomic strategies for mitigation of after-harvest N2O emissions of winter oilseed rape. Eur. J. Agron. 2017, 89, 88–96. [Google Scholar] [CrossRef]
  24. Argento, F.; Anken, T.; Abt, F.; Vogelsanger, E.; Walter, A.; Liebisch, F. Site-specific nitrogen management in winter wheat supported by low-altitude remote sensing and soil data. Precis. Agric. 2021, 22, 364–386. [Google Scholar] [CrossRef]
  25. Gandorfer, M. Bewertung von Precision Farming Dargestellt am Beispiel der Teilflächenspezifischen Stickstoffdüngung [Evaluation of Precision Farming Illustrated Using Site-Specific Nitrogen Fertilization as an Example]. Ph.D. Thesis, Technische Universität München, Munich, Germany, 2006. [Google Scholar]
  26. Weckesser, F.; Leßke, F.; Luthardt, M.; Hülsbergen, K.-J. Conceptual design of a comprehensive farm nitrogen management system. Agronomy 2021, 11, 2501. [Google Scholar] [CrossRef]
  27. Schmidhalter, U. Sensorgestützte Ermittlung des Nährstoffbedarfs. VDLUFA-Schriftenreihe 2014, 70, 57–66. [Google Scholar]
  28. Maidl, F.X. Verfahren zur Bestimmung des Düngebedarfs, Insbesondere des Stickstoff-Düngerbedarfs und Vorrichtung zur Durchführung des Verfahrens; Patentnr. DE 102011050877; Technische Universität München: Munich, Germany, 2011. [Google Scholar]
  29. Hank, T.B.; Bach, H.; Mauser, W. Using a remote sensing-supported hydro-agroecological model for field-scale simulation of heterogeneous crop growth and yield: Application for wheat in central Europe. Remote Sens. 2015, 7, 3934–3965. [Google Scholar] [CrossRef] [Green Version]
  30. Auernhammer, H. Precision farming—The environmental challenge. Comput. Electron. Agric. 2001, 30, 31–43. [Google Scholar] [CrossRef]
  31. Ebertseder, T.; Gutser, R.; Hege, U.; Brandhuber, R.; Schmidhalter, U. Strategies for site-specific nitrogen fertilization with respect to long-term environmental demands. In Proceedings of the Fourth European Conference on Precision Agriculture, Berlin, Germany, 15–19 June 2003; pp. 193–198. [Google Scholar]
  32. Perry, E.M.; Davenport, J.R. Spectral and spatial differences in response of vegetation indices to nitrogen treatments on apple. Comput. Electron. Agric. 2007, 59, 56–65. [Google Scholar] [CrossRef]
  33. Maresma, Á.; Ariza, M.; Martínez, E.; Lloveras, J.; Martínez-Casasnovas, J.A. Analysis of vegetation indices to determine nitrogen application and yield prediction in maize (Zea mays L.) from a standard UAV service. Remote Sens. 2016, 8, 973. [Google Scholar] [CrossRef] [Green Version]
  34. Herrera, J.M.; Rubio, G.; Häner, L.L.; Delgado, J.A.; Lucho-Constantino, C.A.; Islas-Valdez, S.; Pellet, D. Emerging and established technologies to increase nitrogen use efficiency of cereals. Agronomy 2016, 6, 25. [Google Scholar] [CrossRef] [Green Version]
  35. Feng, W.; Zhang, H.Y.; Zhang, Y.S.; Qi, S.L.; Heng, Y.R.; Guo, B.B.; Ma, D.Y.; Guo, T.C. Remote detection of canopy leaf nitrogen concentration in winter wheat by using water resistance vegetation indices from in-situ hyperspectral data. Field Crops Res. 2016, 198, 238–246. [Google Scholar] [CrossRef]
  36. Westermeier, M.; Maidl, F.X. Vergleich von Spektralindizes zur Erfassung der Stickstoffaufnahme bei Winterweizen (Triticum aestivum L.). J. Kulturpfl. 2019, 71, 238–248. [Google Scholar]
  37. Li, F.; Miao, Y.; Hennig, S.D.; Gnyp, M.L.; Chen, X.; Jia, L.; Bareth, G. Evaluating hyperspectral vegetation indices for estimating nitrogen concentration of winter wheat at different growth stages. Precis. Agric. 2010, 11, 335–357. [Google Scholar] [CrossRef]
  38. Prey, L.; Schmidhalter, U. Sensitivity of vegetation indices for estimating vegetative n status in winter wheat. Sensors 2019, 19, 3712. [Google Scholar] [CrossRef] [PubMed] [Green Version]
  39. Erdle, K.; Mistele, B.; Schmidhalter, U. Comparison of active and passive spectral sensors in discriminating biomass parameters and nitrogen status in wheat cultivars. Field Crops Res. 2011, 124, 74–84. [Google Scholar] [CrossRef]
  40. Cammarano, D.; Fitzgerald, G.J.; Casa, R.; Basso, B. Assessing the robustness of vegetation indices to estimate wheat N in mediterranean environments. Remote Sens. 2014, 6, 2827–2844. [Google Scholar] [CrossRef] [Green Version]
  41. Li, F.; Miao, Y.; Feng, G.; Yuan, F.; Yue, S.; Gao, X.; Liu, Y.; Liu, B.; Ustin, S.L.; Chen, X. Improving estimation of summer maize nitrogen status with red edge-based spectral vegetation indices. Field Crops Res. 2014, 157, 111–123. [Google Scholar] [CrossRef]
  42. Cui, Z.; Zhang, F.; Chen, X.; Miao, Y.; Li, J.; Shi, L.; Xu, J.; Ye, Y.; Liu, C.; Yang, Z.; et al. On-farm evaluation of an in-season nitrogen management strategy based on soil Nmin test. Field Crops Res. 2008, 105, 48–55. [Google Scholar] [CrossRef]
  43. Li, X.; Hu, C.; Delgado, J.A.; Zhang, Y.; Ouyang, Z. Increased nitrogen use efficiencies as a key mitigation alternative to reduce nitrate leaching in north china plain. Agric. Water Manag. 2007, 89, 137–147. [Google Scholar] [CrossRef]
  44. Devaux, N.; Crestey, T.; Leroux, C.; Tisseyre, B. Potential of sentinel-2 satellite images to monitor vine fields grown at a territorial scale. OENO One 2019, 53, 52–59. [Google Scholar] [CrossRef]
  45. Ebeling, M.E. The dumas method for nitrogen in feeds. J. Assoc. Off. Anal. Chem. 1968, 51, 766–770. [Google Scholar] [CrossRef]
  46. Saint-Denis, T.; Goupy, J. Optimization of a nitrogen analyser based on the Dumas method. Anal. Chim. Acta 2004, 515, 191–198. [Google Scholar] [CrossRef]
  47. TEC5, Spektrometer Systeme, Version 2.13. Available online: https://tec5.com/de/ (accessed on 14 March 2022).
  48. Verhoef, W.; Bach, H. Coupled soil–leaf-canopy and atmosphere radiative transfer modeling to simulate hyperspectral multi-angular surface reflectance and TOA radiance data. Remote Sens. Environ. 2007, 109, 166–182. [Google Scholar] [CrossRef]
  49. ArcGIS. Map Creation and Analysis: Location Intelligence for Everyone. Available online: https://www.esri.com/de-de/arcgis/products/arcgis-online/overview (accessed on 15 March 2022).
  50. Patzold, S.; Mertens, F.M.; Bornemann, L.; Koleczek, B.; Franke, J.; Feilhauer, H.; Welp, G. Soil heterogeneity at the field scale: A challenge for precision crop protection. Precis. Agric. 2008, 9, 367–390. [Google Scholar] [CrossRef]
  51. Mezera, J.; Lukas, V.; Horniaček, I.; Smutný, V.; Elbl, J. Comparison of proximal and remote sensing for the diagnosis of crop status in site-specific crop management. Sensors 2022, 22, 19. [Google Scholar] [CrossRef]
  52. Heijting, S.; De Bruin, S.; Bregt, A.K. The arable farmer as the assessor of within-field soil variation. Precis. Agric. 2011, 12, 488–507. [Google Scholar] [CrossRef] [Green Version]
  53. Heil, K.; Schmidhalter, U. Improved evaluation of field experiments by accounting for inherent soil variability. Eur. J. Agron. 2017, 89, 1–15. [Google Scholar] [CrossRef]
  54. Gozdowski, D.; Stępień, M.; Panek, E.; Varghese, J.; Bodecka, E.; Rozbicki, J.; Samborski, S. Comparison of winter wheat NDVI data derived from landsat 8 and active optical sensor at field scale. Remote Sens. Appl. Soc. Environ. 2020, 20, 100409. [Google Scholar] [CrossRef]
  55. Wang, T.C.; Ma, B.L.; Xiong, Y.C.; Saleem, M.F.; Li, F.M. Optical sensing estimation of leaf nitrogen concentration in maize across a range of water-stress levels. Crop Pasture Sci. 2011, 62, 474–480. [Google Scholar] [CrossRef]
  56. Franke, J.; Menz, G. Multi-temporal wheat disease detection by multi-spectral remote sensing. Precis. Agric. 2007, 8, 161–172. [Google Scholar] [CrossRef]
  57. Sensoren für die Variable Stickstoffdüngung–Funktionsprinzipien und Marktübersicht. Available online: https://www.lwk-niedersachsen.de/lwk/news/33577_Sensoren_f%C3%BCr_die_variable_Stickstoffd%C3%BCngung_-_Funktionsprinzipien_und_Markt%C3%BCbersicht (accessed on 22 March 2022).
  58. Prey, L.; Schmidhalter, U. Simulation of satellite reflectance data using high-frequency ground based hyperspectral canopy measurements for in-season estimation of grain yield and grain nitrogen status in winter wheat. ISPRS J. Photogramm. Remote Sens. 2019, 149, 176–187. [Google Scholar] [CrossRef]
  59. Pavuluri, K.; Chim, B.K.; Griffey, C.A.; Reiter, M.S.; Balota, M.; Thomason, W.E. Canopy spectral reflectance can predict grain nitrogen use efficiency in soft red winter wheat. Precis. Agric. 2015, 16, 405–424. [Google Scholar] [CrossRef]
  60. Cao, Q.; Miao, Y.; Feng, G.; Gao, X.; Li, F.; Liu, B.; Yue, S.; Cheng, S.; Ustin, S.L.; Khosla, R. Active canopy sensing of winter wheat nitrogen status: An evaluation of two sensor systems. Comput. Electron. Agric. 2015, 112, 54–67. [Google Scholar] [CrossRef]
  61. Maidl, F.X.; Spicker, A.; Weng, J.; Hülsbergen, K.J. Ableitung des teilflächenspezifischen Kornertrags von Getreide aus Reflexionsdaten (Derivation of the site-specific grain yield from reflection data). In Proceedings of the 39th GIL-Jahrestagung, Wien, Austria, 18–19 February 2019; pp. 131–134. [Google Scholar]
  62. Hauser, J.; Maidl, F.X.; Wagner, P. Untersuchung der teilflächenspezifischen Ertragserfassung von Großmähdreschern in Winterweizen (Investigation of site-specific yield mapping of combine harvesters in winter wheat). In Proceedings of the 41st GIL-Jahrestagung, Potsdam, Germany, 8–9 March 2021; pp. 133–138. [Google Scholar]
  63. Georgi, C.; Spengler, D.; Itzerott, S.; Kleinschmit, B. Automatic delineation algorithm for site-specific management zones based on satellite remote sensing data. Precis. Agric. 2018, 19, 684–707. [Google Scholar] [CrossRef] [Green Version]
  64. Kumhalova, J.; Matějková, Š. Yield variability prediction by remote sensing sensors with different spatial resolution. Int. Agrophys. 2017, 31, 195–202. [Google Scholar] [CrossRef] [Green Version]
  65. Domínguez, J.A.; Kumhálová, J.; Novák, P. Winter oilseed rape and winter wheat growth prediction using remote sensing methods. Plant Soil Environ. 2015, 61, 410–416. [Google Scholar]
  66. Chen, P. A comparison of two approaches for estimating the wheat nitrogen nutrition index using remote sensing. Remote Sens. 2015, 7, 4527–4548. [Google Scholar] [CrossRef] [Green Version]
  67. Magney, T.S.; Eitel, J.U.H.; Vierling, L.A. Mapping wheat nitrogen uptake from RapidEye vegetation indices. Precis. Agric. 2017, 18, 429–451. [Google Scholar] [CrossRef]
  68. Jia, L.; Yu, Z.; Li, F.; Gnyp, M.; Koppe, W.; Bareth, G.; Miao, Y.; Chen, X.; Zhang, F. Nitrogen status estimation of winter wheat by using an Ikonos satellite image in the north china plain. In Proceedings of the International Conference on Computer and Computing Technologies in Agriculture, Beijing, China, 29–31 October 2011; pp. 174–184. [Google Scholar]
  69. Mauser, W.; Bach, H. PROMET–Large scale distributed hydrological modelling to study the impact of climate change on the water flows of mountain watersheds. J. Hydrol. 2009, 376, 362–377. [Google Scholar] [CrossRef]
Figure 1. Experimental setup (Field A, 2020).
Agronomy 12 01455 g001
Figure 2. Structure and data distribution in the plot.
Agronomy 12 01455 g002
Figure 3. Nitrogen uptake 2020, BBCH 39. Nitrogen uptake was determined from the biomass samples, sensor data, and satellite data.
Agronomy 12 01455 g003
Figure 4. Nitrogen uptake 2021, BBCH 31. Nitrogen uptake was determined from the biomass samples, sensor data, and satellite data.
Agronomy 12 01455 g004
Figure 5. The linear relationships between nitrogen uptake of ground truth data and sensor data (above) and satellite data (below) in BBCH 39 in Field A in 2020.
Agronomy 12 01455 g005
Table 1. Soil data—Makofen Research Farm.
PropertyUnitField AField B
Soil classification CambisolCambisol
Soil type Silty loamSilty loam
Soil fertility index * 75–8570–80
Sand (0–30 cm)%6.06.9
Silt (0–30 cm)%70.169.4
Clay (0–30 cm)%23.923.7
Available water capacity (in 10 cm)Vol.%24.023.2
Soil organic carbon content (0–30 cm)% DM1.21.4
Soil total nitrogen content (0–30 cm)% DM0.140.12
Plant available phosphorus content (0–30 cm)mg (100 g)−114.817.9
Plant available potassium content (0–30 cm)mg (100 g)−117.718.4
pH (0–30 cm) 6.56.9
* The soil fertility index is a quantitative assessment of soil fertility given in integers in a range of 0–100, with 100 representing the most fertile soil in Germany.
Table 2. Mean temperature and precipitation—Makofen Research Farm.
UnitJanuary to MarchApril to JuneJuly to SeptemberOctober to DecemberYear
2000–2020 Makofen
Temperature   x ¯ °C1.414.417.34.79.5
Precipitation ∑mm170209230172781
2020 Makofen
Temperature   x ¯ °C3.713.918.35.110.3
Precipitation ∑mm149189176141655
2021 Makofen
Temperature   x ¯ °C1.813.117.34.49.2
Precipitation ∑mm129268250165812
Table 3. Crop management of the trial fields.
FieldTreatmentUnitAmountProductDate
ASowingkg/ha−1156Meister27 October 2019
AFirst N fertilizationkg/ha−160ASN28 March 2020
ASecond N fertilizationkg/ha−180CAN30 April 2020
AThird N fertilizationkg/ha−140CAN20 May 2020
AN fertilization, totalkg/ha−1180
APlant protectionkg/ha−10.05/0.07Biathlon, Concert7 April 2020
APlant protectionL/ha−10.5CCC 7207 April 2020
APlant protectionL/ha−11.25/0.075Capalo/Karate16 May 2020
APlant protectionL/ha−12.0Osiris13 June 2020
BSowingkg/ha−1205Meister10 November 2020
BFirst N fertilizationkg/ha−178ASN4 March 2021
BSecond N fertilizationkg/ha−154CAN8 May 2021
BThird N fertilizationkg/ha−140CAN4 June 2021
BN fertilization, totalkg/ha−1172
BPlant protectionkg/ha−10.13Broadway22 April 2021
BPlant protectionL/ha−10.25/0.5Pixxaro/CCC 72022 April 2021
BPlant protectionL/ha−11.0/0.3Revystar/Flexity20 May 2021
BPlant protectionL/ha−11.0/0.075Ascra Xpro/Karate11 June 2021
Table 4. Descriptive statistics of the nitrogen uptake data in kg N ha−1 analyzed in this study.
VariablenYearBBCHUnitMeanMedianMinimumMaximumStandard DeviationSkewness
Biomass samples30202031kg N ha−150.250.933.264.17.9−0.41
Satellite data30202031kg N ha−130.430.723.335.83.4−0.36
Sensor data30202031kg N ha−142.743.724.666.29.80.28
Biomass samples30202039kg N ha−1118.2118.4109.2125.23.7−0.34
Satellite data30202039kg N ha−1116.9122.784.9141.617.2−0.51
Sensor data30202039kg N ha−1124.1127.168.8169.127.2−0.37
Biomass samples30202055kg N ha−1186.8187.9167.1199.59.6−0.45
Satellite data30202055kg N ha−1144.9145.4121.6163.011.9−0.34
Sensor data30202055kg N ha−1203.6216.1143.5247.332.2−0.52
Biomass samples30202065kg N ha−1225.5225.9211.8235.26.1−0.37
Satellite data30202065kg N ha−1178.1181.2164.1188.37.9−0.57
Sensor data30202065kg N ha−1248.5255.3166.9320.237.9−0.30
Biomass samples45202131kg N ha−145.244.929.463.07.50.12
Satellite data45202131kg N ha−140.840.533.847.61.9−0.11
Sensor data45202131kg N ha−143.944.923.562.19.7−0.34
Biomass samples45202139kg N ha−1144.3142.2124.1195.813.91.17
Satellite data45202139kg N ha−1123.4120.4100.8161.016.00.9
Sensor data45202139kg N ha−1143.0133.7103.8217.531.20.51
Biomass samples45202155kg N ha−1192.3192.1142.6225.916.1−0.74
Satellite data45202155kg N ha−1170.0169.2146.4202.812.50.47
Sensor data45202155kg N ha−1199.9191.6118.3275.744.10.24
Biomass samples45202165kg N ha−1218.3217.5182.4260.817.50.52
Satellite data45202165kg N ha−1183.4182.6140.8225.521.40.19
Sensor data45202165kg N ha−1232.1239.3147.2308.546.90.11
Table 5. Coefficients of determination (R2): nitrogen uptake data for 2020 (n = 30) and 2021 (n = 45).
R2BBCHSensor 2020Satellite 2020Sensor 2021Satellite 2021
Biomass samples 2020310.740.60
Biomass samples 2020390.830.80
Biomass samples 2020550.770.74
Biomass samples 2020650.670.67
Biomass samples 202131 0.660.48
Biomass samples 202139 0.760.57
Biomass samples 202155 0.720.63
Biomass samples 202165 0.650.59
Publisher’s Note: MDPI stays neutral with regard to jurisdictional claims in published maps and institutional affiliations.

