Article

Agronomic Performance of Broomrape Resistant and Susceptible Faba Bean Accession

1
Institute for Sustainable Agriculture, CSIC, Avda. Menéndez Pidal S/N, 14004 Córdoba, Spain
2
Departamento de Ciencias Agroforestales, E.T.S.I. Campus El Carmen, Universidad de Huelva, Avda. Fuerzas Armadas S/N, 21007 Huelva, Spain
*
Author to whom correspondence should be addressed.
The author has passed away.
Agronomy 2022, 12(6), 1421; https://doi.org/10.3390/agronomy12061421
Submission received: 10 May 2022 / Revised: 5 June 2022 / Accepted: 11 June 2022 / Published: 13 June 2022
(This article belongs to the Special Issue Legumes Cultivars and Their Genetic Improvements)

Abstract

:
The faba bean (Vicia faba) is a temperate grain legume, that is regaining interest due to the high demand for food and feed uses and the environmental services provided. The parasitic weed broomrape (Orobanche crenata) appears as the major constraint to agricultural production in the Mediterranean Basin. The yield stability can be managed by adjusting agronomic practices and breeding for adaptation. In this study, we compared the performance of three susceptible faba bean accessions with that of eight lines previously selected for their broomrape resistance, in multi-environment field trials. Results confirmed that the grain yield in the region was negatively affected, mainly by broomrape infection, followed at a distance by ascochyta blight (Ascochyta fabae), whereas the grain yield was little affected by the low occurring levels of chocolate spot infection (Botrytis fabae). The yield was favored by rain at flowering and was reduced by low temperatures at pre-flowering and flowering, and by high temperatures at flowering and grain-filling. The combined ANOVA showed significant effects of the genotype, environment, and genotypex environment interaction. The weighted average of the absolute scores biplot (WAASB), a heat map with 21 scenarios based on the WAASB ratio and the multi-trait stability index (MTSI) were utilized to determine the mean performance and stability of the faba bean genotypes. Quijote, Navio6, Baraca and FaraonSC are proposed as ideal lines for cultivation in the region and to be further used in future breeding programs.

1. Introduction

The faba bean (Vicia faba) is a temperate grain legume cultivated worldwide for food and feed uses. Under Mediterranean climates, with mild winters and dry and warm summers, faba beans are sown in the autumn or early winter and harvested in the late spring to early summer. In cooler regions, the sowings are postponed to the spring to avoid frost damage, although cultivars with winter hardiness can be sown in the autumn [1,2].
The faba bean accessions can be grouped into several distinct genetic pools differing with regard to phenology and adaptation, with the Mediterranean types being particularly distinct to the rest [3,4,5]. A variation in adaptation to oceanic and continental climates can be found within the various pools [1,6], whereas adaptation to the Mediterranean environments seem to be limited to the Mediterranean types [1,5,6,7,8,9]. Yield instability due to genotype × environment interactions (GEIs) has often been regarded as a major factor limiting faba bean cultivation in the Mediterranean basin [6,9,10,11,12,13,14], reinforcing the need to refine agronomic practices and specific breeding for the Mediterranean mega-environment [10].
As with any crop, the faba bean can be severely damaged by pest and diseases [15], causing crop failure in susceptible cultivars. Among these, the parasitic root weed broomrape (Orobanche crenata) is a major constraint specific to the Mediterranean basin and Middle East [16]. The penalty on the faba bean yield due to broomrape infestation depends on the level of infection, the level of resistance of the cultivar used and environmental factors [17]. Ascochyta blight (Ascochyta fabae, teleomorph Didymella fabae) can be particularly severe in rainy years, as the spores are splat-dispersed, whereas the chocolate spot (Botrytis fabae, teleomorph Botryotinia fabae) can be damaging during years of humid and warm conditions [15]. The chemical control of broomrape by systemic herbicides, and of ascochyta blight or chocolate spot by fungicides, is feasible but of limited economic viability, considering the low input farming systems where faba bean are grown. This calls for the need to integrate control measures [15,18,19]. Resistance breeding to the three diseases has proved to be difficult but have resulted in the release of a number of cultivars with incomplete resistance (reviewed in [20,21]).
The GEIs result in differential responses of genotypes under different environmental conditions [22]. Modelling the genotypic effects by assuming the genotypes to be random variables is desirable in multi-environment trials for estimating the yield response [23,24]. In the same way as this, the yield prediction includes the prediction of random interactions of a genotype within an environment [25]. Several statistical methods were developed to understand and explain the GEIs [26,27]. Among these methods, the additive main effect and the multiplicative interaction (AMMI) analysis [28] and genotype plus genotype-by-environment (GGE) biplot [29] are some of the most widely used in multi-environmental trial (MET) analysis, because these provide more accurate estimates and easy interpretations of the GEIs through clear graphical tools. The AMMI or GGE biplot have many advantages in explaining GEIs. However, they are based on a strictly fixed-effects model with the (additive) main effects for genotypes and environments and all of the multiplicative effects for the interaction being fixed [30]; therefore, they are not appropriate for analyzing the structure of the linear mixed-effect model (LMM), and this called for the use of new models [31,32]. The best linear unbiased prediction (BLUP) improves the predictive accuracy of random effects [33]. However, the BLUP model is not a graphic-based tool to handle a random GEI structure [34]. To circumvent these issues, a novel stability index, WAASB (weighted average of absolute scores), was proposed [32] from the singular value decomposition of the matrix of BLUP for GEI effects generated by a LMM. Then, a superiority index, WAASBY, was developed to select genotypes, based on both yield performance and the WAASB stability score. Secondly, a based multi-trait stability index (MTSI) was also developed to select genotypes for multiple traits [32].
The objective of this research was to assess the possibility of a revalorization of faba bean cultivation in the area, by assessing the performance and stability of grain yield and of broomrape resistance under different environments on a set of faba bean genotypes differing in the level of resistance.

2. Materials and Methods

2.1. Plant Material and Experimental Design

The performance of the 15 faba bean accessions (Table 1) was studied at two southern Spanish locations: Córdoba (37°50′ N 4°50′ W and 90 m above sea level) and Escacena del Campo (37°25′ N 6°15′ W and 88 m above sea level), over three consecutive field seasons (2010–2011, 2011–2012 and 2012–2013) (Table 2). The accessions studied included 12 breeding lines selected from various breeding programs for their resistance to O. crenata [21,35,36,37,38,39,40,41], and three elite cultivars, being all Mediterranean types. At each location, a randomized complete block design with three replications was used. The experimental unit consisted of small plots, with three 1 m long rows per accession, separated by 0.35 m, with 10 plants per row. The sowing took place by the middle of December in each season, according to local practice. The weeds were controlled by hand weeding. The days to flowering (dtf) were estimated by the weekly recording of the date in which 50% of the plants of each plot had at least one fully opened flower. The number of the emerged broomrape plants per row were recorded and referred to as the number of broomrapes per faba bean plant (Oc/pl). The ascochyta blight and chocolate spot were also monitored, recording the disease severity (DS), estimated as a percentage of the canopy covered by lesions [42,43]. The harvest of the plants took place by late May, depending on the environment. The harvested plants were threshed and the grain yields were recorded. The climatic data were obtained from Red de Información Agroclimática de Andalucía [44] and provided in Table 2 and Figures S1 and S2 (Supplementary Materials).

2.2. Statistical Analysis

2.2.1. Variance Components

Each combination of the year and location was considered to be an environment, having a total of six environments for the stability analysis of 15 genotypes. All of the analyses were completed by executing the ‘metan’ package on R Studio statistical software version 4.1.0 [34]. A combined analysis of variance (ANOVA) for the randomized complete-block designs across the environments was performed by assuming all of the effects as random factors. Data were subjected to the Shapiro–Wilk test for normality and Bartlett’s test for homogeneity of variances.

2.2.2. GEI Analysis

WAASB Index

To evaluate the stability of the grain yield or of broomrape infection of the genotypes across the environments, we estimated the weighted average of absolute scores from the singular value decomposition of the matrix of BLUPs (WAASB) for the GEI effects generated by a linear mixed-effect model [32]. The estimations were performed assuming genotypes, environment, blocks within environments and GEI as random effects. The stability measure as WAASB was calculated as:
  WASSB i = k = 1 p I P C A i k × E P k / k = 1 p E P k
where WAASBi is the weighted average of absolute scores of the ith genotype (or environment); IPCAik the score of the ith genotype (or environment) in the kth IPCA and EPk was the amount of the variance explained by the kth IPCA. The genotypes with the lower WAASB index values have the wider stability on the basis of the studied traits in the evaluated environments.

WAASBY Superiority Index

The WAASBY superiority index [32] is designed to weight performance (i.e., grain yield) and stability (WAASB). It was calculated as:
W A A S B Y i = r G i × θ Y + r W i × θ S θ Y + θ S
where rGi and rWi are the rescaled values for grain yield or for broomrape infection, and WAASB, respectively, for the ith genotype; Gi and Wi were the grain yield or broomrape, and the WAASB values for ith genotype. The WAASBYi superiority index for the ith genotype was weighted between the trait and stability, and θY and θS were the assumed weights for the trait and stability. In addition, 21 of the scenarios varying θS and θY (100/0, 95/5, 90/10, and so on, till 0/100) were designed to show how the ranking of genotypes is altered, depending on the weight assigned to the stability and response variable. A heat map was produced to facilitate with the intuitive interpretation.
A Euclidean distance-based dendrogram is used for grouping the genotypes based on their ranks; these groups are shown on the left side of the heat map to identify the groups of genotypes (each group with a different color) with similar performance regarding stability and productivity [32].

Multi-Trait Stability Index (MTSI) Base on Factor Analysis

A multi-trait stability index (MTSI) [32] was calculated for simultaneous selection for stability and performance on grain yield and broomrape response, using the WAASBY index. The MTSI was calculated as:
M T S I i = j = 1 f F i j F j 2 0.5
where F is a g × f matrix with the factorial scores being the number of genotypes (g) and the number of factors (f), Fij is the jth score of the ith genotype, and Fj is the jth score of ideotype.

2.2.3. Correlations

Correlation analysis was applied to describe the impact on the grain yield of broomrape, ascochyta, botrytis and climatic parameters. The analyzed climate variables included the maximum and minimum temperature, maximum and minimum humidity and accumulated rain during pre-flowering, at flowering and post-flowering period. The analysis was completed with PAST software [45].

3. Results

3.1. Mean Performance of Genotypes and Environments for Grain Yield

The average grain yield was 2018 kg/ha, with great differences across the environments and genotypes (Table 3). The average grain yield was higher than 2400 kg/ha at Cord13, Esc11 and Esc12, whereas it was lower than 900 kg/ha at Cord11 and Cord12, and intermediate (1856 kg/ha) at Esc13, showing the high effects of the environment and of GEI on grain yield, that were even higher than those of the genotype (Table 4). The accession that performed better across the environments was Quijote with an average of 2856 kg/ha, ranging between 1582 to 4015 kg/ha in different environments. The Quijote was followed by the accessions Navio6, Baraca, FaraonSC, Navio3, Navio7, Navio and 151-4, with average grain yields over the environments that were higher than 2000 kg/ha; higher than the commercial cultivars Brocal (1613 kg/ha) and Prothabon (1275 kg/ha). This is in line with the reported yields of commercial cultivars, Baraca, Prothabon and Brocal, in the region [46,47]. The major type, landrace Zoco, gave the lowest grain yield with 497 kg/ha in average.

3.2. Pooled ANOVA

A pooled analysis of variance on grain yield and broomrape infection from the six environments showed that the environmental and genotypic effects were highly significant (p < 0.0001; Table 4). In addition, the blocks within the environments were not significant and GEI was significant at p ≤ 0.05 for broomrape per plant (Table 4). The pooled ANOVA showed that 59% of the total variation for grain yield were due to environmental effects (E), 12% by GEIs, and only 11% by genotypic (G) effects. However, for broomrape infection the genotype was more important, explaining 38% of the total variation, being 20% for E and only 6% for GEI (Table 4).

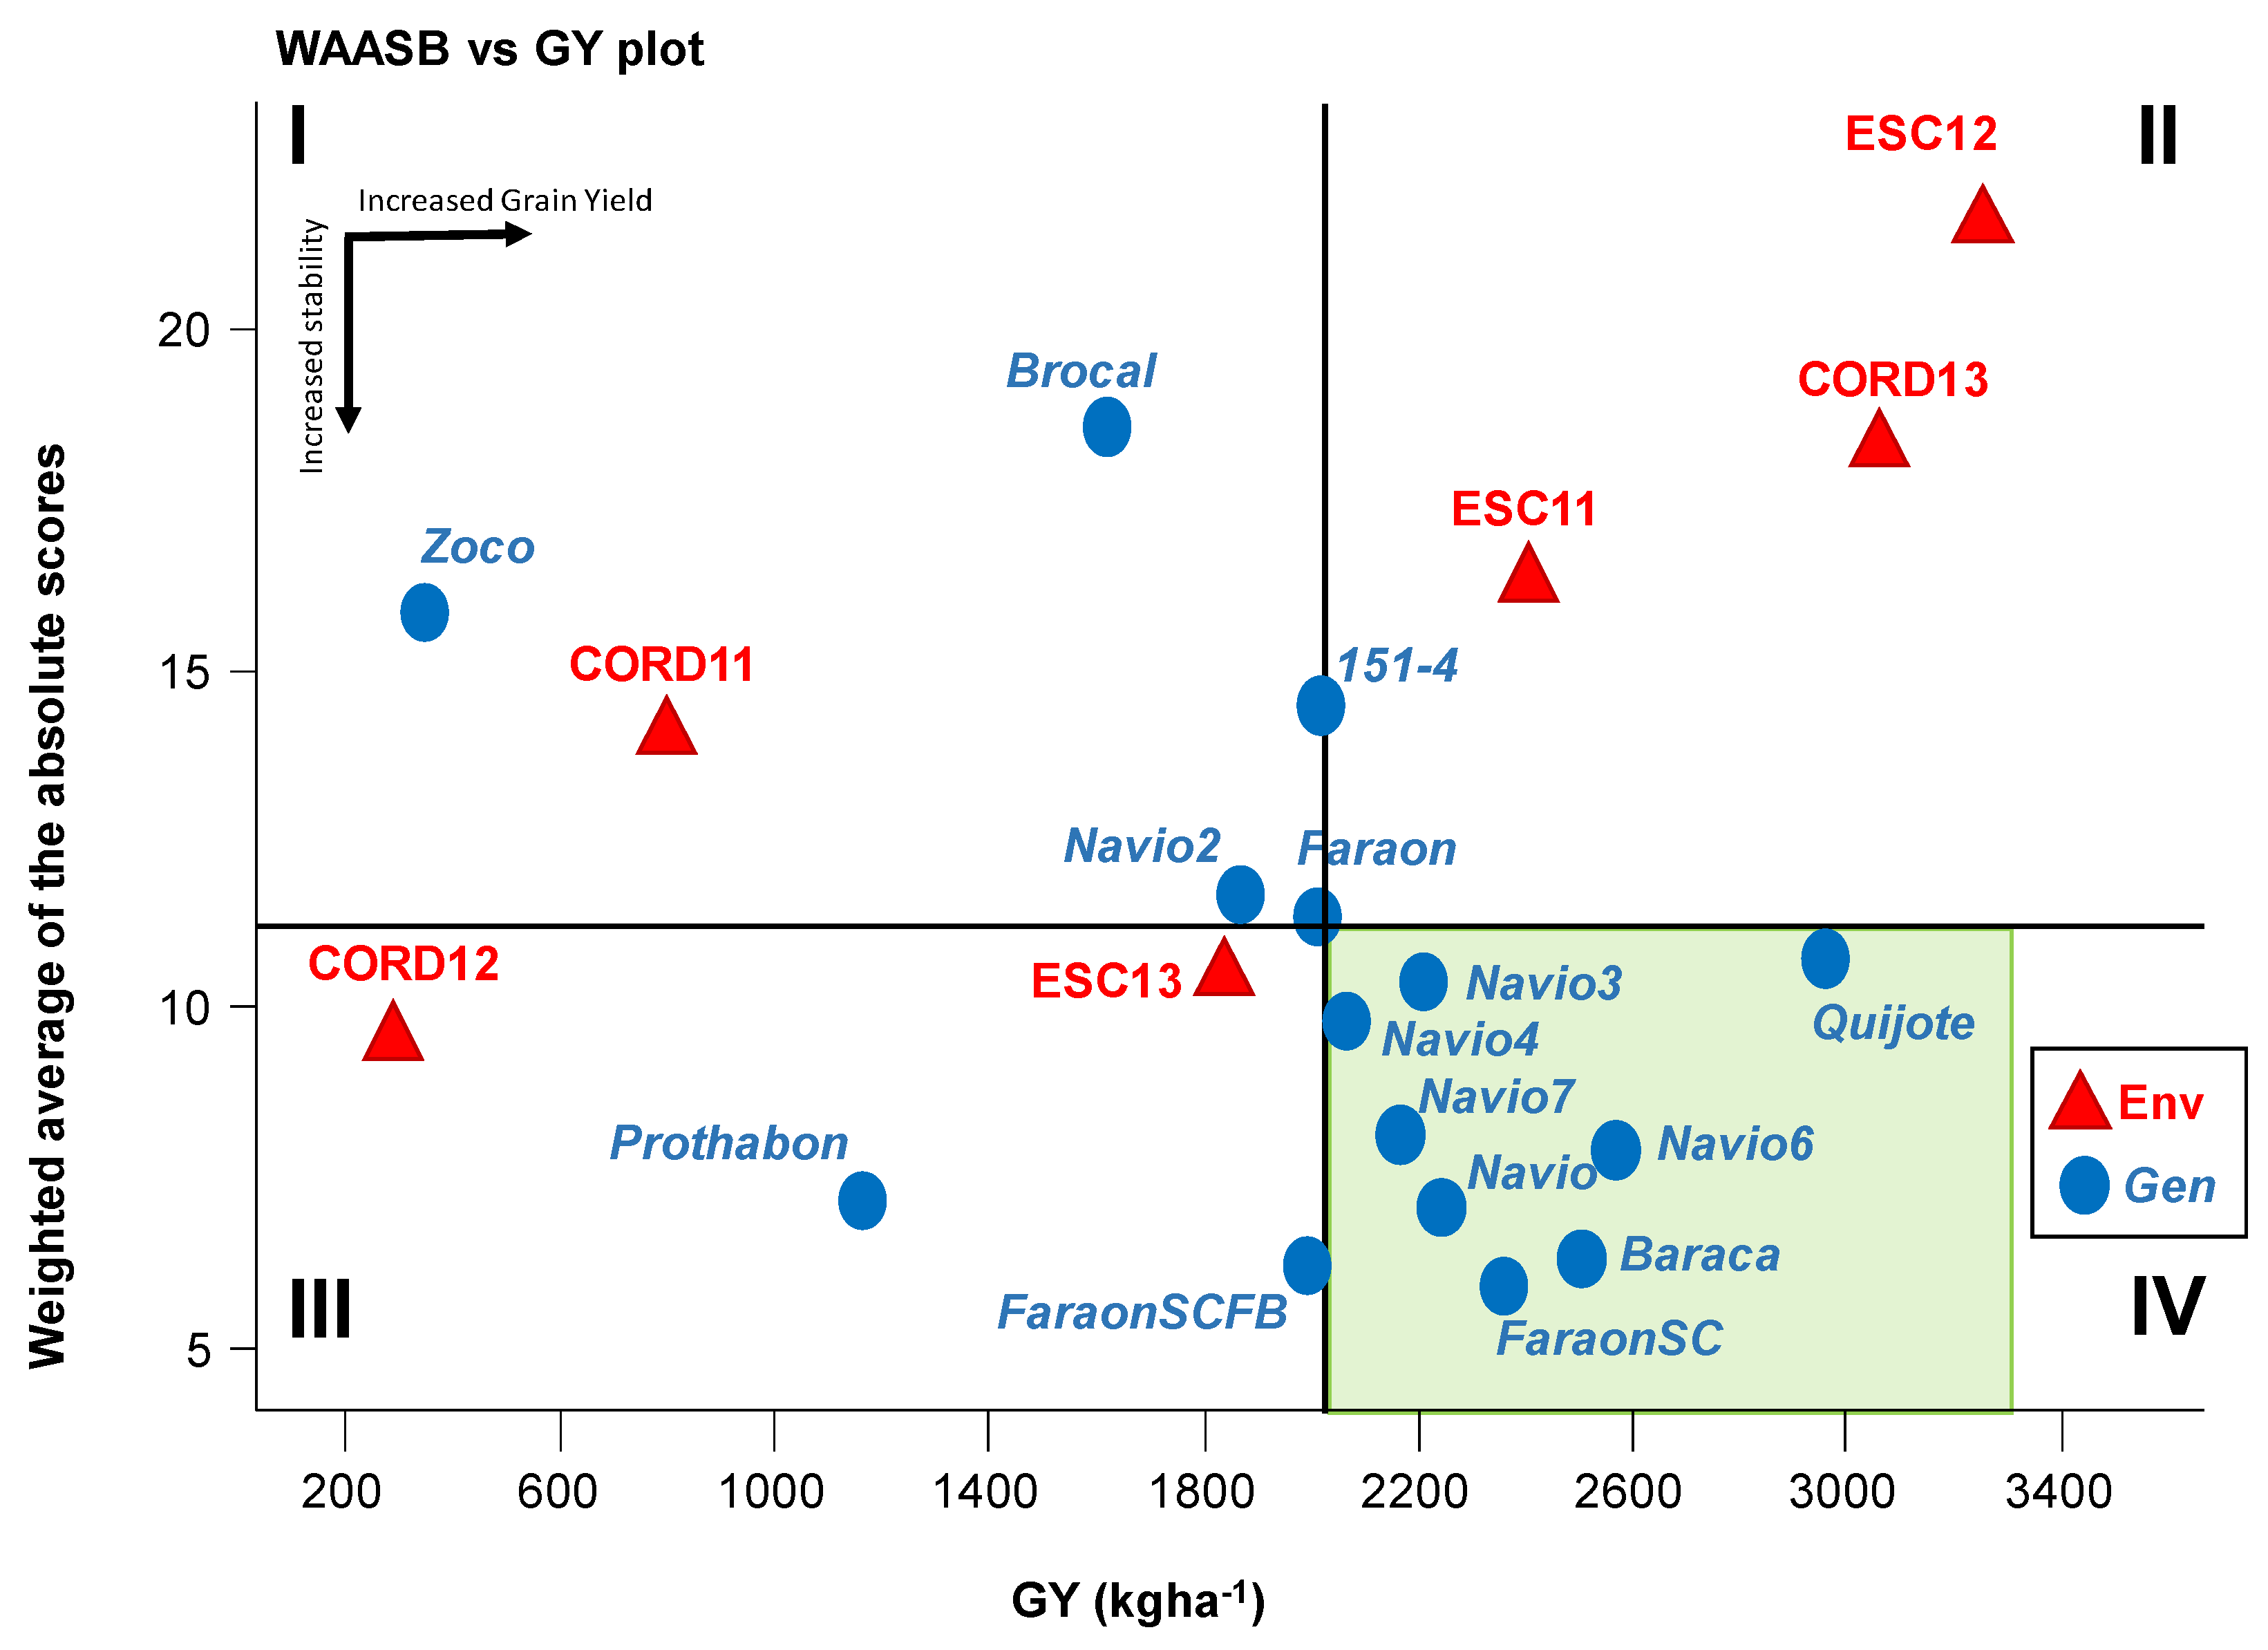
3.3. WAASB-Based Stability Analysis for Grain Yield

Figure 1 shows four quadrants, ranking the genotypes and environments according to performance (yield increasing from left to right) and stability (increasing from up to down). According to this, the most interesting genotypes would be those in quadrant IV (shaded quadrant, right-down, Figure 1) being more productive and more stable (lower WASSB), namely, Baraca, FaraonSC, Navio, Navio6, Navio7, Navio3, Navio 4 and Quijote. On the contrary, Zoco and Brocal were the genotypes with a lower and less stable grain yield.

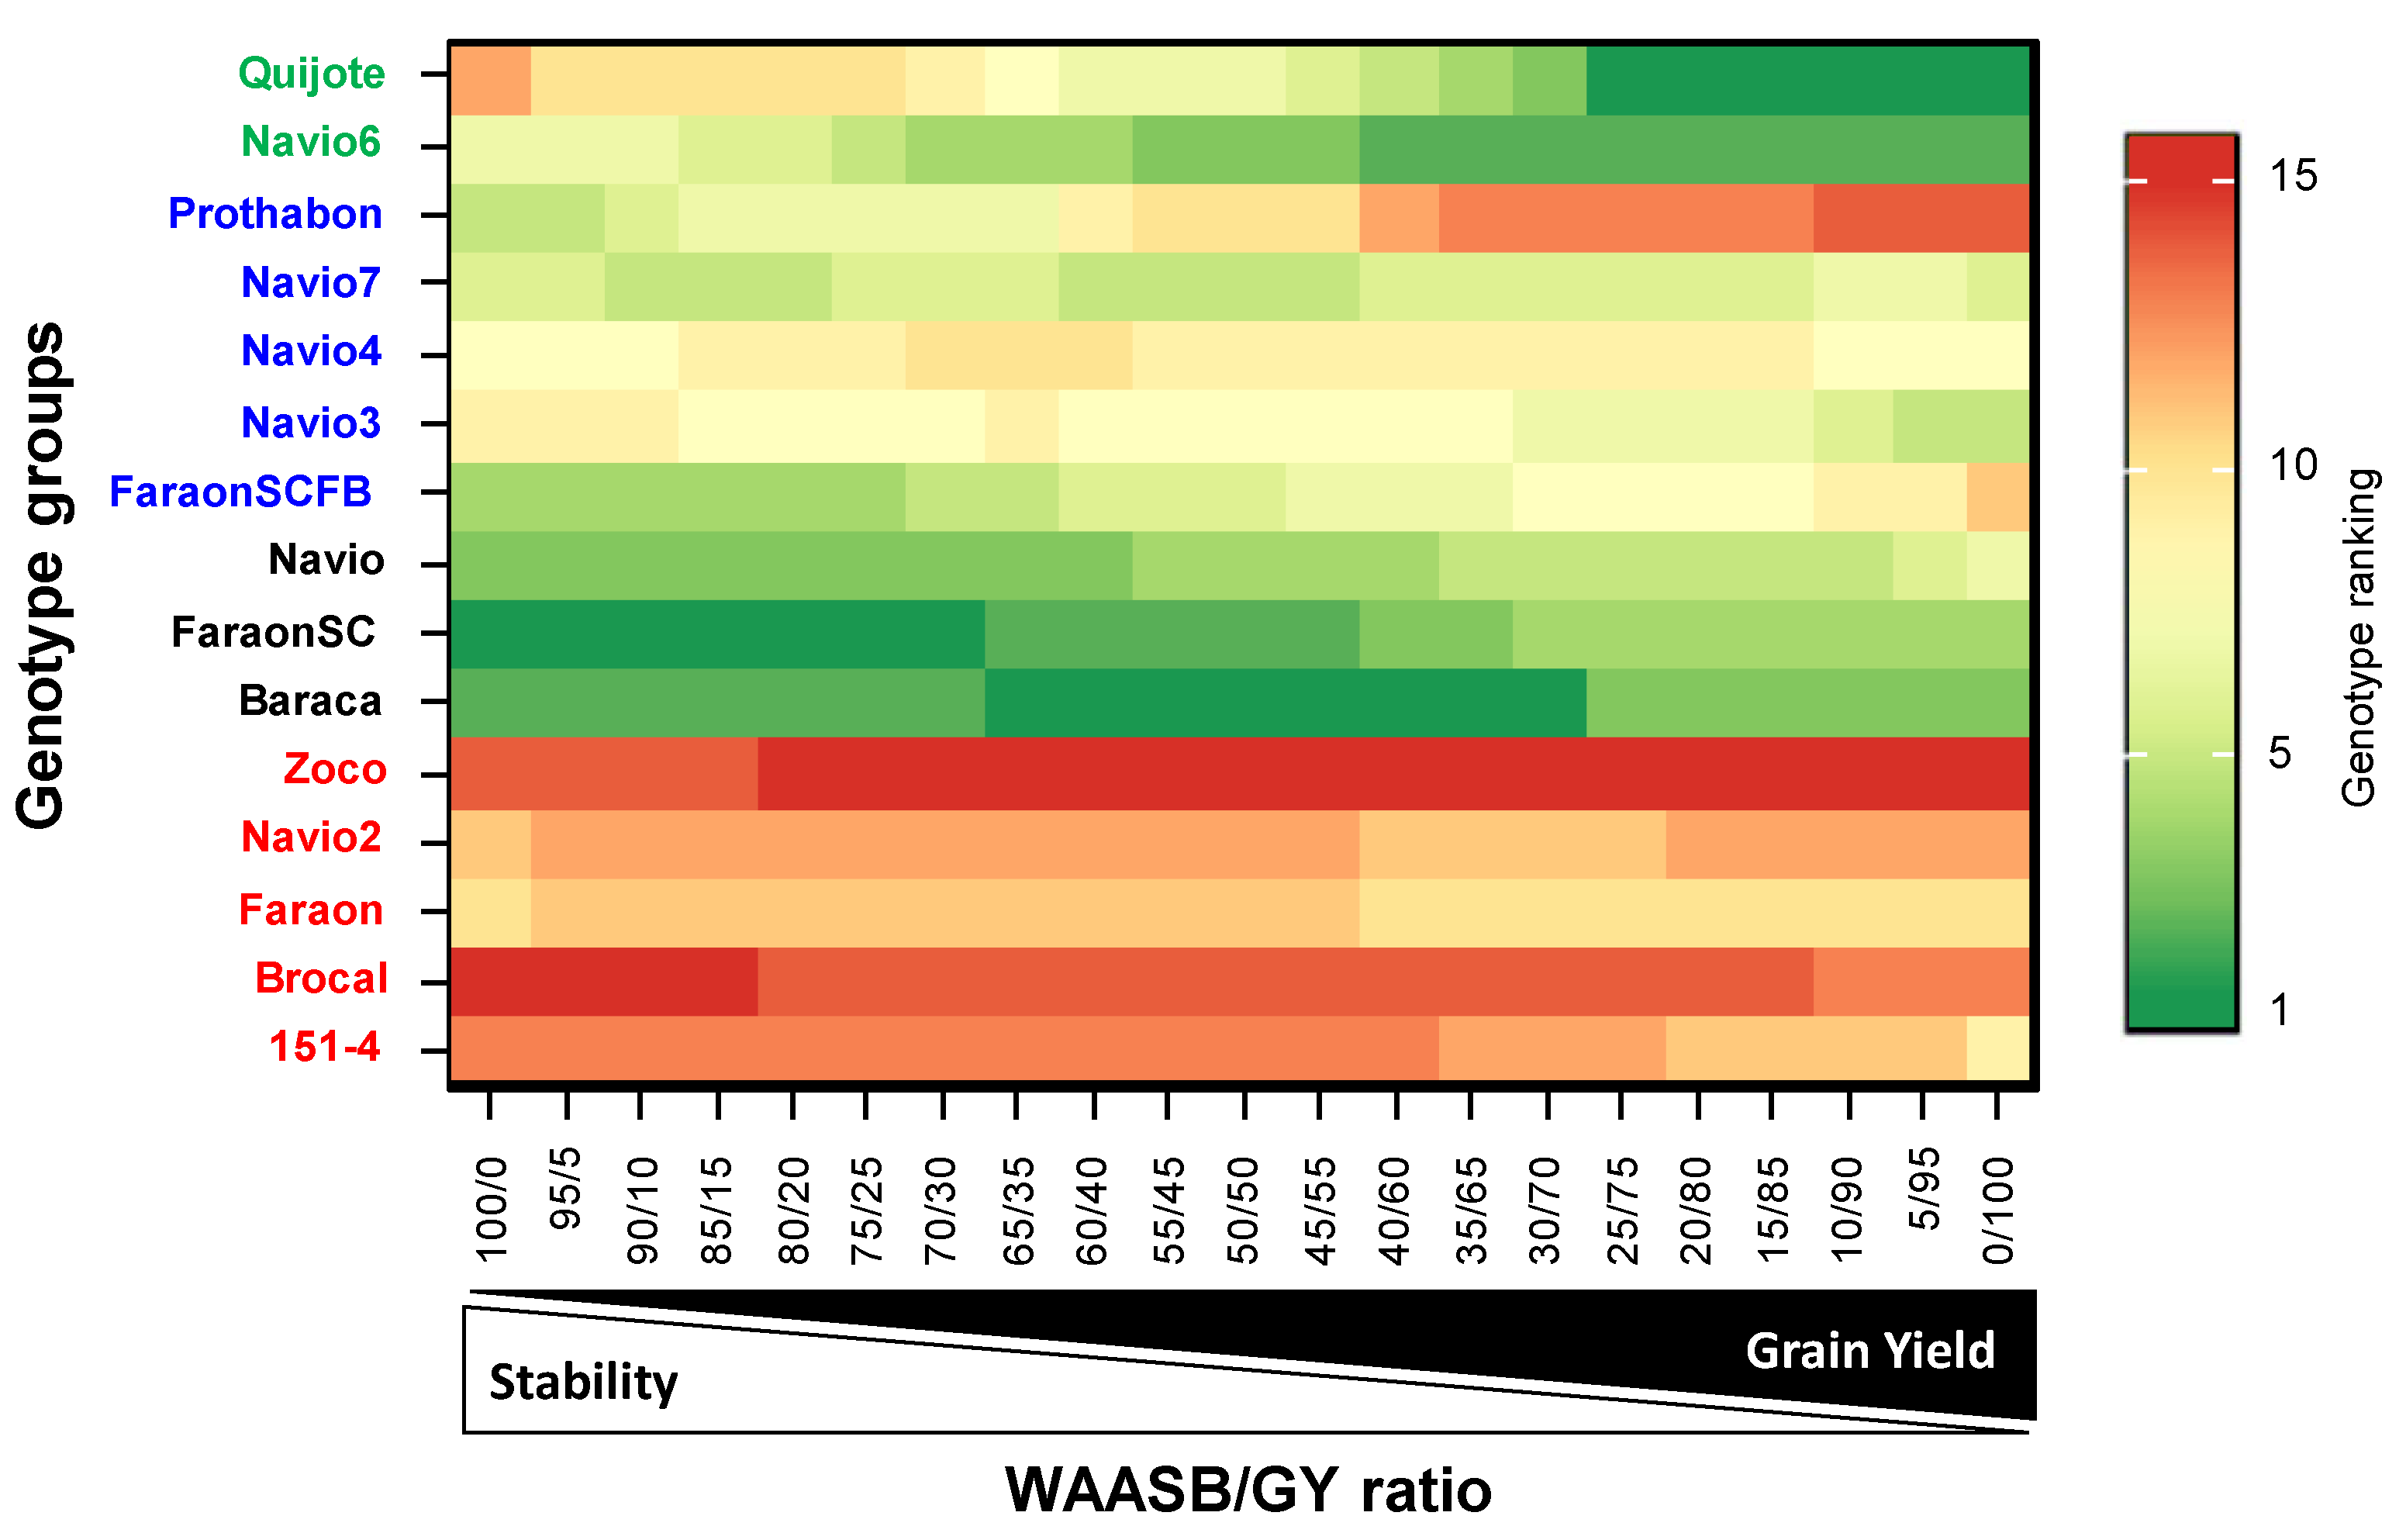
3.4. Genotype Ranking Based on WAASBY Index for Grain Yield

Figure 1 was a snapshot obtained, based on the performance and stability of the trait, to assist with choosing the best genotypes. However, the reality might be that the breeders do not always have a clear criterion to pre-assign relative weights to the stability versus the performance of a certain trait. In this case, one option might be to study all of the possible scenarios with the help of a heat map, such as the one shown in Figure 2, where the genotypes are ranked based on the WAASB ratio that assigns different weights for the stability/value of the trait, from 100/0 (left side) to 0/100 (right side). Four groups of genotypes can be identified by the cluster analysis based on the ranking matrix in all of the scenarios, which are represented with different colors (green, black, blue and red, in order of selection, Figure 2). Cluster 1 (names marked in green) included the accessions Quijote and Navio6, which are highly productive and broadly adapted. Note that they remained the first-ranked when the WAASB/GY ratio was low (greater weight for yield) (Figure 2). Cluster 2 (names in blue) included Prothabon, Navio7, Navio4, Navio3 and FaraonSCFB, can be considered productive near the mean, and stable, as they were well ranked when the WAASB/GY ratio was intermediate (greater weight for both stability and yield). Cluster 3 (names in black), conversely, included Navio, FaraonSC and Baraca, highly stable and intermediate productive genotypes above the mean. They were well ranked when the WAASB/GY ratio was high (greater weight for stability). Cluster 4 (names in red) included Zoco, Navio2, Faraon, Brocal and 154-1, which we have shown in quadrant I of the Figure 1, are poorly productive and unstable genotypes. Clusters 1 and 3 contained those genotypes included in quadrant IV of Figure 1, with a higher and more stable grain yield, whereas cluster 2 contained two genotypes, Prothabon and FaraonSCFB; below the average yield (quadrant III, Figure 1).

3.5. Mean Performance of Genotypes and Environments for Ascochyta Blight, Chocolate Spot and Broomrape Infection

Broomrape was the most significant biotic stress observed in some of the environments (Table 5), with some incidence of ascochyta blight or chocolate spot in certain environments (Tables S1 and S2, Supplementary Materials). Ascochyta blight infection (Table S2, Supplementary Materials) was, in general, low and sporadic, reaching significant levels of infection only at Cord11 with an average DS of 8.4% across the accessions, being high (DS ≥ 30%) in the Faraon-derived accessions, and low (DS ≤ 10%) in all of the other accessions. Some ascochyta blight symptoms were also observed at Esc11 only, but at much lower levels (average DS 2%). Chocolate spot infection (Table S3, Supplementary Materials) was also, in general, low and sporadic, but reached significant levels at Esc13 (average 53% DS), being low at Cord11 (3.9%) and Esc11 (11%) and absent in the remaining environments. Broomrape infection was affected by the location and by the year, due to the environmental effects, as discussed later. The average infection at Córdoba ranged from 1.79 Oc/pl in 2012 and 1.01 Oc/pl in 2013. The variation was greater at Escacena, ranging from 0.15 Oc/pl in 2012 to 1.49 Oc/pl in 2013. The average level of infection on the three check cultivars was 2.91 Oc/pl, going down to 0.53 Oc/pl on average in the 12 resistant accessions, which is still significant. Accessions Quijote and Faraon showed an overall reduced infection level (<0.3 Oc/pl), although they suffered a higher level of infection in very conducive environments, such as Cord11, Cord12 and Esc11.

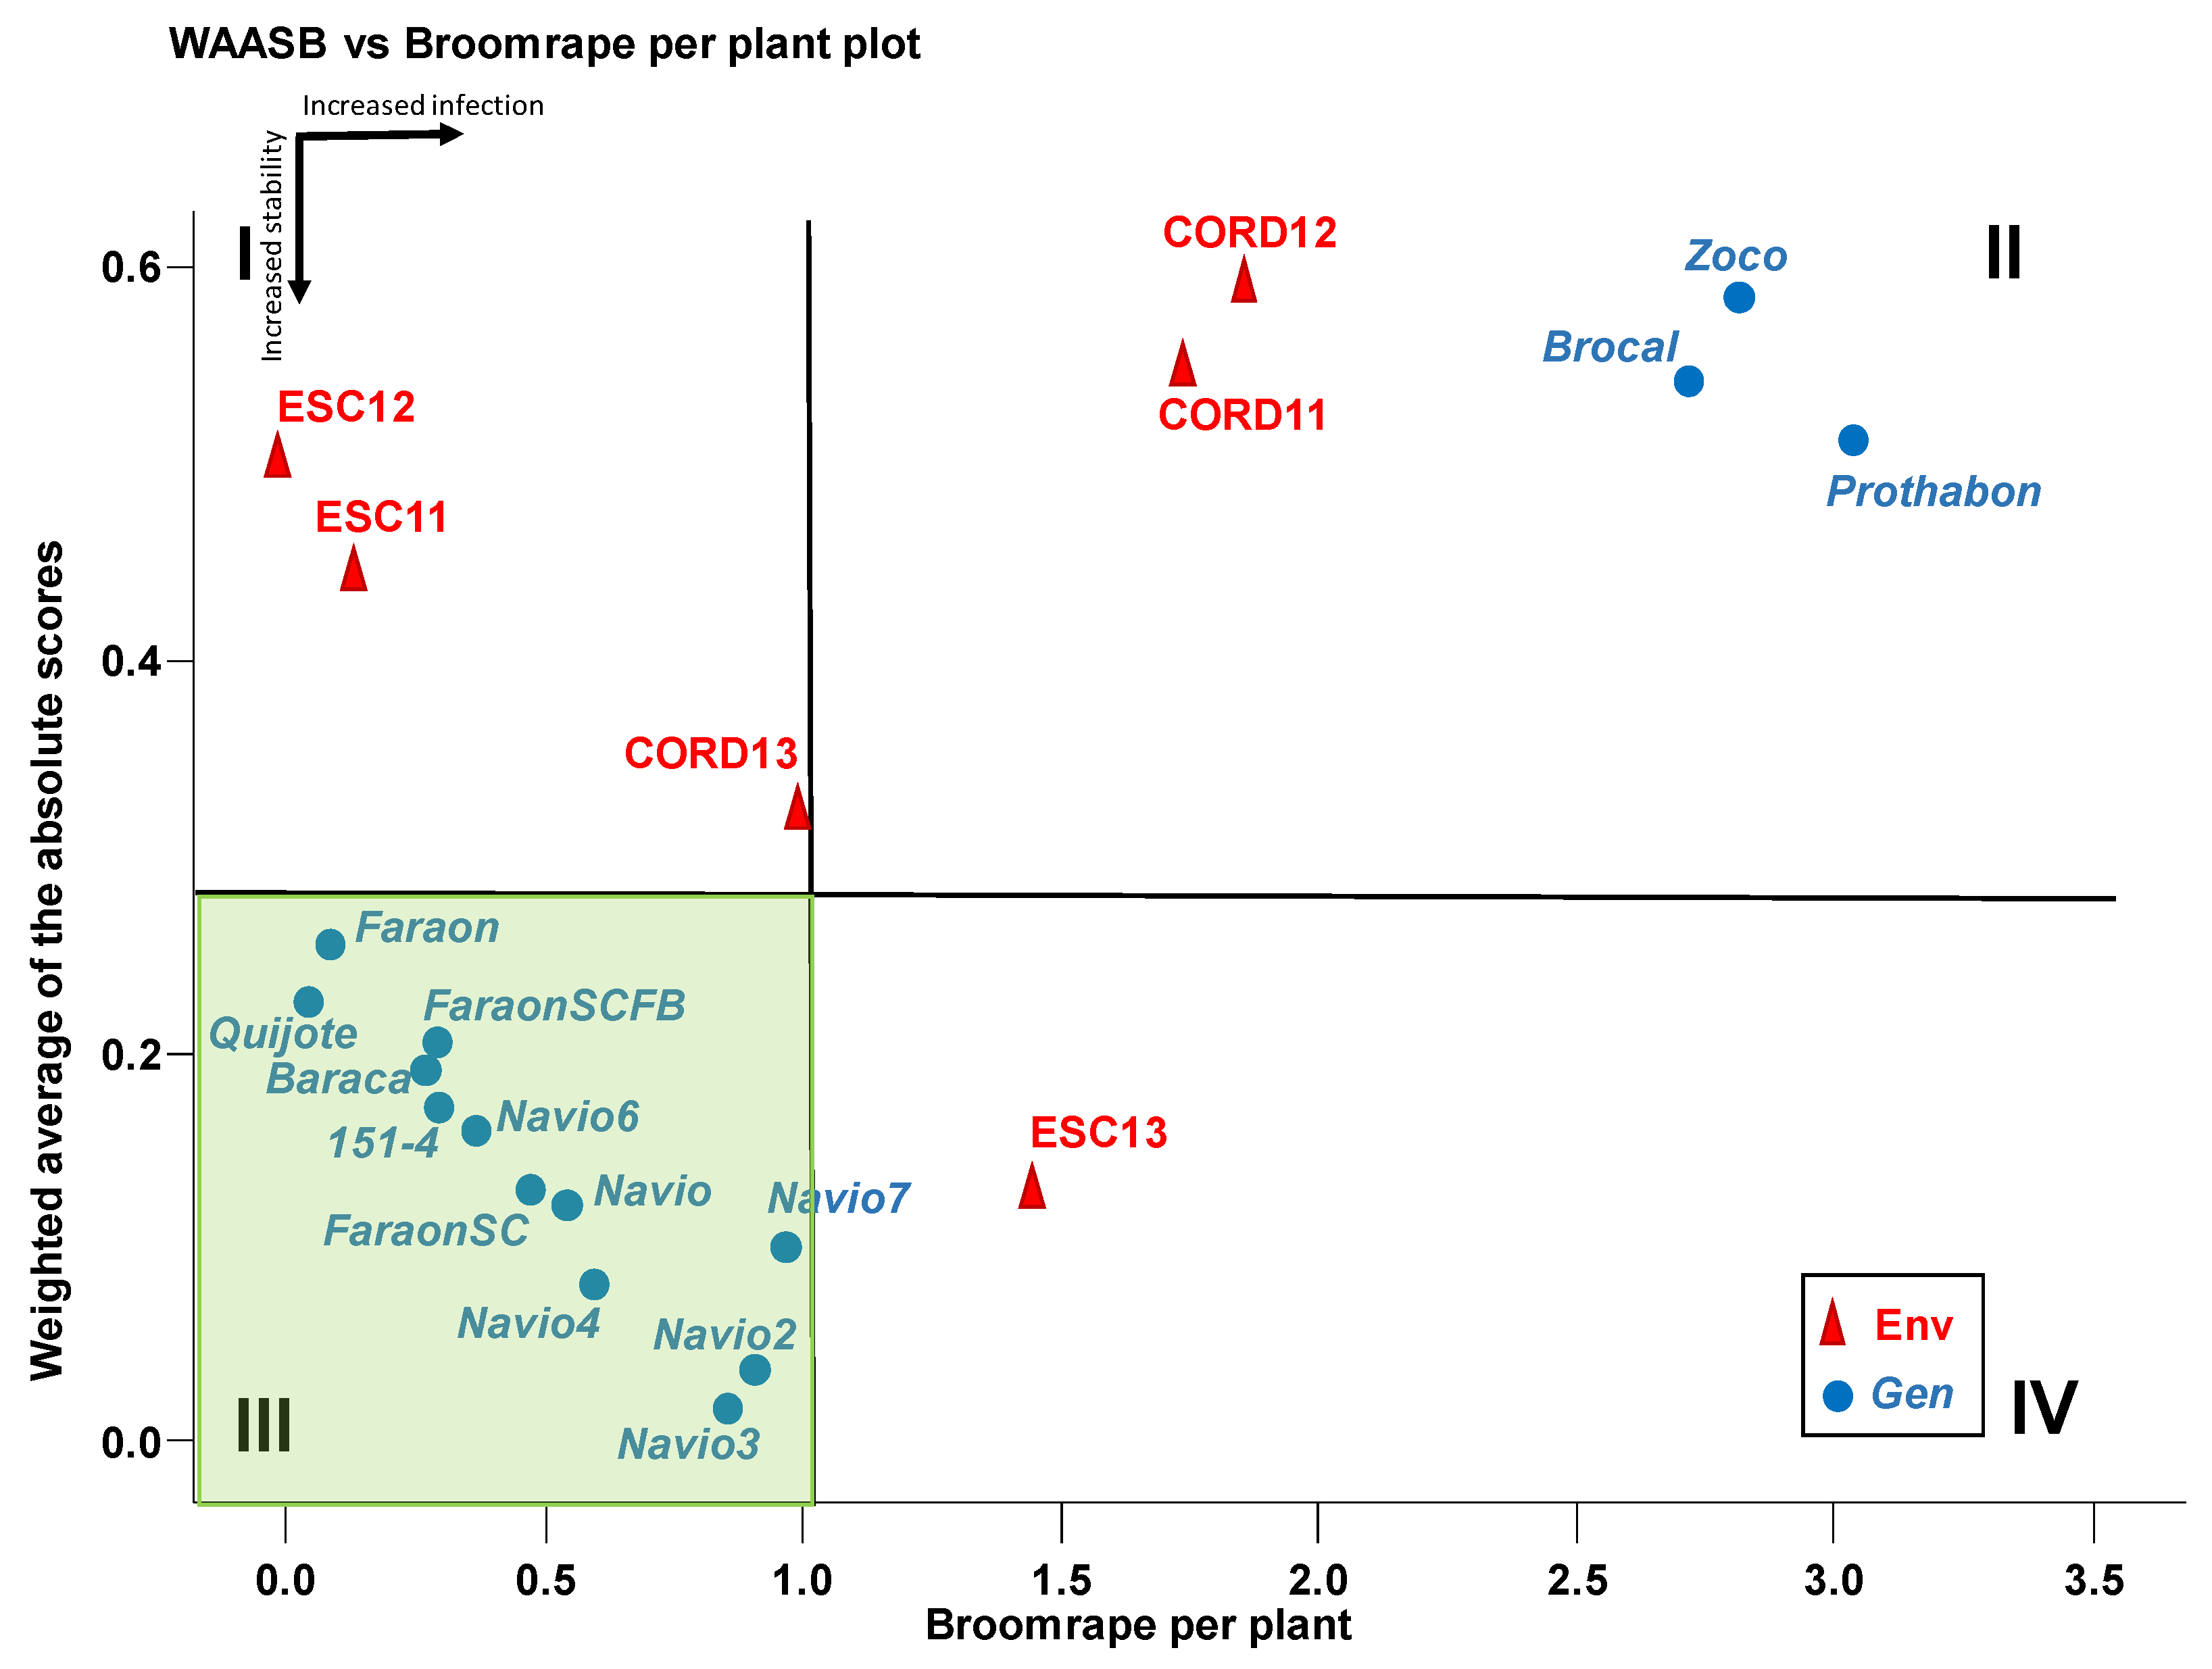
3.6. WAASB-Based Stability Analysis for Grain Yield

Figure 3 shows a clear separation of the genotypes in two distinct quadrants, with the broomrape-susceptible accessions Zoco, Brocal and Prothabon in quadrant II, showing the highest level of infection, and all of the others, that were previously selected for their levels of broomrape resistance, located in quadrant III (shaded quadrant left-down, Figure 3) showing lower levels of infection. The Córdoba location appeared as the most suitable for broomrape selection, providing high magnitudes of near and above average broomrape infection and high ability to discriminate accessions.

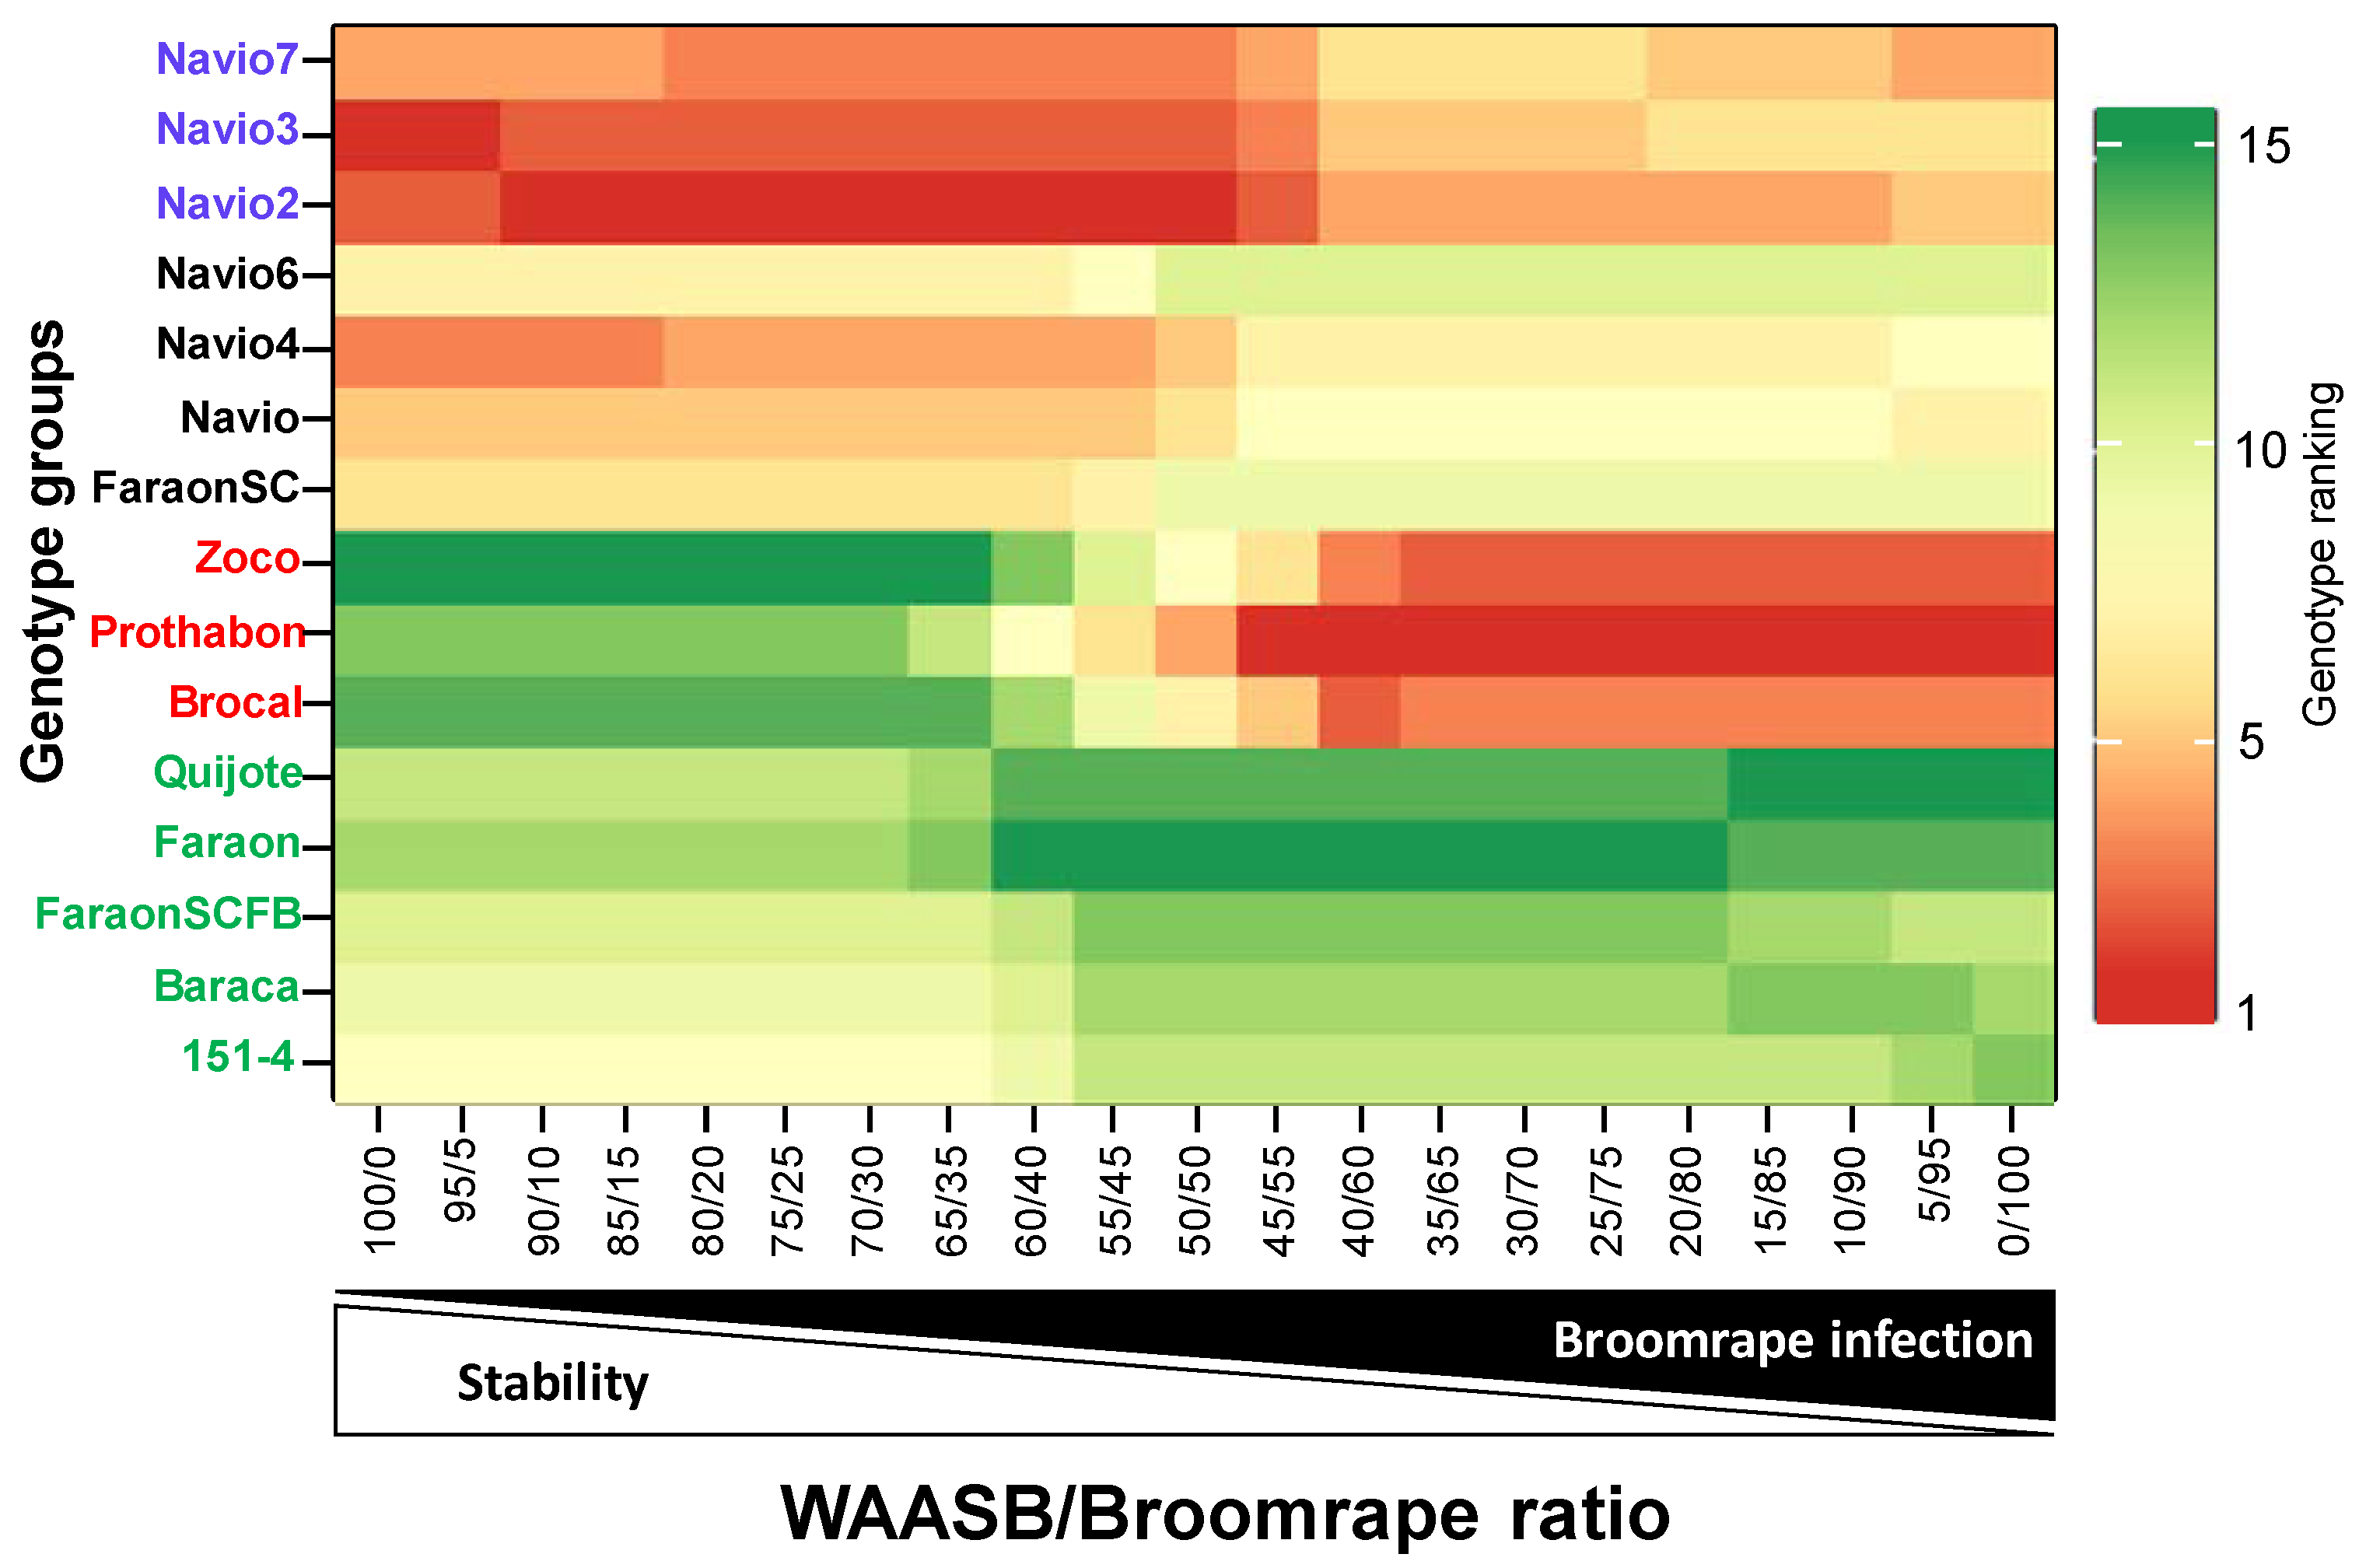
3.7. Genotype Ranking Based on WAASBY Index for Broomrape Infection

The heat map presented in Figure 4 ranks the accessions based on the WAASB ratio to broomrape infection (Oc/pl) with different weights for the stability/value of the trait, from 100/0 (left side) to 0/100 (right side). Four clusters of accessions can be identified based on these rankings. The first cluster of accessions (names in blue: Navio2, Navio3 and Navio7) had the lowest WAASB index of stability and number of the broomrape per plant near the mean. The second cluster (names in black: FaraonSC, Navio, Navio4 and Navio6) had a low WAASB index of stability, slightly higher than those of the first group but also lower levels of broomrape infection. The third cluster (names in red: Zoco, Prothabon and Brocal) were the less desirable accessions, showing higher and more stable levels of infection. Finally, the fourth cluster (names in green: Quijote, Faraon, FaraonSCFB, Baraca and 151-4), was the most desirable group in terms of stably low infection (Figure 4). Comparing with Figure 3, the accessions there in quadrant III are further separated by the heat map (Figure 4) into two groups (cluster 2, black, and 4, green) the green one being the most desirable.

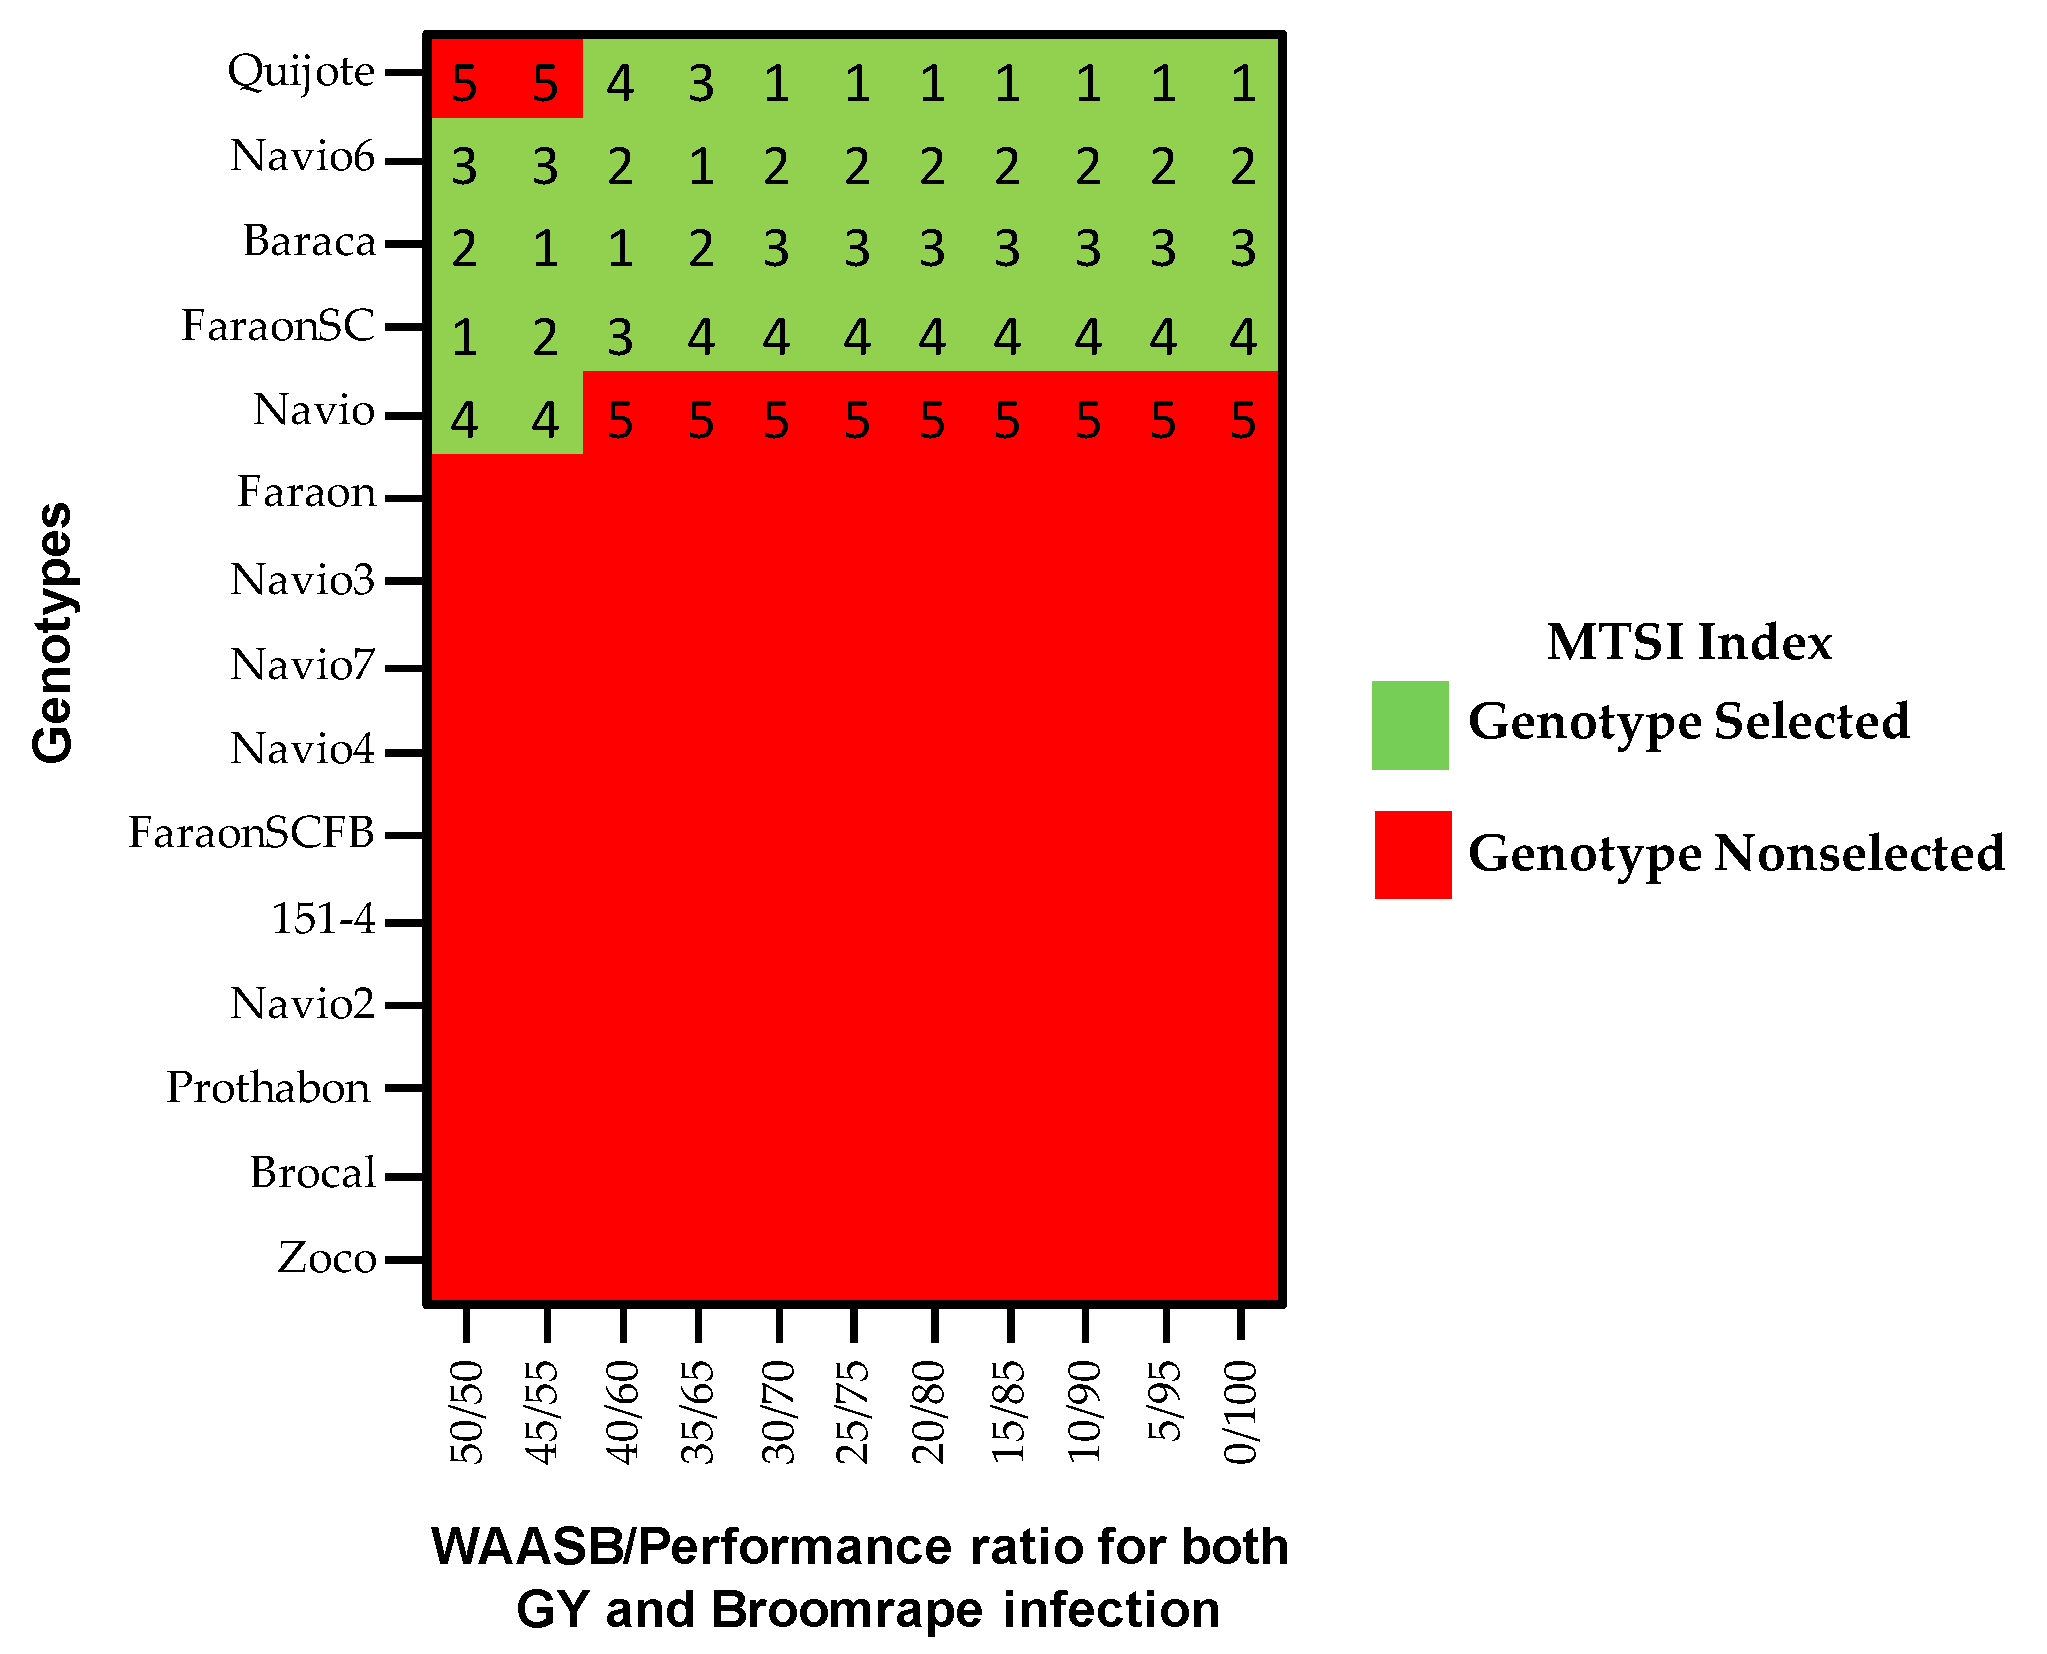
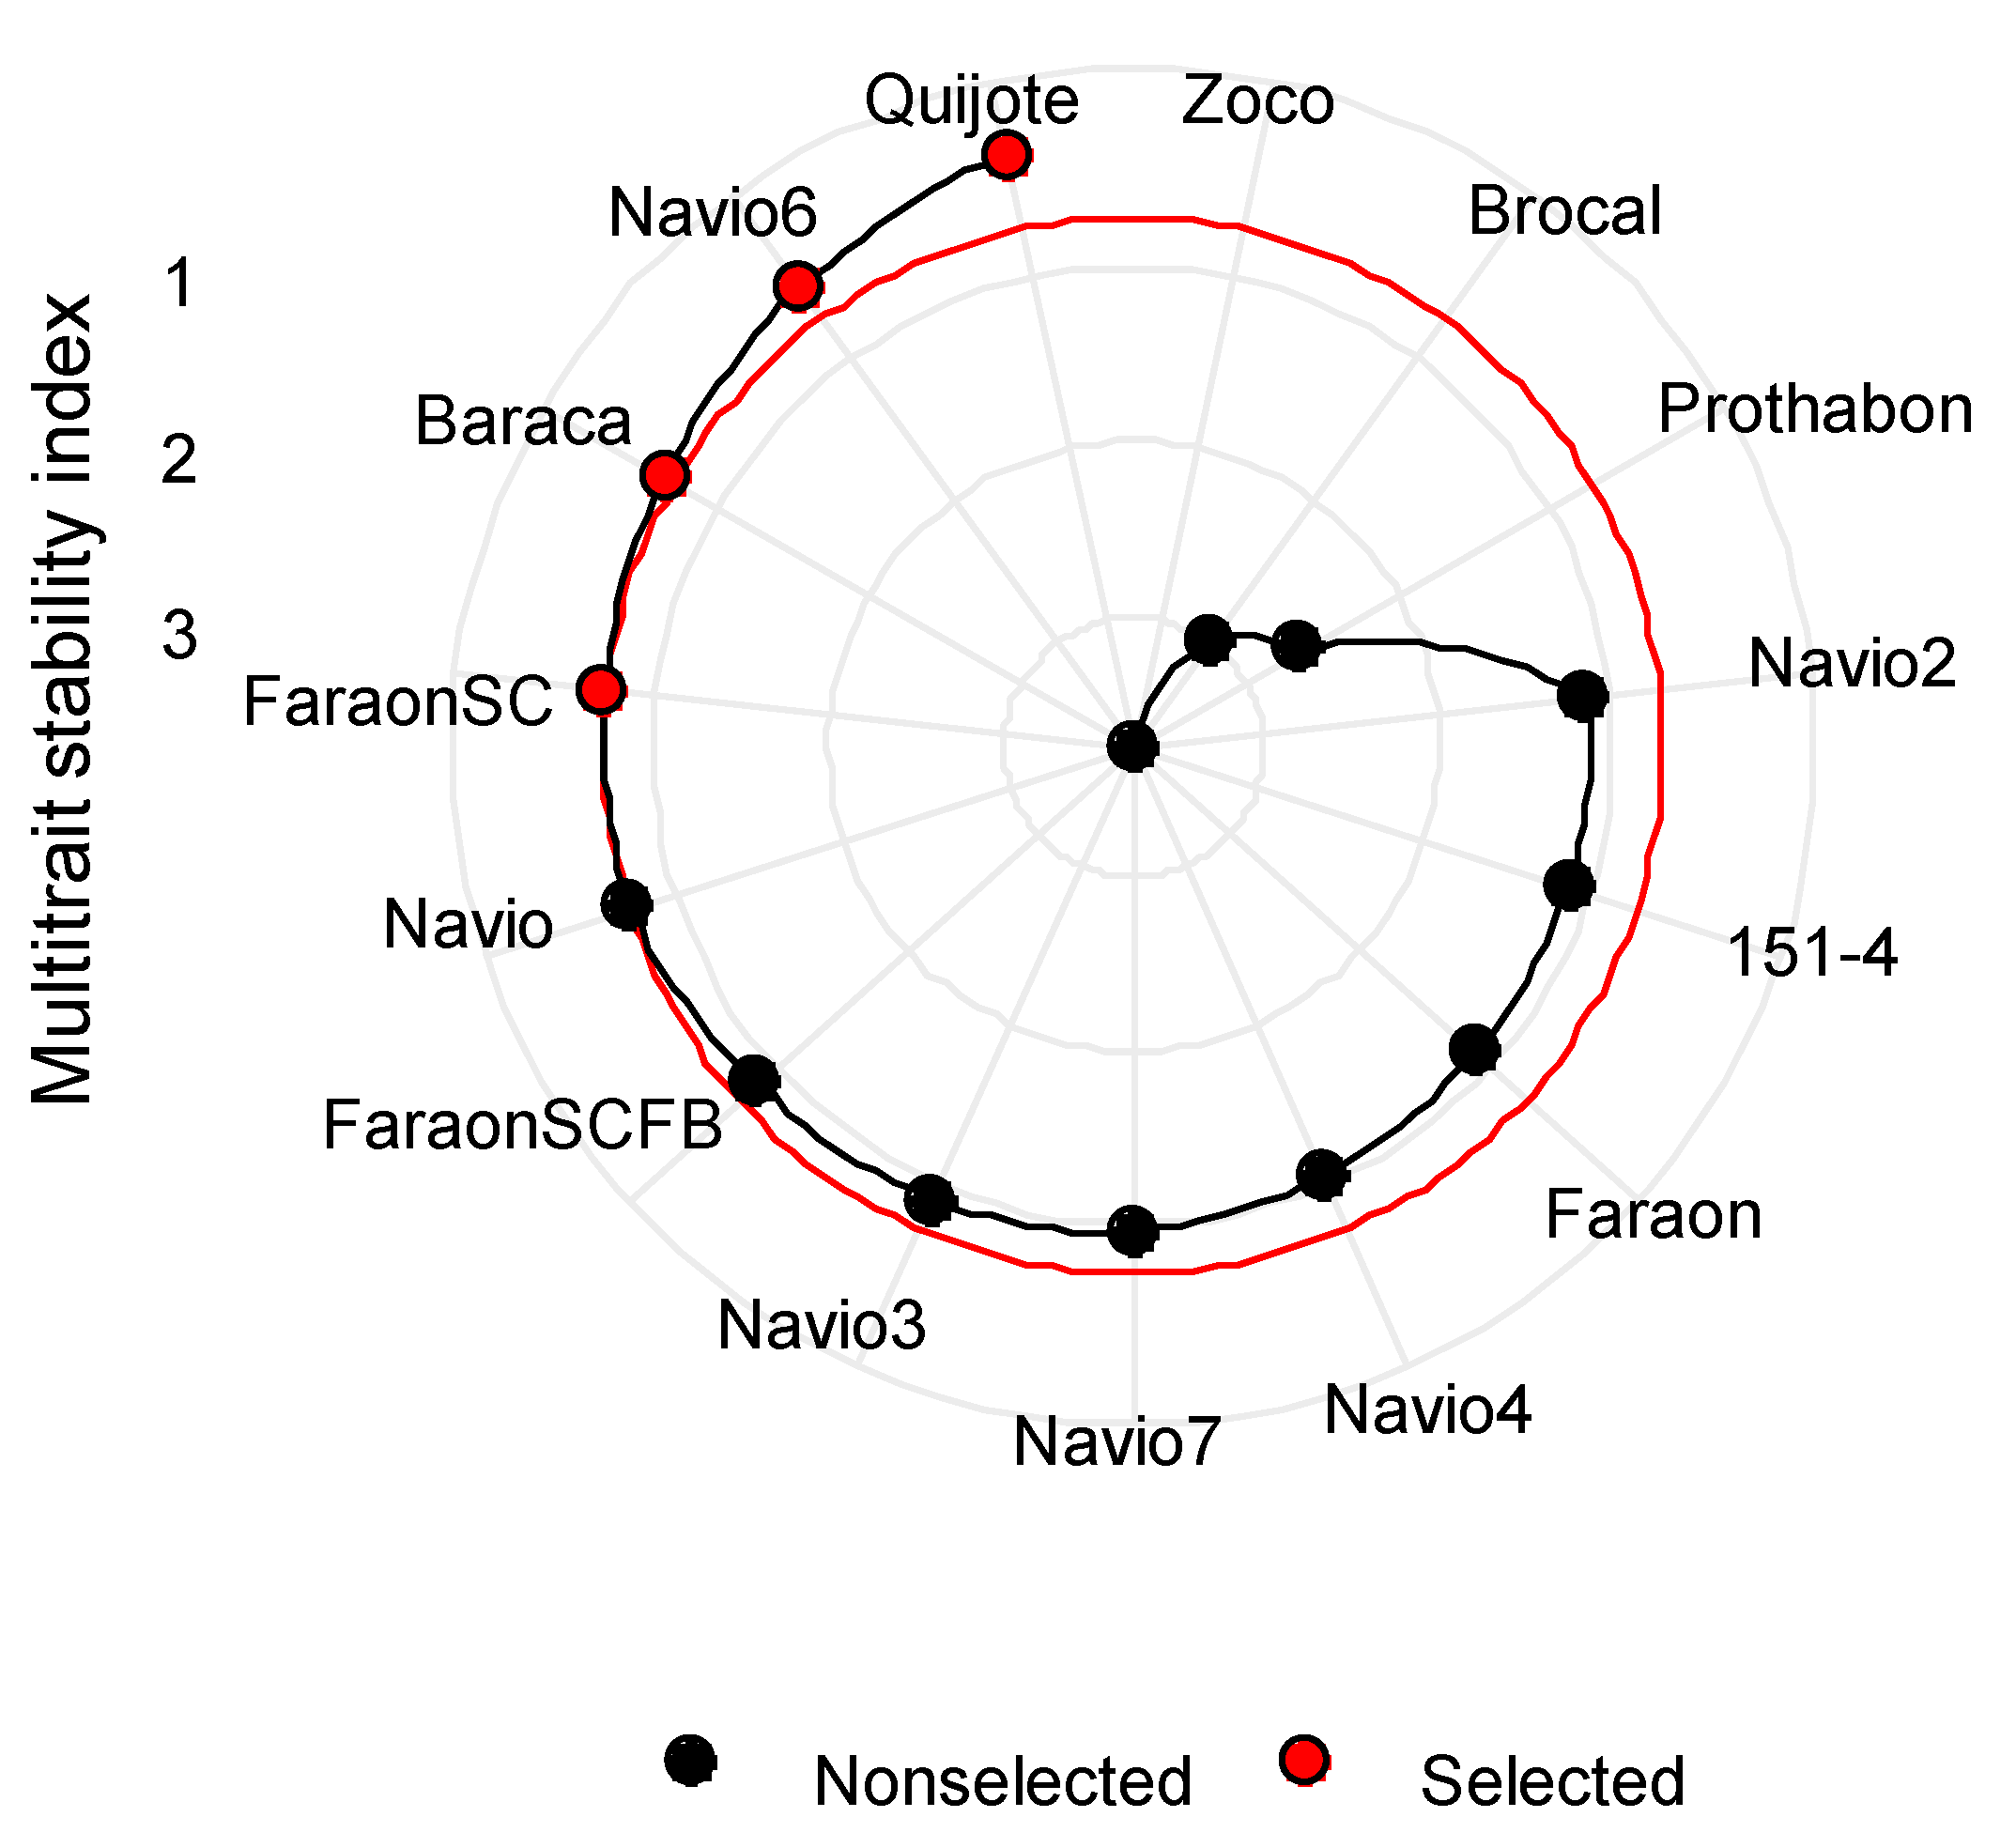
3.8. Multi-Trait Stability Index (MTSI)

The WAASBY index allowed for simultaneous selection for performance and stability. Since there is some difficulty in pre-assigning relative weights to the response and stability of each trait, 11 scenarios were carried out, starting from the first scenario with 50% for both response and stability and ending with 100% for response and 0% for stability (Figure 5). In view of Figure 5, we can see how, from a ratio of 70/30, the rankings of the selected genotypes (Quijote, Navio6, Baraca and FaraonSC) are maintained until the end of 100/0. An example is provided in Figure 6, assigning a 70/30 ratio (70% performance, 30% stability) for grain yield, and for broomrape infection. Multi-trait stability analysis was carried out, targeting high yield and low broomrape infection. Based on MTSI at 25% selection intensity, Quijote (0.4749), Navio6 (0.4805), Baraca (0.4944) and FaraonSC (0.5824) were the genotypes selected (Table S3, Supplementary Materials).
The values of WAASBY for each trait were grouped in one factor (FA1) (Table 6 and Table S4, Supplementary Materials). Following the example shown in Figure 6, the selection index of 25% was used to estimate the genetic parameters for grain yield and for broomrape infection (Table 6). For grain yield, the four selected accessions (XS) gave higher values than the original average (XO), which includes all of the accessions. These values were lower for the undesirable trait, broomrape infection. The magnitude of this increment is given by SD. The heritability (92%) and genetic gain (55%) were higher for broomrape infection than for grain yield (79% and 21%) revealing the feasibility of improving both of the traits, but with better chances for broomrape infection than for yield.
The WAASBY mean (86.71) of the selected accessions was higher than their grand mean (64.73) for grain yield. Conversely, WAASBY mean (23.50) was smaller than its grand mean (37.62) for broomrape infection. The selection differentials for the WAASBY index were 21.98 and −14.12, for grain yield and broomrape infection, respectively. The selection differentials for the WAASBY indices were 33.95 and −37.52% for grain yield and broomrape infection, respectively (Table S5, Supplementary Materials). In view of these results, Quijote, Navio6, Baraca and FaraonSC appear to be as the most desirable, showing the highest yields and lowest broomrape infection with an acceptable stability for both traits.

3.9. Mean Performance of Genotypes and Environments for Precocity

Data on precocity (days to flowering, dtf) were available for only three of the environments (Table 7), allowing for the ranking of the accessions into early (average < 115 dtf, including Faraon, Navio2, FaraonSC, FaraonSCFB, Navio3, Brocal, Baraca and Quijote), moderate (115 < dtf < 125, including Navio4, Navio6, Navio7, Navio and Prothabon) and late (dtf > 125, including only the major type, Zoco). A combined analysis of variance on days to flowering showed that the GEI effects were highly significant (p < 0.0001; data not shown)

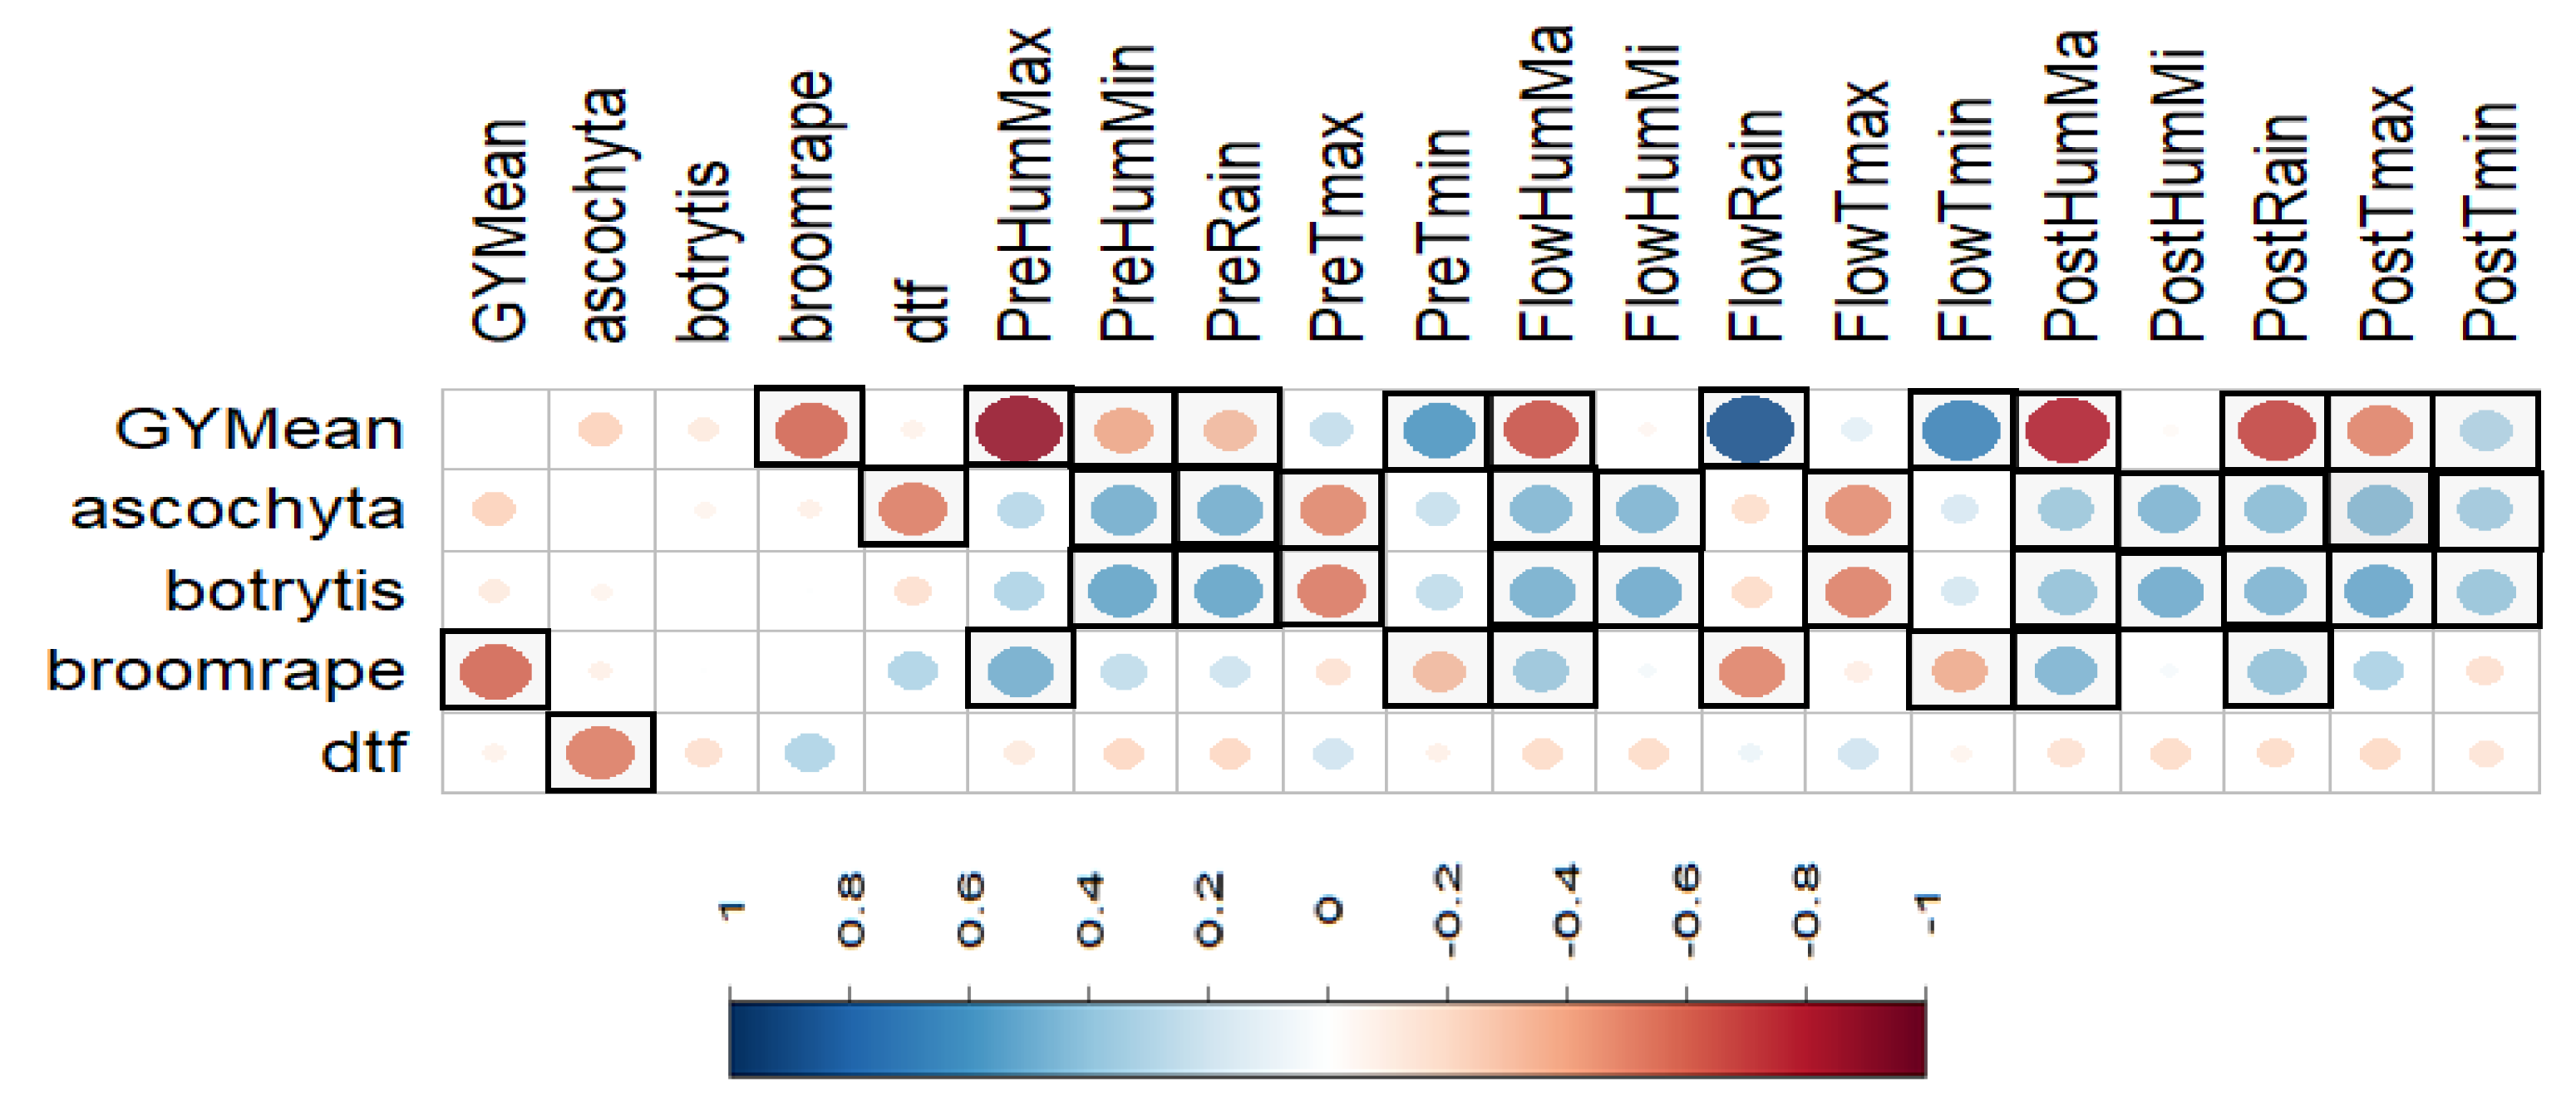
3.10. Correlations among Traits and Environmental Factors

Pearson’s correlation between the traits and climatic parameters (Figures S1 and S2, Supplementary Materials) showed that the grain yield was favored by moderate minimum temperatures at the pre-flowering and flowering stages (r = 0.43 *** and r = 0.51 ***, for PreTmin and FlowTmin, respectively), indicative of the negative effects of low temperatures at early stages. Similarly, high temperatures at flowering and post-flowering were detrimental (r = −0.27 ** and r = −0.37 ***, for FlowTmax and PostTmax, respectively). The grain yield was favored by rain at flowering (r = +0.41 ***) and negatively affected mainly by broomrape (r = −0.61 ***), followed by ascochyta blight (r = −0.23 *) infection, but appeared not to be affected by the low levels of chocolate spot infection (data not shown, Figure 7).
The ascochyta blight infection was favored by rain (r = +0.32 ** for PreRain and r = +0.29 ** for PostRain). The chocolate spot infection was favored by rain and by moderate temperatures at the vegetative stages and at flowering (r = +0.34 *** for PreRain, r = +0.58 *** for FlowRain, r = +0.43 *** for PreTmin, r = +0.42 *** for FlowTmin) and by moderate temperatures at the reproductive stage (r = −0.56 *** and r = −0.51 *** for FlowTmax and PostTmax).

4. Discussions

There is a long tradition of cultivation of the faba bean in the Mediterranean Basin, being a highly valued crop for food and feed, and providing numerous agronomic and environmental benefits [2,5,12]. However, although less marked than in other regions, the decline in faba beans’ cultivated area experienced since 1961 has made the majority of the Mediterranean countries net importers [48]. The major reasons for this decline are low productivity and yield instability. The decline in faba bean cultivation in southern Europe and northern Africa was more moderate than in other areas but is still insufficient to cover the demand, reinforcing the need to boost faba bean production by adjusting agronomic practices and developing more productive and adapted cultivars [13,49,50].
A peculiarity of the Mediterranean faba bean is that the “spring types” that do not require winter hardiness are typically sown in winter [1,2,13]. Such winter sowings allow the crop to profit from the winter rains and to escape the drought and heat in late spring. In fact, there is a growing concern about sensitivity to high temperature at the stages of grain filling and ripening [51], which can be avoided by early sowings. Still, even for the early sowings performed in our trials, damage due to high temperatures at the reproductive stage was noticed in the negative association of grain yield with maximum temperatures. Some sources of tolerance to heat have recently [52] been identified, together with associated genetic markers to make selections in early generations. Whilst waiting for heat-tolerant cultivars to be released, escaping the heat-effects by early sowing is the only method available for farmers, which also helps to avoid terminal drought [2,13]. Confirming this, a recent field study [14] showed how sowing later in winter under Mediterranean field conditions resulted in losses of yield and yield components, especially if heat and drought conditions were prevalent during growing seasons.
However, early sowings might have two major drawbacks that require attention. First, early sown faba beans could suffer from cold in some areas [53], needing winter hardiness. Although this was not considered to be a major issue in the Mediterranean basin where the winters used to be mild, the significant association between (higher) minimum temperatures, at the vegetative stage and at flowering, with grain yield indicates a yield penalty due to low temperatures, reinforcing the convenience of selecting cultivars that are more tolerant to low temperatures at those stages. Second, and most importantly in the region, early showings are known to be more prone to broomrape infection [54,55], that is a major constraint for legume cultivation in the Mediterranean basin [16,17,56]. Indeed, the most detrimental factor on yield was broomrape infection, with precocity and ascochyta blight and chocolate spot having little effect. The resistance to broomrape appears, therefore, as a top faba bean breeding priority for the region. The resistance must be complemented with other management strategies in a concerted manner [18,19]. Where there is a lack of resistance, the use of early maturing cultivars is recommended to escape broomrape infection [57,58]. In our study, precocity was recorded in only three of the environments, precluding us from drawing firm conclusions on an association between infection and precocity. However, as long as the accessions studied were preselected based on actual levels of resistance accumulated by breeding, we can see resistant accessions mixed with susceptible ones in the whole range of precocity covered by minor types (from 104 to 124 dtf), with the resistant accessions Navio and 151-4 being as late as Prothabon, showing the success of resistance breeding. Having a range of broomrape-resistant accessions covering different precocities allows farmers to select the ones that adjust better to their conditions.
In spite of the reported limited availability of sources of resistance against broomrape and its complex inheritance [59,60,61], classical breeding has succeeded in accumulating valuable levels of resistance in a number of cultivars made available to farmers [20,21,38,39,40,62,63]. Most of these resistant cultivars were developed in programs using the Egyptian line F402, widely deployed by the International Centre of Agricultural Research in the Dry Areas (ICARDA) in their multilocation resistance screenings. F402 is, in fact, in the pedigree of Baraca, Quijote, Faraon and Navio-derived accessions. Quijote and Navio [36,37], and the related Najeh [64], display a distinct resistance type, based on no-induction of broomrape seed germination, associated with a low root exudation of strigolactones, also being operative against other broomrape species, such as O. foetida and O. aegyptiaca. This mechanism was not observed in Baraca or Faraon [19,41,65]. The improved performance of the faba bean accessions selected by breeding might be, in fact, the result of a combination of escape factors, alone or combined with resistance mechanisms acting at different levels of the infection process, or with tolerance to damage, each component with a different genetic control, still little understood [66]. The result might be intermediate responses [62,63] needing field validation studies, such as the one presented here.
We conclude that there is a high potential for faba bean cultivation in the Mediterranean rain-fed farming systems, reinforcing the value of adopting broomrape-resistant cultivars. Quijote, Navio6, Baraca and FaraonSC showed the highest superiority index, with a grain yield greater than the grand mean, and can be deployed as parents in breeding for a higher yield and wider adaptability. The selection differential for mean performance was positive for grain yield and negative for broomrape infection, showing the effectiveness of the selection intensity. The selection differential for WAASBY was positive for both traits, showing the efficiency of MTSI in selecting genotypes based on mean performance and stability of grain yield and broomrape infection.

Supplementary Materials

The following supporting information can be downloaded at: https://www.mdpi.com/article/10.3390/agronomy12061421/s1. Table S1: Response to Ascochyta bligh (Disease Severity, %) of the studied faba bean lines in the various environments. Table S2: Response to chocolate spot (Disease Severity, %) of the studied faba bean lines in the various environments. Table S3: Multitrait stability index. Table S4: Scores factor analysis for genotypes-ideotypes. Table S5: Selection differentials for the WAASBY scores of the traits. Estimates of the original mean (XO), mean of the selected genotypes (XS), selection differential (SD) and percent of selection differential (SD%) based on 15 faba bean genotypes in six environments. Figure S1: Rainfall, air temperature (Tmin and Tmax), and solar radiation distribution during the three experimental years at Córdoba. Figure S2: Rainfall, air temperature (Tmin and Tmax), and solar radiation distribution during the three experimental years at Escacena.

Author Contributions

D.R. and A.M. performed the experiments; F.F. analyzed the data; D.R. and F.F. wrote the manuscript. All authors have read and agreed to the published version of the manuscript.

Funding

This research was funded by the Grupo Operativo Supra-autonómico INPULSE (O00000226e2000044341), Programa Nacional de Desarrollo Rural, co-financed by FEADER and DGDRIFA.

Data Availability Statement

Not needed, data provided in supplementary files.

Conflicts of Interest

The authors declare no conflict of interest.

References

  1. Flores, F.; Nadal, S.; Solis, I.; Winkler, J.; Sass, O.; Stoddard, F.L.; Link, W.; Raffiot, B.; Muel, F.; Rubiales, D. Faba bean adaptation to autumn sowing under European climates. Agron. Sustain. Dev. 2012, 32, 727–734. [Google Scholar] [CrossRef] [Green Version]
  2. Mínguez, I.; Rubiales, D. Faba bean. In Crop Physiology: Case Histories for Major Crops; Sadras, V.O., Calderini, D.F., Eds.; Academic Press: Cambridge, MA, USA, 2020; pp. 453–482. ISBN 978-0-12-819194-1. [Google Scholar] [CrossRef]
  3. Duc, G.; Aleksić, J.M.; Marget, P.; Mikic, A.; Paull, J.; Redden, R.J.; Sass, O.; Stoddard, F.L.; Vandenberg, A.; Vishnyakova, M.; et al. Faba Bean. In Grain Legumes. Handbook of Plant Breeding; De Ron, A., Ed.; Springer: New York, NY, USA, 2015; Volume 10. [Google Scholar] [CrossRef]
  4. Bodner, G.; Kronberga, A.; Lepse, L.; Olle, M.; Vågen, I.M.; Rabante, L.; Fernández, J.A.; Ntatsi, G.; Balliu, A.; Rewald, B. Trait identification of faba bean ideotypes for Northern European environments. Eur. J. Agron. 2018, 96, 1–12. [Google Scholar] [CrossRef]
  5. Zong, X.; Yang, T.; Liu, R. Faba bean (Vicia faba L.) breeding. In Advances in Plant Breeding Strategies: Legumes; Al-Khayri, J., Jain, S., Johnson, D., Eds.; Springer: Cham, Switzerland, 2019. [Google Scholar] [CrossRef]
  6. Flores, F.; Hybl, M.; Knudsen, J.C.; Marget, P.; Muel, F.; Nadal, S.; Narits, L.; Raffiot, B.; Sass, O.; Solis, I.; et al. Adaptation of spring faba bean types across European climates. Field Crops Res. 2013, 145, 1–9. [Google Scholar] [CrossRef] [Green Version]
  7. Link, W.; Balko, C.; Stoddard, F.L. Winter hardiness in faba bean: Physiology and breeding. Field Crops Res. 2010, 115, 287–296. [Google Scholar] [CrossRef]
  8. Gharzeddin, K.; Maalouf, F.; Khoury, B.; Abou-Khater, L.; Christmann, S.; El-Dine, N.A.J. Efficiency of different breeding strategies in improving the faba bean productivity for sustainable agriculture. Euphytica 2019, 215, 203. [Google Scholar] [CrossRef]
  9. Papastylianou, P.; Vlachostergios, D.N.; Dordas, C.; Tigka, E.; Papakaloudis, P.; Kargiotidou, A.; Pratsinakis, E.; Koskosidis, A.; Pankou, C.; Kousta, A.; et al. Genotype X Environment Interaction Analysis of Faba Bean (Vicia faba L.) for Biomass and Seed Yield across Different Environments. Sustainability 2021, 13, 2586. [Google Scholar] [CrossRef]
  10. Annicchiarico, P.; Iannucci, A. Breeding strategy for faba bean in southern Europe based on cultivar responses across climatically contrasting environments. Crop Sci. 2008, 48, 983–991. [Google Scholar] [CrossRef]
  11. Skovbjerg, C.K.; Knudsen, J.N.; Füchtbauer, W.; Stougaard, J.; Stoddard, F.L.; Janss, L.; Andersen, S.U. Evaluation of yield, yield stability, and yield–protein relationship in 17 commercial faba bean cultivars. Legum. Sci. 2020, 2, 39. [Google Scholar] [CrossRef]
  12. Ruisi, P.; Amato, G.; Badagliacca, G.; Frenda, A.S.; Giambalvo, D.; Di Micel, G. Agro-ecological benefits of faba bean for rainfed Mediterranean cropping systems. Ital. J. Agron. 2017, 12, 865. [Google Scholar] [CrossRef] [Green Version]
  13. Abou-Khater, L.; Maalouf, F.; Rubiales, D. Status of faba bean (Vicia faba L.) in the Mediterranean and East African countries. In Developing Climate-Resilient Food and Fodder Legumes; Jha, U.C., Nayyar, H., Kumar, S., Siddique, K., Eds.; Springer: Singapore, 2022. [Google Scholar] [CrossRef]
  14. Sellami, M.H.; Lavini, A.; Calandrelli, D.; De Mastro, G.; Pulvento, C. Evaluation of Genotype, Environment, and Management Interactions on Fava Beans under Mediterranean Field Conditions. Agronomy 2021, 11, 1088. [Google Scholar] [CrossRef]
  15. Stoddard, F.L.; Nicholas, A.H.; Rubiales, D.; Thomas, J.; Villegas, A.M. Integrated pest management in faba bean. Field Crops Res. 2010, 115, 308–318. [Google Scholar] [CrossRef] [Green Version]
  16. Rubiales, D.; Fernández-Aparicio, M. Innovations in parasitic weeds management in legume crops. A review. Agron. Sustain. Dev. 2012, 32, 433–449. [Google Scholar] [CrossRef]
  17. Fernández-Aparicio, M.; Flores, F.; Rubiales, D. The effect of Orobanche crenata infection severity in faba bean, field pea and grass pea productivity. Front. Plant Sci. 2016, 7, 1409. [Google Scholar] [CrossRef] [Green Version]
  18. Rubiales, D.; Fernández-Aparicio, M.; Wegmann, K.; Joel, D.M. Revisiting strategies for reducing the seedbank of Orobanche and Phelipanche spp. Weed Res. 2009, 49, 23–33. [Google Scholar] [CrossRef]
  19. Pérez-de-Luque, A.; Eizenberg, H.; Grenz, J.H.; Sillero, J.C.; Ávila, C.M.; Sauerborn, J.; Rubiales, D. Broomrape management in faba bean. Field Crops Res. 2010, 115, 319–328. [Google Scholar] [CrossRef]
  20. Sillero, J.C.; Villegas-Fernández, A.m.; Thomas, J.; RojasMolina, M.M.; Emeran, A.A.; Fernández-Aparicio, M.; Rubiales, D. Faba bean breeding for disease resistance. Field Crops Res. 2010, 115, 297–307. [Google Scholar] [CrossRef] [Green Version]
  21. Rubiales, D.; Khazaei, H. Advances in disease and pest resistance in faba bean. Theor. Appl. Genet. 2022, on line first. [Google Scholar] [CrossRef]
  22. Yan, W.; Tinker, N.A. Biplot analysis of multienvironment trial data: Principles and applications. Can. J. Plant Sci. 2006, 86, 623–645. [Google Scholar] [CrossRef] [Green Version]
  23. Stroup, W.W.; Mulitze, D.K. Nearest neighbour adjusted best linear unbiased prediction. Am. Stat. 1991, 45, 194–200. [Google Scholar]
  24. Piepho, H.P.; Möhring, J.; Melchinger, A.E.; Büchse, A. BLUP for phenotypic selection in plant breeding and variety testing. Euphytica 2008, 161, 209–228. [Google Scholar] [CrossRef]
  25. Piepho, H.P. Best Linear Unbiased Prediction (BLUP) for regional yield trials: A comparison to additive main effects and multiplicative interaction (AMMI) analysis. Theor. Appl. Genet. 1994, 89, 647–654. [Google Scholar] [CrossRef]
  26. Flores, F.; Moreno, M.T.; Cubero, J.I. A comparison of univariate and multivariate methods to analyze G × E interaction. Field Crops Res. 1998, 56, 271–286. [Google Scholar] [CrossRef]
  27. Elias, A.A.; Robbins, K.R.; Doerge, R.W.; Tuinstra, M.R. Half a century of studying genotype × environment interactions in plant breeding experiments. Crop Sci. 2016, 56, 2090–2105. [Google Scholar] [CrossRef]
  28. Zobel, R.W.; Wright, M.J.; Gauch, H.G. Statistical analysis of a yield trial. Agron. J. 1988, 80, 388–393. [Google Scholar] [CrossRef]
  29. Yan, W.; Hunt, L.A.; Sheng, Q.; Szlavnics, Z. Cultivar evaluation and mega-environment investigation based on the GGE biplot. Crop Sci. 2000, 40, 597–605. [Google Scholar] [CrossRef]
  30. Yang, R.C.; Crossa, J.; Cornelius, P.L.; Burgueño, J. Biplot analysis of genotype × environment interaction: Proceed with caution. Crop Sci. 2009, 49, 1564–1576. [Google Scholar] [CrossRef] [Green Version]
  31. Olivoto, T. Índices de Estabilidade Genotípica e Seleção Simultânea Multivariada: Uma Nova Abordagem. Ph.D. Thesis, Universidade Federal de Santa Maria, Santa Maria, Brazil, 2019. [Google Scholar] [CrossRef]
  32. Olivoto, T.; Lúcio, A.D.C.; da Silva, J.A.G.; Marchioro, V.S.; de Souza, V.Q.; Jost, E. Mean Performance and Stability in Multi-Environment Trials I: Combining Features of AMMI and BLUP Techniques. Agron. J. 2019, 111, 2949–2960. [Google Scholar] [CrossRef]
  33. Smith, A.B.; Cullis, B.R.; Thompson, R. The analysis of crop cultivar breeding and evaluation trials: An overview of current mixed model approaches. J. Agric. Sci. 2005, 143, 449–462. [Google Scholar] [CrossRef] [Green Version]
  34. Olivoto, T.; Lúcio, A.D.C. Metan: An R package for multienvironment trial analysis. Methods Ecol. Evol. 2020, 11, 783–789. [Google Scholar] [CrossRef]
  35. Nadal, S.; Moreno, M.T.; Cubero, J.I. Registration of ‘Baraca” faba bean. Crop Sci. 2004, 44, 1864–1865. [Google Scholar] [CrossRef]
  36. Fernández-Aparicio, M.; Moral, A.; Kharrat, M.; Rubiales, D. Resistance against broomrapes (Orobanche and Phelipanche spp.) in faba bean (Vicia faba) based in low induction of broomrape seed germination. Euphytica 2012, 186, 897–905. [Google Scholar] [CrossRef]
  37. Fernández-Aparicio, M.; Kisugi, T.; Xie, X.; Rubiales, D.; Yoneyama, K. Low strigolactone root exudation: A novel mechanism of broomrape (Orobanche and Phelipanche spp.) resistance available for faba bean breeding. J. Agric. Food Chem. 2014, 62, 7063–7071. [Google Scholar] [CrossRef] [PubMed]
  38. Kharrat, M.; Abbes, Z.; Amri, M. A new faba bean small seeded variety Najeh tolerant to orobanche registered in the Tunisian catalogue. Tunis. J. Plant Prot. 2010, 5, 125–130. [Google Scholar]
  39. Amri, M.; Trabelsi, I.; Abbes, Z.; Kharrat, M. Release of a new faba bean variety “Chourouk” resistant to the parasitic plants Orobanche foetida and O. crenata in Tunisia. Int. J. Agric. Biol. 2019, 21, 499–505. [Google Scholar]
  40. Ghalwash, A.M.; Soliman, I.E.; Khaffagy Azza, E. Performance of some faba bean (Vicia faba, L.) cultivars under numerous broomrape (Orobanche crenata Forsk.) control treatments. J. Agric. Sci. Mansoura Univ. 2008, 33, 2439–2448. [Google Scholar] [CrossRef]
  41. Rubiales, D.; Sillero, J.C.; Rojas-Molina, M.M. Characterization resistance mechanisms in faba bean (Vicia faba) against broomrape species (Orobanche and Phelipanche spp.). Front. Plant Sci. 2016, 7, 1747. [Google Scholar] [CrossRef] [PubMed] [Green Version]
  42. Villegas-Fernández, A.M.; Sillero, J.C.; Emeran, A.A.; Winkler, J.; Raffiot, B.; Tay, J.; Flores, F.; Rubiales, D. Identification and multi-environment validation of resistance to Botrytis fabae in Vicia faba. Field Crops Res. 2009, 114, 84–90. [Google Scholar] [CrossRef]
  43. Rubiales, D.; Avila, C.M.; Sillero, J.C.; Hybl, M.; Narits, L.; Sass, O.; Flores, F. Identification and multi-environment validation of resistance to Ascochyta fabae in faba bean (Vicia faba). Field Crops Res. 2012, 126, 165–170. [Google Scholar] [CrossRef] [Green Version]
  44. Red de Información Agroclimática de Andalucía (RIA). Available online: https://www.juntadeandalucia.es/agriculturaypesca/ifapa/riaweb/web/ (accessed on 2 March 2022).
  45. Hammer, Ø.; Harper, D.A.T.; Ryan, P.D. PAST: Paleontological statistics software package for education and data analysis. Palaeontol. Electron. 2001, 4, 1–9. [Google Scholar]
  46. RAEA. Resultados de Ensayos de Variedades de Habas en Andalucía, Campaña 2014/2015. 2015. Available online: https://www.juntadeandalucia.es/agriculturaypesca/ifapa/servifapa/registro-servifapa/37d4d136-e654-4e4c-a587-dea7ad944cba (accessed on 17 March 2022).
  47. RAEA. Resultados de Ensayos de Variedades de Habas en Andalucía, Campaña 2015/2016. 2016. Available online: https://www.juntadeandalucia.es/agriculturaypesca/ifapa/servifapa/registro-servifapa/8e98eefe-86e6-4b49-b8e5-bbf136756810 (accessed on 17 March 2022).
  48. FAOSTAT. 2021. Available online: https://www.fao.org/faostat (accessed on 3 May 2022).
  49. Cernay, C.; Ben-Ari, T.; Pelzer, E.; Meynard, J.M.; Makoswki, D. Estimating variability in grain legume yields across Europe and the Americas. Sci. Rep. 2015, 5, 11171. [Google Scholar] [CrossRef]
  50. Villegas-Fernández, A.M.; Rubiales, D. Trends and perspectives for faba bean production in the Mediterranean Basin. Legum. Perspect. 2015, 10, 31–32. [Google Scholar]
  51. Bishop, J.; Potts, S.G.; Jones, H.E. Susceptibility of Faba Bean (Vicia faba L.) to Heat Stress During Floral Development and Anthesis. J. Agron. Crop Sci. 2016, 202, 508–517. [Google Scholar] [CrossRef] [PubMed] [Green Version]
  52. Maalouf, F.; Abou-Khater, L.; Babiker, Z.; Jighly, A.; Alsamman, A.M.; Hu, J.; Ma, Y.; Rispail, N.; Balech, R.; Hamweih, A.; et al. Genetic Dissection of Heat Stress Tolerance in Faba Bean (Vicia faba L.) Using GWAS. Plants 2022, 11, 1108. [Google Scholar] [CrossRef] [PubMed]
  53. Alharbi, N.H.; Alghamdi, S.S.; Migdadi, H.M.; El-Harty, E.H.; Adhikari, K.N. Evaluation of Frost Damage and Pod Set in Faba Bean (Vicia faba L.) under Field Conditions. Plants 2021, 10, 1925. [Google Scholar] [CrossRef]
  54. Pérez-de-Luque, A.; Sillero, J.C.; Moral, A.; Cubero, J.I.; Rubiales, D. Effect of sowing date and host resistance on the establishment and development of Orobanche crenata in faba bean and common vetch. Weed Res. 2004, 44, 282–288. [Google Scholar] [CrossRef]
  55. Rubiales, D.; Alcántara, C.; Pérez-de-Luque, A.; Gil, J.; Sillero, J.C. Infection of chickpea (Cicer arietinum) by crenate broomrape (Orobanche crenata) as influenced by sowing date and weather conditions. Agronomie 2003, 23, 359–362. [Google Scholar] [CrossRef]
  56. Rubiales, D.; Pérez-de-Luque, A.; Fernández-Aparicio, M.; Sillero, J.C.; Román, B.; Kharrat, M.; Khalil, S.; Joel, D.M.; Riches, C. Screening techniques and sources of resistance against parasitic weeds in grain legumes. Euphytica 2006, 147, 187–199. [Google Scholar] [CrossRef]
  57. Fernández-Aparicio, M.; Flores, F.; Rubiales, D. Escape and true resistance to crenate broomrape (Orobanche crenata Forsk.) in grass pea (Lathyrus sativus L.) germplasm. Field Crops Res. 2012, 125, 92–97. [Google Scholar] [CrossRef]
  58. Rubiales, D.; Moreno, M.T.; Sillero, J.C. Search for resistance to crenate broomrape (Orobanche crenata Forsk.) in pea germplasm. Gen. Res. Crop Evol. 2005, 52, 853–861. [Google Scholar] [CrossRef]
  59. Abd El-Fatah, B.E.S.; Nassef, D.M.T. Inheritance of faba bean resistance to broomrape, genetic diversity and QTL mapping analysis. Mol. Biol. Rep. 2020, 47, 11–32. [Google Scholar] [CrossRef]
  60. Gutiérrez, N.; Palomino, C.; Satovic, Z.; Ruiz-Rodríguez, M.D.; Vitale, S.; Gutiérrez, M.V.; Rubiales, D.; Kharrat, M.; Amri, M.; Emeran, A.A.; et al. QTLs for Orobanche spp. resistance in faba bean: Identification and validation across different environments. Mol. Breed. 2013, 32, 909–992. [Google Scholar] [CrossRef]
  61. Román, B.; Torres, A.M.; Rubiales, D.; Cubero, J.I.; Satovic, Z. Mapping of quantitative trait loci controlling broomrape (Orobanche crenata Forsk.) resistance in faba bean (Vicia faba L.). Genome 2002, 45, 1057–1063. [Google Scholar] [CrossRef]
  62. Maalouf, F.; Khalil, S.; Ahmed, S.; Akintunde, A.N.; Kharrat, M.; El Shama’a, K.; Hajjar, S.; Malhotra, R.S. Yield stability of faba bean lines under diverse broomrape prone production environments. Field Crops Res. 2011, 124, 288–294. [Google Scholar] [CrossRef]
  63. Rubiales, D.; Flores, F.; Emeran, A.A.; Kharrat, M.; Amri, M.; Rojas-Molina, M.M.; Sillero, J.C. Identification and multi-environment validation of resistance against broomrapes (Orobanche crenata and O. foetida) in faba bean (Vicia faba). Field Crops Res. 2014, 166, 58–65. [Google Scholar] [CrossRef] [Green Version]
  64. Trabelsi, I.; Yoneyama, K.; Abbes, A.; Amri, M.; Xie, X.; Kisugi, T.; Kim, H.I.; Kharrat, M.; Yoneyama, K. Characterization of strigolactones produced by Orobanche foetida and Orobanche crenata resistant faba bean (Vicia faba L.) genotypes and effects of phosphorous, nitrogen, and potassium deficiencies on strigolactone production. S. Afr. J. Bot. 2017, 108, 15–22. [Google Scholar] [CrossRef]
  65. Pérez-de-Luque, A.; Lozano, M.D.; Moreno, M.T.; Testillano, P.S.; Rubiales, D. Resistance to broomrape (Orobanche crenata) in faba bean (Vicia faba): Cell wall changes associated with pre-haustorial defensive mechanisms. Ann. Appl. Biol. 2007, 151, 89–98. [Google Scholar] [CrossRef]
  66. Rubiales, D. Can we breed for durable resistance to broomrapes? Phytopathol. Mediterr. 2018, 57, 170–185. [Google Scholar]
Figure 1. Biplot of grain yield vs. weighted average of absolute scores for the best linear unbiased predictions of the GEI (WAASB) of 15 faba bean genotypes tested in six environments. Horizontal understand black arrows indicate the direction of the increase in grain yield; vertical arrows indicate increase of stability.
Agronomy 12 01421 g001
Figure 2. Heatmap showing the rank of 15 faba bean accessions assigning different weights for stability and yield, from 100/0 (stability only) to 0/100 (grain yield only). Four clusters of accessions are shown on the left side of heat map (names in different color) according to stability and productivity.
Agronomy 12 01421 g002
Figure 3. Biplot of the number of broomrape per plant vs. WAASB of 15 faba bean accessions studied in six environments. Horizontal and vertical black arrows indicate the direction of the increase in the number of broomrape per plant and stability, respectively.
Agronomy 12 01421 g003
Figure 4. Heatmap showing the rank of 15 faba bean accessions considering different weights for stability and intensity of broomrape infection. Four clusters are shown on the left side of heat map to identify grouping accessions with similar stability and intensity of broomrape infection.
Agronomy 12 01421 g004
Figure 5. Heatmap showing the first five of the MTSI index rank of 15 faba bean genotypes considering different weights for stability and both the GY and number of broomrape per plant.
Agronomy 12 01421 g005
Figure 6. Selected accessions using MTSI for grain yield, and broomrape infection assigning a selection intensity of 25%.
Agronomy 12 01421 g006
Figure 7. Graphical representation of the effects of climatic parameters and of disease incidence on grain yield, and among them. Size of the dot indicates its effect on the trait, blue when positive, red when negative. The statistically significant ones are highlighted.
Agronomy 12 01421 g007
Table 1. Faba bean accessions included in the study.
AccessionsReported Broomrape ResponseOrigin/Derived from Accession No.Reference
BaracaResistantMinor type, broomrape-resistant cultivar released in Spain, derived from Alameda × VF1071 (derived from F402)[35]
151-4ResistantMinor type, derived from Baraca × VF1273, sister line of cv. Omeya[21]
QuijoteResistantMinor type, selection made at Córdoba from Tunisian XBJ90.04-6-2-1-1, itself derived from Sel88Lat.18035xPOL27-3[36,37]
NavioResistantMinor type, selection made at Córdoba from Tunisian XBJ90.03-16-1-1-1, sister line of cv. Najeh released in Tunisia[36,37,38,39]
Navio2ResistantMinor type, selection made at Córdoba from Navio
Navio3ResistantMinor type, selection made at Córdoba from Navio (light seed cuticle, normal color flowers)
Navio4ResistantMinor type, selection made at Córdoba from Navio (brown seed cuticle, normal color flowers)
Navio6ResistantMinor type, selection made at Córdoba from Navio (brown seed cuticle, normal color flowers)
Navio7ResistantMinor type, selection made at Córdoba from Navio (brown seed cuticle, normal color flowers)
FaraonResistantMinor type, selection made at Córdoba from Misr-1 (brown seed cuticle, normal color flowers)[40]
FaraonSCResistantMinor type, selection made at Córdoba from Misr-1 (light seed cuticle, normal color flowers)
FaraonSCFBResistantMinor type, further selection made at Córdoba from FaraonSC, with white flower
BrocalSusceptibleMinor type, commercial cultivar
ProthabonSusceptibleMinor type, commercial cultivar[41]
ZocoSusceptibleMajor type, light cuticle, gourmet market class
Table 2. Description of the environments of the trials for the multi-environment study.
EnvironmentSeasonSiteSoil TypeSoil pHAverage
Tmax (°C)
Average
Tmin (°C)
Rain
(mm)
Supplementary Irrigation (mm) at Flowering
Cor-112010–2011CórdobaCambisol6.5–719.88.65140
Cor-122011–2012CórdobaCambisol6.5–720.85.614580
Cor-132012–2013CórdobaCambisol6.5–718.37.54970
Esc-112010–2011EscacenaFluvisol7–7.519.29.95340
Esc-122011–2012EscacenaFluvisol7–7.520.48.81340
Esc-132012–2013EscacenaFluvisol7–7.518.28.74720
Table 3. Grain yield (kg/ha) of 15 faba bean accessions grown at six location–year environments.
AccessionsCord11Cord12Cord13Esc11Esc12Esc13Average over EnvironmentsSE *
Quijote2300158240153593302026262856233
Navio6207142335073758377820602599356
Baraca169387839422502347322692460289
FaraonSC104763339492851318022272315310
Navio346715134312771475620842277422
Navio720049332403120396722382210358
Navio133834627752882392419492203329
Navio4100940333201433407822842088344
151-4109065539802269200720822014275
Faraon44418639981329381122312000386
FaraonSCFB28215332872760280025401970329
Navio216017137551727406914821894388
Brocal221821556326039895671613373
Prothabon309801527194228369531275248
Zoco15951874676971250497103
Mean85341931442458337718562018
SE11369165141192144345
* SE = standard error.
Table 4. Pooled ANOVA and estimated variance components of grain yield (kg/ha) and broomrape infection (Oc/plant) in field trials, consisting of 15 genotypes (G) grown in six environments (E).
TraitRandom EffectsEstimateStandard ErrorPr > Chisq% of Total Variance Explained by
Grain yield
(kg/ha)
E1,405,583921,411<0.000159
Block(E)74,68640,140<0.00013
G254,266121,579<0.000111
GEI279,43468,173<0.000112
Residual350,35238,180<0.000115
Broomrape infection
(Oc/plant)
E0.48790.3275<0.000120
Block(E)0 0
G0.91730.3752<0.000138
GEI0.15510.08200.02876
Residual0.88240.0930<0.000136
Table 5. Broomrape infection (Oc/plant) of 15 faba bean accessions grown at the studied environments.
AccessionsCord11Cord12Cord13Esc11Esc12Esc13MeanSE
Quijote0.510.510.010.010.000.320.230.07
Faraon0.240.350.040.000.000.900.260.09
151-40.610.620.470.000.000.720.400.08
Baraca0.240.890.580.000.000.730.410.12
FaraonSCFB0.290.810.150.000.001.240.420.12
Navio60.590.810.390.000.001.050.470.12
FaraonSC1.160.870.450.020.000.960.580.13
Navio41.301.320.490.040.000.770.650.15
Navio0.891.180.540.020.001.360.670.14
Navio31.511.610.730.090.001.230.860.19
Navio21.381.910.610.070.001.670.940.23
Navio72.291.540.180.060.001.810.980.24
Brocal4.883.673.260.660.314.002.790.58
Zoco4.134.944.010.730.293.172.880.53
Prothabon4.125.753.271.231.652.373.060.56
Mean1.611.791.010.190.151.491.04
SE0.230.320.200.050.090.220.54
Table 6. Estimates of the original mean (XO); mean of the selected accessions (XS); selection differential (SD); the broad heritability (h2) and selection genetic gains (SG%), based on MTSI for the 15 faba bean accessions tested in six environments.
TraitFactorXOXSSDh2SG (%)
Grain yieldFA1201825575390.7921.23
Broomrape infectionFA11.040.42−0.620.9255.00
Table 7. Mean days to flowering of 15 faba bean accessions tested at three location–year environments.
AccessionsCord11Cord12Esc12MeanSE
Faraon971101121062.6
Navio21001061121061.7
FaraonSC971181121093.3
FaraonSCFB1021151121092.3
Navio31001151121092.3
Brocal1101151121122.0
Baraca1001251121125.7
Quijote1071171171142.2
Navio41201171151171.8
Navio61221171151181.5
Navio71221171171191.3
Navio1221171251211.4
Prothabon1261171271231.7
151-41291201221242.1
Zoco1451381441421.5
Mean113118118116
SE2.21.41.41.0
Publisher’s Note: MDPI stays neutral with regard to jurisdictional claims in published maps and institutional affiliations.

