Article

At-ore1 Gene Induces Distinct Novel H2O2-NACs Signaling in Regulating the Leaf Senescence in Soybeans (Glycine max L.)

1
Center of Crop Research for Adaptation to Climate Change, Thai Nguyen University of Agriculture and Forestry, Quyet Thang, Thai Nguyen 24119, Vietnam
2
Department of Biotechnology and Food Technology, Thai Nguyen University of Agriculture and Forestry, Quyet Thang, Thai Nguyen 24119, Vietnam
3
Ministry of Science and Technology, 113 Tran Duy Hung, Ha Noi 10000, Vietnam
4
Agricultural Genetic Institute, Km#2 Pham Van Dong, Ha Noi 10000, Vietnam
5
Institute of Forestry Research and Development, Thai Nguyen University, Quyet Thang, Thai Nguyen 24119, Vietnam
6
Department of Genetic Engineering, Dong-A University, Busan 602760, Korea
*
Author to whom correspondence should be addressed.
These authors contributed equally to this work.
Agronomy 2022, 12(9), 2110; https://doi.org/10.3390/agronomy12092110
Submission received: 14 July 2022 / Revised: 27 August 2022 / Accepted: 30 August 2022 / Published: 5 September 2022
(This article belongs to the Special Issue Legumes Cultivars and Their Genetic Improvements)

Abstract

:
Senescence is modulated by ORESARA1 (ORE1), a NAC transcription factor that interacts with hormones to fully induce senescence. The At-ore1 gene acts as a suppressor of leaf senescence; however, its exact role in this respect has not been clearly defined. In this study, the function of At-ore1 during leaf senescence was analyzed in soybeans. The precocious leaf senescence of the ore1-1 line was associated with greater chlorophyll loss, leaf necrosis, and redox imbalance in the early vegetative stage during the hyper-accumulation of endogenous abscisic acid (ABA) by enhancing the expression of GmNECD3-related ABA synthesis. At-ore1 induced ABA regulation of the H2O2-GmARF2-GmNAC081 signaling circuit, which relays the At-ore1-induced cell death signal mediation to the caspase-1-like vacuolar processing enzyme (VPE) expression, triggering programmed cell death. In contrast, it was found that At-ore1 functions in IAA to delay leaf-senescence-mediated suppression of the expression of ABA, ROS, and senescence-associated gene 39 (GmSAG39). The IAA-induced GmNAC065 expression controls soybean leaves’ longevity, as discovered by screening At-ore1 expression in ore1-6 for a more stay-green leaf phenotype by helping to increase seed yields. These results uncover a mechanism that modulates ore1 plants’ amplitude expression involved in the ABA/IAA balance in the activation of GmNAC081- or GmNAC065-dependent H2O2 levels, which are crucial in the senescence or delayed leaf senescence of soybeans.

1. Introduction

Leaf senescence is a developmentally controlled process that involves a general degradation of cellular structures in plants. A noticeable feature of leaf senescence is the extensive loss of Ribulose-1,5-bisphosphate carboxylase-oxygenase (rubisco) and chlorophyll by a degradation process and a decline in photosynthetic activity due to the dismantling of chloroplasts [1]. The phenotype of senescence in plants seems to be largely mediated by the dramatic loss of chlorophyll in chloroplasts [2]. Furthermore, molecular and genetic studies of the mechanism underlying leaf senescence have identified senescence-associated genes (SAG). In addition, leaf senescence is controlled primarily by developmental age, and the onset and progression of this process are also influenced by a number of endogenous and external factors.
Among various factors, the transcription factor has a significant role in coordinating the genes’ regulatory networks that underlie the senescence process [3,4]. One of the key senescence-control transcription factors in Arabidopsis thaliana is the NAC protein, ORESARA1 (ORE1; AtNAC2) [5,6]. Hence, ORE1 is a positive regulator of leaf senescence. Overexpression of ORE1 in transgenic plants triggers early senescence, while its inhibition retards senescence [7,8,9]. ORE1 exert its regulatory function by controlling the expression of various known senescence-associated genes, such as BFN1, SAG29, SINA1, and PRR9, by directly binding to their promoters [5,6]. Several studies showed that the expression of ORE1 was controlled by the upstream transcription factor of leaf-age- and abiotic-stress-dependent ORE1 transcriptional activity [7] or promoting RNA-degradation-mediated transacting miR164 [5,8,10]. The identification of these genes has partially elucidated the molecular mechanism underlying leaf senescence. In parallel, three delayed senescence mutants, ore1, ore3, and ore9, have been identified in Arabidopsis [11].
Leaf senescence occurs in an age-dependent manner, but it is also affected by developmental age and factors such as reactive oxygen species (ROS), light, phytohormones, and temperature. Among these, the pivotal complex interaction between ethylene and ORE1 in leaf senescence was confirmed by several studies [12,13]. Kim et al. (2014) [12] demonstrated that EIN3, an ethylene signaling gene, directly activates the expression of ORE1 by binding to its promoter to accelerate leaf senescence. ORE1 can promote the transcription of ACS2 in feedback loop interactions for the positive regulation of ethylene synthesis and signaling [10,13]. On the other hand, abscisic acid (ABA) is one of the phytohormones that induce leaf senescence [2,14,15]. Both an upregulation of genes associated with ABA signaling and a dramatic increase in endogenous ABA levels is observed in many plants during leaf senescence [13,16]. The application of ABA promotes chlorophyll degradation and induces the expression of SAGs genes [2], indicating the presence of a link between ABA signaling and leaf senescence [17,18]. Moreover, a variety of abiotic and biotic stresses both elevate ABA levels and activate signaling pathways leading to senescence [14,19]. Thus, it seems clear that ABA acts as a key positive regulator of leaf senescence. To date, however, the mechanistic evidence of ABA’s regulatory role in the onset of senescence is counterbalanced and still vaguely defined by its regulation. The mechanism for the ABA-induced upregulation of ORE1 is still unclear [14]. Specifically, there is still insufficient information available to delineate the molecular link between ABA and ORE1 during senescence in plants.
ore1, a mutant gene, is known to exhibit enhanced tolerance to various types of oxidative stress and delayed leaf senescence in Arabidopsis thaliana [11]. To examine how At-ore1 works in soybean, we introduced this gene into soybean via agrobacterium transformation. The result demonstrates a tight link to ore1 and ABA expression during leaf senescence. We found that the ore1-6 line showed that an At-ore1-integrated GmNAC065 mechanism delayed age-induced leaf senescence. It is anticipated that the findings of this study on the At-ore1 might be associated not only with delayed leaf senescence but also with the capacity to extend the essential longevity of leaves involved in the assembly of the ameliorated high-yield soybean.

2. Materials and Methods

2.1. Gene Construction and Plant Transformation

The At-ore1 gene was isolated from the Arabidopsis thaliana Salk 090154 line as previously described by He et al. (2005) [20]. The transformation vector included the cassette containing the At-ore1, bar gene, and the 35S promoter. The 35S terminator (T35S) was digested from the pENTR/D-TOPO vector using restriction enzymes BamHI and EcoRI (Invitrogen, Waltham, MA, USA). The expression vector, pB2GW7, was also digested by BamHI and EcoRI and linked to the cassette with T4-DNA ligase containing the At-ore1 gene (Figure S1).
Commercial vector pENTR™/D-TOPO™ and pB2GW7 were purchased from Invitrogen (Waltham, MA, USA). The Escherichia coli strain DH5α, Agrobacterium tumefaciens strain EHA105, and soybean variety (Kwangan) used in this study were kindly provided by Prof. Young Soo Chung, Dong-A University, Korea.
Genetic transformation of the soybeans was performed according to the “haft seed” method as described by Nguyen et al. (2021) [21] and Olhoft et al. (2003) [22]. Plants were grown in the greenhouse to maturity under a photoperiod of 16/8 h (light/dark) under natural light, 80% humidity, at 28 °C ± 2 °C.

2.2. Plant Material and Growth Condition

Soybean cultivar Kwangan (wild-type, NT) and three transgenic lines named as ore1-1, ore1-2, and ore1-6 were used for experiments. Seeds were germinated in bed soil mixed with soil, perlite, and cocopeat (5:4:1, w/w/w) in a tray. These plants were grown in an artificial climate chamber under 16 h light/8 h dark photoperiod conditions at 28 °C. At the four-leaf stage, transgenic plants were screened by the leaf painting method using phosphinothricin (PPT) as previously described by Nguyen et al. (2021) [21] and Kita et al. (2009) [23]. PPT-resistant plants were recorded and transferred to a pot (W × H = 18.5 cm × 9.0 cm) that contained a mixture of soil and perlite (7:3, w/w), fifteen plants for one treatment. The plants were grown in a greenhouse with a day/night mean temperature of 27/20 °C and relative humidity of 85%. Natural light was supplemented by metal halide lamps that generated 200 μmol photons m−2 s−1 at the canopy height for 16 h per day. Agronomic traits, including the plant height and seed size, as well as the 100-seed weight and seed yield per plant, were measured at the R1 reproductive and harvest stages, respectively.

2.3. Effect of Hormones and Hydrogen Peroxide

For abscisic acid (ABA) and naproxen (NAP) treatments, the third leaves from eight-week-old NT, ore1-1, ore1-2, and ore1-6 transgenic plants were detached and floated in a buffer containing 0.1 mM ABA (Sigma, Burlington, MA, USA) and 0.1 mM NAP (Sigma, Burlington, MA, USA).
A hormones test was performed with whole plants by spraying the plants daily with 10 mL of ABA (10 µM), IAA (10 µM), and ABA + IAA, respectively, whereas the control group was applied with the same volume of water. Those plants were then treated with 10 mL of 1 mM hydrogen peroxide (H2O2), 10 mM N,N′-Dimethylthiourea (DMTU), and water. All treatments were performed at 25 °C under continuous light. The effect of hormones and hydrogen peroxide were evaluated base on the plants’ phenotype, chlorophyll content, and SAG transcript level after treatment.

2.4. Total Chlorophyll Content Measurement

For the total chlorophyll and carotenoid content, fresh leaves (100 mg) were immersed in 10 mL of 99% dimethyl sulfoxide (DMSO, Sigma, Burlington, MA, USA) following the method described previously [24]. After 48 h, the absorbance of extract was determined spectrophotometrically at 645 nm and 663 nm for total chlorophyll, chlorophyll a, and chlorophyll b using a UV reader (Synergy H1 Hybrid Reader; Biotek, South Korea). The chlorophyll amount is calculated as follows: total Chl (µg) = 20.2 A645 + 8.02 A663, Chl a (µg) = 12.7 A663–2.69 A645, Chl b (µg) = 22.9 A645–4.68 A663.

2.5. ROS Production and Antioxidant Activity Assays

The superoxide anion radical (O2) content was measured by hydroxylamine oxidation [25]. Briefly, 0.1 g of leaf sample was homogenized in 50 mM potassium phosphate buffer (pH 7.8) and centrifuged at 12,000× g for 10 min at 4 °C. A mixture of 0.5 mL of enzyme extract and 1 mL of 10 mM NH2OH-HCl was incubated for 60 min at 25 °C and then reacted with 1 mL of 17 mM p-aminobenzene sulfonic acid and 7 mM N-(1-Naphthyl) ethylenediamine at 25 °C for 20 min. The absorbance was determined at 530 nm and calculated from a standard curve prepared by NaNO2. For H2O2 determination, leaves were extracted with phosphate buffer and reacted with titanium chloride. The absorbance was immediately read at 410 nm and calculated using the coefficient of absorbance, 0.28 µM−1 cm−1 [26].
Antioxidant enzymes were extracted from 50 mg of fresh leaves using KPO4 buffer (pH 7.5). The activity of superoxide dismutase (SOD; EC 1.15.1) was determined by measuring its ability to inhibit the photoreduction of NBT [25]. The activity of catalase (CAT; EC 1.11.1.6) was assayed using the method described by Lee et al. (2013) [27]. The degradation of H2O2 content was calculated using the coefficient, ε = 36 mM−1 cm−1. One unit of enzyme activity was defined as the amount of enzyme that causes the degradation of 1 mM H2O2 per min.

2.6. Redox Status Measurement

Oxidized and reduced pyridine nucleotide content was determined as described by Queval and Noctor (2007) [28], with minor modifications. Briefly, 100 mg fresh leaves were homogenized with an extraction buffer containing 0.8 mL of 0.2 N HCl and 0.2 M NaOH, respectively. One hundred microliters of extract were heated at 95 °C for 1 min and stopped in an ice bath. For the NAD(P)+ assay, the supernatant was neutralized by 0.2 M NaOH to a final pH of 5–6, and NAD(P)H was neutralized by 0.2 N HCl to a final pH of 7–8. Forty microliters were added to the reaction mixture containing 0.1 M HEPES (pH 7.5) and consisting of 2 mM Na2EDTA, 1.2 mM dichlorophenolindophenol (DCPIP), 20 mM phenazine methosulfate (PMS), and 10 mM glucose-6-phosphate. The reaction mixture started by adding 2 µL glucose 6-phosphate dehydrogenase (G6PDH, 200U). The content of NAD(P)+ and NAD(P)H was determined based on the standard curve with contents ranging from 1–100 pmol.

2.7. Phytohormone Analysis

Quantitative analysis of phytohormones in leaf tissue was performed by high-performance liquid chromatography–electrospray ionization tandem mass spectrometry (HPLC–ESI–MS/MS) [26,29]. Briefly, 50 mg of fresh leaves were frozen in liquid nitrogen and ground using a TissueLyser-II (Qiagen). The ground samples were extracted with 500 μL of extraction buffer (2:1:0.002, v/v/v of 2-propanol: H2O: concentrated HCl). Subsequently, 1 mL of dichloromethane (CH2Cl2, Sigma, Burlington, MA, USA) was added to the supernatant, and centrifuged at 13,000× g for 5 min at 4 °C. The lower phase was transferred to a clean screw-cap glass vial and dried under nitrogen, and finally dissolved in absolute methanol (Sigma, Burlington, MA, USA). The completely dissolved extract was transferred to a reduced-volume liquid chromatography vial. Hormones were analyzed by a reverse-phase C18 Gemini high-performance liquid chromatography (HPLC) column for HPLC–ESI–MS/MS analysis. The chromatographic separation of hormones and their internal standard from the plant extracts was performed on an Agilent 1100 HPLC (Agilent Technologies, Santa Clara, CA, USA), Waters C18 column (15,092.1 mm, 5 lm), and API3000 MSMRM (Applied Biosystems, Waltham, MA, USA), using a binary solvent buffer comprising 0.1% formic acid in water (Solvent A) and 0.1% formic acid in methanol (solvent B) at a flow rate of 0.5 mL/min.

2.8. Analysis of Protein Profiles in Gel-Staining and Thylakoid Membrane Proteins by BN-PAGE

Protein profiles in fresh young leaves were analyzed by sodium dodecyl sulfate polyacrylamide gel electrophoresis (SDS-PAGE; [30]), which was performed in a mini vertical electrophoresis system (Bio-Rad, Mini-PROTEAN, Hercules, CA, USA). An equal quantity of protein (50 µg) from each sample was loaded into 12.5% gels, and Precision Plus Protein Dual-color standard (Bio-Rad, Hercules, CA, USA) was also incorporated into the gel to determine the molecular weight of the bands. The absolute integrated optical density (IOD) of each band was measured by Gel-Pro Analyzer software 4.0 (Media Cybernetics Inc., Bethesda, MD, USA). The thylakoid membrane protein complexes (8µg of chlorophyll) were resuspended and run by blue native polyacrylamide gel electrophoresis (BN-PAGE) with the method described by Järvi et al. (2011) [31].
The total proteolytic activity and visualization of proteases were determined using the method described by Beyene et al. (2006) [32]. For the visualization of proteases, 50 μg of protein were separated on 12.5% SDS-PAGE containing 0.1% gelatin. After electrophoresis, the gel was re-natured in 2.5% Triton X-100 at room temperature for 30 min. The gel was then transferred into cysteine 10 mM in phosphate buffer solution to detect the activity of proteases. Next, the gel was rinsed and developed overnight with a staining solution (0.125% Coomassie brilliant blue R-250, 10% acetic acid, and 25% methanol). The appearance of the white bands under a blue background indicates protease activity.

2.9. RNA Extraction and Quantitative Real-Time PCR Analysis

Total RNA was isolated from 100 mg fresh leaf of NT and transgenic plants using an RNAiso Plus (Takara, DALIAN). cDNA was synthesized using the GoScript Reverse Transcription System (Promega, Maddison, WI, USA). Gene expression was quantified using a light cycle real-time PCR detection system (Bio-Rad, Hercules, CA, USA) with SYBR Premix Ex Taq (Takara, Dalian, Japan). The qPCR reactions were performed as previously described [33]. Primers used in qRT–PCR were shown as specific primers (Supplementary Table S3). The qPCR reactions were performed in triplicate for each of three independent samples, and the relative expression levels of the target genes were calculated from threshold values (Ct), using the 2−∆∆CT method [34] and the GmActin gene as an internal control.

2.10. Metabolic and Cis-Regulatory Element Analysis

To further examine the functional implications and correlations of the identified metabolites in At-ore1 transgenic soybean, the heatmap visualization, enrichment sets overview, pathway analysis, and correlation networks among biochemical defense markers such as chlorophyll, hormones, ROS, redox status, and transcriptional regulation were performed using MetaboAnalyst 5.0 (http://www.metaboanalyst.ca (accessed on 8 June 2022)).
NCBI blast search (https://blast.ncbi.nlm.nih.gov/Blast.cgi (accessed on January 2 2022)) was used to determine amino acid sequence similarity between the At-ore1 and the NAC region in soybean. The position of At-ore1 binding to cis-regulatory elements (CREs) was identified using PlantCARE (http://bioinformatics.psb.ugent.be/webtools/plantcare/html/ (accessed on 2 January 2022)).

2.11. Statistical Analysis

The present study used a completely randomized design with three replicates for each treatment and sampling date. Analysis of variance (ANOVA) was applied to all data, and Duncan’s multiple range test was used to compare the means of separate replicates for each sampling time. All statistical tests were performed using SAS 9.1 (SAS Institute, Inc., Cary, NC, USA, 2002–2003), and differences of p < 0.05 were considered significant.

3. Results

3.1. At-ore1 Gene Alters the Leaf Senescence Phenotype in Soybean

To examine the possible function of the At-ore1 gene in the leaf senescence of soybean cultivar, we generated fifteen independent soybean transgenic lines that carried At-ore1 integration with the bar gene under the control of the 35S Cauliflower mosaic virus (CaMV) promoter (Figure S1). In order to obtain homozygous transgenic lines, all plants were screened by basta spraying and confirmed by PCR analysis from T1 to T3 generations (data not shown). Among them, three lines showed all plants resistant to basta herbicide after 7 days of treatment (Figure S2), named as ore1-1, ore1-2, ore1-6, which were chosen for further examination.
Interestingly, these lines showed different leaf phenotypes. Of these, the ore1-1 lines exhibited leaf senescence remarkably at the early stages of plant development compared to the wild-type (NT) and otherwise (Figure 1A,B). The premature leaf senescence phenotype correlated fairly well with the total chlorophyll (Chl) content loss of −43.9% of the middle leaf (leaf 3–4) rather than the older leaf (leaf 1–2, loss −12.6%) in the ore1-1 compared to NT (Figure 1B and Figure S3). Leaf yellowing occurred more quickly and was more severe at leaf 3-4 of the ore1-1 line, but not observed in the young leaf (leaf 5). In contrast, the ore1-2 and ore1-6 lines show more stay-green (Figure 1A,B) correlated with higher total Chl, which is accompanied by the levels expression of senescence-associated gene 39 (GmSAG39) (Figure 1C,D). Chlorophyll loss occurred earlier and was significantly more severe in the ore1-1 line; however, the stay-green phenotype of the ore1-2 and ore1-6 lines was similar to that of the NT. These data suggest that the expression of At-ore1 gene might alter the leaf phenotype at the V3 vegetative stage in soybean transgenic plants.

3.2. At-ore1 Confers Divergent Functions on Soybean Leaf Senescence by Regulating the Photosynthesis Complex

Preliminary functional analysis of the At-ore1 gene in soybean leaves by transient expression revealed the acceleration of leaf senescence compared to NT, confirmed by a significant reduction in total Chl content. Visible screening of phenotypes showed that premature leaf 3 (Figure 2A) exhibited a clearly severe yellowing leaf symptom effect, leading to a yellow/pale yellow variegated phenotype that became more apparent with age. Pigment analysis revealed a sharp reduction (−20%) in the concentration of Chl (Figure 2B,C), which only partially explained the loss of pigment. However, as described, the ore1-2 and ore1-6 lines had slightly increased Chl compared to the NT, consistent with the Chla:Chlb ratio (Figure 2D).
A more detailed analysis of the Chl content revealed that the lower Chla:Chlb ratio in the ore1-1 line was almost entirely due to the total protein profile. The result of SDS-PAGE staining revealed a significant decrease of 39.3% and 37% of the rubisco large subunit (RLS) and rubisco small subunit (RLS) in ore1-1 compared with NT, respectively (Figure 2E,F). Likewise, we further analyzed the relative amount of Chl-binding protein of photosynthetic components by BN-PAGE gel staining on isolated thylakoid membranes. The analysis of free pigments confirmed a relative decrease in the monomeric photosystem II (PSII) and trimeric light-harvesting complex (LHCII) in the ore1-1 line compared to the wild-type. Among these components was a relative increase in the ore1-2 and ore1-6 lines (Figure 2G), while dimeric PSI, PSII, and monomeric LHCII were present at similar levels.
The loss of Chl content in the ore1-1 line is associated with the Chl degradation of LHCs. Further analysis of photosynthetic parameters in soybeans such as the STAY-GREEN 1 (GmSGR1) and GmSAG39 genes indicated that these genes showed higher expression levels in the ore1-1 line than in the NT; however, they were lower than in the ore1-2 and ore1-6 lines.

3.3. Expression of At-ore1 Defines Typical ABA/IAA Antagonistic Interaction

Leaf senescence is positively and negatively regulated by various plant hormones. The phytohormones abscisic acid (ABA), salicylic acid (SA), jasmonic acid (JA), and ethylene (ET) have a positive role in senescence [12,16]. As an NAC transcription factor, NAC2/ORE1 is considered to be the key positive regulator of leaf senescence, involved in a delicately balanced feed-forward loop that promotes ethylene-mediated Chl degradation [13] and is quickly induced in response to ABA [2]. To examine the relationship between At-ore1 and hormone inducers and inhibitors of senescence, the endogenous levels of ABA, SA, JA, GA3, and IAA were measured in transgenic lines at the onset of leaf senescence under normal growth conditions. However, the JA and GA3 levels in the transgenic lines were slightly different from those in the wide type (NT; Table 1). The ABA level was very high in the ore1-1 line compared to the NT (+68%), ore1-2, and ore1-6 lines. In the ore1-1 line, the extent of the increase in ABA/SA levels and the decline in IAA levels closely paralleled the levels of At-ore1 transcripts (Figure 2H and Table 1), suggesting that At-ore1 could act as a positive regulator of ABA/SA synthesis and a negative feedback regulator of IAA synthesis. Consistent with the results, an antagonistic interaction of ABA/SA with IAA was more strongly activated in the ore1-1 lines despite a decrease in IAA-based hormone balances of ABA/IAA and SA/IAA (Table 1). These results suggested that the high correlation between hormones and chlorophyll content, along with ABA/SA/JA and their ratio-base IAA, were negative regulators of chlorophyll loss in leaf senescence, whereas IAA was a positive regulator in delayed leaf senescence (Figure S4).
Accordingly, the high expression of soybean ABA synthesis enzyme 9-CIS-EPOXYCAROTENOID 3 (GmNECD3) and ISOCHORISMATE SYNTHASE 1 (GmISC1)-related SA synthesis were observed in senescing leaves of ore1-1 lines compared with NT, ore1-2 and ore1-6 (Figure 3A,B). In contrast, IAA was higher in stay-green leaves of the ore1-6 line than the NT, ore1-1, and ore1-2 lines, which correlated with the induction of YUCCA6 expression (Figure 3C). The expression of soybean ABA-INSENSITIVE 5 (GmABI5)-related ABA signaling and NONEXPRESSOR OF PATHOGENESIS-RELATED GENES 1 (GmNPR1)-related SA signaling depended on the ABA and SA level (Figure 3D,E). Moreover, the ore1-6 leaf stay-green phenotype may be regulated by ARF2, a member of the AUXIN-RESPONSE FACTOR (ARF) protein family related to auxin signaling in Arabidopsis [35]. Indeed, the expression level of GmARF2 was reduced in the ore1-6 line (Figure 3F), suggesting that ARF2 silence promotes IAA accumulation [35,36].

3.4. Delay of ABA-Induced Leaf Senescence in At-ore1 Soybean Transgenic Lines Is Mediated by Auxin

In addition to the role of the At-ore1 gene in controlling the ABA response, we treated leaves of the wide type and the ore1 soybean transgenic lines in vitro. After 3 days of observation, the leaf phenotype showed a visible yellowing, with the highest in the ore1-1 line gradually decreasing to the ore1-6 line, which also alleviated senescence in NAP treatment (naproxen-inhibitor of ABA; Figure S5A,B). Consistent with these results, the Chl amount was decreased by ABA-activated GmNAC081 and GmSAG39 expression in the ore1-1 line background (Figure S5D,E). However, in the wide type, not much reduction of Chl occurred with the stable green phenotype (Figure S5B,C), suggesting that At-ore1 activated the upstream regulation of the senescence-associated gene GmSAG39 in agreement with At-ore1-mediated ABA-induced leaf senescence (Figure S5; [11]). The more detailed role of antagonistic interaction between ABA and IAA in controlling transcription factor signaling and Chl degradation emerged from exogenous ABA and IAA treatment. After 5 days of treatment, we found that ABA-induced leaf senescence depends on At-ore1 expression, whereas senescence symptoms were reduced by IAA application. Considering several clues, there is a possible role for At-ore1 in controlling IAA signaling in delayed leaf senescence. The result showed that IAA inhibited the yellowing leaf phenotype by maintaining Chl content, which appeared similar to the NT (Figure S6A,B). Consistent with a previous report [31], our results also indicate that IAA is a negative regulator of At-ore1 expression (Figure S6C,D). Leaf senescence or stay-green is related to Chl synthesis and catabolic. We found that the expression of GmCHLG, encoding the chlorophyll synthesis enzyme CHLOROPHYLL SYNTHASE (CHLG), was downregulated by ABA treatment; however, it was similar in the IAA or ABA+IAA treatments (Figure S7A). Furthermore, the visible symptom of leaf senescence was de-greening, owing to rapid Chl degradation upon ABA treatment (Figure S6B). ABA-induced leaf senescence despite Chl degradation by activating chlorophyll catabolic enzymes (CCGs) such as soybean NON-YELLOW COLORING 1 (GmNYC1) and STAY-GREEN 1 (GmSGR1; Figure S7B,C). In contrast, the low expression of these genes in the IAA treatment exhibits stay-green phenotypes during ABA-induced senescence and age-triggered senescence due to impaired Chl degradation (Figure S7B,C).
Furthermore, we analyzed major binding motifs on the At-ore1 gene and found four different top-ranking cis-regulatory elements (CREs) binding motifs, thus highlighting the potential of At-ore1 as a direct target of the ABA-responsive ABRE-motif (ACGTG), auxin-responsive TGA element (AACGAC), jasmonic acid-responsive TGACG motif (TGACG), and Chl a/b binding protein GATA box (GATA) (Table 2 and Table S2).

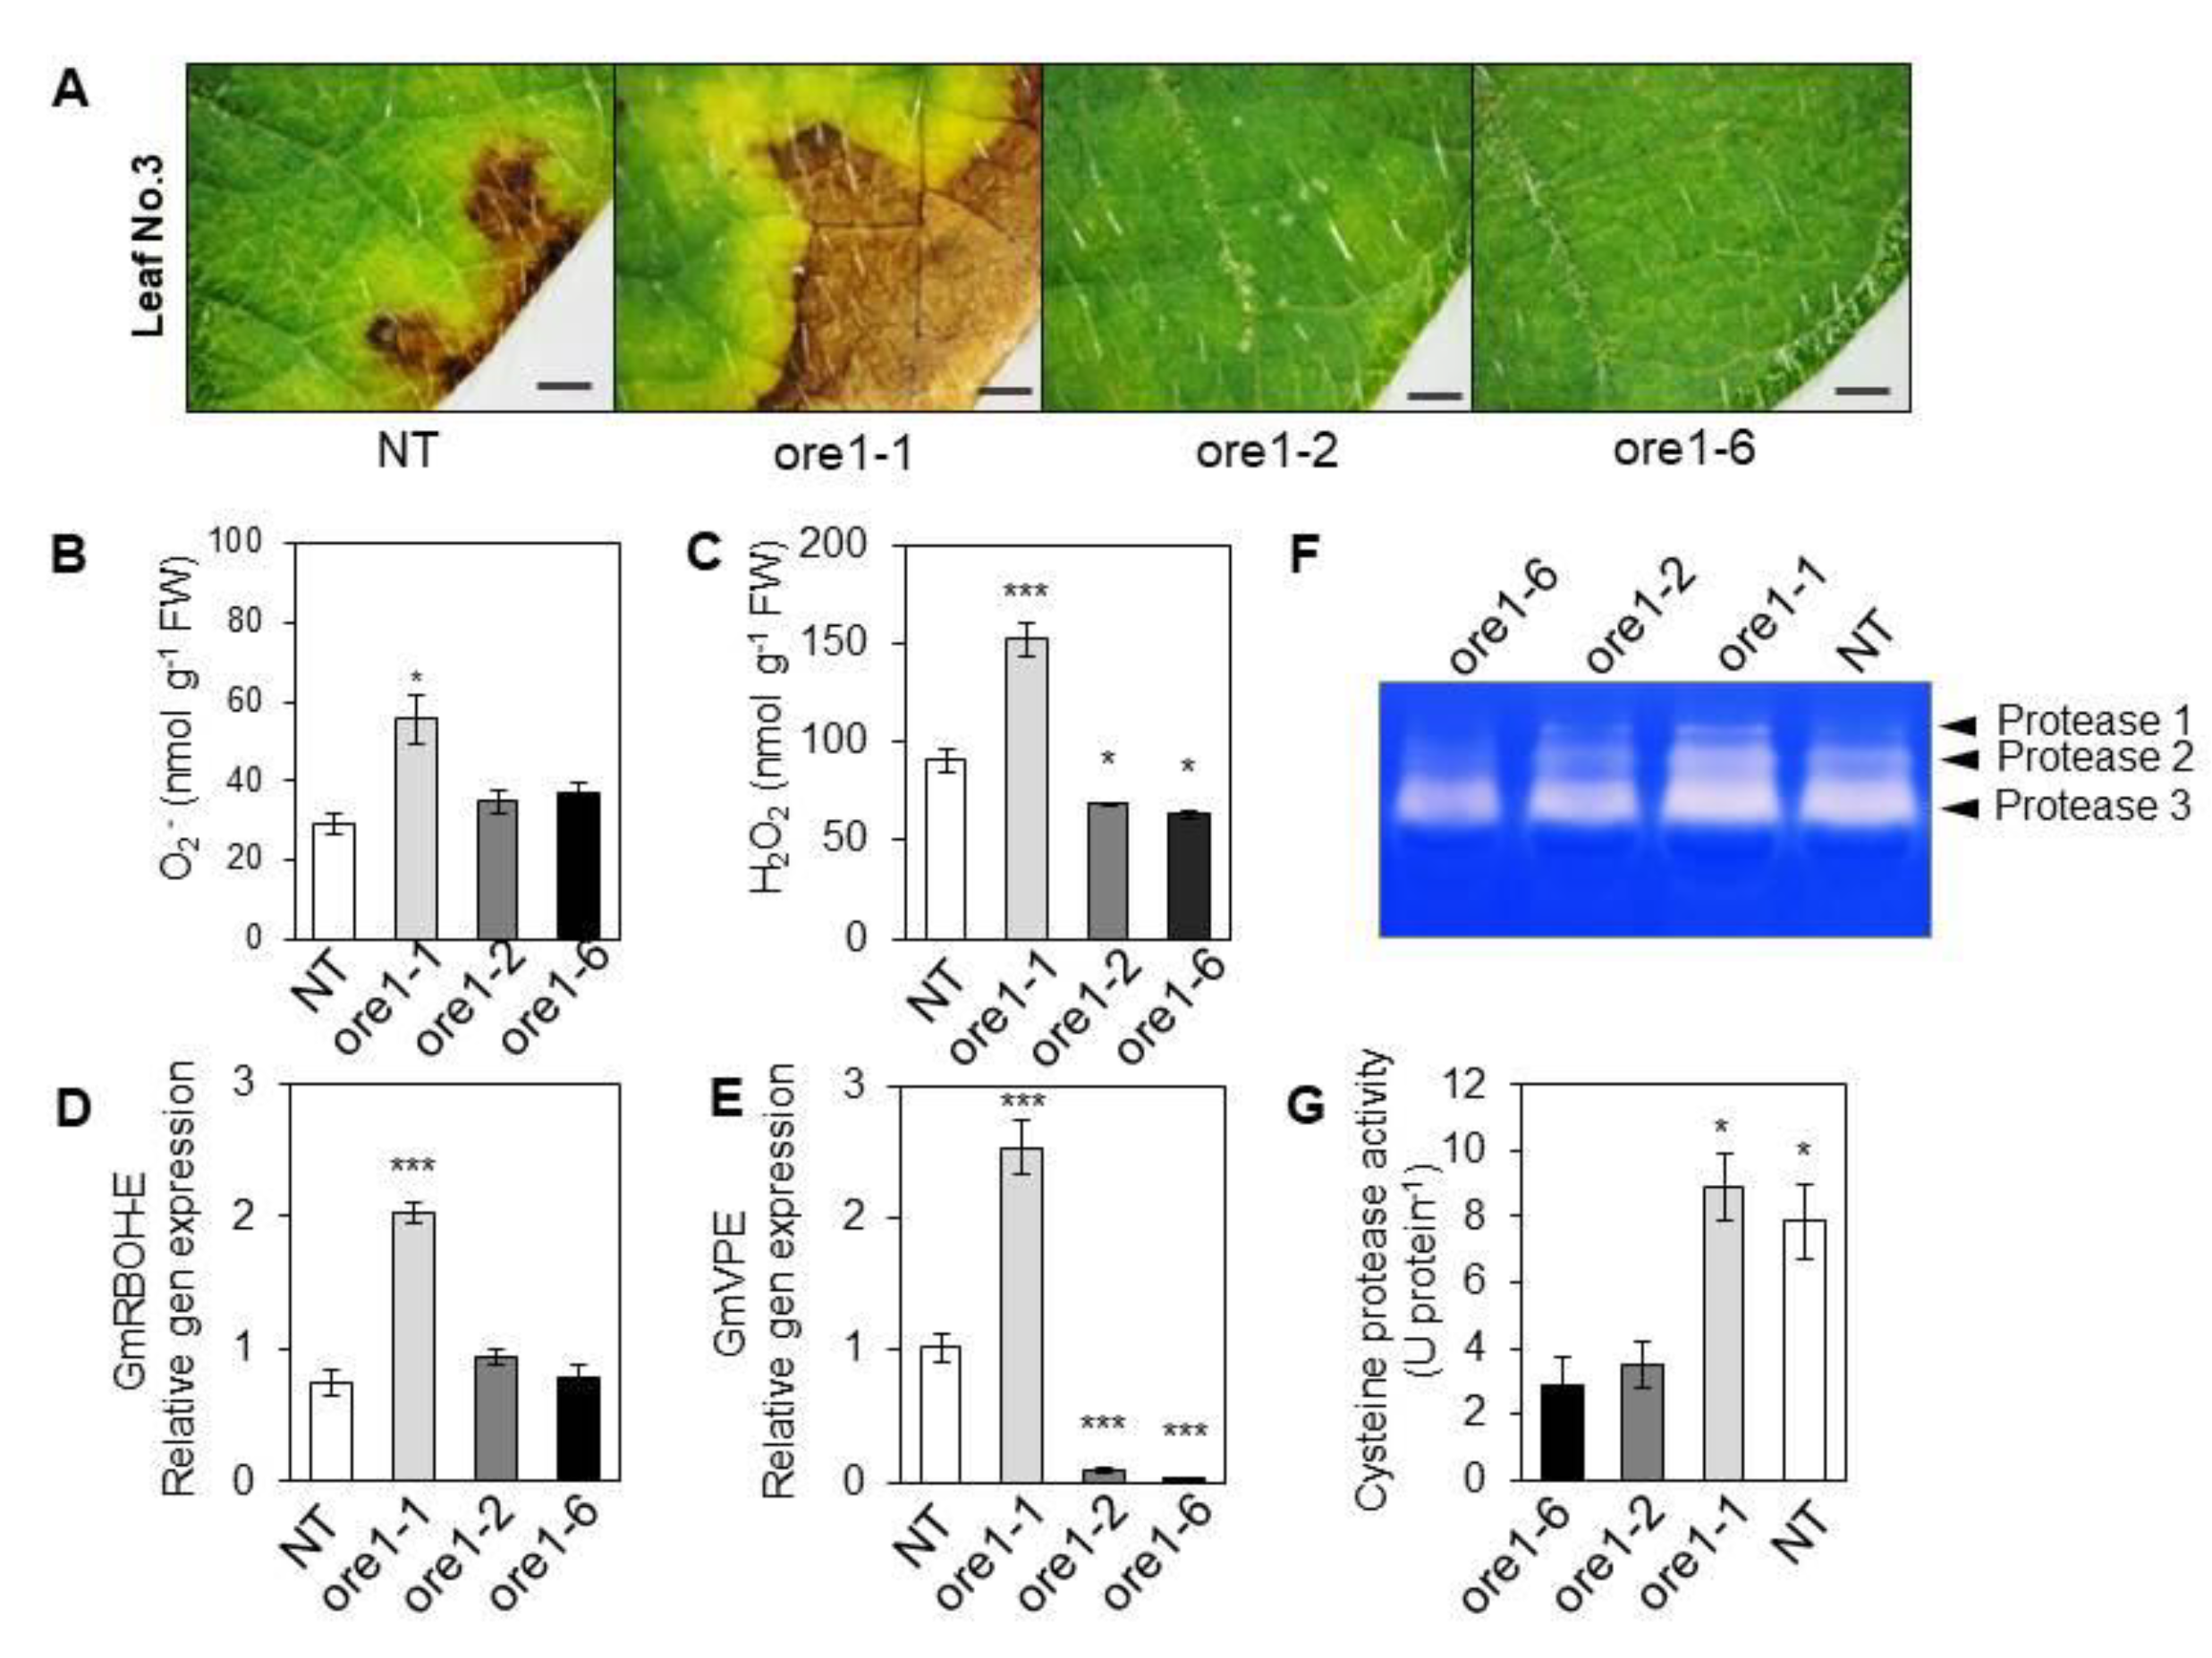
3.5. At-ore1 Does Not Inhibit Cell Death Typical of Hyper-ROS Accumulation in Soybeans

Leaf yellowing is a convenient visible indicator, mainly reflecting the chloroplast senescence of mesophyll cells. Leaves started to turn yellow on day 30 and showed signs of necrosis on the day 45 of treatment in NT and ore1-1 plants (Figure 4A). By contrast, the ore1-2 andore1-6 plants showed complete yellowing leaves until 80 days after emergence. In the previous study, Woo et al. (2004) [11] revealed that the lack of functioning ANAC092 in the ore1 plants delayed leaf senescence under oxidative stress conditions. In addition, abiotic stress triggers the accumulation of intracellular ROS levels, leading to the upregulation of sensitive NAC gene expression [7]. In the ore1 lines, Atore1-induced leaf senescence is positively correlated with plants’ hyper-sensitivity to ROS accumulation, which increased the levels of O2 by 90% and H2O2 by 87.7% compared to the NT (Figure 4A–C). For this experiment, the procedure used for assaying H2O2-induced senescence symptoms was adapted, and H2O2 was used as an oxidant (Figure S8). Under such exposure, the total Chl content declined rapidly in the ore1-1 line. In contrast, ore1-2 and ore1-6 retained 23% and 28% of the Chl content, respectively, even at 5 days after treatment (Figure S8A,B), which is in line with the downregulation of GmNAC081 and GmSAG39 (Figure S8C,D). Thus, the ore1-2 and ore1-6 lines conferred greater resistance to oxidative stress.
ROS plays a critical role in mediating oxidative damage and accelerating senescence in the plant. Potential programmed cell death (PCD) is positively correlated with ROS accumulation [13]. GmRBOH-E expression was significantly increased in the ore1-1 but not the ore1-2 and ore1-6 lines compared to NT (Figure 4D). In addition, Atore1-induced PCD in the ore1-1 was examined by determining physiological cell death markers such as vacuolar processing enzyme (VPE). A cysteine protease, VPE, exhibits caspase-1-like activity and is involved in the disintegration of vacuoles, initiating the proteolytic cascade in plant PCD. By determining the VPE, we found that the GmVPE expression and cysteine protease activity were increased in the ore1-1 line. In contrast, the ore1-1 and ore1-6 displayed lower levels of GmVPE and cysteine protease activity than NT (Figure 4E–G).
Additionally, ore1-2 and ore1-6 observed a delayed leaf senescence in an ore1 loss-of-function mutant that significantly decreased At-ore1 levels or induced ROS detoxification. The ore1-2 and ore1-6 lines exhibited more tolerance of oxidative stress than the NT, as measured by antioxidant enzymes such as superoxide dismutase (SOD) and catalase (CAT). The activity of these enzymes was similar or lower in the mutants compared to the NT and repressed the redox state by NADPH/NADP+ (Table 3). These results suggest that the increased resistance to oxidative stress in the ore1-2 and ore1-6 lines is not due to the enhanced activities of antioxidant enzymes.

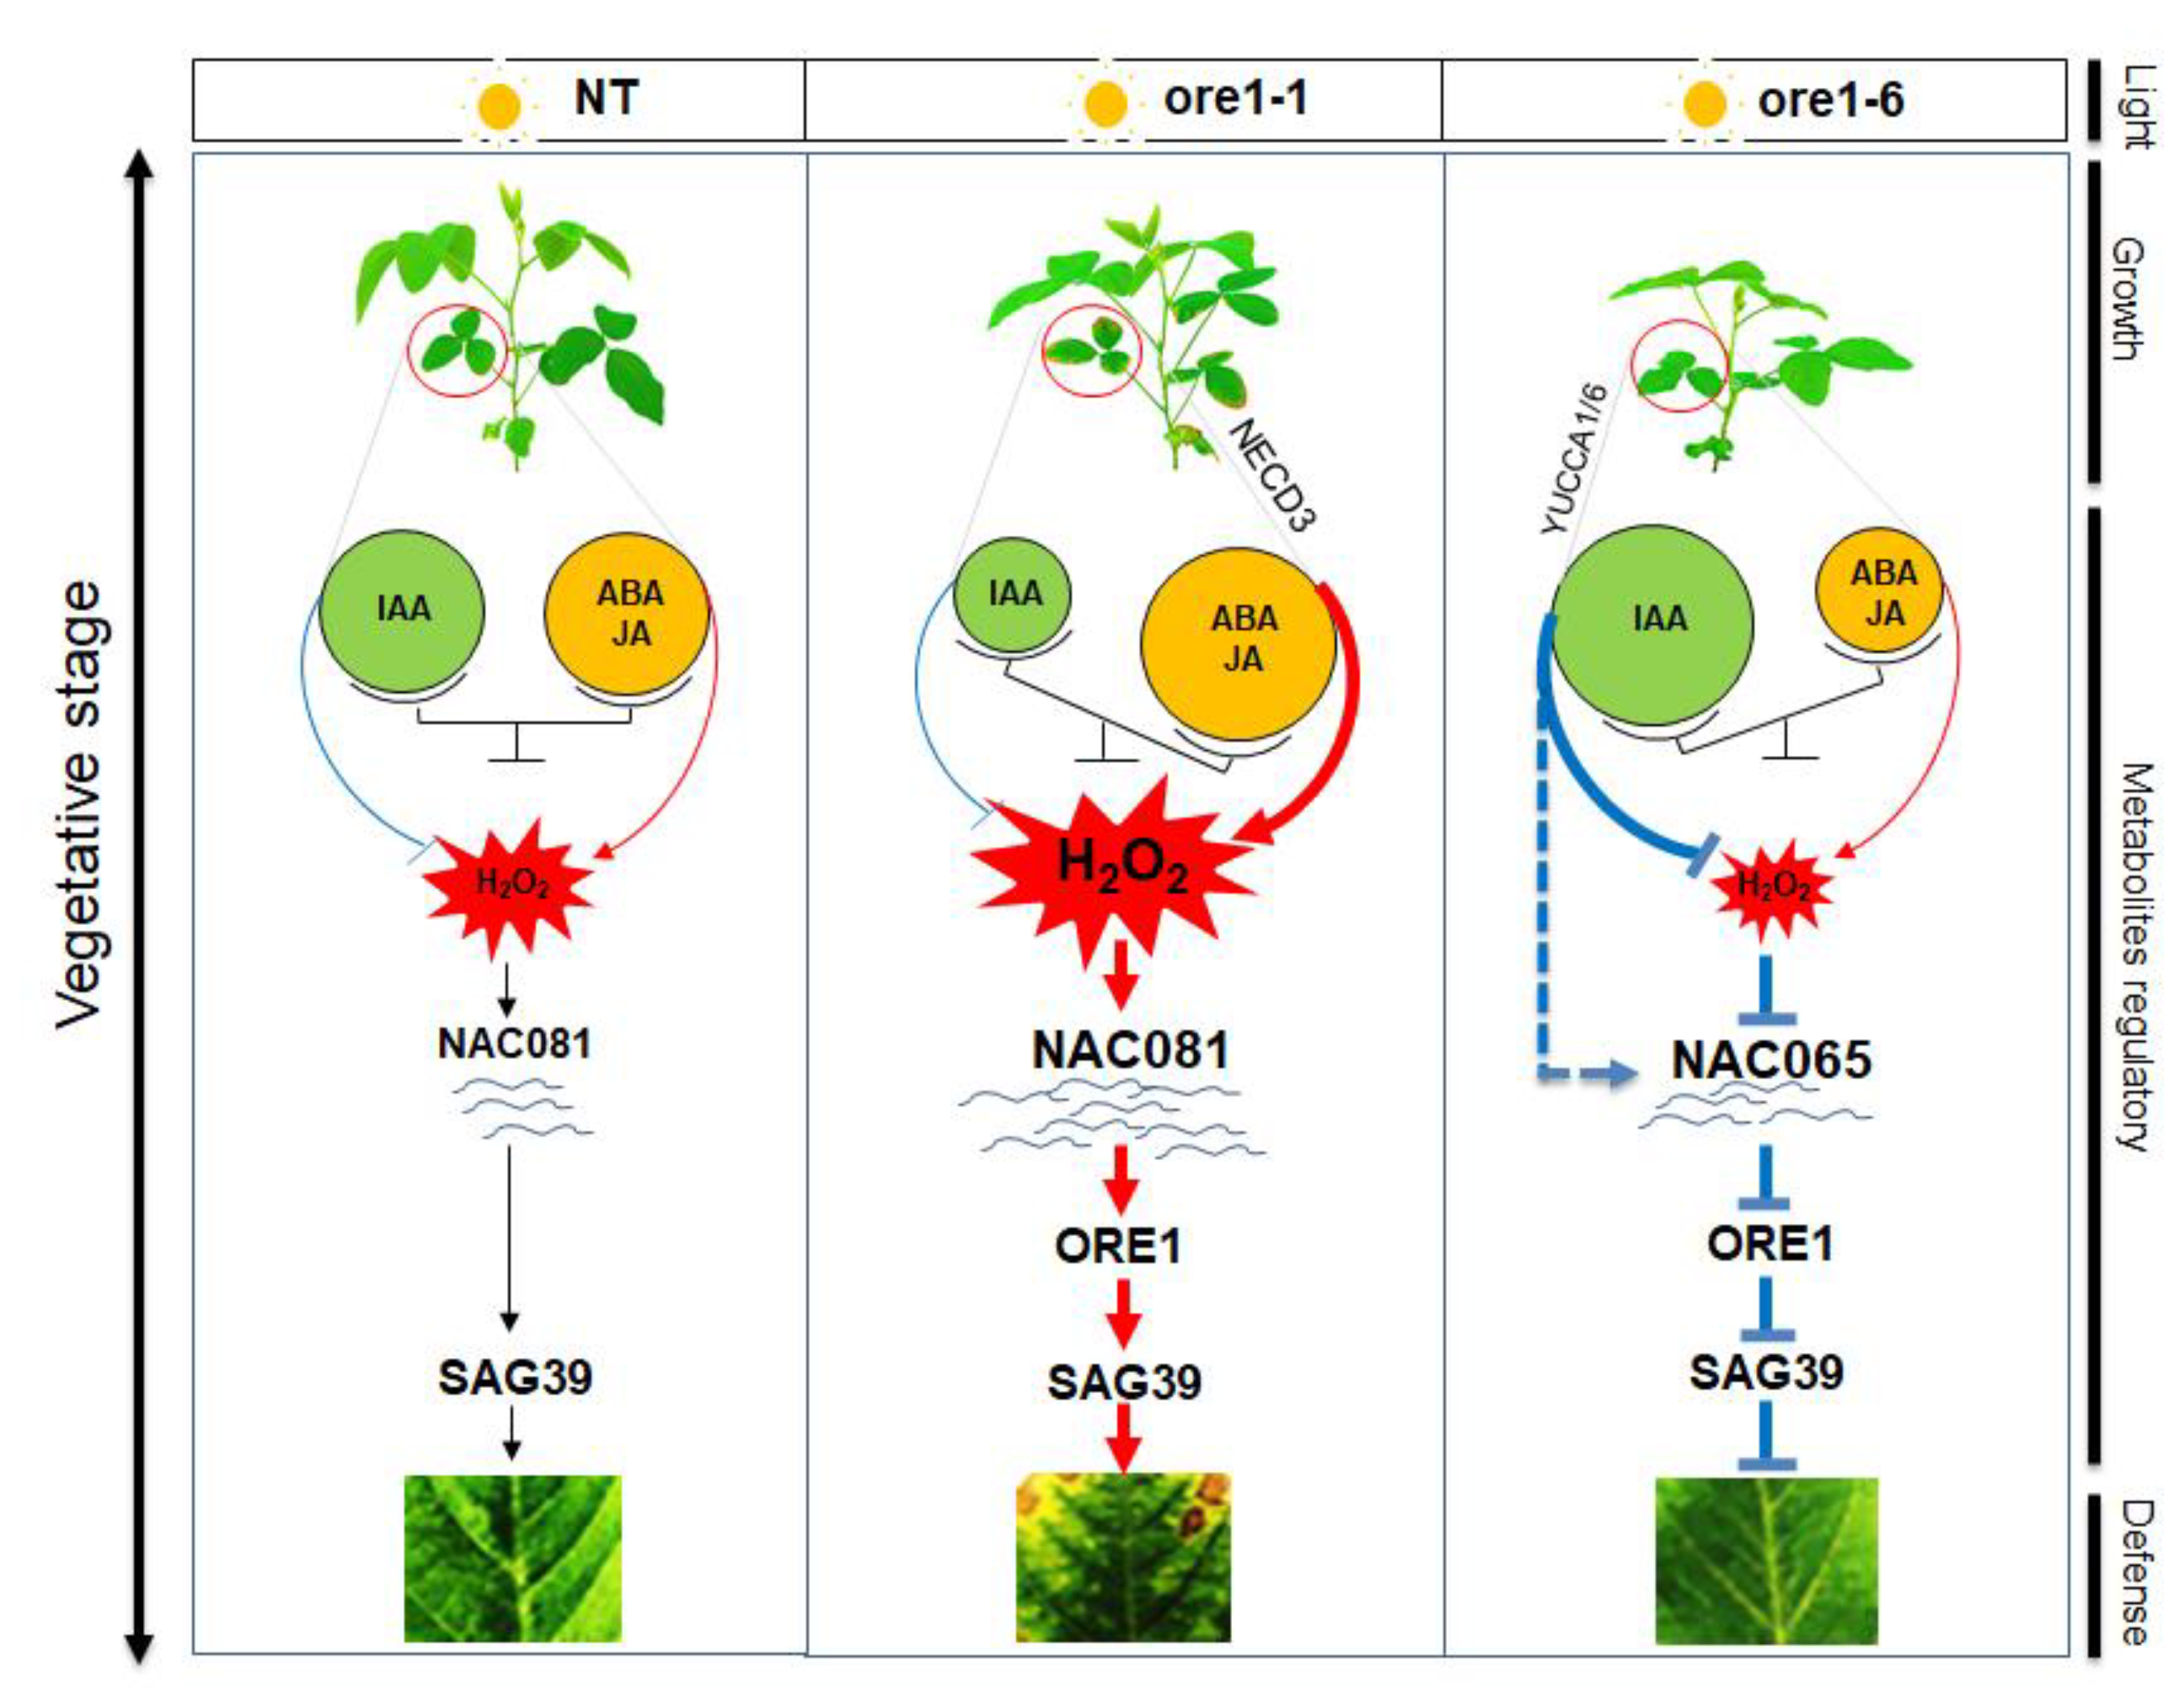
3.6. Downstream Events in the Transcription Factor NACs Regulate Leaf Senescence and Cell Death in the Atore1-Expressing Soybean

It has been known that NAC transcription factors are mediators of responses to a range of developmental and environmental signals. In soybeans, GmNAC081 and GmNAC030 are coordinately regulated in response to several different stresses, cell death inducers, hormone signals, and developmentally programmed leaf senescence [37,38,39,40]. Although, several studies on the opposing function of GmNAC081 and GmNAC065 in the senescence mechanism have been known [40,41]. In total, we assembled two NAC transcription factors that are most likely to be direct targets of GmNAC081 and GmNAC065 in the differentially expressed leaf senescence. We analyzed GmNAC081 and GmNAC065 expression with the qPCR, and the results show that these genes have opposite expression trends: upregulation at leaf senescence and downregulation at delay senescence in the pre-mature leaf. The results show that GmNAC081 was remarkably upregulated in the leaf senescence of the ore1-1 line (p < 0.05), while it was down regulated in the ore1-2 and ore1-6 lines (Figure 5A). Consistency was shown between the behavior of this gene in the expression in close relationship to GmARF2 (Figure 5C,E) with those induced by At-ore1 expressed in soybean plants. By contrast, GmNAC065 was upregulated in the ore1-6 line (Figure 5B,F) and negatively regulated by At-ore1 (Figure 5D), which is considered to be the stay-green leaf phenotype. Accordingly, GmNAC081 and GmNAC065 targeted functionally contrasting sets of downstream SAGs [40,41], thus further indicating that GmNAC081 and GmNAC065 regulators function inversely in developmental leaf senescence.

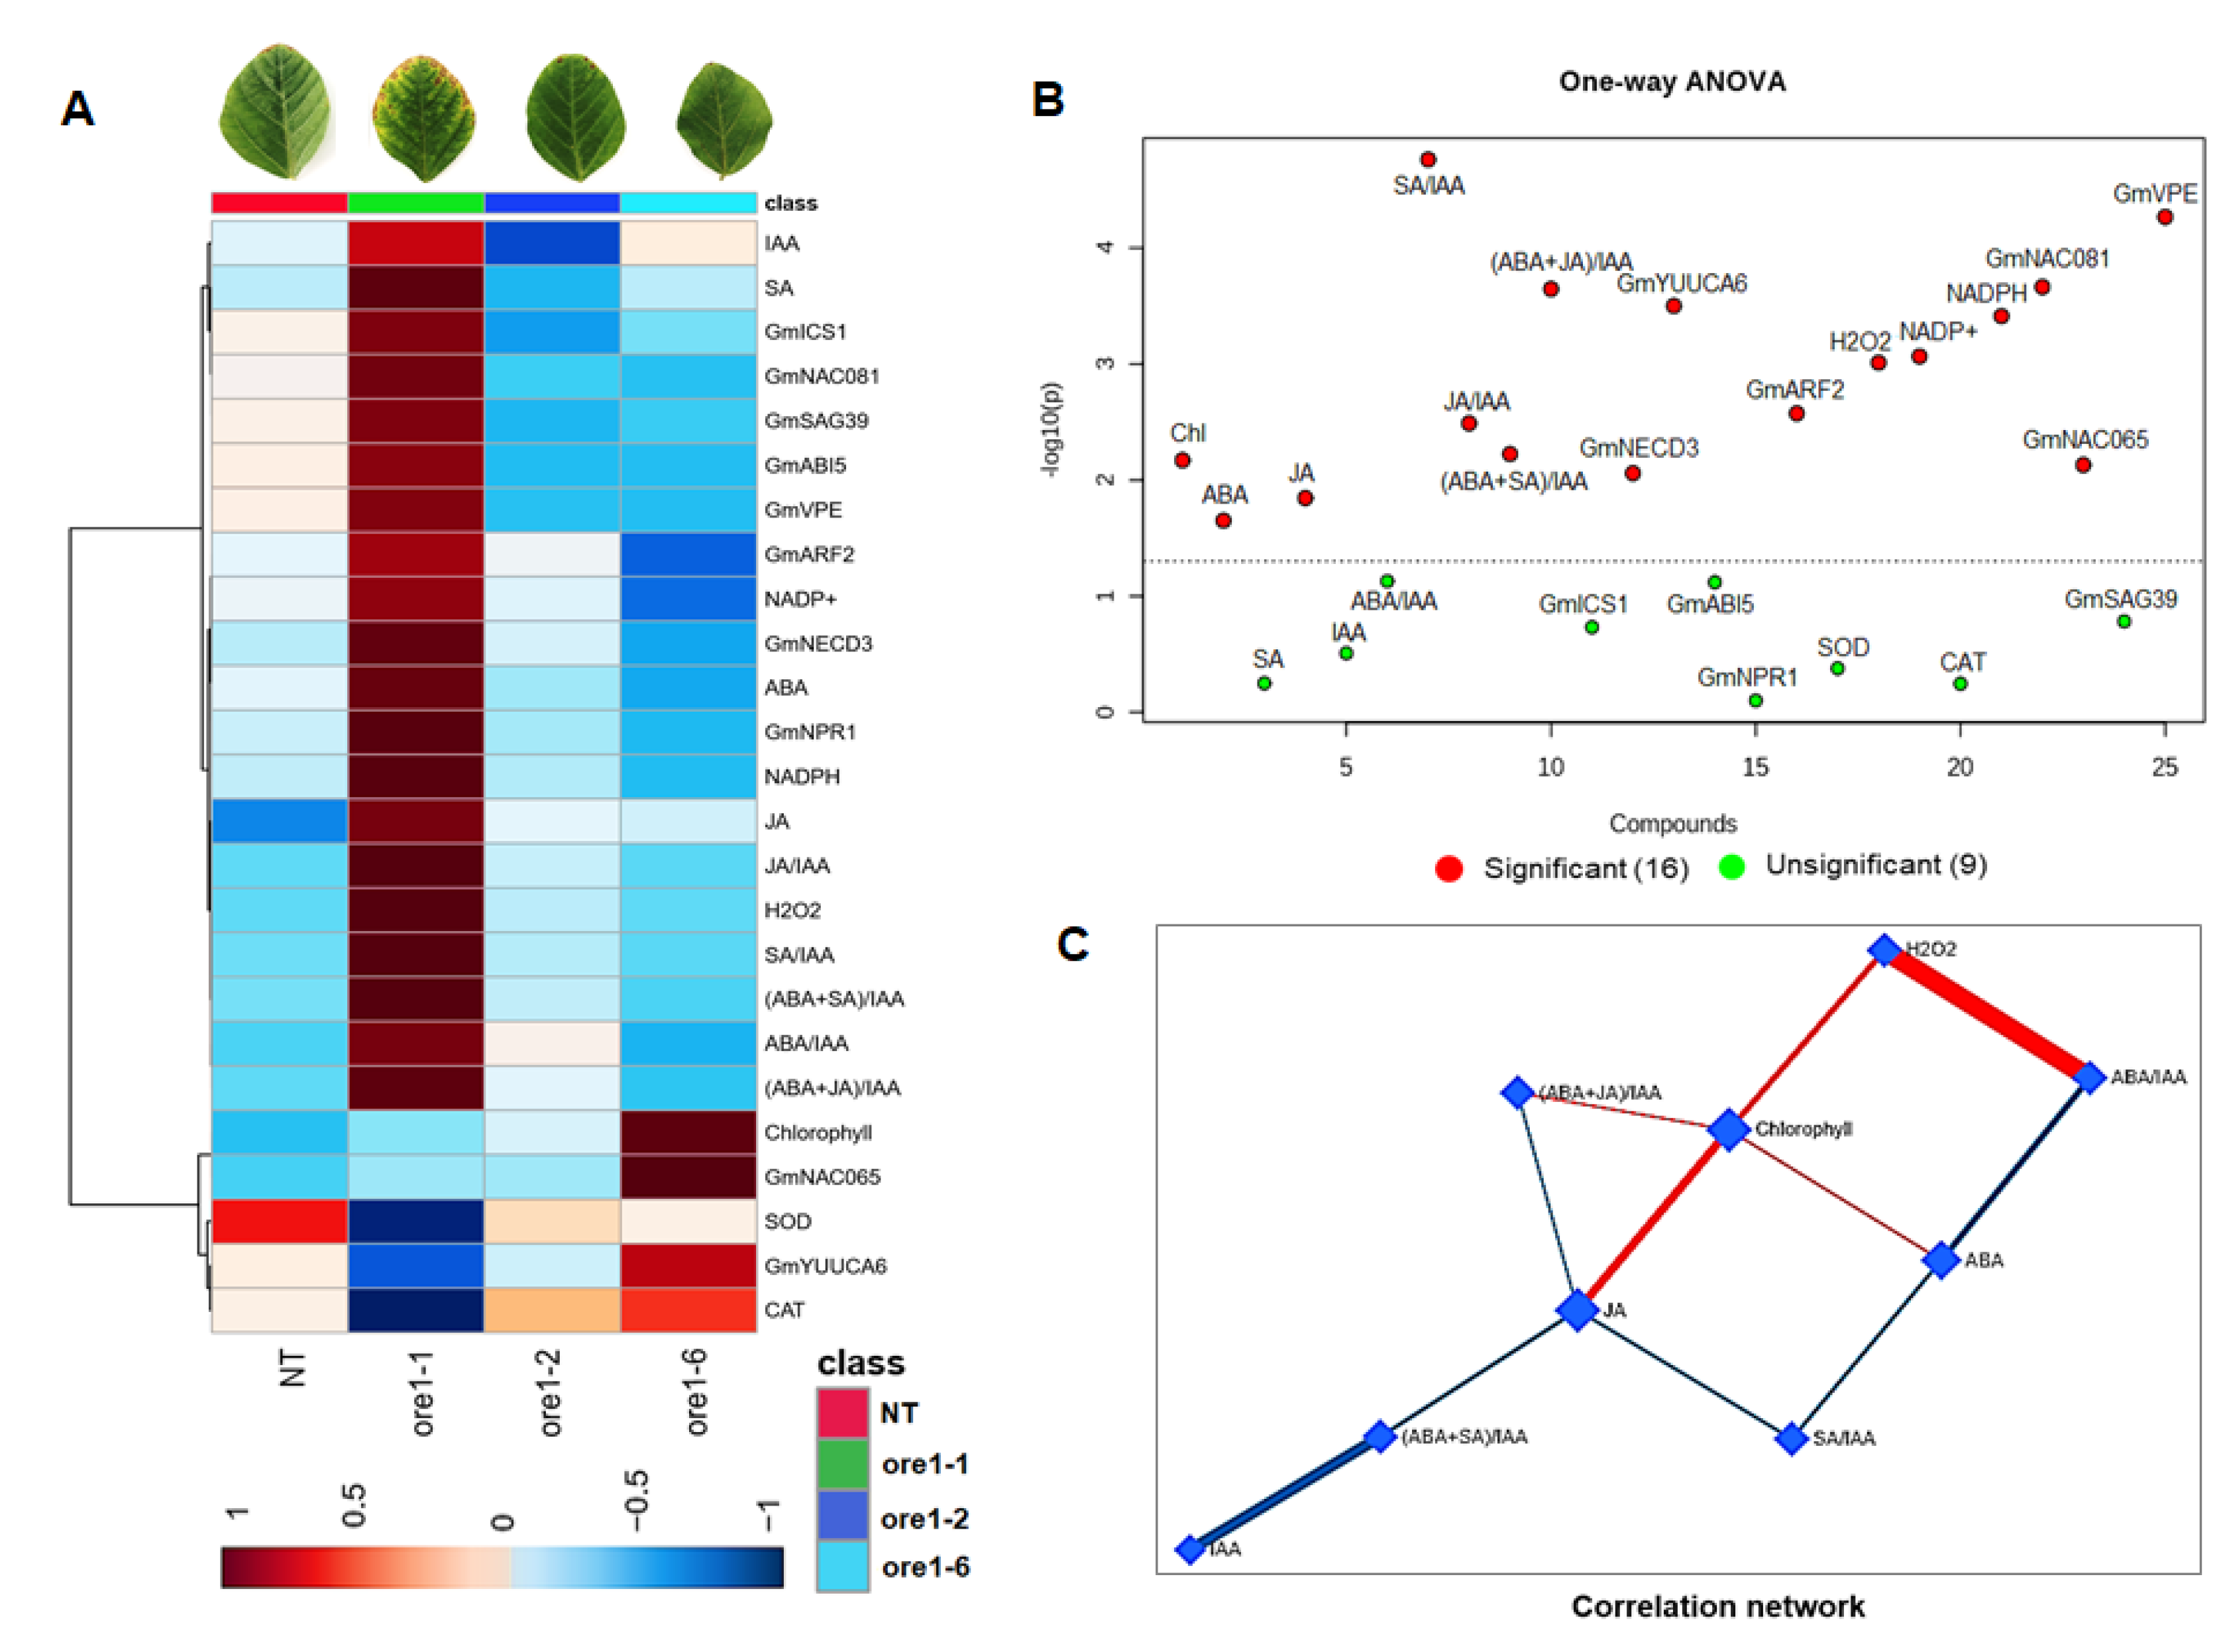
3.7. Identification of the Regulator Factors of Leaf Senescence in Atore1-Expressing Soybeans

We analyzed leaves of Atore1-expressing soybeans for metabolites and genes that are differentially expressed in ore1 lines. By comparing the heatmap visualization to identify the biochemicals in the ore1 lines, we have assembled a list of 16 metabolites and 9 genes that are most likely to be direct targets of the At-ore1 gene (Figure 6A). Among these, hormones (ABA, SA, and JA) and their synthesis- and signaling-related genes, H2O2, and the cell death inducer (GmVPE) are most represented in the ore1-1 line. However, most of the metabolites and genes decline in the ore1-2 and ore1-6 lines. There was consistency between the behavior of chemicals in ore1 plants, with those induced by At-ore1 tending to be highly accumulated in the pre-mature leaf of the ore1-1 line. By contrast, those that were suppressed by At-ore1 tended to be unchanged in the ore1-2 and ore1-6 lines. Notably, most of the identified PCA corresponded to those modulated at senescence, thus highlighting the impact of the At-ore1 at its highest content and expression level. We also found that some genes were strongly expressed during leaf senescence such as GmNECD3, GmYUUCA6, GmARF2, GmNAC081, and GmVPE (Figure 6B). In addition, metabolites that were found to largely accumulate during leaf senescence consist of ABA, JA, H2O2, NADP+, and NADPH. Further, the correlation network between these hormones and chlorophyll from the wild-type and ore1 lines are shown in Figure 6C and Figure S9.
Interestingly, pathway analysis revealed five metabolic pathways that have an impact on the chlorophyll, carotenoid, glutathione, tryptophan, glyoxylate and dicarboxylate, and nicotinate and nicotinamide metabolisms. Consequently, enrichment analysis showed that the tryptophan metabolism and the glyoxylate and dicarboxylate metabolism were the most significantly represented functional categories for IAA and H2O2 in Atore1-expressing soybeans (Figure S9).

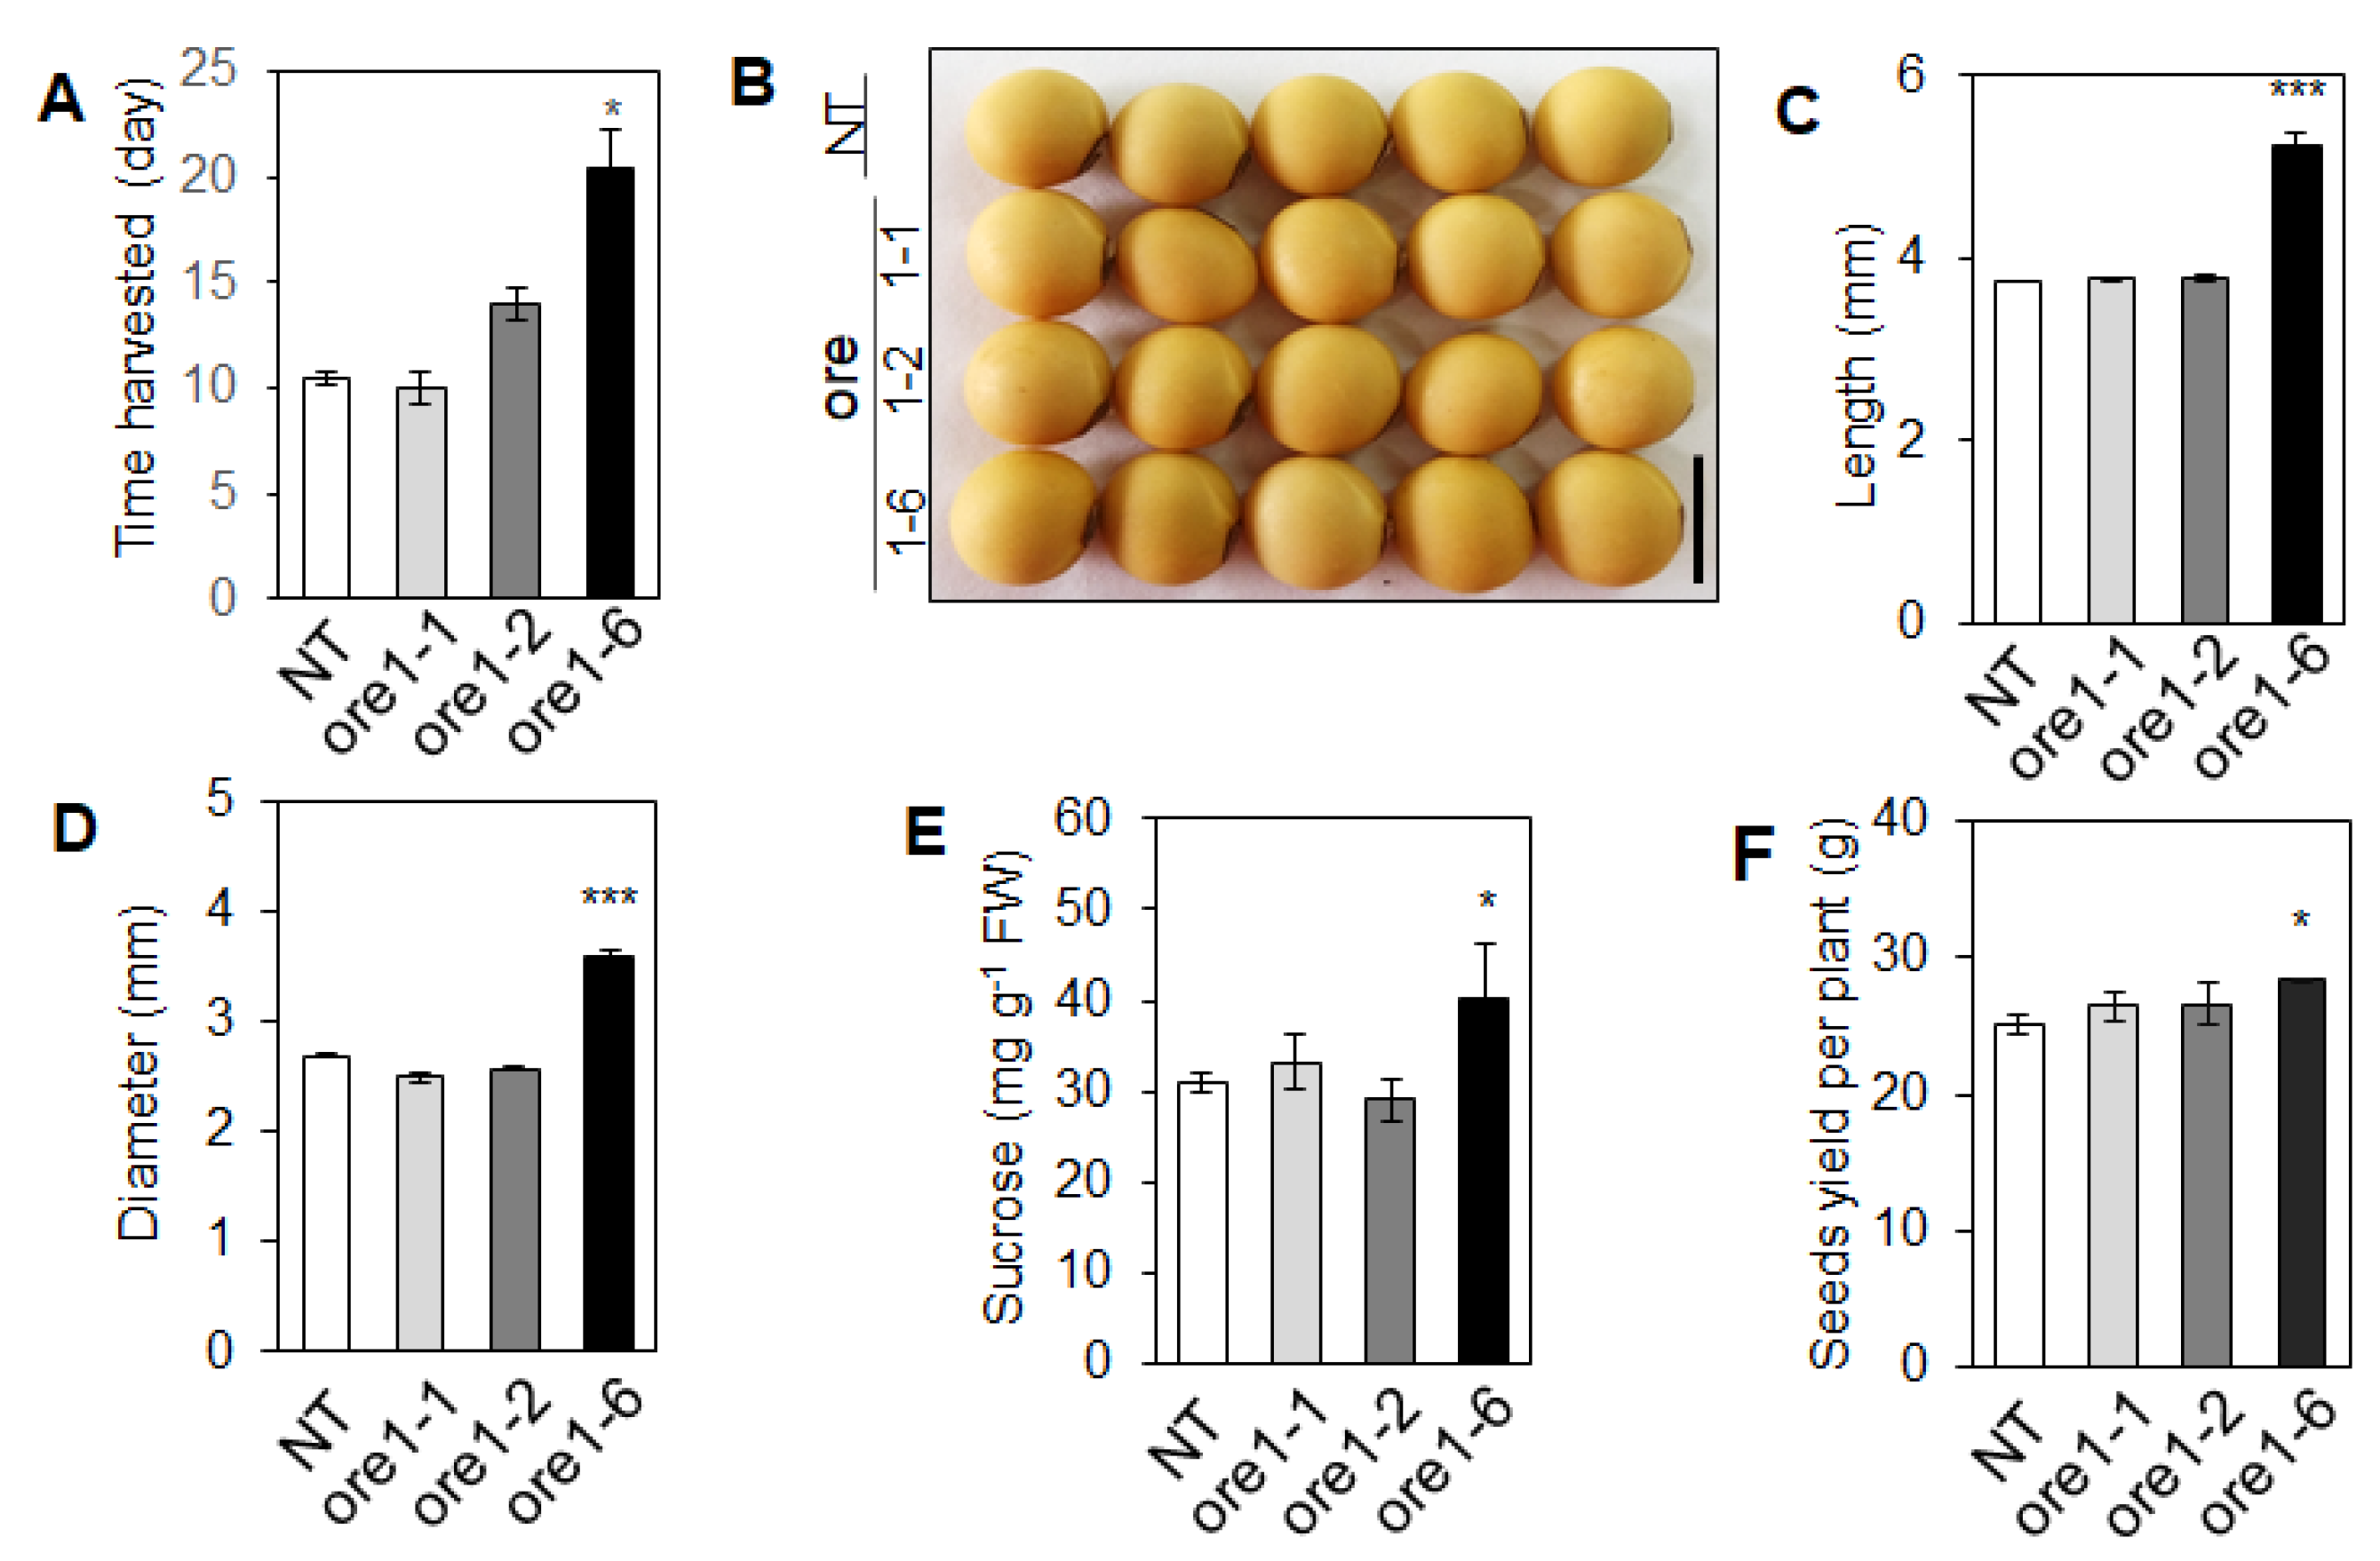
3.8. At-ore1 Induces Seed Yield in Soybeans by Modulating the Photosynthetic Complexes

Although Kim et al. (2009) [8] observed a delayed leaf senescence syndrome in the loss-of-function that harbors a 5-bp deletion in the ORE1 gene, a longevity-related phenotype was distinguished by Woo et al. (2004) [11]. As shown above, the At-ore1 showed the stable stay-green leaf phenotype in ore1-6 (Figure 7A,B), as well as extended the leaves’ longevity. By estimating the total chlorophyll, the wild-type plants lost 95% of their chlorophyll at harvesting time. However, the ore1-6 line exhibited that the chlorophyll content declined much more slowly, even at harvesting time, with over 70% green leaf being retained (Figure 7A–C), confirmed by the downregulating of senescence-associated gene GmSAG39 expression (Figure 7C,D). These data indicated that At-ore1 extended the lifespan of leaves by inhibiting age-dependent senescence in soybeans.
Furthermore, we were interested to know whether the At-ore1-delayed leaf senescence may regulate soybean seed yield. To address this question, we tested the pod harvest time and seed yield in the At-ore1 transgenic lines. Harvest time was estimated by the pod color approaching its mature yellow color. Results show that the ore1-6 line was extended by more than 10 days compared to the NT and ore1-1 line (Figure 8A). Notably, the seed size of the ore1-6 line was significantly increased by 39% in length and 33% in diameter (Figure 8C,D). In addition, sucrose was stored in the seeds of the ore1-6 line, and in a greater amount than that of the NT, ore1-1, and ore1-2 lines (Figure 8E). Finally, we found that ore1-6 line was able to delay leaf senescence which resulted in increased seed yield compared to NT (Figure 8F). These data support our finding that the At-ore1 expressed in soybeans contributes to leaf longevity and improved seed yield.

4. Discussion

Leaf senescence is regulated by the NAC protein ORESARA1 (ORE1), which is a key transcription factor regulating leaf senescence in plants [6,7]. The lack of an NAC2 function extends plant longevity under oxidative stress conditions [11]. Therefore, determining the thresholds of regulatory mechanisms at which ORE1 functionally switches from green to leaf senescence would provide valuable insight into the underlying mechanisms of plant aging. Accordingly, one of the aims of the present study was to test the hypothesis that the expression of the At-ore1 gene would delay leaf senescence in soybeans. The present study thus assessed preferentially the expression of the Atore1-responsive hormone balance and the ROS-NAC-signaling regulatory circuit on leaf senescence in transgenic soybean plants.
Loss-of-function mutants deficient in Arabidopsis ORESARA1 (ORE1) display a variety of phenotypes, suggesting that the NAC2 with redundant functions probably plays an important role in leaf senescence [7,11,35,42]. Mutant Atore1 delayed senescence, while its overexpression of the wild-type (ORE1) gene increases in senescence [7,8]. Consistent with Woo et al. (2004) [11], we report that the Atore1 gene confers tolerance to oxidative stress, thereby delaying leaf senescence; however, the regulatory mechanism needs to be elucidated. Indeed, the ore1-2 and ore1-6 lines delayed leaf senescence, except that differences in the leaf senescence of the ore1-1 line were as striking in this study (Figure 1 and Figure 2A). In plants, accumulating evidence indicates that phytohormones play a positive role in leaf senescence [2,19,43]. The current data show that ABA plays a positive role in leaf senescence, suggesting that ABA might be an ideal target for modulating leaf senescence in soybeans. The delay in leaf senescence could be generally explained as ABA-dose-dependent responses and ABA interactions with other hormones [26,40,43]. Of the many networks involved in leaf senescence, the present study focused on the At-ore1-responsive hormone balance, such as ABA and IAA, which plays an important role in leaf senescence [5,33,36]. The results of several studies have supported the notion that a more direct cross-talk between ABA and auxin has focused on genetic analysis of the hormones’ transcriptional responses [44]. For example, IAA-inactivated ABA-induced Aux/IAA response factor 2 (ARF2) [35,36,45] is a transcriptional model for the integration of the transduction signal process of leaf senescence and plant development. In the present study, in the ore1-1 line, the At-ore1 gene induced the expression of GmNECD3 and GmICS1 (Figure 3A,B and Table 1) and repressed the expression of IAA-synthesis-related gene YUCCA6 (Figure 3C). This result suggested that the antagonistic interaction of ABA/SA with IAA was indicative of a highly correlated network. In turn, in the ore1-6 line, endogenous IAA was largely accumulated by a reduction in ABA/SA/JA levels and ROS accumulation (Figure 4B,C), thereby alleviating the leaf senescence (Figure 1). It is worth noting that there was a remarkable difference in leaf senescence between the ore1-1 and ore1-2 and ore1-6 lines (Figure 1). These might be caused by the T-DNA insertion of At-ore1 in transgenic lines, leading to an effect on gene interaction and changing the IAA hormone balances of ABA/IAA and SA/IAA (Table 1). Furthermore, elevated IAA levels suppressed ABA/SA production (Table 1), potentially through a feedback loop for GmARF2 expression [35]. Therefore, the ore1-1-involved hormone balance suggested that the antagonistic interaction of ABA with IAA was strongly activated. In addition, results indicated that the antagonistic interaction of ABA and IAA was involved in GmARF2 modulation by fostering ABA-mediation during leaf senescence.
Although chlorophyll catabolic genes (CCGs), NON-YELLOWING/STAYGREEN (NYEs/SGRs), are general regulators of chlorophyll degradation, leaf senescence caused by rapid chlorophyll (Chl) degradation is a characteristic of the leaf aging process [2,46,47,48,49,50,51]. In Arabidopsis, ectopic expression of SGR1 in fully greened leaves reduces the abundance of Chl-binding proteins in PSI/II and the light-harvesting complex (LHC; [46]), indicating that SGR1 directly attacks the pigment–protein complexes, and the Chl-depleted apoproteins may then be immediately degraded in the thylakoid membranes [48,50,51]. SGR1 removes magnesium from Chla as the first step in initiating Chl degradation [17], consistent with the lower Chla:Chlb ratio in the ore1-1 line (Figure 2D). In the ore1-1 line, At-ore1-mediated GmSGR1 expression reduced Chl content (Figure 2H,I and Figure S5), along with the depletion of rubisco large subunits (RLS) and rubisco small subunits (RSS) and PSI, PSII, and LHCII trimmers (Figure 2E–I). A downregulation of GmSGR1 in ore1-2 and ore1-6 showed that the retention of Chl within the stable Chl-binding protein was higher compared to the ore1-1. In this respect, At-ore1 potentially regulating GmSGR1 expression would be a prerequisite for Chl degradation. Indeed, the absence of SGR1 during senescence indirectly causes the retention of Chl within the stable apoprotein and PSII activity [46,52]. It has been reported that the different transcription factors associated with ABA-antagonized IAA targeted CCG expression during Chl breakdown [3]. For instance, Aux/IAA response factor 2 (ARF2), or ABA-INTENSIVE 5 (ABI5), belonging to the bZIP transcription factor [53], was found to bind to the promoters of ANAC092/ORE1 [13], NYC1, and NYE1 to accelerate Chl degradation [12,54]. In the present study, Atore1 regulates the transcription of the ABA synthesis gene (e.g., GmNECD3; Figure 2A), thereby providing a venue for the GmARF2 signal to activate GmSGR1 expression (Figure 2H and Figure S7) in ABA production. Moreover, a synergetic and significant interaction between ABA and GmARF2 for ABA-transduction signaling was observed in the ore1-1 line. Accordingly, the ORE14/ARF2-10 mutant implicated a regulator delay senescence modulated by the inhibition of ABA and H2O2 [35,36]. It is plausible to propose that GmARF2 plays a major role in ABA-signaling-enhanced SGR1 expression during leaf senescence. This result suggests ABA triggered Chl degradation likely via coordinated regulation of the early and key steps of the Chl degradation pathway. Furthermore, NAC2/ORE1 promotes ABA-induced leaf senescence through the trifurcate feed-forward pathway comprising ABI5 [2,12,49]. Its upstream regulator, ABI5, also regulates diverse functions including ABA signaling, stress responses [2], and leaf senescence [12]. Given that At-ore1 triggers leaf senescence and ABA-based plant defense signaling, it is reasonable to conclude that GmSGR1-mediated At-ore1 could be responsible for ABA production and the action of ARF2/ABI5 signaling, thereby functioning as a crucial ABA regulatory pathway of leaf senescence. However, the mechanism by which the At-ore1- or ABA-elicited GmARF2 signaling activates GmSGR1 remains unclear, thus requiring further confirmation.
In addition, NAC2/ORE1 has been reported to stimulate a hormone signaling pathway that triggers SAG expression, which in turn induces leaf senescence [2,13,49]. In the present study, severe leaf senescence in ore1-1 line-mediated At-ore1 expression was concomitant with the highest ABA and ROS accumulation (Table 1, Figure 2H and Figure 4). ROS (H2O2 mainly) and ABA are key regulatory factors that mediate the progression of leaf senescence; for instance, exogenous H2O2 or ABA induce leaf senescence [43,55,56]. Furthermore, the interplay between ABA, ROS, and NAC transcription factors has been suggested to function as an integrative process in regulating leaf senescence [2,11,57]. In the present investigation, the At-ore1 expression in the ore1-1 line was concomitant with ROS accumulation (Figure 4B,C) and accompanied by a pattern of respiratory burst oxidase homologs (Rboh)-E, a producer of H2O2 (Figure 4D) Additionally, the activation of the ABA-synthesis-related gene GmNCED3 (Figure 3A) was induced in an ABA-dependent manner (Table 1). The interaction of At-ore1 is enhanced by the binding of NAC2 to the ABA synthesis gene (e.g., NCED3; [58,59] and a responsive ROS signal (e.g., Rboh-E; Figure 4D), thereby providing a venue for ABA production. In turn, elevated endogenous ABA levels increased GmRboh-E in the present study, potentially through a feedback loop for ROS production triggering leaf senescence [60]. Indeed, ABA enhances the activity of Rbohs (i.e., NADPH oxidase), thereby promoting the generation of apoplastic ROS, a regulator of leaf senescence [57,59]. Moreover, this study confirmed that ABA- or H2O2-induced leaf senescence in three soybean ORE1 genotypes coincided with At-ore1 and GmSAG39 expression (Figures S5, S6 and S8). This suggests that At-ore1 triggers GmSAG39 expression through a regulatory network that involves cross-talk with ABA- and H2O2-dependent signaling pathways. An increasing amount of evidence demonstrates that At-ore1 is the senescent sensor to be described for ABA- and/or H2O2-regulated genes, and that At-ore1 is the master co-activator of SAGs [2,3,61]. It is therefore tempting to characterize the At-ore1 mutant in the ABA/IAA balance regulating the H2O2 signaling circuit network that triggers an appreciating and diverse downstreaming of leaf senescence.
Senescence can be triggered by multiple yet interconnected signaling pathways, accompanied by extensive transcriptional reprograming [4,40,62,63]. A regulatory network involving NAC2/ORE1 is one of the regulators that has well-illustrated integration signals during leaf senescence. In soybeans, GmNAC081 is upstream of SAGs in ABA-induced leaf senescence and cell death, as a key component linking ABA signaling [39,40,64]. In the present study, in the ore1-1 line, Atore1 induced exclusively by ABA or H2O2 (Figures S5 and S6) closely paralleled the level of GmNAC081 expression (Figure 6A). Despite the Atore1-ABA-GmNAC081 regulatory cascade, several lines of evidence indicate that the molecular mechanism underlying GmNAC081’s positive regulation of leaf senescence is distinct from the H2O2-mediated connection of ABA, but not for SA, because overexpressing GmNAC081 inhibited SA synthesis [40]. Therefore, to untie the relationship between H2O2 accumulation, the expression of NAC2 and GmNAC081 targets, and the development of senescence symptoms, it might be important to perform H2O2 stress experiments. Indeed, H2O2 was largely induced by At-ore1 and GmNAC081 expression (Figure S8C,D); thus, H2O2 is a downstream target of the NAC transcription factor [61]. The pattern is of At-ore1- and GmNAC081-responsive H2O2 followed by ABA-induced leaf senescence and cell death (Figure 2H and Figure 4). Apart from the knowledge that GmNAC081 also integrates with other transcription factors, the regulation of cell-death-related gene expression (e.g., GmNAC030; [39,40]) is a regulator of the cell death response, the events downstream of GmNAC81 that could account for the execution of the programmed cell death. In the present investigation, in addition to describing H2O2 as a molecular partner of GmNAC81, we identified the downstream targets of this interaction. Significantly, At-ore1-mediated GmNAC81 induces the expression of caspase-1-like VPE (Figure 4E), underlying a mechanism for the execution of H2O2-induced cell death (Figure 4 and Figure S8). The upregulation of ABA leads to the induction of Atore1 (putative GmNAC131; [63]) and GmNAC81, which may cooperate with each other to activate GmVPE expression and cysteine protease activity (Figure 4E–G). VPE is a cysteine protease that exhibits a caspase-1-like activity that executes plant-specific cell death via disintegration and collapse of the vacuole [65], initiating the proteolytic cascade in programmed cell death [40,65]. Accordingly, GmNAC81 is an upregulator of VPE expression in the stress-induced, NPR-mediated cell death signaling pathway [10,48,55], because GmNAC081 can be bound to a specific cis-regulatory element (TGTG; T/CG) on the VPE promoter to activate VPE expression [39,65]. Collectively, these results suggest that GmNAC81 and GmVPE constitute a shared regulatory cascade for ABA-induced and natural leaf senescence in soybeans. As further evidence for this hypothesis, our previous and current data show that during both age-dependent and ABA-induced leaf senescence, GmVPE and GmNAC81 are coordinately upregulated ([39]; Figure 4).
Moreover, a recent study identified several NAC transcription factors contrasting roles of GmNAC065 in natural senescence, plant development, multiple stresses, and cell death responses [41,57,63]. GmNAC065 was identified as a drought-induced gene in soybean leaves at the late vegetative V6 stage and reproductive R2 stage [66]. GmNAC065 has been shown to widely respond to drought stress, ER stress, and hormone SA [41,63]. As a negative regulator of leaf senescence [63], further evidence includes that the induction of GmNAC065 by drought may modulate leaf longevity and the stay-green phenotype under stress conditions [41]. The ore1-6 exhibited delayed leaf senescence possiblly related to GmNAC065 expression through antagonism between ABA and IAA, as part of hormone-mediated ROS regulation (Figure 4 and Figure 6, and Figure S5). Consistent with this, elevated IAA-mediated GmNAC065 may reduce ROS accumulation, as well as be accompanied by SOD and CAT activities (Figure 5B); these antioxidants were unchanged compared to the wild type and ore1-1 line. Overall, GmNAC065 is co-expressed with genes involved in plant maintenance and redox homeostasis, possibly sharing a redox-balanced environment (e.g., the NADPH/NADP+ ratio, Figure 5C) that results in a senescence delay since low ROS levels activate signal pathways that mediate stress escapes. Collectively, these findings suggest that IAA integrates a negative senescence regulatory pathway via the activation of GmNAC065 genes (upregulated in ore1-6 line) and, consequently, the downregulation of GmNAC081-GmVPE and their downstream targets, executors of stress-triggered programmed cell death. Finally, IAA might function at late developmental stages to prevent senescence from going too fast to ensure the completion of the contrasting roles of GmNAC065 and GmNAC081 in the extended leaf longevity of the ore1-6 line (Figure 5 and Figure S5).
It is promising to see that yield increases via delaying leaf senescence have been achieved in many plants. A positive correlation between delays in leaf senescence, or the stay-green trait, and higher yields has been observed in several cereal crops [54,67,68] although this was not always the case. Stay-green crops maintain photosynthesis capacity for a longer time after anthesis, have an extended grain-filling period, and consequently, higher biomass accumulation and grain yields. Recent studies show the stay-green loci being molecularly dissected by the mutation of NAC transcription factors in plants leads to a significant delay in leaf senescence and yield increases [69,70]. In the present study, the At-ore1 mutant in the ore1-6-line-delayed leaf senescence is attributed to a greater increase in the harvesting time and seed size (Figure 8A–D) compared to the wild-type (NT) and ore1-1 line. Accordingly, high sucrose accumulated in seeds conferred by higher seed yields in the ore1-6 line (Figure 8E,F). Our results provide evidence that the At-ore1 gene could control leaf senescence through ABA, the auxin pathway and GmNAC065 transcription regulation, which extend leaf longevity and increase grain yields in soybeans (Figure 9).

5. Conclusions

In conclusion, our data suggest that At-ore1 has an inverse role in leaf senescence depending on the ABA/IAA balance, possibly through an increase in GmNAC081- or GmNAC065-mediated H2O2 regulation. Further studies on the identification of At-ore1 downstream target genes or interacting proteins will help to dissect the senescence pathways involved in the Atore1-mediated control of leaf longevity in soybeans.

Supplementary Materials

The following supporting information can be downloaded at: https://www.mdpi.com/article/10.3390/agronomy12092110/s1, Figure S1. Construction of pB2GW7-Atore1 vector. The At-ore1 gene was transferred from the cloning vector pENTRTM/D-TOPO- At-ore1 to the pB2GW7 vector by LR reaction. Plasmid harboring pB2GW7-Atore1 was transferred into A. tumefaciens EHA105 by the electrical impulse method. Figure S2. Screening the soybean transgenic plants by painting phosphinothricin (PPT) at 5 mg mL−1 after 7 days. The leaf was tested by PPT 0.5 mg mL−1 as shown the yellow color in wild-type, but not exhibited in transgenic lines. Figure S3. Phenotypic change in specific leaves tissue senescing of wild-type (NT) compared to transgenic lines. (A) Wide-type, (B) ore1-1, (C) ore1-2 and (D) ore1-6. The detached leaves 3 senescent at the V3-vegetative stage. Data are represented as mean ± SE of three biological replicates (n = 3). Figure S4. Relationship between chlorophyll and hormones, ROS, and redox. (A) ABA and total chlorophyll, (B) SA and total chlorophyll, (C) JA and total chlorophyll, (D) IAA and total chlorophyll, (E) ABA/IAA ratio and total chlorophyll, (F) SA/IAA ratio and total chlorophyll, (G) JA/IAA ratio and total chlorophyll, (H) H2O2 and total chlorophyll, (I) NADP+/NADPH ratio and total chlorophyll. Among these, auxin is a positive relationship to chlorophyll in wild-type and transgenic lines. Data are represented as mean ± SE of three biological replicates (n = 3). Figure S5. Effect of ABA in soybean transgenic plants under leaf disc condition. (A) The detached 3rd fully expanded leaves of 6-week-old plants before treatment. (B) Shown are wild-type and transgenic lines inoculated with ABA 0.1 mM and NAP 0.1 mM (Naproxen, ABA inhibitor). (C) Total chlorophyll content measurement after 72 h. (C,D) Transcript expression levels of GmNAC081 and GmSAG39 was expressed in ore1 lines compared to the wild-type under ABA and NAP treatments. Data are represented as mean ± SE of three biological replicates (n = 3). Asterisks indicate significant differences from wild-type (NT) and transgenic lines according to Tukey’s t-test; * p < 0.05, ** p < 0.01, *** p < 0.001. Figure S6. Effect of ABA and IAA on wild-type and soybean transgenic lines. (A) Whole leaf of plants 5-week-old genotypes. The leaf 3 was highlighted in yellow color visualization. (B) Total chlorophyll content was detected in leaf 3 measurement after 72 h. (C) Transcript levels of At-ore1 and GmSAG39 genes under ABA and IAA treatments were determined by quantitative real-time PCR. Data are represented as mean ± SE of three biological replicates (n = 3). Asterisks indicate significant differences from wild-type (NT) and transgenic plants according to Tukey’s t-test; * p < 0.05, ** p < 0.01, *** p < 0.001. Figure S7. Effect of ABA and IAA on chlorophyll synthesis and its degradation related genes in wild-type and transgenic lines. (A) Relative expression of chlorophyll synthase (CHLG)-related chlorophyll synthesis. (B) Soybean chlorophyll catabolic genes (CCGs) including STAYGREEN1 (GmSGR1) and (C) NON-YELLOWING COLORING 1 (GmNYC1) under ABA and IAA treatments, was determined by quantitative real-time PCR. Four-week-old detached leaf (upper) or whole plants (lower) grown in same condition. Data are represented as mean ± SE of three biological replicates (n = 3). Asterisks indicate significant differences from wild-type (NT) and transgenic plants according to Tukey’s t-test; * p < 0.05, ** p < 0.01, *** p < 0.001. Figure S8. Effect of hydrogen peroxide on soybean transgenic plants. (A) The detached 3rd fully expanded leaves of 5-week-old plants after treated by H2O2 and DMTU (H2O2-scavenger). (B) Total chlorophyll content measurement after 3 days treatment. The leaf 3 of ore1-1 line was highlighted in yellow color visualization. (C) Regulation expression of GmNAC081 and (D) GmSAG39 in transgenic plants under H2O2 and DMTU treatments were determined by quantitative real-time PCR. Data are represented as mean ± SE of three biological replicates (n = 3). Asterisks indicate significant differences from wild-type (NT) and transgenic plants according to Tukey’s t-test; * p < 0.05, ** p < 0.01, *** p < 0.001. Figure S9. Pathway analysis of At-ore1 gene in soybean transgenic plants. (A) Pathway impact. (B,C) Metabolites set Enrichment for specific metabolites in pathway regulation. Data are represented as mean ± SE of three biological replicates (n = 3). Table S1. Nucleotides sequence of At-ore1 gene. Table S2. Sequences of oligonucleotide of At-ore1 gene included cis-regulatory element motifs identified. Table S3. Sequences of oligonucleotide primers used for the qPCR.

Author Contributions

V.H.L. carried out the experiment, interpreted data, and wrote the manuscript. T.H.A.N., T.T.B., H.T.K., V.D.T. and X.B.N. designed the vector construct and created the soybean transgenic lines. V.H.L., T.H.A.N., V.D.T., T.T.H.T. and X.B.N. prepared the original draft manuscript. T.D.N. and Y.S.C. designed the experiment and revised the manuscript. All authors have read and agreed to the published version of the manuscript.

Funding

This research was funded by the Ministry of Science and Technology (MOST) of Vietnam for grant code number NĐT.49.KR.18.

Institutional Review Board Statement

Not applicable.

Informed Consent Statement

Not applicable.

Data Availability Statement

Heatmap visualization, enrichment sets overview, pathway analysis, and correlation networks among biochemical defense markers such as chlorophyll, hormones, ROS, redox status, and transcriptional regulation were performed using MetaboAnalyst 5.0 (http://www.metaboanalyst.ca (accessed on 8 June 2022)). Identification of the amino acid sequence similarity between the Atore1 and NAC domain in soybeans was usedwith Blast/NCBI (https://blast.ncbi.nlm.nih.gov/Blast.cgi (accessed on 2 January 2022)). The position of Atore1 binding to cis-regulatory elements (CREs) was identified by PlantCARE (http://bioinformatics.psb.ugent.be/webtools/plantcare/html/ (accessed on 2 January 2022)).

Acknowledgments

We thank Tae-Hwan Kim and Mamun at Chonnam National University for their technical assistance in the analysis of metabolite profiles. We thank Dong-Won Bae at Gyeongsang National University for the analysis of hormones. We also thank Viet Cuong Han at School of Molecular and Life Sciences, Curtin University for grammar editing.

Conflicts of Interest

The authors declare no conflict of interest.

References

  1. Nooden, L.D.; Guiamet, J.J.; John, I. Senescence mechanisms. Physiol. Plant. 1997, 101, 746–753. [Google Scholar] [CrossRef]
  2. Gao, S.; Gao, J.; Zhu, X.; Song, Y.; Li, Z.; Ren, G.; Zhou, X.; Kuai, B. ABF2, ABF3, and ABF4 promote ABA-mediated chlorophyll degradation and leaf senescence by transcriptional activation of chlorophyll catabolic genes and senescence-associated genes in Arabidopsis. Mol. Plant 2016, 9, 1272–1285. [Google Scholar] [CrossRef]
  3. Balazadeh, S.; Riaño-Pachón, D.M.; Mueller-Roeber, B. Transcriptionfactors regulating leaf senescence in Arabidopsis thaliana. Plant Biol. 2008, 1, 63–75. [Google Scholar] [CrossRef] [PubMed]
  4. Breeze, E.; Harrison, E.; McHattie, S.; Hughes, L.; Hickman, R.; Hill, C.; Kiddle, S.; Kim, Y.-S.; Penfold, C.; Jenkins, D.; et al. High-resolution temporal profiling of transcripts during Arabidopsis leaf senescence reveals a distinct chronology of processes and regulation. Plant Cell 2011, 23, 873–894. [Google Scholar] [CrossRef]
  5. Kim, H.M.; Kim, H.J.; Vu, Q.T.; Jung, S.; McClung, C.R.; Hong, S.H.; Nam, H.G. Circadian control of ORE1 by PRR9 positively regulates leaf senescence in Arabidopsis. Proc. Natl. Acad. Sci. USA 2018, 115, 8448–8453. [Google Scholar] [CrossRef] [PubMed]
  6. Matallana-Ramirez, L.P.; Rauf, M.; Farage-Barhom, S.; Dortay, H.; Xue, G.-P.; Dröge-Laser, W.; Lers, A.; Balazadeh, S.; Mueller-Roeber, B. NAC transcription factor ORE1 and senescence-induced BIFUNCTIONAL NUCLEASE1 (BFN1) constitute a regulatory cascade in Arabidopsis. Mol. Plant 2013, 6, 1438–1452. [Google Scholar] [CrossRef]
  7. Balazadeh, S.; Siddiqui, H.; Allu, A.D.; Matallana-Ramirez, L.P.; Caldana, C.; Mehrnia, M.; Zanor, M.I.; Köhler, B.; Mueller-Roeber, B. A generegulatory network controlled by the NAC transcription factorANAC092/AtNAC2/ORE1 during salt-promoted senescence. Plant J. 2010, 62, 250–264. [Google Scholar] [CrossRef]
  8. Kim, J.H.; Woo, H.R.; Kim, J.; Lim, P.O.; Lee, I.C.; Choi, S.H.; Hwang, D.; Nam, H.G. Trifurcate feed-forward regulation of age-dependent cell deathinvolving miR164 in Arabidopsis. Science 2009, 323, 1053–1057. [Google Scholar] [CrossRef]
  9. Rauf, M.; Arif, M.; Dortay, H.; Matallana-Ramírez, L.P.; Waters, M.T.; Gil Nam, H.; Lim, P.; Mueller-Roeber, B.; Balazadeh, S. ORE1 balances leaf senescence against maintenance by antagonizing G2-like-mediated transcription. EMBO Rep. 2013, 14, 382–388. [Google Scholar] [CrossRef]
  10. Peng, Z.; Li, J.; Wen, X.; Guo, H. Ethylene-insensitive 3 is a senescence-associated gene that accelerates age-dependent leaf senescence by directly repressing miR164 transcription in Arabidopsis. Plant Cell 2013, 25, 3311–3328. [Google Scholar] [CrossRef] [Green Version]
  11. Woo, H.R.; Kim, J.H.; Gil Nam, H.; Lim, P.O. The delayed leaf senescence mutants of Arabidopsis, ore1, ore3, and ore9 are tolerant to oxidative stress. Plant Cell Physiol. 2004, 45, 923–932. [Google Scholar] [CrossRef] [PubMed]
  12. Kim, H.J.; Hong, S.H.; Kim, Y.W.; Lee, I.H.; Jun, J.H.; Phee, B.-K.; Rupak, T.; Jeong, H.; Lee, Y.; Hong, B.S.; et al. Gene regulatory cascade of senescence-associated NAC transcription factors activated by ETHYLENE-INSENSITIVE2-mediated leaf senescence signalling in Arabidopsis. J. Exp. Bot. 2014, 65, 4023–4036. [Google Scholar] [CrossRef] [PubMed]
  13. Qiu, K.; Li, Z.; Yang, Z.; Chen, J.; Wu, S.; Zhu, X.; Gao, S.; Ren, G.; Kuai, B.; Zhou, X. EIN3 and ORE1 accelerate de-greening during ethylene-mediated leaf senescence by directly activating chlorophyll catabolic genes in Arabidopsis. PLoS Gene. 2015, 11, 1005–1399. [Google Scholar] [CrossRef]
  14. Asad, M.A.U.; Zakari, S.A.; Zhao, Q.; Zhou, L.; Ye, Y.; Cheng, F. Abiotic stresses intervene with aba signaling to induce de-structive metabolic pathways leading to death: Premature leaf senescence in plants. Inter. J. Mol. Sci. 2019, 20, 256. [Google Scholar] [CrossRef]
  15. Lee, I.C.; Hong, S.W.; Whang, S.S.; Lim, P.O.; Gil Nam, H.; Koo, J.C. Age-Dependent Action of an ABA-Inducible receptor kinase, RPK1, as a positive regulator of senescence in Arabidopsis leaves. Plant Cell Physiol. 2011, 52, 651–662. [Google Scholar] [CrossRef]
  16. Quiles, M.J.; García, C.; Cuello, J. Differential effects of abscisic acid and methyl jasmonate on endo-proteinases in senescing barley leaves. Plant Growth Regul. 1995, 16, 197–204. [Google Scholar] [CrossRef]
  17. Liang, C.; Wang, Y.; Zhu, Y.; Tang, J.; Hu, B.; Liu, L.; Ou, S.; Wu, H.; Sun, X.; Chu, J.; et al. OsNAP connects abscisic acid and leaf senescence by fine-tuning abscisic acid biosynthesis and directly targeting senescence-associated genes in rice. Proc. Natl. Acad. Sci. USA 2014, 111, 10013–10018. [Google Scholar] [CrossRef]
  18. Mao, C.; Lu, S.; Lv, B.; Zhang, B.; Shen, J.; He, J.; Luo, L.; Xi, D.; Chen, X.; Ming, F. A rice NAC transcription factor promotes leaf senescence via ABA biosynthesis. Plant Physiol. 2017, 174, 1747–1763. [Google Scholar] [CrossRef]
  19. Zhao, Y.; Chan, Z.; Gao, J.; Xing, L.; Cao, M.; Yu, C.; Hu, Y.; You, J.; Shi, H.; Zhu, Y.; et al. ABA receptor PYL9 promotes drought resistance and leaf senescence. Proc. Natl. Acad. Sci. USA 2016, 113, 1949–1954. [Google Scholar] [CrossRef]
  20. He, X.-J.; Mu, R.-L.; Cao, W.-H.; Zhang, Z.-G.; Zhang, J.-S.; Chen, S.-Y. AtNAC2, A transcription factor downstream of ethylene and auxin signaling pathways, is involved in salt stress response and lateral root development. Plant J. 2005, 44, 903–916. [Google Scholar] [CrossRef]
  21. Nguyen, T.D.; La, V.H.; Nguyen, V.D.; Bui, T.T.; Nguyen, T.T.; Je, Y.H.; Chung, Y.S.; Ngo, X.B. Convergence of Bar and Cry1Ac Mutant Genes in Soybean Confers Synergistic Resistance to Herbicide and Lepidopteran Insects. Front. Plant Sci. 2021, 12, 698–882. [Google Scholar] [CrossRef] [PubMed]
  22. Olhoft, P.M.; Flagel, L.E.; Donovan, C.M.; Somers, D.A. Efficient soybean transformation using hygromycin B selection in the cotyledonary-node method. Planta 2003, 216, 723–735. [Google Scholar] [CrossRef] [PubMed]
  23. Kita, Y.; Hanafy, M.S.; Deguchi, M.; Hasegawa, H.; Terakawa, T.; Kitamura, K.; Ishimoto, M. Generation and characterization of herbicide-resistant soybean plants expressing novel Phosphinothricin N-acetyltransferase Genes. Breed. Sci. 2009, 59, 245–251. [Google Scholar] [CrossRef]
  24. Richardson, A.D.; Duigan, S.P.; Graeme, P.; Berlyn, G.P. An evaluation of noninvasive methods to estimate foliar chlorophyll content. New Phytol. 2002, 153, 185–194. [Google Scholar] [CrossRef]
  25. Lee, B.R.; Li, L.S.; Jung, W.J.; Jin, Y.L.; Avice, J.C.; Qurry, A.; Kim, T.H. Water deficit-induced oxidative stress and the activa-tionof antioxidant enzymes in white clover leaves. Biol. Plant. 2009, 53, 505–510. [Google Scholar] [CrossRef]
  26. La, V.H.; Lee, B.R.; Islam, M.T.; Park, S.H.; Jung, H.I.; Bae, D.W.; Kim, T.H. characterization of salicylic acid-mediated mod-ulation of the drought stress responses: Reactive oxygen species, proline, and redox state in brassica napus. Environ. Exp. Bot. 2019, 157, 1–10. [Google Scholar] [CrossRef]
  27. Lee, B.R.; Muneer, S.; Park, S.H.; Zhang, Q.; Kim, T.H. Ammonium-induced proline and sucrose accumulation, and their sig-nificance in antioxidative activity and osmotic adjustment. Act. Physiol. Plant 2013, 35, 2655–2664. [Google Scholar] [CrossRef]
  28. Queval, G.; Noctor, G.A. Plate reader method for the measurement of NAD, NADP, glutathione, and ascorbate in tissue ex-tracts: Application to redox profiling during Arabidopsis rosette development. Anal. Biochem. 2007, 363, 58–69. [Google Scholar] [CrossRef]
  29. Pan, X.; Welti, R.; Wang, X. Quantitative analysis of major plant hormones in crude plant extracts by high-performance liquid chromatography–mass spectrometry. Nat. Protoc. 2010, 5, 986–992. [Google Scholar] [CrossRef]
  30. Zhang, Q.; Lee, B.-R.; Park, S.-H.; Zaman, R.; Bae, D.-W.; Kim, T.-H. Evidence of salicylic acid-mediated protein degradation and amino acid transport in mature leaves of Brassica napus. J. Plant Growth Regul. 2015, 34, 684–689. [Google Scholar] [CrossRef]
  31. Järvi, S.; Suorsa, M.; Paakkarinen, V.; Aro, E.-M. Optimized native gel systems for separation of thylakoid protein complexes: Novel super- and mega-complexes. Biochem. J. 2011, 439, 207–214. [Google Scholar] [CrossRef] [PubMed]
  32. Beyene, G.; Foyer, C.H.; Kunert, K.J. Two new cysteine proteinases with specific expression patterns in mature and senescent tobacco (Nicotiana tabacum L.) leaves. J. Exp. Bot. 2006, 57, 1431–1443. [Google Scholar] [CrossRef] [PubMed]
  33. Jibran, R.; Hunter, D.; Dijkwel, P.P. Hormonal regulation of leaf senescence through integration of developmental and stress signals. Plant Mol. Biol. 2013, 82, 547–561. [Google Scholar] [CrossRef] [PubMed]
  34. Livak, J.K.; Schmittgen, T.D. Analysis of relative gene expression data using real-time quantitative PCR and the 2−∆∆CT method. Methods 2001, 25, 402–408. [Google Scholar] [CrossRef]
  35. Lim, P.O.; Lee, I.C.; Kim, J.; Kim, H.J.; Ryu, J.S.; Woo, H.R.; Nam, H.G. Auxin response factor 2 (ARF2) plays a major role in regulating auxin-mediated leaf longevity. J. Exp. Bot. 2010, 61, 1419–1430. [Google Scholar] [CrossRef]
  36. Kim, J.I.; Murphy, A.S.; Baek, D.; Lee, S.-W.; Yun, D.-J.; Bressan, R.A.; Narasimhan, M.L. YUCCA6 over-expression demonstrates auxin function in delaying leaf senescence in Arabidopsis thaliana. J. Exp. Bot. 2011, 62, 3981–3992. [Google Scholar] [CrossRef]
  37. Faria, J.A.; Reis, P.A.; Reis, M.T.; Rosado, G.L.; Pinheiro, G.L.; Mendes, G.C.; Fontes, E.P. The NAC domain-containing protein, GmNAC6, is a downstream component of the ER stress- and osmotic stress-induced NRP-mediated cell-death signaling pathway. BMC Plant Biol. 2011, 11, 129. [Google Scholar] [CrossRef]
  38. Fraga, O.; de Melo, B.; Quadros, I.; Reis, P.; Fontes, E. Senescence-Associated Glycine max (Gm)NAC Genes: Integration of Natural and stress-induced leaf senescence. Int. J. Mol. Sci. 2021, 22, 8287. [Google Scholar] [CrossRef]
  39. Mendes, G.C.; Reis, P.A.B.; Calil, I.P.; Carvalho, H.H.; Aragão, F.J.L.; Fontes, E.P.B. GmNAC30 and GmNAC81 integrate the endoplasmic reticulum stress- and osmotic stress-induced cell death responses through a vacuolar processing enzyme. Proc. Natl. Acad. Sci. USA 2013, 110, 19627–19632. [Google Scholar] [CrossRef]
  40. Pimenta, M.R.; Silva, P.A.; Mendes, G.C.; Alves, J.R.; Caetano, H.D.N.; Machado, J.P.B.; Brustolini, O.J.B.; Carpinetti, P.A.; Melo, B.P.; Silva, J.C.F.; et al. The stress-induced soybean NAC transcription factor GmNAC81 plays a positive role in developmentally pro-grammed leaf senescence. Plant Cell Physiol. 2016, 57, 1098–1114. [Google Scholar] [CrossRef]
  41. Melo, B.P.; Lourenço-Tessutti, I.T.; Fraga, O.T.; Pinheiro, L.B.; de Jesus Lins, C.B.D.J.; Morgante, C.V.; Engler, J.A.; Reis, P.A.B.; Grossi-De-Sá, M.F.; Fontes, E.P.B. Contrasting roles of GmNAC065 and GmNAC085 in natural senescence, plant development, multiple stresses and cell death responses. Sci. Rep. 2021, 11, 11178. [Google Scholar] [CrossRef] [PubMed]
  42. Park, S.; Jeong, J.S.; Seo, J.S.; Park, B.S.; Chua, N. Arabidopsis ubiquitin-specific proteases UBP12 and UBP13 shape ORE1 levels during leaf senescence induced by nitrogen deficiency. New Phytol. 2019, 223, 1447–1460. [Google Scholar] [CrossRef] [PubMed]
  43. Luo, Y.; Li, W.; Huang, C.; Yang, J.; Jin, M.; Chen, J.; Pang, D.; Chang, Y.; Li, Y.; Wang, Z. Exogenous abscisic acid coordinating leaf senescence and transport of assimilates into wheat grains under drought stress by regulating hormones homeostasis. Crop. J. 2020, 9, 901–914. [Google Scholar] [CrossRef]
  44. Teale, W.; Ditengou, F.; Dovzhenko, A.; Li, X.; Molendijk, A.; Ruperti, B.; Paponov, I.; Palme, K. Auxin as a model for the integration of hormonal signal processing and transduction. Mol. Plant 2008, 1, 229–237. [Google Scholar] [CrossRef]
  45. Wang, L.; Hua, D.; He, J.; Duan, Y.; Chen, Z.; Hong, X.; Gong, Z. Auxin Response Factor2 (ARF2) and Its Regulated Homeo-Domain Gene Hb33 Mediate Abscisic Acid Response in Arabidopsis. PLoS Gene. 2011, 7, e1002172. [Google Scholar] [CrossRef]
  46. Hörtensteiner, S. Chlorophyll degradation during senescence. Annu. Rev. Plant Biol. 2006, 57, 55–77. [Google Scholar] [CrossRef]
  47. Kim, H.J.; Gil Nam, H.; Lim, P.O. Regulatory network of NAC transcription factors in leaf senescence. Curr. Opin. Plant Biol. 2016, 33, 48–56. [Google Scholar] [CrossRef]
  48. Lim, P.O.; Kim, H.J.; Nam, H.G. Leaf senescence. Ann. Rev. Plant Biol. 2007, 58, 115–136. [Google Scholar] [CrossRef]
  49. Yang, J.; Worley, E.; Udvardi, M. A NAP-AAO3 regulatory module promotes chlorophyll degradation via ABA biosynthesis in Arabidopsis Leaves. Plant Cell 2014, 26, 4862–4874. [Google Scholar] [CrossRef]
  50. Shimoda, Y.; Ito, H.; Tanaka, A. Arabidopsis STAY-GREEN, mendel’s green cotyledon gene, encodes magnesium-dechelatase. Plant Cell 2016, 28, 2147–2160. [Google Scholar] [CrossRef] [Green Version]
  51. Sakuraba, Y.; Han, S.-H.; Lee, S.-H.; Hörtensteiner, S.; Paek, N.-C. Arabidopsis NAC016 promotes chlorophyll breakdown by directly upregulating STAYGREEN1 transcription. Plant Cell Rep. 2015, 35, 155–166. [Google Scholar] [CrossRef] [PubMed]
  52. Dal Bosco, C.; Lezhneva, L.; Biehl, A.; Leister, D.; Strotmann, H.; Wanner, G.; Meurer, J. Inactivation of the chloroplast ATP synthase gamma subunit results in high non-photochemical fluorescence quenching and altered nuclear gene expression in Arabidopsis Thaliana. J. Biol. Chem. 2003, 279, 1060–1069. [Google Scholar] [CrossRef] [PubMed]
  53. Fujita, Y.; Fujita, M.; Shinozaki, K.; Yamaguchi-Shinozaki, K. ABA-mediated transcriptional regulation in response to osmotic stress in plants. J. Plant Res. 2011, 124, 509–525. [Google Scholar] [CrossRef] [PubMed]
  54. Sakuraba, Y.; Piao, W.; Lim, J.-H.; Han, S.-H.; Kim, Y.-S.; An, G.; Paek, N.-C. Rice ONAC106 inhibits leaf senescence and increases salt tolerance and tiller angle. Plant Cell Physiol. 2015, 56, 2325–2339. [Google Scholar] [CrossRef]
  55. Hung, K.T.; Kao, C.H. Hydrogen peroxide is necessary for abscisic acid-induced senescence of rice leaves. J. Plant Physiol. 2004, 161, 1347–1357. [Google Scholar] [CrossRef]
  56. Li, Z.; Wang, F.; Lei, B.; Cao, Z.; Pan, G.; Cheng, F. Genotypic-dependent alteration in transcriptional expression of various CAT Isoenzyme genes in esl mutant rice and its relation to H2O2-induced leaf senescence. Plant Growth Regul. 2013, 73, 237–248. [Google Scholar] [CrossRef]
  57. Fan, Z.Q.; Tan, X.L.; Chen, J.W.; Liu, Z.L.; Kuang, J.; Lu, W.J.; Chen, W.; Shan, J.Y. BrNAC055, a novel transcriptional ac-tivator, regulates leaf senescence in Chinese flowering cabbage by modulating reactive oxygen species production and chlorophyll degradation. J. Agric. And. Food Chem. 2018, 66, 9399–9408. [Google Scholar] [CrossRef]
  58. Garapati, P.; Xue, G.-P.; Munné-Bosch, S.; Balazadeh, S. Transcription factor ATAF1 in Arabidopsis promotes senescence by direct regulation of key chloroplast maintenance and senescence transcriptional cascades. Plant Physiol. 2015, 168, 1122–1139. [Google Scholar] [CrossRef]
  59. Jensen, M.K.; Lindemose, S.; de Masi, F.; Reimer, J.J.; Nielsen, M.; Perera, V.; Workman, C.T.; Turck, F.; Grant, M.R.; Mundy, J.; et al. ATAF1 transcription factor directly regulates abscisic acid biosynthetic gene NCED3 in Arabidopsis thaliana. FEBS Open Bio 2013, 3, 321–327. [Google Scholar] [CrossRef]
  60. Xia, X.-J.; Zhou, Y.-H.; Shi, K.; Zhou, J.; Foyer, C.H.; Yu, J.-Q. Interplay between reactive oxygen species and hormones in the control of plant development and stress tolerance. J. Exp. Bot. 2015, 66, 2839–2856. [Google Scholar] [CrossRef] [Green Version]
  61. Balazadeh, S.; Kwasniewski, M.; Caldana, C.; Mehrnia, M.; Zanor, M.I.; Xue, G.-P.; Mueller-Roeber, B. ORS1, an H2O2-Responsive NAC Transcription Factor, Controls Senescence in Arabidopsis thaliana. Mol. Plant 2011, 4, 346–360. [Google Scholar] [CrossRef] [PubMed]
  62. Guo, H.S.; Xie, Q.; Fei, J.F.; Chua, N.H. MicroRNA Directs mRNA Cleavage of the Transcription Factor NAC1 to Downregu-Lateauxin Signals for Arabidopsis Lateral Root Development. Plant Cell 2005, 17, 1376–1386. [Google Scholar] [CrossRef] [PubMed]
  63. Melo, B.P.; Fraga, O.T.; Silva, J.C.F.; Ferreira, D.D.O.; Brustolini, O.J.B.; Carpinetti, P.A.; Machado, J.P.B.; Reis, P.A.B.; Fontes, E.P.B. Revisiting the soybean GmNAC Superfamily. Front. Plant Sci. 2018, 9, 1864. [Google Scholar] [CrossRef]
  64. Ferreira, D.O.; Fraga, O.T.; Pimenta, M.R.; Caetano, H.D.N.; Machado, J.P.B.; Carpinetti, P.A.; Brustolini, O.J.B.; Quadros, I.P.S.; Reis, P.A.B.; Fontes, E.P.B. GmNAC81 inversely modulates leaf senescence and drought tolerance. Front. Genet. 2020, 11, 601876. [Google Scholar] [CrossRef] [PubMed]
  65. Hara-Nishimura, I.; Hatsugai, N.; Nakaune, S.; Kuroyanagi, M.; Nishimura, M. Vacuolar processing enzyme: An executor of plant cell death. Curr. Opin. Plant Biol. 2005, 8, 404–408. [Google Scholar] [CrossRef]
  66. Le, D.T.; Nishiyama, R.; Watanabe, Y.; Tanaka, M.; Seki, M.; Ham, L.H.; Yamaguchi-Shinozaki, K.; Shinozaki, K.; Tran, L.-S.P. Differential gene expression in soybean leaf tissues at late developmental stages under drought stress revealed by genome-wide transcriptome analysis. PLoS ONE 2012, 7, e49522. [Google Scholar] [CrossRef] [PubMed]
  67. Del Pozo, A.; Yáñez, A.; Matus, I.A.; Tapia, G.; Castillo, D.; Sanchez-Jardón, L.; Araus, J.L. Physiological traits associated with wheat yield potential and performance under water-stress in a mediterranean environment. Front. Plant Sci. 2016, 7, 987. [Google Scholar] [CrossRef]
  68. Vadez, V.; Deshpande, S.P.; Kholova, J.; Hammer, G.; Borrell, A.K.; Talwar, H.S.; Hash, C.T. Stay-green quantitative trait loci’s effects on water extraction, transpiration efficiency and seed yield depend on recipient parent background. Funct. Plant Biol. 2011, 38, 553–566. [Google Scholar] [CrossRef]
  69. Kang, K.; Shim, Y.; Gi, E.; An, G.; Paek, N.-C. Mutation of ONAC096 Enhances Grain Yield by Increasing Panicle Number and Delaying Leaf Senescence during Grain Filling in Rice. Int. J. Mol. Sci. 2019, 20, 5241. [Google Scholar] [CrossRef]
  70. Ma, X.; Zhang, Y.; Turečková, V.; Xue, G.-P.; Fernie, A.R.; Mueller-Roeber, B.; Balazadeh, S. The NAC transcription factor SlNAP2 regulates leaf senescence and fruit yield in tomato. Plant Physiol. 2018, 177, 1286–1302. [Google Scholar] [CrossRef] [Green Version]
Figure 1. Comparison of the phenotype of ore1 soybean transgenic and wild-type (NT) plants at V3-vegetative stages. (A) Representative pictures showing plant architecture of 30-day-old T2-generation ore1-1, ore1-2, ore1-6 transgenic lines, and NT at the V3 stage under controlled growth conditions. (B) Fully expanded leaf phenotype visualizations, respectively, bar 1 cm. The leaves were collected from older leaves (leaf No. 1–2), middle leaves (leaf No. 3–4), and young leaves (leaf No. 5). (C) Total chlorophyll content in the leaves. (D) Soybean senescence-associated gene 39 (GmSAG39) is expressed in leaves in wild-type and transgenic plants. Asterisks indicate significant differences from NT and transgenic plants according to Tukey’s t-test; * p < 0.05, *** p < 0.001.
Agronomy 12 02110 g001
Figure 2. Phenotypic characterization of At-ore1 expression in soybean leaves (leaf 3) at V3-vegetative stage. (A) Fully expanded leaf 3 phenotype of NT, ore1-1, ore1-2 and ore1-6, respectively, bar 1 cm. (B) Chlorophyll extraction of the detected leaves of the NT and ore1-1, ore1-2, ore1-6. (C) Total chlorophyll content in the leaf 3 of NT, ore1-1, ore1-2 and ore1-6. (D) Ratios of chlorophyll a and chlorophyll b (Chla:Chlb) of NT, ore1-1, or1-2 and ore1-6. (E,F) Total protein profile in the detached leaves of NT, ore1-1, or1-2 and ore1-6, including rubisco large subunit (RSL) and rubisco small subunit (RSS). Each lane was loaded with 50 µg protein. Molecular mass markers (kDa) are listed on the left of the gel. (F) The bands of RLS and RSS were quantified and expressed as absolute integrated optical density (IOD). (G) Chl-binding protein in thylakoid membranes were measured by photosystem I/II (PSI/PSII) and light-harvesting complexes (LHC). Relative gene expression of At-ore1 (H), STAYGREEN 1 (GmSRG1) (I), and soybean-senescence-associated gene 39 (GmSAG39) (J) were analyzed by qRT–PCR using leaves (No.3) of NT and ore1-1, ore1-2, ore1-6 plants. Data are means ± SE of three independent biological replicates (n = 3). Asterisks indicate significant differences from NT and transgenic plants according to Tukey’s t-test; * p < 0.05, *** p < 0.001.
Agronomy 12 02110 g002
Figure 3. The relative abundance of phytohormone synthesis and signaling genes in soybean-expressed At-orre1 genes. (A) Abscisic acid (ABA)-synthesis-related gene 9-cis-epoxycarotenoid dioxygenase 3 (NECD3), GmNECD3 transcript level. (B) Salicylic acid (SA)-synthesis-related gene Isochorismate synthase 1 (GmICS1). (C) Auxin-synthesis-related gene GmYUCCA6. (D) bZIP transcription factor level ABA INSENSITIVE 5 (ABI5), GmABI5 in ABA signaling. (E) Nonexpressor of pathogenesis-related genes 1, GmMYC2 transcription factor of SA-signaling. (F) AUXIN RESPONSE FACTOR 2 (ARF2), GmARF2 transcript level in auxin signaling. The expression levels were detected by quantitative polymerase chain reactions (qPCR). Asterisks indicate significant differences from wild-type (NT) and transgenic plants according to Tukey’s t-test; * p < 0.05, *** p < 0.001. Values are represented as mean ± SE (n = 3).
Agronomy 12 02110 g003
Figure 4. Phenotypic characterization of programmed cell death (PCD) symptoms and accumulation of reactive oxygen species (ROS) in leaves of transgenic plants and wild-type (NT). (A) Leaf No.3 fully experiences programmed cell death (PCD) from 6-week-old plants. Leaf cell death is retarded in the leaf edge in the ore1-1 line rather than ore1-2 and ore1-6 transgenic lines. This symptom was developed in rosette leaf are numbered from 1 (older leaf) to 3–4 (middle leaf) are shown as well. The photo was taken under microscopy Stemi 508 (Carl Zeiss, Germany) with 40×, bar 2 mm. ROS levels were measured by (B) O2 and (C) Hydrogen peroxide (H2O2) in detected leaves. (D) Transcript level of respiratory burst oxidase homologs E (RBOH-E) is a producer of ROS production. (F) GmRBOH-E expression was detected in wild-type (NT) and soybean transgenic leaves. (E) Transcript levels of a vacuolar-processing enzyme (VPE) is a related gene associated with cell death in the detected leaf No.3. qPCR was used to quantify the enrichment of the ROS-induced cell death. (F) Cysteine protease activity was detached by gel-staining of each transgenic line compared to the wild-type. (G) Cysteine protease activity in the detached leaves. Data are means ± SE of three independent biological replicates (n = 3). Asterisks indicate significant differences from wild-type (NT) and transgenic plants according to Tukey’s t-test; * p < 0.05, *** p < 0.001.
Agronomy 12 02110 g004
Figure 5. Expression of NAC transcription factors and correlation between NAC expression and hormone signaling in soybean transgenic plants. NAC transcription factors including (A) GmNAC081 and (B) GmNAC065 expression in the detached leaves of wild-type (NT) and transgenic lines. Asterisks indicate significant differences from wild-type (NT) and transgenic plants according to Tukey’s t-test; * p < 0.05, *** p < 0.001. (C,D) Negative correlation expressed between GmABI5 and GmNAC081 or GmNAC065, and vice versa. (E,F) Correlation factor between expressions indicated by the perfect positive correlation is represented by GmARF2 and GmNAC081, while GmARF2 has a negative correlation with GmNAC065. Data are means ± SE of three independent biological replicates (n = 3).
Agronomy 12 02110 g005
Figure 6. Identification of the regulator factors of leaf senescence in Atore1-expressing soybeans. (A) Heatmap comparing the changes of the identified chlorophyll, hormones, ROS, and redox levels in the leaves of wild-type (NT) and transgenic plants. The normalization procedure consisted of mean row-centering with color scales. Clusters were generated by hierarchical clustering in a heatmap visualization, considering the expression value of each parameter and genes in the 25 putative targets of the NT and ore1-1, ore1-2, and ore1-6 plants. Boxes indicated two expression trends: the upregulated and downregulated metabolites or genes at senescence and in the fully expanded leaves. (B) The plot of one-way ANOVA analysis for NT and ore1-1, ore1-2, and ore1-6 plants regarding responsive changes of their physiological and defensive parameters. Data are means ± SE of three independent biological replicates (n = 3). (C) The correlation network between hormonal status and chlorophyll from NT and ore1-1, ore1-2, and ore1-6. The positive correlation is represented in the red line, and the negative correlation is shown in the blue line.
Agronomy 12 02110 g006
Figure 7. The phenotype of leaf longevity expressed in soybean transgenic plants at the R8 harvesting stage. (A) The whole plant phenotype of wild-type (NT) and transgenic plants (ore1-1, ore1-2, ore1-6), respectively. In the ore1-6 line, there was a more stable green leaf compared to other ore1 lines and the wild-type. (B) Comparison of fully expanded leaf (No.3) phenotype between wild-type (NT) and transgenic plants, respectively, bar 1 cm. (C) Total chlorophyll content respectively measured by leaves at the harvested stage. (D) The expression level of GmSAG39 in the leaf of transgenic plants compared with the expression in the wide type at the harvesting stage. Data are means ± SE of three independent replicates (n = 3). Asterisks indicate significant differences from wild-type (NT) and transgenic plants according to Tukey’s t-test; * p < 0.05, *** p < 0.001.
Agronomy 12 02110 g007
Figure 8. Seed yield from Atore1-expressing soybean. (A) Comparison of the time harvested in wild-type (NT) and transgenic lines (ore1-1, ore1-2, ore1-6). Harvest time begins when the pods turn yellow. (B) Sizes of seed harvested from the genotype of the wild-type and transgenic lines. (C) Length and (D) diameter of harvested seeds at the R8 harvesting stage. (E) Sucrose content in seeds. (F) Seed yield per plant. Data are means ± SE of three independent replicates (n = 3). Asterisks indicate significant differences from NT and transgenic lines according to Tukey’s t-test; * p < 0.05, *** p < 0.001.
Agronomy 12 02110 g008
Figure 9. A proposed regulatory network model for the mechanism of action of ore1-transgenic plants during slow leaf senescence in soybeans. The induced and repressed Atore1 gene identified in this study as well as the biological processes they are involved in hormone balance are shown together with the hormonal status, ROS, and transcription factors controlling the expression of the Atore1 gene. The red color indicates circuit responses to leaf senescence specific to ABA-mediated H2O2/NAC081 signaling. The green color represents the auxin-mediated NAC065 regulatory pathway in delayed leaf senescence. The thickness of the arrow expresses the strength of an induced or depressed response.
Agronomy 12 02110 g009
Table 1. Hormonal status in non-transgenic (NT) and soybean transgenic lines.
Trangenics LinesHormone Status
ABASAJAIAAGA3
NT540.712 ± 15.047 b25.048 ± 0.784 b2.577 ± 0.197 c26.857 ± 1.087 b11.589 ± 0.438 a
ore1-1910.968 ± 29.478 a96.824 ± 3.392 a6.400 ± 0.238 a7.479 ± 0.391 c23.381 ± 0.737 b
ore1-2485.014 ± 20.767 c23.391 ± 0.962 b3.388 ± 0.212 b13.767 ± 0.641 b22.222 ± 0.891 b
ore1-6391.326 ± 18.260 d24.874 ± 0.649 b3.196 ± 0.296 b158.01 ± 4.615 a17.304 ± 0.848 b
Hormone RatiosABA/IAASA/IAAJA/IAA(ABA+SA)/IAA(ABA+JA)/IAA
NT20.201 ± 0.386 c0.938 ± 0.024 c0.096 ± 0.004 c21.134 ± 0.410 c20.297 ± 0.390 c
ore1-1121.884 ± 1.319 a12.953 ± 0.113 a0.856 ± 0.007 a134.836 ± 1.406 a122.739 ± 1.324 a
ore1-235.243 ± 0.480 b1.700 ± 0.030 b0.246 ± 0.003 b36.943 ± 0.511 b35.489 ± 0.477 b
ore1-67.709 ± 0.049 d0.490 ± 0.003 c0.062 ± 0.001 c8.199 ± 0.048 d7.772 ± 0.049 d
Hormones in fresh leaves were detected by high-performance liquid chromatography electrospray ionization tandem mass spectrometry (HPLC–ESI–MS/MS), including abscisic acid (ABA), salicylic acid (SA), jasmonic acid (JA), indole-3-acetic acid (IAA), and gibberellic acid (GA3). Their contents are shown as ng g−1 fresh weight. Values are mean ± SE (n = 3). Different lowercase letters in a column indicate significant differences at p < 0.05 according to Duncan’s multiple range test.
Table 2. Atore1/nac2 binding to four cis-regulatory elements (CREs) core motifs identified by PlantCARE.
Motif NameLogoPositionSequence (5′-3′)Function
ABRE-motifAgronomy 12 02110 i001+972, +1097ACGTGCis-acting element involved in the abscisic acid responsiveness
TGA-elementAgronomy 12 02110 i002+1317AACGACAuxin-responsive element
GATA boxAgronomy 12 02110 i003+1387GATAChlorophyll a/b binding protein
TGACG-motifAgronomy 12 02110 i004+1494TGACGCis-acting regulatory element involved in the MeJA-responsiveness
Table 3. Antioxidant activity and redox status in non-transgenic (NT) and transgenic soybean lines.
Transgenic LinesAntioxidant ActivityRedox Status
SODCATNADP+NADPHNADP+/NADPH Ratio
NT6.240 ± 0.98 b1.975 ± 0.24 a3.293 ± 0.02 b2.620 ± 0.05 b1.258 ± 0.01 b
ore1-112.839 ± 0.36 a1.971 ± 0.20 a5.875 ± 0.10 a3.749 ± 0.09 a1.569 ± 0.04 a
ore1-24.773 ± 0.36c2.174 ± 0.31 a3.080 ± 0.09 b2.592 ± 0.03 b1.188 ± 0.03 bc
ore1-64.231 ± 0.43 d2.342 ± 0.15 a2.564 ± 0.18 c2.357 ± 0.04 b1.091 ± 0.09 c
Antioxidant enzymes in fresh leaves including superoxide dismutase (SOD) and catalase (CAT) were detected and quantified as unit mg−1 proteins. Redox NAD(P)H and NAD(P)+ contents are shown as nmol g−1 FW. Values are mean ± SE for n = 3. Different lowercase letters in a column indicate significant differences at p < 0.05 according to Duncan’s multiple range test.
Publisher’s Note: MDPI stays neutral with regard to jurisdictional claims in published maps and institutional affiliations.

