Article

Development of an Irrigation Method with a Cycle of Wilting–Partial Recovery Using an Image-Based Irrigation System for High-Quality Tomato Production

1
Graduate School of Horticulture, Chiba University, 648 Matsudo, Matsudo 271-8510, Chiba, Japan
2
Plant Molecular Research Center, Chiba University, Chiba 260-0856, Chiba, Japan
*
Author to whom correspondence should be addressed.
Agronomy 2022, 12(6), 1410; https://doi.org/10.3390/agronomy12061410
Submission received: 19 May 2022 / Revised: 4 June 2022 / Accepted: 6 June 2022 / Published: 11 June 2022

Abstract

:
The demand for high-quality tomatoes is increasing; however, their production requires skillful techniques. To develop an automated irrigation method for producing high-quality tomatoes in a greenhouse, we used an image-based irrigation system to study how a diurnal periodic cycle of wilting–partial recovery irrigation affects growth, yield, and fruit quality. Three irrigation treatments were performed: a control with sufficient irrigation and two water stress treatments (moderate and severe wilting–partial recovery treatments; MPR and SPR, respectively). The mean daily maximum wilting ratios for MPR and SPR were 8.1% and 13.2% at wilting-level setpoints of 7% and 14%, respectively. The total irrigation amounts in MPR and SPR were 75% and 59% of that in the control, respectively. The corresponding yields in MPR and SPR were 76% and 56% of that in the control, respectively. The Brix and acidity of fruits in MPR and SPR were 15% and 10% and 34% and 24% higher, respectively, than those in the control at the end of the experiment. Plant growth decreased with increasing water stress levels. Plant length, leaf area, and the number of leaves were more sensitive to water stress than other growth parameters. SPR could be an effective irrigation method to improve fruit quality, even at high-air-temperature periods in summer.

1. Introduction

Tomatoes are among the most widely cultivated vegetables under protected cultivation. In recent years, owing to increased living standards, the demand for tomatoes has shifted from quantity to quality. High-quality tomatoes, which are more flavorful and have a higher sugar content (Brix), are becoming popular in many countries. The fruit quality of tomatoes depends on their physiological response to the cultivation environment. Numerous studies have demonstrated that deficit irrigation (DI) is an effective method for increasing the Brix of greenhouse tomatoes [1,2,3]. However, applying water stress through DI may lead to a decrease in photosynthesis [4,5], slower plant growth [6], smaller fruit size [7], and lower tomato yield [8]. Moreover, excessive wilting or associated physiological disorders may lead to a severe decrease in yield. Therefore, appropriate irrigation management, which precisely and reproducibly controls four irrigation parameters (i.e., total irrigation amount, irrigation frequency, threshold value, and degree of recovery from wilting), is necessary to minimize the yield loss of high-quality tomatoes under water stress.
To establish an appropriate automated irrigation method with high reproducibility, digitized information on plant wilting conditions is necessary. Several studies have confirmed that digitized wilting conditions in tomato plants can be obtained by monitoring factors such as leaf temperature with infrared thermometry [9], stem diameter [10], plant weight [11], and projected leaf area using photo-image analysis [12]. We developed an image-based irrigation system to digitize wilting conditions by monitoring projected leaf area [13]. The system irrigated tomato plants when the wilting level reached a threshold value (wilting-level setpoint). This system can change (1) the threshold value and (2) the degree of recovery (full and partial) of tomato plants by controlling the irrigation amount per time.
In our previous study using this image-based irrigation system [14], we experimented by examining the effects of moderate water stress (moderate wilting–full recovery treatment, MR) and severe water stress (severe wilting–full recovery treatment, SR) on greenhouse tomatoes and compared them to a sufficiently irrigated control. Although the threshold values and irrigation frequencies in MR and SR were different, the total irrigation amounts in MR and SR were almost identical because full recovery irrigation after wilting compensated for water loss through transpiration. The percentages of decreased growth and yield of tomatoes and increased fruit quality were almost the same in MR and SR compared with the control, regardless of the threshold value and irrigation frequency. These results indicate that the total irrigation amount is more important than the threshold value and irrigation frequency. However, the effects of irrigation amount on the growth, yield, and fruit quality of tomatoes under wilting and recovery conditions have not been studied.
Based on the previous results of full-recovery experiment [14], we hypothesized that the total irrigation amount of ‘severe wilting with partial recovery’ might be lower than that of ‘moderate wilting with partial recovery’. Moreover, the ‘severe wilting with partial recovery’ may be more beneficial for improving fruit quality than that of the ‘moderate wilting with partial recovery’. To examine these hypotheses, we investigated the effects of wilting and partial recovery irrigation on the growth, yield, and fruit quality of tomatoes.

2. Materials and Methods

2.1. Greenhouse and Plant Materials

The experiment was conducted in a greenhouse with a north–south orientation (average height: 4 m, cultivation area: 144 m2) at Chiba University, Japan. The greenhouse was covered with polyolefin film. A ubiquitous environment control system (UECS; Hortplan LLC, Hyogo, Japan) was used to automate the adjustment of environmental conditions of the greenhouse. The UECS could control the roof and side-wall ventilators, shading curtains, and cooling system. The air temperatures for opening the ventilators and activating the cooling system by the UECS were 25 °C and 32 °C, respectively.
Tomato seeds (Solanum lycopersicum L., ‘Furutika’; Takii & Co., Ltd., Kyoto, Japan) were sown on February 20, 2021. Seeds germinated after being kept at 25 °C in the dark for three days. Seedlings were then cultivated in a room with air temperature, relative humidity (RH), light period, and CO2 concentration at 25/20 °C (daytime/nighttime), 70%, 16 h d–1, and 1000 μmol mol–1, respectively. Seedlings were irrigated once a day with water for seven days after germination (DAG) and then irrigated with half-strength Otsuka nutrient solution (OAT Agrio Co., Ltd., Tokyo, Japan) from 8 DAG. The composition of the one-strength (standard concentration) nutrient solution was as follows: 16 mmol L–1 NO3, 1.3 mmol L–1 NH4+, 4 mmol L–1 H2PO43–, 8 mmol L–1 K+, 4 mmol L–1 Ca2+, 2 mmol L–1 Mg2+, and micronutrients. The electrical conductivity and pH of the one-strength nutrient solution were 2.7 dS m–1 and 6.8, respectively.
At 24 DAG, two seedlings were transplanted to a plastic pot filled with 1.6 L of coconut fiber (coco wool; Hoags Inc., Tokyo, Japan). The pots were arranged in a straight line on cultivation benches in the greenhouse, with 25 cm between pots. The seedlings were irrigated with the aforementioned one-strength nutrient solution (1.2 L d–1 per plant) by drip irrigation (Netafim Ltd., Tel Aviv, Israel). Cultivation management, such as removing old leaves and axillary buds and pesticide spraying, was performed regularly. To improve the fruit set, a commercial plant hormonal solution (Tomato Tone; ISK Biosciences KK, Tokyo, Japan) was sprayed onto the flowers. Tomato plants were sprayed weekly with a 1% CaCl2 solution to inhibit blossom end rot.

2.2. Treatments

The experiment was conducted for 92 days, from May 11 to August 10, 2021. Water stress treatments started at 80 DAG when the fifth truss was at the anthesis stage. This experiment included three treatments, with 20 plants selected for each treatment. The plot with sufficient irrigation (control) was irrigated with 30 mL nutrient solution per plant from 06:30 to 16:30 every 15 min using a timer. The two water stress treatments were moderate water stress treatment (moderate wilting–partial recovery treatment, MPR) and severe water stress treatment (severe wilting–partial recovery treatment, SPR). The automatic irrigation system [13] was used to control the diurnal periodic cycle of wilting and partial recovery in the two water stress treatments.
The automatic irrigation system monitored the wilting level of plants as the wilting ratio [W (%)] every minute using the photo-images of tomato plants and supplied a nutrient solution when W reached a wilting-level setpoint (Wset) [13]. In this system, W is defined as the change in the projected leaf area of the tomato plants [Equation (1)].
W (%) = (1 − PLA/PLAref) × 100
where PLA is the projected leaf area at a certain time from 08:30 to 16:00 and PLAref is the reference projected leaf area with sufficient irrigation from 06:30 to 08:30.
In both MPR and SPR, 120 mL nutrient solution was applied per plant from 06:30 to 08:30 to obtain PLAref on sunny days because little wilting occurred on cloudy or rainy days. The maximum W was determined by observation before starting the experiment because W varies depending on the camera angle and the distance between the camera and the plants. A Wset of 14% was the maximum W for plant survival in the experiment, where all leaves were wilted, and 14% was used as the high threshold value in SPR. Wset of 7%, where only the upper layer leaves were wilting, was used as the moderate threshold value in MPR. When W reached the Wset in both MPR and SPR from 08:30 to 16:00, the same amount of irrigation was supplied for partial (approximately half of Wset) recovery. Because the gradual increase in solar radiation and air temperature led to an increase in transpiration of tomato plants, the irrigation amount was set at 20 mL/time per plant [1–20 days after the start of treatments (DAT)], 30 mL/time per plant (21–30 DAT), and 50 mL/time per plant (31–92 DAT) in both water stress treatments. Irrigation was automatically determined every 5 min based on W. From 16:00 to 16:30, the nutrient solution was applied in both treatments until W returned to 0% to prevent plant wilting during the night. The irrigation amounts were 90 mL per plant (1–20 DAT), 180 mL per plant (21–30 DAT), and 240 mL per plant (31–92 DAT) in both treatments.

2.3. Measured Parameters

2.3.1. Greenhouse Environment

The air temperature and RH inside the greenhouse were measured using the UECS during the experimental period and used to calculate vapor pressure deficit (VPD). In addition, solar radiation inside the greenhouse was measured using a photosynthetic photon flux density (PPFD) sensor. The daily light integral (DLI), mean daytime and nighttime air temperatures, and mean daytime and nighttime VPDs at three periods (1–42, 43–60, and 61–92 DATs) in the greenhouse were calculated. A DLI greater than or equal to 16 mol m–2 d–1 indicated a sunny day, while that of a cloudy or rainy day was below 16 mol m–2 d–1.

2.3.2. Cumulative Wilting Ratio

As in our previous study [14], we calculated the cumulative wilting ratio (CWR, min) using the sum of W per minute higher than 4% during the 7.5 h from 08:30 to 16:00 [Equation (2)].
CWR = t = 1 n Δ W ( t )   ( Δ W ( t )   0 )
where ∆W(t) is the difference between W(t) and 4% at minute ‘t’, and ‘n’ is 450. If W (t) ≤ 4%, ∆W(t) = 0; otherwise, ∆W(t) = W(t)−4%.

2.3.3. Plant Growth

Plant length was measured from the base to the top of the tomato plant using a tape measure. Stem diameter was measured above each truss of the plant using a digital caliper. At the end of the experiment, the leaf area (leaf length longer than 10 cm) of each plant (21 leaves after removal of old leaves) was measured using a leaf area meter (LI-3000C, LI-Cor Inc., Lincoln, NE, USA). The total number of leaves was counted from the first true leaf at the base to the last leaf (leaf length longer than 10 cm) at the top of the plant. The fresh (FW) and dry (DW) weights of the whole plant, excluding the harvested fruits and removed old leaves and axillary buds, were measured using an electronic balance. DW was determined after drying the plant materials in a dry oven at 80 ℃ for one week. The dry matter ratio was calculated as DW divided by FW. Three plants from each treatment were randomly sampled at the end of the experiment (92 DAT) to measure these parameters.

2.3.4. Yield and Fruit Quality

The fruits of the 5–13th fruit trusses, which were exposed to water stress treatment from anthesis to harvest, were harvested to measure the yield and fruit quality of tomatoes. Fruits were harvested eight times throughout the experiment (at 42, 49, 56, 63, 71, 77, 85, and 91 DATs). The number and weight of the harvested fruits from each truss were measured. Six randomly sampled fruits from the same fruit truss of each harvest in control, MPR, and SPR were used to measure the Brix and acidity using a non-destructive Brix and acidity analyzer (Fruit selector, K-BA100R; Kubota Corporation, Osaka, Japan). The means of Brix and acidity of all trusses from each harvest for each treatment were used for statistical analysis. Fruit dry weight was determined after drying the fruits in a dry oven at 80 ℃ for one week.

2.3.5. Cumulative Air Temperature from Anthesis to Fruits Harvest

Cumulative air temperature (CAT) of fruit is the sum of daily mean air temperature higher than 10 °C from the first flowering day to the harvest day of fruits. CAT was calculated using 12–18 fruits from the 10–12th fruit trusses for each treatment. Mean CAT was approximately 1190 °C in the control and 1100 °C in MPR and SPR. CAT was used to estimate the anthesis dates of the eight-time-harvested fruits.

2.4. Statistical Analysis

All data except accumulated fruit yield, accumulated number of harvested fruits, and fruit fresh and dry weights were analyzed by a one-way analysis of variance (ANOVA) using SPSS statistics (version 24.0; IBM Corp., Armonk, NY, USA). To determine significant differences among the control, MPR, and SPR, the mean values of the parameters in the present study were compared using the Tukey–Kramer’s test at p < 0.05.

3. Results

3.1. Environmental Conditions

As the experiment was conducted from spring to summer (May to August), the DLI and air temperature gradually increased (Table 1). DLI was the highest at 61–92 DAT in August and the lowest at 43–60 DAT due to continuous rainy and cloudy days in June. Daytime and nighttime air temperatures increased from approximately 25/20 (1–42 DAT) to 30/26 °C (61–92 DAT). The maximum daytime air temperature was approximately 35 °C at 61–92 DAT (data not shown). In addition, daytime and nighttime VPDs were the highest at 61–92 DAT and lowest at 43–60 DAT.

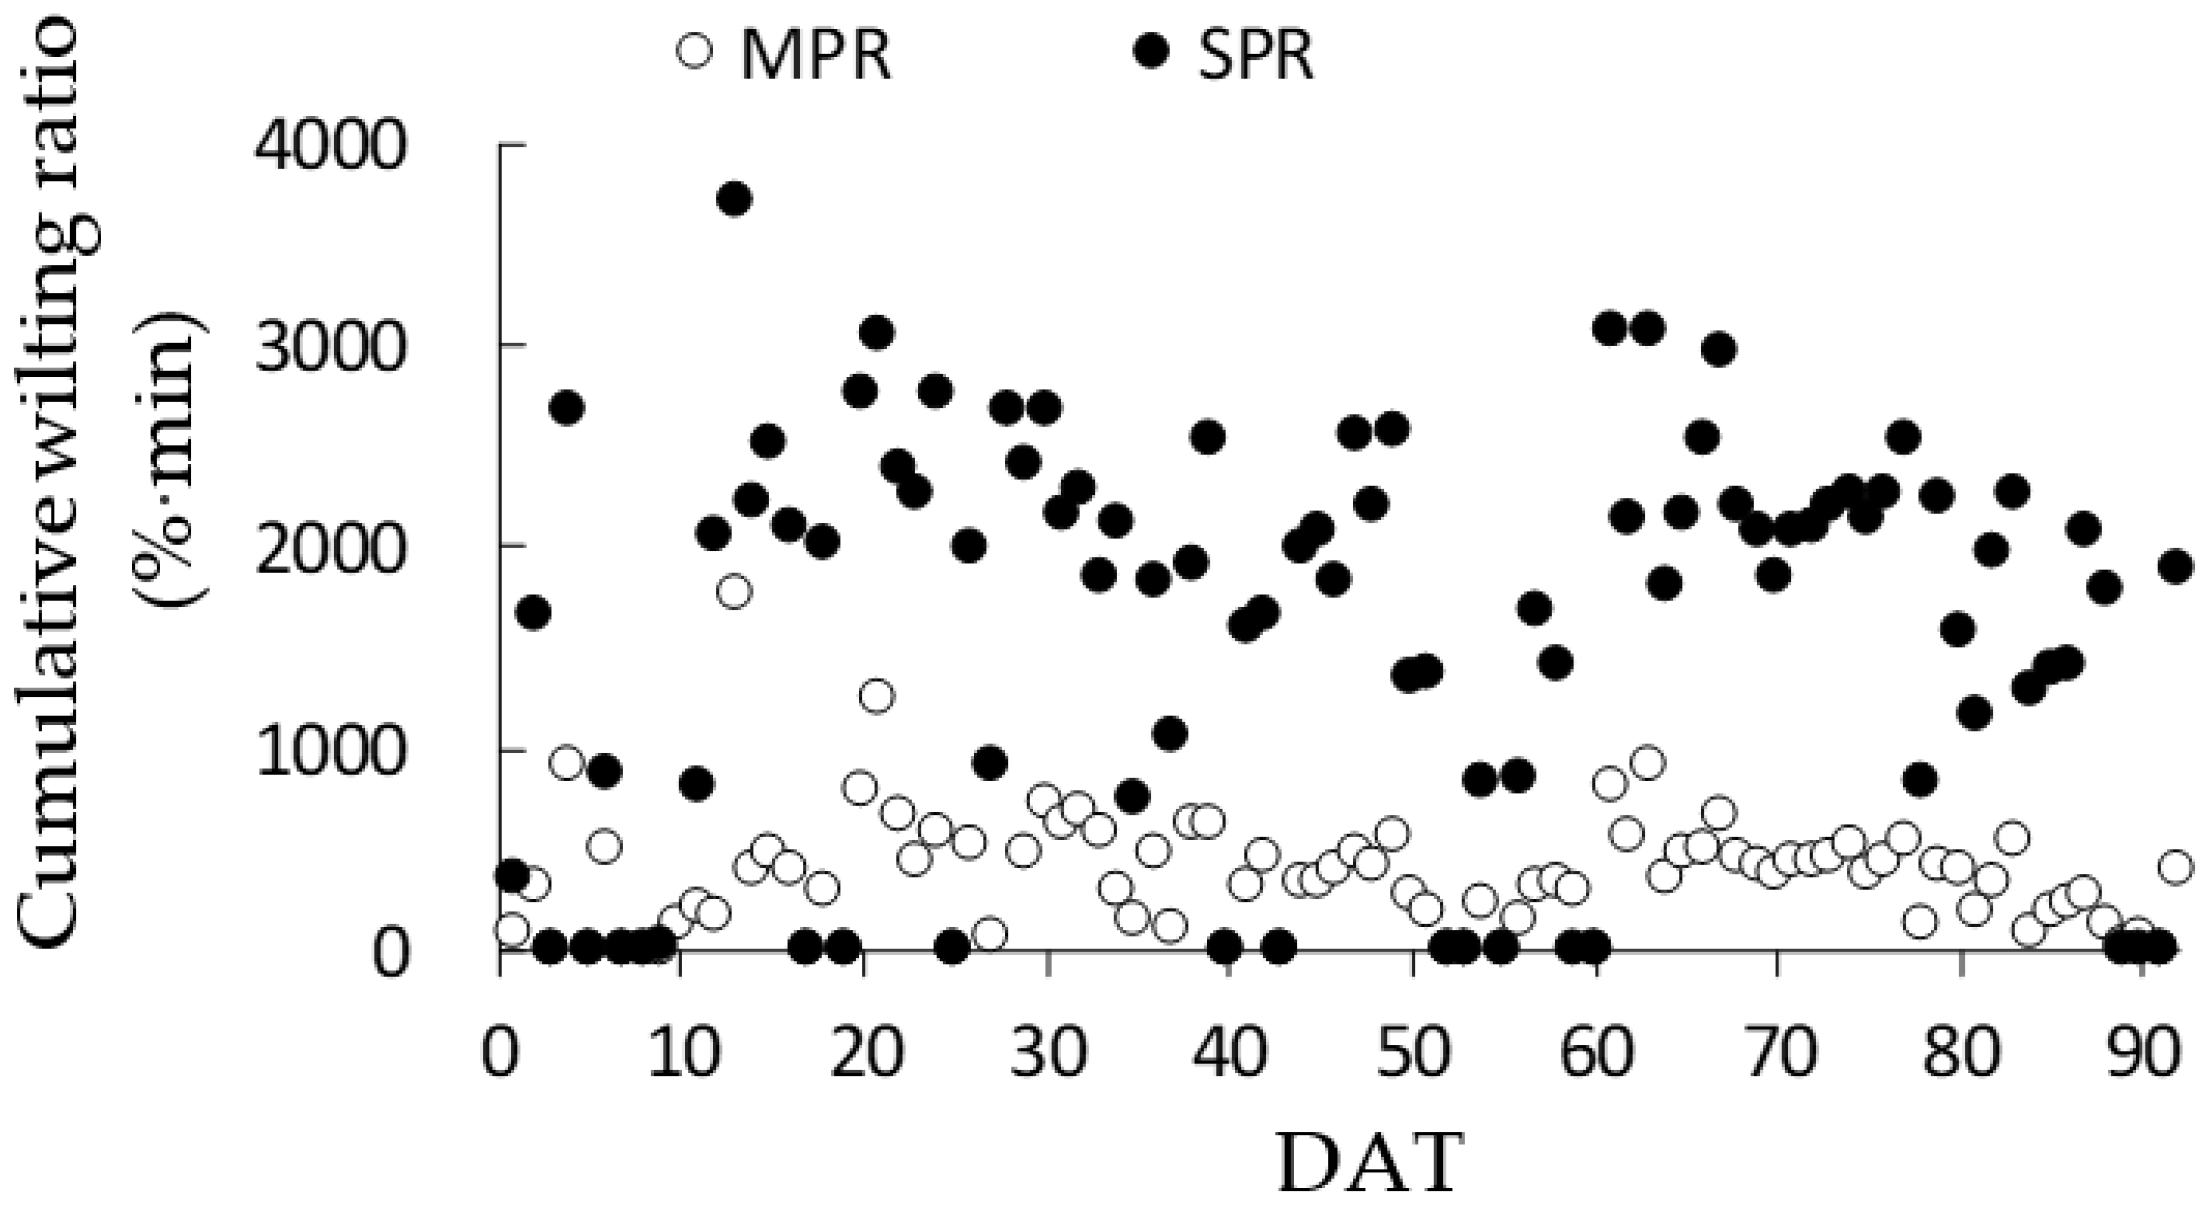
3.2. Transition of Wilting Ratio

Typical diurnal changes in W in MPR and SPR from 06:30 to 18:00 on sunny and cloudy days are shown in Figure 1. On sunny days, W reached Wset in both MPR and SPR. In both treatments, a diurnal periodic cycle of wilting and partial (approximately half of Wset) recovery occurred from 8:30 to 16:00. A cycle of wilting and partial recovery in MPR usually took approximately 1 h, shorter than that of 1.5 h in SPR. The daily irrigation frequency in MPR was higher than that in SPR. The peaks of W were slightly higher than those of Wset in MPR and SPR (Figure 1a). However, W did not reach Wset on cloudy days in MPR and SPR (Figure 1b).
In MPR, the moderate wilting and partial recovery cycles were repeated 6–19 times on sunny days and 0–5 times on rainy or cloudy days. In SPR, the severe wilting and partial recovery cycles were repeated 4–16 times on sunny days and 0–4 times on rainy or cloudy days. W in both MPR and SPR recovered to 0–2% following irrigation at 18:00 before the night. During the 92-day experimental period, 73 days (80%) were sunny, and 19 days (20%) were rainy or cloudy. The means daily maximum W throughout the experiment in MPR and SPR were 8.1% and 13.2% when wilting ratios were set to 7% and 14% in MPR and SPR, respectively.
Moreover, the CWR in SPR was 2–15-fold higher than that in MPR on sunny days, and the CWRs in MPR and SPR were 0% on some rainy or cloudy days (Figure 2). CWR followed a similar trend for DLI and VPD, which was lower at 43–60 DAT than that at 1–42 and 61–92 DATs.

3.3. Irrigation Amount and Frequency

Irrigation amount increased as the irrigation frequency increased (Table 2). The daily irrigation amounts and frequencies in MPR and SPR were lower than those in the control. Daily irrigation frequency decreased as the threshold value increased. The daily irrigation frequency in MPR was higher than that in SPR. This led to a higher daily irrigation amount in MPR than that in SPR, because the irrigation amount per time was the same in both treatments. In MPR and SPR, the daily irrigation amounts and frequencies at 43–60 DAT were approximately 50% of those at 1–42 and 61–92 DATs. The total irrigation amounts in MPR and SPR were approximately 75% and 59% of that in the control, respectively, with that in SPR being approximately 77% of that in MPR. The corresponding total irrigation frequencies in MPR and SPR were approximately 17% and 12% of that in the control, respectively.

3.4. Plant Growth

Plant growth parameters in MPR and SPR at 92 DAT were lower than those in the control because of the reduction in the total irrigation amount (Table 3). In addition, plant length, leaf area, and the number of leaves increased as the irrigation amount increased; the values were the highest in the control. Stem diameters, FWs, and DWs in MPR and SPR were similar and lower than those in the control. The dry matter ratio of tomato plants increased as the irrigation amount decreased; the value was the highest in SPR. The percentages relative to the control in plant length, leaf area, and the number of leaves in MPR and SPR were similar to the total irrigation amount.

3.5. Yield

The days from anthesis to harvest in MPR and SPR were approximately four days shorter than that in the control during the experimental period (Figure 3). The days from anthesis to harvest increased from the first to the third harvest and decreased from the fourth to the eighth harvest in the three treatments.
The accumulated fruit yields in control, MPR, and SPR were 2.0, 1.5, and 1.1 kg per plant at 91 DAT (Figure 4a). The accumulated fruit yields in MPR and SPR were 76% and 56% of that in the control at 91 DAT, respectively. In addition, the accumulated numbers of harvested fruits per plant in MPR and SPR were 85% and 75% of that in the control at 91 DAT, respectively (Figure 4b). Fruit fresh weights in all treatments were constant, and the values in MPR and SPR were 81% and 69% of that in the control at 91 DAT, respectively (Figure 4c). The fruit dry weights in control, MPR, and SPR gradually decreased (Figure 4d).

3.6. Fruit Quality

Brix increased as the water stress level increased, and the value was the highest in SPR (Figure 5a). In addition, the Brix of tomato fruits in the three treatments decreased from the second to the fourth harvest (49–63 DAT) and then increased from the fourth to the fifth harvest (63–71 DAT). From the fifth to the eighth harvest (71–91 DAT), Brix in the control decreased gradually; however, Brix in MPR was constant and the value in SPR increased gradually. The Brix of fruits in MPR and SPR were 15% and 34% higher than that in the control at 91 DAT, respectively. The corresponding acidity increased as the water stress level increased, and the values in MPR and SPR were 10% and 24% higher than that in the control at 91 DAT, respectively (Figure 5b).

4. Discussion

4.1. Irrigation Management Using the Image-Based Irrigation System

Previous studies based on soil water content or transpiration estimation [2,3,4,5,6] could not adjust the degree of recovery from wilting because they did not consider wilting changes in tomato plants and the delay between soil water absorption stress and plant wilting. Although some studies [9,10,11,12] monitored wilting changes in tomato plants in real-time and irrigated them when the wilting level reached a certain threshold values. However, few of these studies have attempted to investigate the effect of the amount of each irrigation on the degree of recovery from wilting.
The present study demonstrated that the image-based irrigation system could control partial recovery from wilting after irrigation. The total irrigation amount in SPR was lower than that in MPR. Our previous study [14] reported that full recovery from wilting after irrigation was achieved using the same system. These results indicated that the image-based irrigation system could adjust the degree of recovery from wilting and the total irrigation amount.

4.2. Plant Growth

Prolonging exposure to water stress decreases plant length and leaf area [7], stem diameter [6], number of leaves [14], and fresh and dry weights [15] of tomatoes because of the inhibition of cell elongation by reducing turgor pressure [16]. Consistent with numerous previous studies, plant growths in MPR and SPR were reduced compared with the control because the total irrigation amounts in MPR and SPR were lower than that in the control (Table 3). Comparing the control and the two water stress treatments, the reduction ratio due to water stress was more significant for fresh weight than dry weight. This indicated that even though less water was allocated to the leaves, the photosynthesis in leaves could continue under water stress, causing higher dry matter ratios in MPR and SPR than that in the control.
In the present study, plant length, leaf area, and the number of leaves in MPR were higher than those in SPR, while other growth parameters were not different in either treatment despite the different threshold values and irrigation amounts (Table 3). It has been suggested that plant length, leaf area, and the number of leaves are more sensitive to water stress than other growth parameters. In addition, there was no difference in dry weight between MPR and SPR, indicating that the net photosynthetic rate was similar between the two treatments during the experimental period. Thus, we speculate that deficit irrigation affects water allocation to the stems and leaves earlier than photosynthesis.

4.3. Yield

Consistent with our previous study [14], which revealed that water stress could reduce the days from anthesis to harvest of tomato fruits, we found that days from anthesis to harvest in MPR and SPR were shorter than that in the control. Water stress may accelerate fruit maturation for seed ripening by receiving stress response signals and then early termination of fruit enlargement, resulting in a small fruit size.
In the present study, the total irrigation amounts in MPR and SPR were 27 and 45 L lower than that in the control, respectively (Table 2). However, the days from anthesis to harvest in MPR and SPR were similar (Figure 3). It is suggested that the total irrigation amounts in the two treatments may be at similar levels, which could shorten the days from anthesis to harvest to a particular value during this season.
The decreased tomato yield by water stress is mainly due to a reduced fresh weight of individual fruit at harvest [14,17]. Two mechanisms may limit fruit growth: (1) direct limitation of fruit growth caused by a reduction in cell turgor in response to water stress and (2) limitation of the transfer of photosynthetic products to tomato fruit owing to a decrease in the net photosynthetic rate [4]. Generally, reducing the irrigation amount decreases tomato yield [7,17,18]. Liu et al. [2] reported that when tomato plants were irrigated at 70% and 50% crop evapotranspiration (ETc), the fruit yields of tomatoes were approximately 95% and 75% of that in the control (irrigated at 100% ETc), respectively. Mitchell et al. [19] reported that when irrigation amounts were 33% and 56% of that in the control with sufficient irrigation, the fruit yields of tomatoes were 70.2% and 92.3% of that in the control, respectively. In the present study, the total irrigation amounts applied in MPR and SPR were approximately 75% and 59% of that in the control (Table 2), resulting in fruit yields (including the number and fresh weight of fruit) being approximately 76% and 56% of that in the control, respectively (Figure 4a–c). These results showed that the fruit yield of tomatoes decreased in response to the decreased total irrigation amount. The percentage decrease in fruit yield was also proportional to the decrease in total irrigation amount.
The present study showed that fruit dry weight in all treatments decreased depending on DAT (Figure 4d). Sato and Thomas [20] reported that photosynthesis in tomato plants decreased when air temperature increased from 28/22 to 32/26 °C. Moreover, Ruiz-Nieves et al. [21] reported that the reduced fruit dry weight of tomatoes was attributed to an increase in carbohydrate loss via respiration when the mean air temperature increased from 21.7/17.5 to 24.3/18.0 °C. According to these reports, the main reason for the decrease in fruit dry weight in our experiment may be an increase in air temperature in the greenhouse from approximately 25/20 to 30/26 °C, despite the increased DLI, which accelerates photosynthesis.

4.4. Fruit Quality

Although water stress reduces tomato yield, fruit quality is improved [2,3]. Water stress reduces water flow from the xylem to the fruit [22], resulting in reduced fruit size and higher concentrations of sugars and acids, which improves the fruit quality of tomatoes. In addition, water stress promotes starch accumulation in immature fruits [19] and facilitates the transfer of starch to hexose in mature fruits, thereby increasing the Brix in tomato fruit. Consistent with these studies, we found an increase in fruit quality and a decrease in yield depending on the decrease in the total irrigation amount under water stress conditions. However, the changes in Brix and acidity in all treatments throughout the experiment indicated the environmental effects on fruit quality.
In general, a low DLI may reduce photosynthesis and the growth rate of tomatoes, resulting in lower fruit quality. Kubota et al. [23] reported that the Brix of tomato fruits decreased as the DLI decreased. Consistent with the findings of Kubota et al. [23], the Brix of tomato fruits harvested from 49 to 63 DAT in all treatments in our study decreased because the development period of these fruits was in the low DLI period at 43–60 DAT (Figure 5).
After 70 DAT, the transient tendency of fruit quality differed among treatments (Figure 5). In the control, fruit quality gradually decreased despite the period with increased DLI. The optimum air temperature for the growth of tomatoes is 18 °C (nighttime) to 25 °C (daytime) [24]. When air temperature reached 35 °C, the net photosynthetic rate and rubisco activity of tomatoes decreased [25] and caused a low sugar accumulation even though DLI was high. Furthermore, although the increased transpiration of tomatoes during the high-air-temperature and high-VPD period may help improve fruit quality [26], sufficient irrigation in the control increased the water content of fruits and decreased fruit quality. These negative effects indicate the difficulty of high-quality tomato production during the summer season in a greenhouse.
On the other hand, fruit quality did not decrease in MPR and gradually increased in SPR after 70 DAT (Figure 5). Because of the negative effects of the high air temperature mentioned above, the Brix at 7% in this study was lower than that at 9% in our previous study [14]. However, the results of this experiment indicate that severe water stress by severe wilting with partial recovery could be an effective irrigation method to improve fruit quality, even at high-air-temperature periods in summer.
Compared with our previous full-recovery experiment [14], the present partial-recovery experiment showed that a high threshold value was better than a moderate threshold value for producing high-quality tomatoes. Therefore, further studies are required to investigate the effects of severe wilting with full or partial recovery irrigation on the photosynthesis, growth, yield, and fruit quality of tomatoes.

5. Conclusions

This study demonstrated the possibility of using an image-based irrigation system to adjust the degree of recovery from wilting after irrigation and the total irrigation amount. The total irrigation amounts in MPR and SPR were 75% and 59% of that in the control, respectively. The corresponding yields in MPR and SPR were 76% and 56% of that in the control, respectively. The Brix and acidity of the fruits in MPR and SPR were 15% and 10% and 34% and 24% higher, respectively, than those in the control at the end of the experiment. Plant growth decreased with increasing water stress levels. The plant length, leaf area, and the number of leaves of tomatoes were more sensitive to water stress than other growth parameters. Severe wilting with partial recovery irrigation could be an effective irrigation method to improve fruit quality, even at high-air-temperature periods in the summer.

Author Contributions

Methodology, investigation, data curation, analysis, and writing—original draft preparation, F.Z. and S.H.; validation and supervision, S.H.; writing—review and editing, E.G., S.H. and H.Y. All authors have read and agreed to the published version of the manuscript.

Funding

This research was funded by Kubota Corporation, Osaka, Japan.

Institutional Review Board Statement

Not applicable.

Informed Consent Statement

Not applicable.

Data Availability Statement

Data is contained within the article.

Acknowledgments

The authors would like to thank Asako Amitani, Hironobu Koga, and Masahiko Yasui from the Technology Innovation Research and Development Unit of Kubota Corporation for their technical support on the image-based irrigation system.

Conflicts of Interest

The authors declare no conflict of interest. The funders had no role in the design of the study; in the collection, analyses, or interpretation of data; in the writing of the manuscript, or in the decision to publish the results.

References

  1. Nuruddin, M.M.; Madramootoo, C.A.; Dodds, G.T. Effects of water stress at different growth stages on greenhouse tomato yield and quality. HortScience 2003, 38, 1389–1393. [Google Scholar] [CrossRef] [Green Version]
  2. Liu, H.; Li, H.H.; Ning, H.F.; Zhang, X.X.; Li, S.; Pang, J.; Wang, G.S.; Sun, J.S. Optimizing irrigation frequency and amount to balance yield, fruit quality and water use efficiency of greenhouse tomato. Agric. Water Manag. 2019, 226, 105787. [Google Scholar] [CrossRef]
  3. Machado, R.M.A.; Oliveira, M.D.R.G. Tomato root distribution, yield and fruit quality under different subsurface drip irrigation regimes and depths. Irrig. Sci. 2005, 24, 15–24. [Google Scholar] [CrossRef] [Green Version]
  4. Rao, N.K.S.; Bhatt, R.M.; Sadashiva, A.T. Tolerance to water stress in tomato cultivars. Photosynthetica 2000, 38, 465–467. [Google Scholar] [CrossRef]
  5. Yuan, X.K.; Yang, Z.Q.; Li, Y.X.; Liu, Q.; Han, W. Effects of different levels of water stress on leaf photosynthetic characteristics and antioxidant enzyme activities of greenhouse tomato. Photosynthetica 2016, 54, 28–39. [Google Scholar] [CrossRef]
  6. Chand, J.; Hewa, G.; Hassanli, A.; Myers, B. Evaluation of deficit irrigation and water quality on production and water productivity of tomato in greenhouse. Agriculture 2020, 10, 297. [Google Scholar] [CrossRef]
  7. Nangare, D.D.; Singh, Y.; Kumar, P.S.; Minhas, P.S. Growth, fruit yield and quality of tomato (Lycopersicon esculentum Mill.) as affected by deficit irrigation regulated on phenological basis. Agric. Water Manag. 2016, 171, 73–79. [Google Scholar] [CrossRef]
  8. Badr, M.A.; El-Tohamy, W.A.; Abou-Hussein, S.D.; Gruda, N. Tomato yield, physiological response, water and nitrogen use efficiency under deficit and partial root zone drying irrigation in an arid region. J. Appl. Bot. Food Qual. 2018, 91, 332–340. [Google Scholar] [CrossRef]
  9. Nakahara, M.; Inoue, Y. Detecting water stress in differentially-irrigated tomato plants with infrared thermometry for cultivation of high-Brix fruits. J. Agric. Meteorol. 1997, 53, 191–199, (In Japanese with English abstract). [Google Scholar] [CrossRef]
  10. Oishi, N. Development of irrigation control system in response to plant water stress in tomato hydroponics (1)—Non-destructive evaluation of plant water stress by the change of stem diameter. Environ. Control. Biol. 2002, 40, 81–89, (In Japanese with English abstract). [Google Scholar] [CrossRef] [Green Version]
  11. Oishi, N.; Imahara, J.; Kani, H. Development of fertigation control system based on measuring plant weight using load cell for high-Brix tomato hydroponics. J. SHTA 2018, 30, 94–102, (In Japanese with English abstract). [Google Scholar] [CrossRef] [Green Version]
  12. Takayama, K.; Nishina, H. Early detection of water stress in tomato plants based on projected plant area. Environ. Control. Biol. 2007, 45, 241–249. [Google Scholar] [CrossRef] [Green Version]
  13. Hikosaka, S.; Inoue, K.; Ishigami, Y.; Goto, E. Development of an automatic water-stress control system by image analysis for the production of high-quality tomato. Acta Hortic. 2019, 1296, 1027–1034. [Google Scholar] [CrossRef]
  14. Zhao, F.; Yoshida, H.; Goto, E.; Hikosaka, S. Development of an automatic irrigation method using an image-based irrigation system for high-quality tomato production. Agronomy 2022, 12, 106. [Google Scholar] [CrossRef]
  15. Saha, R.R.; Hara, M.H. Influence of different soil moisture regimes on biomass production, water use, and nitrogen nutrition of tomato plants. Environ. Control. Biol. 1998, 36, 1–12. [Google Scholar] [CrossRef] [Green Version]
  16. Kiani, S.P.; Talia, P.; Maury, P.; Grieu, P.; Heinz, R.; Perrault, A.; Nishinakamasu, V.; Hopp, E.; Gentzbittel, L.; Paniego, N.; et al. Genetic analysis of plant water status and osmotic adjustment in recombinant inbred lines of sunflower under two water treatments. Plant Sci. 2007, 172, 773–787. [Google Scholar] [CrossRef]
  17. Liu, H.; Duan, A.W.; LI, F.S.; Sun, J.S.; Wang, Y.C.; Sun, C.T. Drip irrigation scheduling for tomato grown in solar greenhouse based on pan evaporation in North China Plain. J. Integr. Agric. 2013, 12, 520–531. [Google Scholar] [CrossRef]
  18. Harmanto; Salokhe, V.M.; Babel, M.S.; Tantau, H.J. Water requirement of drip irrigated tomatoes grown in greenhouse in tropical environment. Agric. Water Manag. 2005, 71, 225–242. [Google Scholar] [CrossRef]
  19. Mitchell, J.P.; Shennan, C.; Grattan, S.R.; May, D.M. Tomato fruit yields and quality under water deficit and salinity. J. Am. Soc. Hortic. Sci. 1991, 116, 215–221. [Google Scholar] [CrossRef] [Green Version]
  20. Sato, S.; Peet, M.M.; Thomas, J.F. Physiological factors limit fruit set of tomato (Lycopersicon esculentum Mill.) under chronic, mild heat stress. Plant Cell Environ. 2000, 23, 719–726. [Google Scholar] [CrossRef]
  21. Ruiz-Nieves, J.M.; Ayala-Garay, O.J.; Serra, V.; Dumont, D.; Vercambre, G.; Génard, M.; Gautier, H. The effects of diurnal temperature rise on tomato fruit quality. Can the management of the greenhouse climate mitigate such effects? Sci. Hortic. 2021, 278, 109836. [Google Scholar] [CrossRef]
  22. Guichard, S.; Bertin, N.; Leonardi, C.; Gary, C. Tomato fruit quality in relation to water and carbon fluxes. Agronomie 2001, 21, 385–392. [Google Scholar] [CrossRef]
  23. Kubota, C.; Kroggel, M.; Torabi, M.; Dietrich, K.A.; Kim, H.J.; Fonseca, J.; Thomson, C.A. Changes in selected quality attributes of greenhouse tomato fruit as affected by pre- and postharvest environmental conditions in year-round production. HortScience 2012, 47, 1698–1704. [Google Scholar] [CrossRef] [Green Version]
  24. Hussey, G. Growth and development in the young tomato: III. The effect of night and day temperatures on vegetative growth. J. Exp. Bot. 1965, 16, 373–385. [Google Scholar] [CrossRef]
  25. Lu, T.; Meng, Z.J.; Zhang, G.X.; Qi, M.F.; Sun, Z.P.; Liu, Y.F.; Li, T.L. Sub-high temperature and high light intensity induced irreversible inhibition on photosynthesis system of tomato plant (Solanum lycopersicum L.). Front. Plant Sci. 2017, 8, 365. [Google Scholar] [CrossRef] [PubMed] [Green Version]
  26. Leonardi, C.; Guichard, S.; Bertin, N. High vapour pressure deficit influences growth, transpiration and quality of tomato fruits. Sci. Hortic. 2000, 84, 285–296. [Google Scholar] [CrossRef]
Figure 1. Typical diurnal changes in the wilting ratio (W) in MPR and SPR from 06:30 to 18:00 on a sunny (a) and cloudy day (b). MPR: moderate wilting–partial recovery treatment. SPR: severe wilting–partial recovery treatment.
Agronomy 12 01410 g001
Figure 2. Cumulative wilting ratio during a 92-day experimental period. MPR: moderate wilting–partial recovery treatment. SPR: severe wilting–partial recovery treatment. DAT: days after the start of treatments.
Agronomy 12 01410 g002
Figure 3. The days from anthesis to harvest of the eight-time-harvested fruits in control, MPR, and SPR. MPR: moderate wilting–partial recovery treatment. SPR: severe wilting–partial recovery treatment.
Agronomy 12 01410 g003
Figure 4. Effects of water stress on the accumulated fruit yield (a), accumulated number of harvested fruits (b), fruit fresh weight (c), and fruit dry weight (d) of tomatoes. Throughout the experiment, fruits were harvested eight times [42, 49, 56, 63, 71, 77, 85, and 91 days after the start of treatments (DAT)] from 17 to 20 tomato plants in each treatment. MPR: moderate wilting–partial recovery treatment. SPR: severe wilting–partial recovery treatment.
Agronomy 12 01410 g004
Figure 5. Effects of the days after the start of treatments (DAT) on the Brix (a) and acidity (b) of tomato fruits. Throughout the experiment, fruits were harvested eight times [42, 49, 56, 63, 71, 77, 85, and 91 days after the start of treatments (DAT)]. Error bars represent ± standard error. Different letters indicate significant differences among the treatments in each harvest based on the Tukey–Kramer’s test (p < 0.05, n = 4–6). MPR: moderate wilting–partial recovery treatment. SPR: severe wilting–partial recovery treatment.
Agronomy 12 01410 g005
Table 1. Environmental conditions during a 92-day experimental period.
Environmental Factors1–42 DAT43–60 DAT61–92 DAT
Daily Light Integral (DLI)
(mol m–2 day–1)
25.115.930.6
Air Temperature
(daytime/nighttime) (°C)
24.6/19.924.7/21.930.1/25.7
Vapor Pressure Deficit (VPD)
(daytime/nighttime) (kPa)
1.1/0.40.8/0.41.4/0.6
DAT: days after the start of treatments.
Table 2. Irrigation amount and frequency during a 92-day experimental period.
Treatment
(DAT)
Daily Irrigation Amount (L/Plant)
/Irrigation Frequency (Times)
Irrigation Amount (L/Plant)/Irrigation Frequency (Times)
(1–42)(43–60)(61–92)Total (1–92)
Control1.20/401.20/401.20/40110/3680
(100/100) y
MPR0.96/6.20.53/4.21.04/9.183/628
(75/17)
SPR0.78/5.40.40/2.70.76/4.665/424
(59/12)
MPR: moderate wilting–partial recovery treatment. SPR: severe wilting–partial recovery treatment. DAT: days after the start of treatments. y: relative values when the control was considered 100%.
Table 3. Effects of water stress on tomato growth measured at 92 days after the start of treatments (DAT).
TreatmentPlant
Length (m)
Stem
Diameter (mm)
Leaf Area (m2/Plant)Number of Leaves (/Plant)Fresh Weight (kg/Plant)Dry Weight
(g/Plant)
Dry
Matter Ratio (%)
Control5.0 ± 0.1 a z
(100) y
12.2 ± 0.3 a
(100)
0.27 ± 0.02 a
(100)
61 ± 1 a
(100)
1.32 ± 0.14 a
(100)
147 ± 15 a
(100)
11.13 ± 0.08 b
(100)
MPR4.3 ± 0.1 b
(85)
10.4 ± 0.4 b
(85)
0.20 ± 0.01 ab
(75)
56 ± 1 b
(92)
0.90 ± 0.07 b
(68)
129 ± 8 b
(88)
14.35 ± 0.18 a
(129)
SPR3.9 ± 0.1 c
(78)
10.3 ± 0.2 b
(84)
0.17 ± 0.01 b
(64)
52 ± 0 c
(86)
0.89 ± 0.03 b
(67)
127 ± 4 b
(87)
14.37 ± 0.18 a
(129)
Each value is presented as the mean ± standard error. MPR: moderate wilting–partial recovery treatment. SPR: severe wilting–partial recovery treatment. z: different letters in the same columns indicate significant differences among the treatments based on the Tukey–Kramer’s test (p < 0.05, n = 3). y: relative values when the control was considered 100%.
Publisher’s Note: MDPI stays neutral with regard to jurisdictional claims in published maps and institutional affiliations.

