Article

Long-Term No-Till Conservation Agriculture and Nitrogen Fertilization on Soil Micronutrients in a Semi-Arid Region of South Africa

by
Samukelisiwe G. Zulu
1,
Lembe S. Magwaza
2,3,
Nozipho M. Motsa
1,
Nkanyiso J. Sithole
4,5,* and
Khayelihle Ncama
4,5
1
Department of Agriculture, Faculty of Science and Agriculture, University of Zululand, Private Bag X1001, KwaDlangezwa, Empangeni 3886, South Africa
2
Discipline of Crop Science, School of Agricultural, Earth and Environmental Sciences, University of KwaZulu-Natal, Pietermaritzburg 3209, South Africa
3
Discipline of Horticultural Science, School of Agricultural, Earth and Environmental Sciences, University of KwaZulu-Natal, Pietermaritzburg 3209, South Africa
4
Department of Crop Sciences, Faculty of Natural and Agricultural Sciences, North-West University, Private Bag X2046, Mmabatho 2790, South Africa
5
Food Security and Safety Niche Area, Faculty of Natural and Agricultural Sciences, North-West University, Mmabatho 2790, South Africa
*
Author to whom correspondence should be addressed.
Agronomy 2022, 12(6), 1411; https://doi.org/10.3390/agronomy12061411
Submission received: 9 May 2022 / Revised: 29 May 2022 / Accepted: 5 June 2022 / Published: 12 June 2022

Abstract

:
Knowledge of the long-term complex relationship between soils, crops, and management practices, such as conservation agriculture, is critical in developing nutrient management strategies to optimise crop yields. This study examined the concentration, and the distribution of, soil micronutrients along the soil profile (0–10, 10–20, and 20–30 cm depths) under different tillage practices: no-till (NT), rotational tillage (RT), and conventional tillage (CT), and nitrogen fertilizer application rates (0, 100, 200 kg/ha) in a semi-arid environment after 17 years of implementation of the trial. The results found the lowest concentration (p < 0.05) of copper (Cu) (1.254 mg/kg) and iron (Fe) (22.671 mg/kg) in CT compared to NT [Cu (1.447 mg/kg), Fe (41,156 mg/kg)] and RT [Cu (2.389 mg/kg), Fe (120,437 mg/kg)] treatments. This correlated with the lower soil pH in NT compared to CT treatment, and slightly higher (p > 0.05) under NT (1.782 mg/g) compared to RT (1.715 mg/g) and CT (1.750 mg/g). There were no differences (p > 0.05) in zinc (Zn) in NT (2.856 mg/kg) and RT (2.782 mg/kg) but CT (2.010 mg/kg) treatment was significantly (p < 0.05) lower compared to these treatments. Manganese (Mn) also followed a similar trend whereby CT still had the lowest concentration (p < 0.05) of Mn (8.01 mg/kg) compared to RT (10.71 mg/kg) and NT (11.98 mg/kg). The concentration of Mn, Zn, and Fe was found to be similar (p > 0.05) with an increase in sampling depths. On the other hand, Cu was found to be different (p < 0.05) at different sampling depths. Manganese (10.46 mg/kg) and Soil Organic Carbon (SOC) (2.026 mg/g) were found to be concentrated near the 0–10 cm soil surface depth while Zn (2.558 mg/kg), Fe (66,217 mg/kg) and Cu (1.867 mg/kg) were more at the 20–30 cm depth in reduced tillage treatments. The results also showed no differences (p > 0.05) in the concentration of Cu, Mn, and Zn at different levels of nitrogen fertilizer under all tillage treatments. It was concluded that NT and rational tillage with mulch, favoured the availability of micronutrients (Cu, Mn, Fe, and Zn) in the studied cropping system.

1. Introduction

The deficiency in micronutrients in humans is a major global health problem and usually results from an imbalanced diet [1] and in this, about two billion of the world’s population suffer from insufficient amounts of micronutrients [2]. Poor communities hardly consume adequate mineral-rich vegetables, fruits, and dairy products and their diet is mainly composed of grain products given that they are more affordable than fruits and vegetables. Hence, most of these communities, especially in the developing countries such as those in sub-Saharan Africa (SSA), suffer from micronutrient deficiencies, known as the “hidden hunger” [3]. Therefore, farmers in these regions are not only faced with the challenge to increase food production to meet the demand of the growing population [4] but also increasing the micronutrient density of staple crops in order to provide a balanced diet required for healthy growth and development in humans and the livestock that depend on cereals such as maize for feed [2,5]. In many countries in SSA and Central Europe, grains such as maize are used for human and livestock nutrition, and micronutrients are of key importance in feeding the animals such as cows, poultry, and pigs, however, a low level of micronutrients may increase the cost of supplementation [6]. Soil available micronutrients determine the nutritional value of crop plants, therefore, the relationship between long-term specific soil management practices such as conservation agriculture (CA) and/or no-till, conventional tillage, and nitrogen fertilization should be determined in order to understand soil management practices that optimize crop yield and nutritional value. Conservation agriculture can be defined as a farming system that consists of crop residue mulch, cover cropping, integrated nutrient management, and no-till techniques in a rotation cycle for effective soil and water conservation, SOC sequestration, sustainable intensification, and climate change adaptation and mitigation [7]. Conceptually it is based on four principles and these are: (1) minimal soil disturbance or no disturbance, (2) permanent soil cover with residue mulch, (3) crop rotation and (4) integrated nutrient management [7]. The environmental and economic benefits of no-till implemented as a core principle of CA are well documented [8,9,10], and one key factor underlying the success of no-till in combination with the other CA principles is that it conserves soil resources by reducing wind and water erosion [11]. Recent meta-analysis data of no-till as a principle of CA have indicated that, however, the impact on crop yields, when compared with conventional tillage, is variable and influenced mostly by crop category followed by aridity index, residue management, no-till duration, and N fertilizer application rate [12]. Inorganic N fertilizer applied in the soil in turn can influence the availability of micronutrients, yet this relationship has been less reported in the literature, especially in less-developed countries.
The available soil micronutrients depend on the physical and chemical properties of the soil e.g., pH, soil organic matter content, and clay mineralogy [2]. Agronomic practices highly influence the physical and chemical properties of the soil, causing an indirect effect on the concentration and content of micronutrients. According to [11,13] the concentration of Zinc (Zn), copper (Cu), iron (Fe), and Manganese (Mn) were reported to be high in soils under a no-till cropping system with mulch when compared to conventional tillage. [11] This further indicated that Zn and Mn were more concentrated on the first few centimetres (0–2.5 cm) from the soil surface under a no-till cropping system. While under conventional tillage, extractable Zn increased with depth (7.5–15 cm). Conventionally tilled soils are usually finer in texture than soils under a no-till cropping system due to ploughing, hence the concentration of extractable micronutrients is much higher even at greater depths [14]. The increase or a decrease in extractable Zn was linked to soil organic carbon, soil pH, and the sum of extractable bases (calcium, magnesium, potassium, and sodium) [14]. Reportedly, extractable micronutrients such as Zn and Fe become less soluble at pH values greater than 7, therefore, they become less available to plants [15,16]. The lower concentration of micronutrients at the top layers of the soil profile under a conventional tillage cropping system was attributed to high mineralization of SOC [17] or uptake by plants to give high yields. These findings were contrary to earlier reports by [18], who reported no differences in concentration of Cu and Fe under different cropping systems. [13] This further indicated that a conventional tillage cropping system had a greater amount of Fe, Mn, Cu, and Zn at 30–60 cm depth compared to no-till and minimum tillage cropping systems. Micronutrients tend to leach to deeper levels under conventional tillage cropping systems thus they are highly concentrated at deeper layers of the soil profile [13,19]. These reports, therefore, are an indication that cropping systems may have an effect on the availability and the concentrations of micronutrients in the soil.
The concentration of extractable micronutrients may also be affected by the rate of nitrogen (N) fertilizer applied to the soil. The effect of N fertilizer application rates varies among the different micronutrients [20] which might also be related to cross-talks between macro- and micronutrients uptake and signaling in plants [21]. Ref. [20] reported that the concentration of extractable Cu and Zn decreased as the rate of N increased, even at shallower depths of 0–5 cm and 5–10 cm while the concentration of Mn and Fe increased with an increase in N fertilizer from 0–15 cm depth, thereafter from 15–30 cm depth, the application of N fertilizer had no effect on Mn. The interaction among micronutrients and also between micronutrients and macronutrients such as Fe, Zn, S (Sulfur), P (Phosphorus), N (nitrogen), and Mn plays a huge role in the uptake of micronutrients by crop plants as well as in the concentration of soil available nutrients. Supplementing one nutrient may affect the uptake of the other by crop plants [21]. Previous reports have shown that in soils with sufficient phosphorus, the uptake of Fe tends to be higher [22]. High levels of nitrogen have been reported to promote Pi (Phosphorus) starvation in plants which then increases the uptake of phosphorus by crop plants. Sufficient phosphorus then activates the iron uptake system in plants [22,23]. Deficiencies of P favour the accumulation of Fe and Al (Aluminum) in crop plants, hence the uptake of Fe decrease, leaving more Fe in the soil since soil available micronutrients also depend on the amounts taken by plants [22,24]. In some cases, Fe and P form precipitates in the soil, decreasing the concentration of soil available Fe and P for immediate crop use. High N fertilization has also been reported to enhance the uptake of Zn by crop plants [21]. Crosstalk between Fe and Zn has shown that high levels of Fe in soils decreased the uptake of Zn by crop plants, and this indicates that more Zn remains in the soil at high levels of Fe [21]. On the other hand, recent reports have shown that the uptake of Zn and Mn was high under Fe deficiencies [25]. Therefore, this crosstalk complex interaction amongst macro- and micronutrients, micronutrients, and micronutrients and findings in different studies with different soil management practices necessitates further research on the influence of different management practices on soil micronutrient concentration. Most of the studies on this topic have been conducted in temperate regions characterised by high rainfall. Little has been done in tropical sub-tropical areas characterised by water scarcity, high temperatures, and drought. Therefore, the objective of the study was to investigate the effect of different tillage practices and fertilizer application rates on soil micronutrients in maize continuous mono-cropping systems in a subtropical semi-arid region of South Africa.

2. Materials and Method

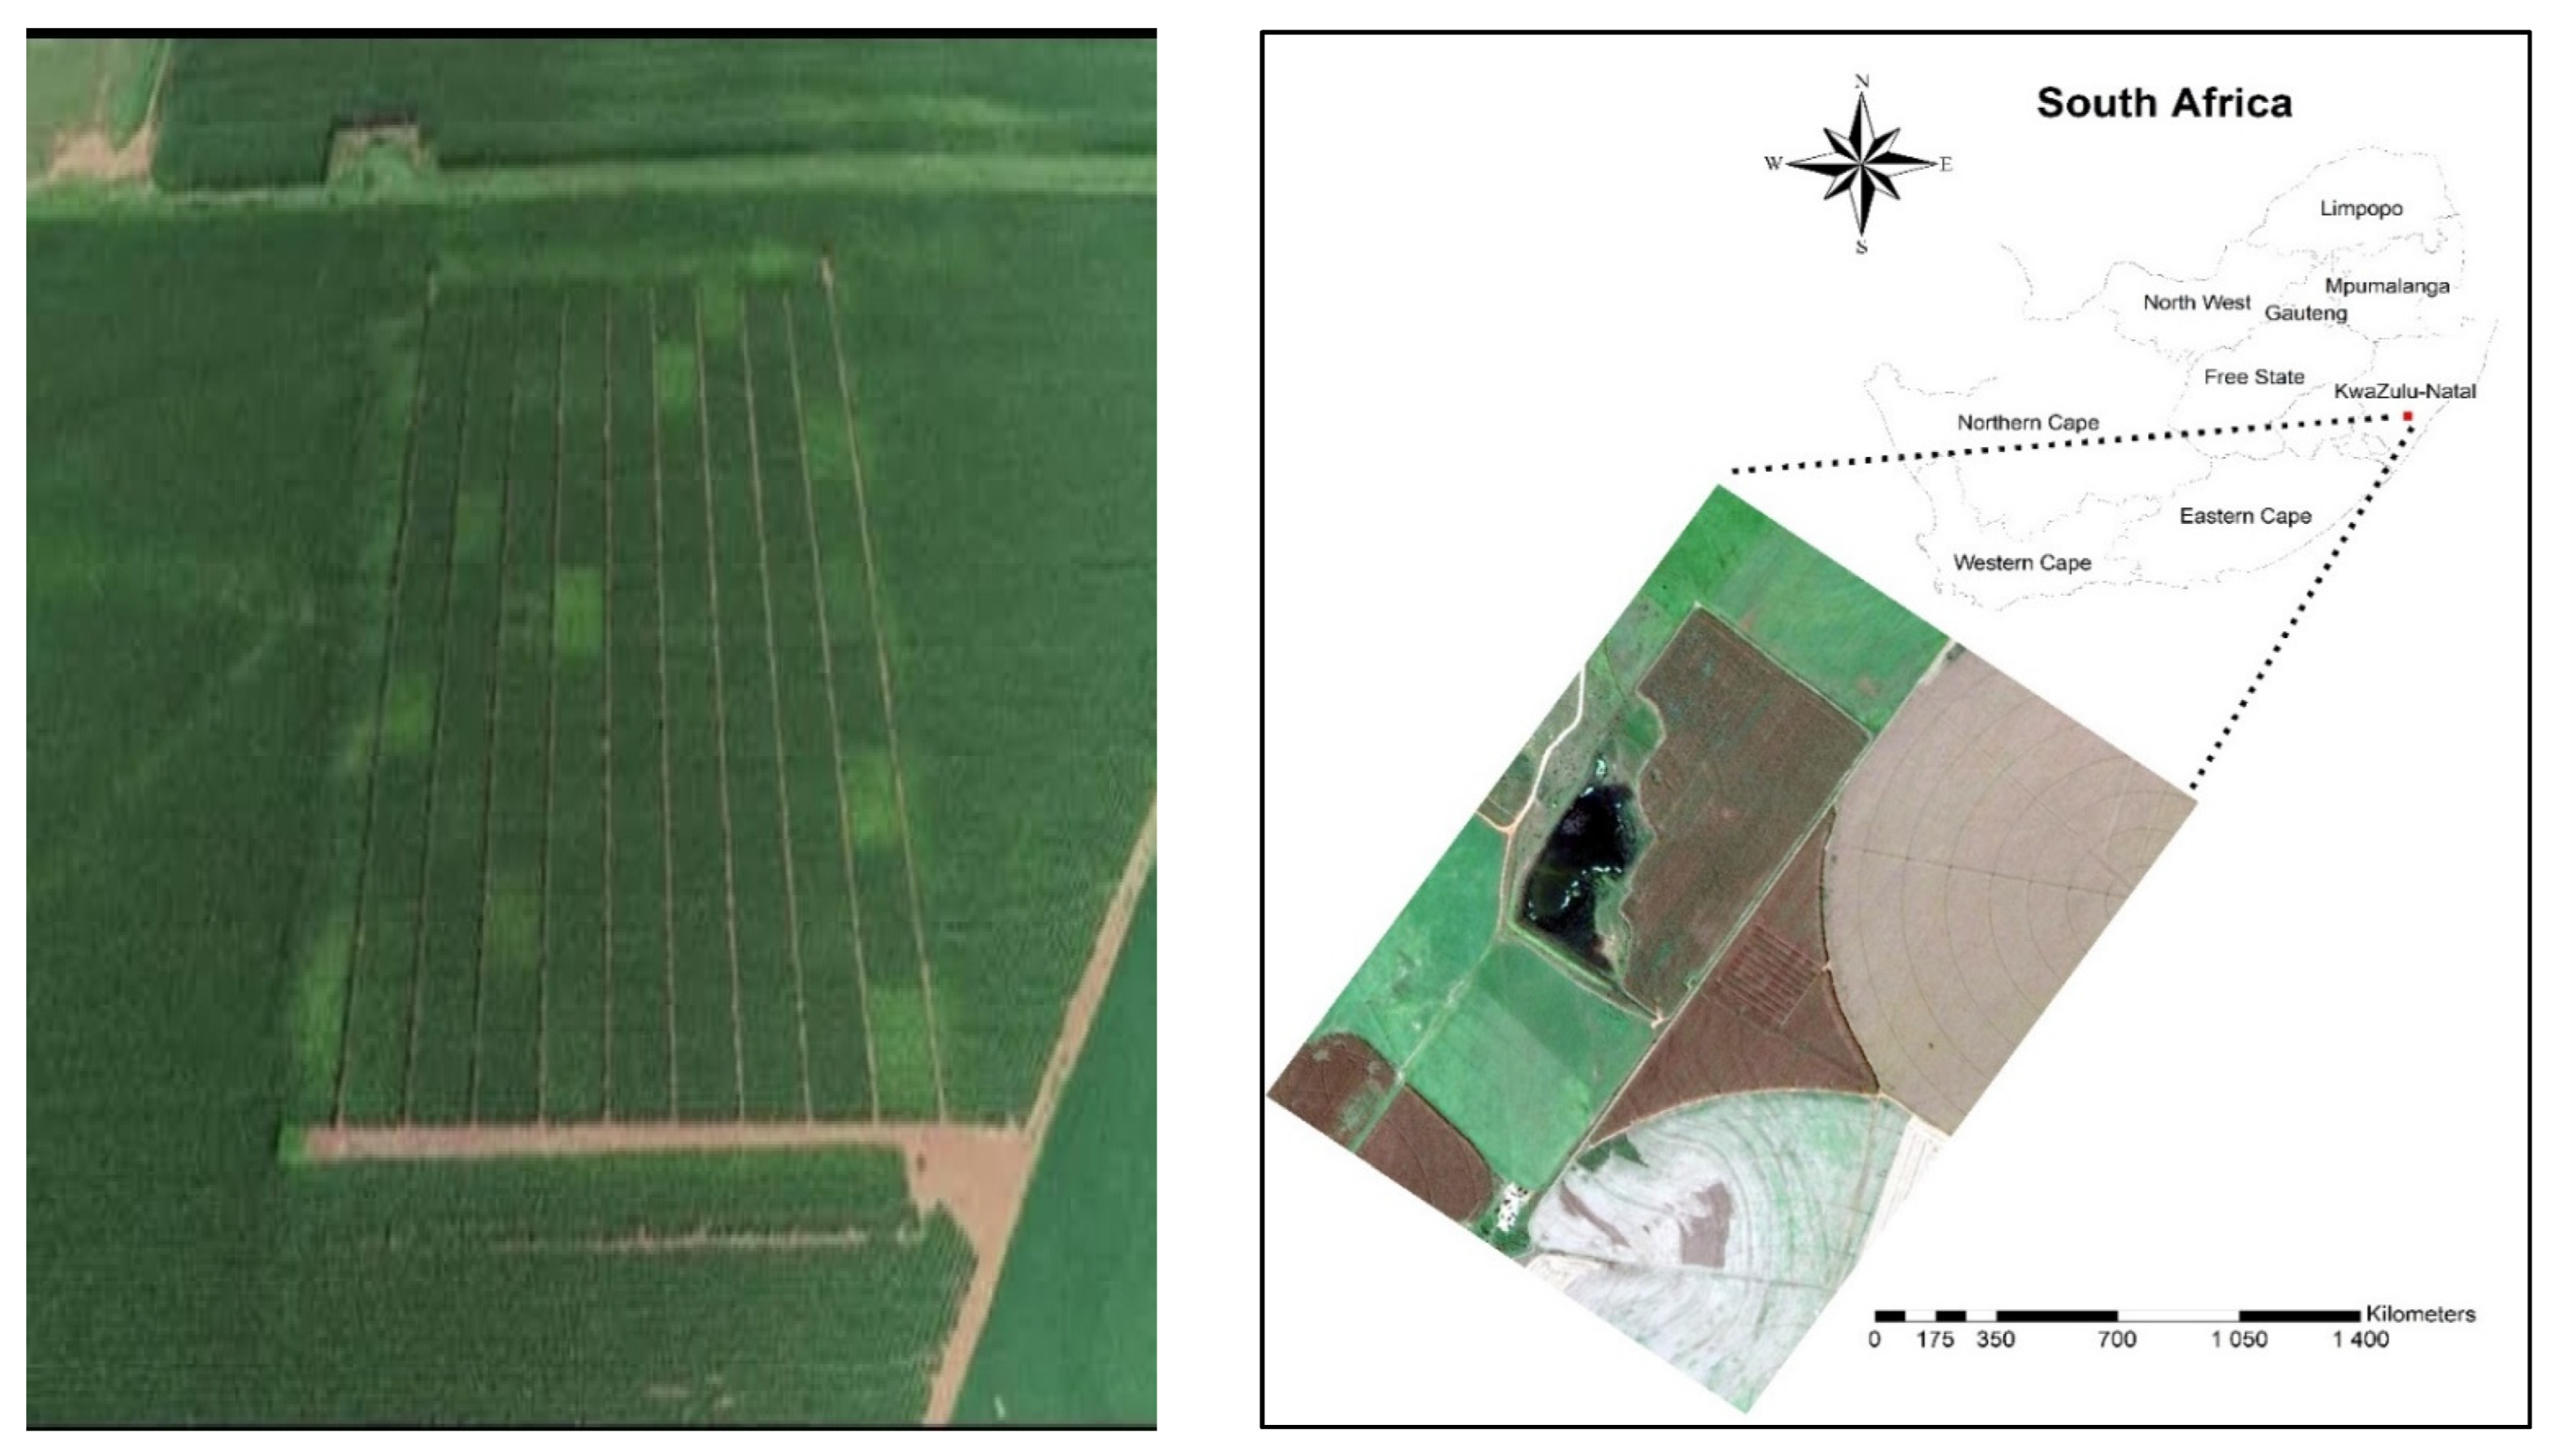
2.1. Experimental Site

The field trial (Figure 1) was established by the KwaZulu-Natal Department of Agriculture and Environmental Affairs in Winterton Bergille, (KwaZulu-Natal Province, South Africa) during the 2003–2004 growing season. The aim was to investigate the effects of different cropping systems on soil fertility, pests, and diseases in the long term. The farm, Grouton Farm, is situated at 28°55′26.83″ S, 29°33′38.64″ E, and 1038 m above sea level. In KwaZulu-Natal Province, the greatest percentage of dryland maize is produced in this area for commercial production. More rainfall is received in summer between October and March and annually, the average rainfall is 643 mm, while the average air temperature is 19.3 °C and 27.9 °C in June and January, respectively. Table 1 below shows the temperature and rainfall received during the time of experimentation. The soil is classified as Hutton non-swelling with a clay loam soil texture [26].

2.2. Experimental Design

The experiment took place on a split-plot with three tillage treatments [no-till cropping system (NT), rotational tillage cropping system (RT), and conventional tillage cropping system (CT)] randomized three times, forming the whole plot. The nitrogen (N) source (Urea or LAN) and the rate of application (0, 50, 100, 150, 200 kg/ha) formed the sub-plots which were randomized within the whole plot (see [27] for more details on field experimental layout). In this experiment only 0, 100, and 200 kg/ha N, urea plots were selected. The trial area was 0.86 ha with sub-plots of 12 × 9.5 (144 m2) rows of maize. The no-till cropping system involved direct seeding using the planter, and every time after harvesting, maize residue of about 10–12 t/ha was left on the surface as permanent soil cover. While under CT the field was ploughed using the mouldboard and disc, ploughed to a depth of 30 cm before planting. Under RT, the soil was managed under a no-till cropping system for four years and then conventionally tilled in the 5th year. The nitrogen source was urea and was top-dressed at three rates (0, 100, 200 kg/ha) four weeks after planting. Phosphorus (P) and potassium (K) were applied in a band method at a rate of 50 and 20 kg/ha, respectively. Every second season, lime of 2 t/ha was applied on the soil surface in NT plots and incorporated into the soil during ploughing in CT. Weeds were controlled chemically using S-metolachlor, atrazine, 2,4-D, and mesotrione, and these chemicals were applied using a boom sprayer of about 18 m width. Carbendazim plus flusilazole and azoxystobin were used to control leaf fungal diseases.

2.3. Soil Sampling

Soil was collected in April 2019 and August 2019 from three randomly selected positions using an auger at 0–10 cm, 10–20 cm, and 20–30 cm depth. Soil samples were then bulked and mixed thoroughly to account for plot variability. The samples were then bulked and mixed to obtain the representative sample. Soil samples were then air-dried and sieved through an 8 mm sieve then 5 mm, and mixed before analysis.

2.4. Soil pH and Soil Organic Carbon

The soil pH was measured in a 1:2.5 soil: water mixture [20]. The pH of each soil sample was measured in distilled water and 1 mol/L KCl solution at a ratio of 1:2.5 (volume: volume). 10 g portions of soil, previously dried, ground, sieved on a 2 mm sieve, and thoroughly mixed were placed using the plastic calibrated spoon in 50–100 mL beakers. Thereafter, 25 mL distilled water or 1 mol/L KCl were added, respectively. The solutions/ mixtures were replicated three times. After hand mixing, the suspensions were left overnight. The next day, the suspensions were mixed twice before pH measurement. pH readings were taken using a pH metre calibrated based on standard buffer solutions in a pH range of 4.01, 7.01, 10.01 [28]
Soil total C was analysed by an automated Dumas dry combustion method using a LECO CNS-2000 [28]. Air-dried soil samples were passed through a 0.5 mm sieve size, then a 0.5 g sample was measured and placed in the LECO for analysis of C. The procedure was based on the dry combustion of air-dried samples in crucibles, subjected to a 1350 °C furnace temperature for about 7 min.

2.5. Micronutrient

Micronutrients were extracted using 70% nitric acid following the EPA 3052 method [29]. In this method, 0.5 g soil samples were placed in reaction vessels and 8 mL of nitric acid was added. Samples were then heated at 180 °C for 30 min then filtered into 0.45 micropores syringes before analysis. The samples were then analysed using Inductively Coupled Plasma Optical Emission Spectrometry (ICP-OES, 5300 DV, Perkin Elmer, Waltham, WA, USA), 5300 DV, for Fe, Mn, Zn, and Cu using a wavelength of 550 nm [30].

2.6. Statistical Analysis

Soil micronutrients, soil organic carbon, and bulk density data were analysed using GenStat16 software (VSN International, 2009). Data were subjected to an ANOVA and means were separated by LSD (least significant difference) at a 5% level of significance using Tukey’s least significant difference. The PCA was performed using STATISTICA (version 7.0, StatSoft, Southern African Analytics, Tulsa, OK, USA).

3. Results

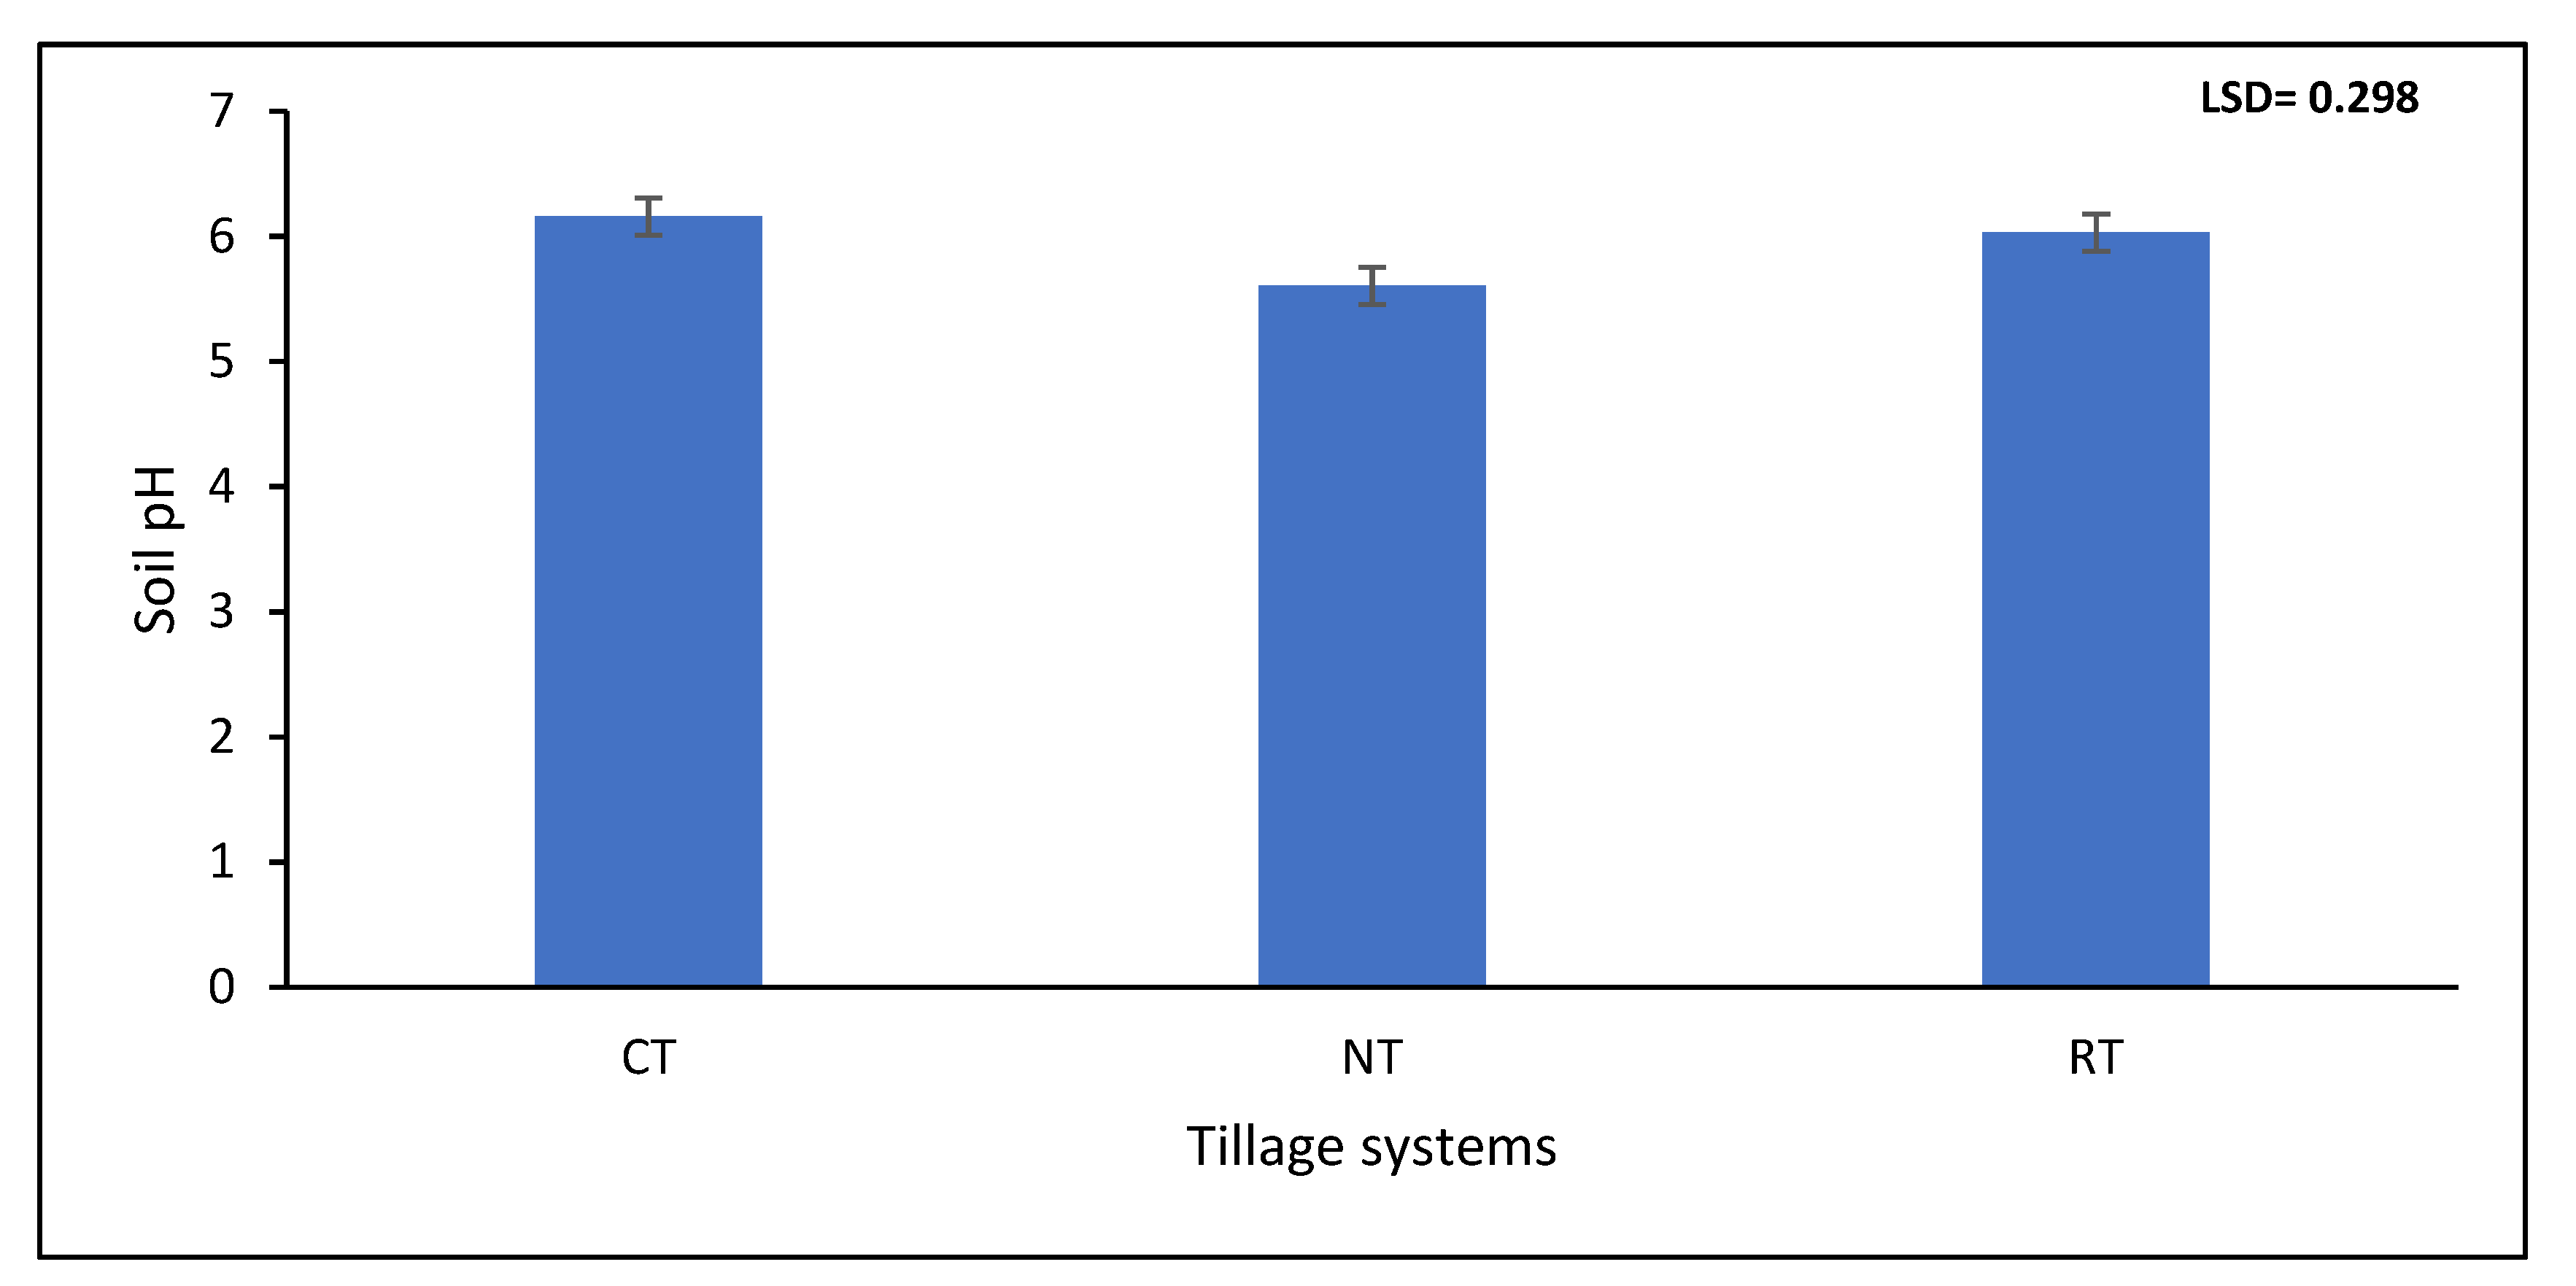
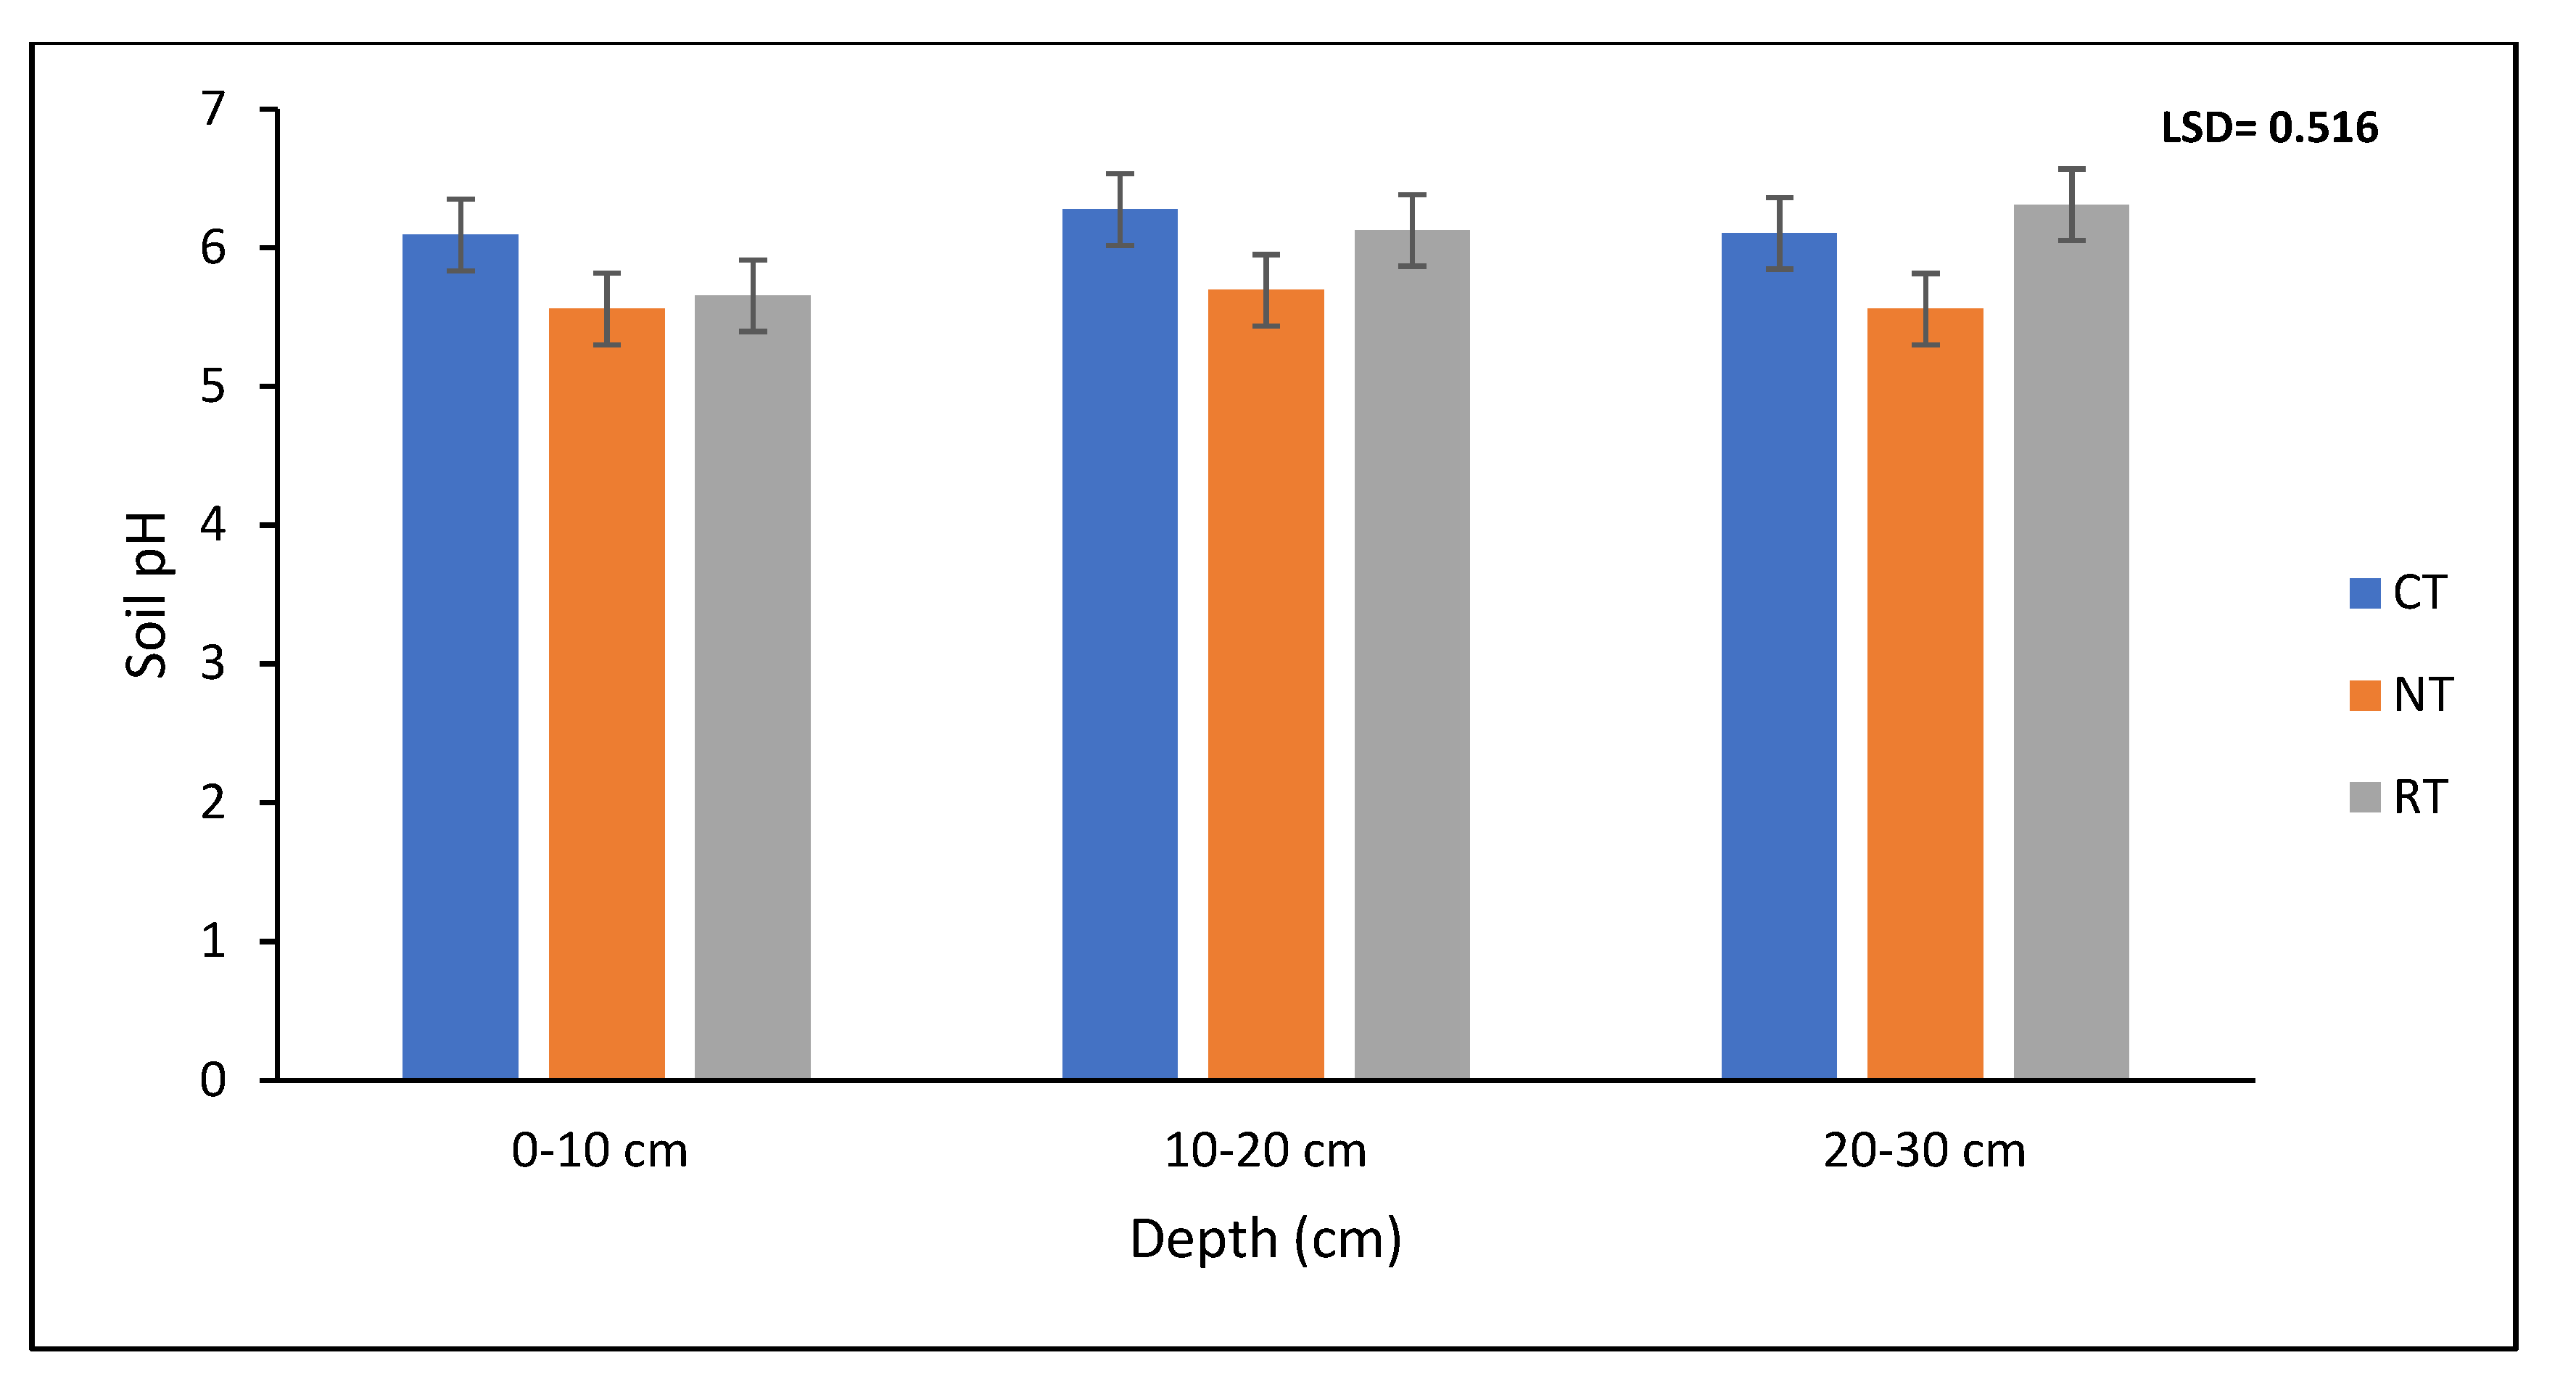
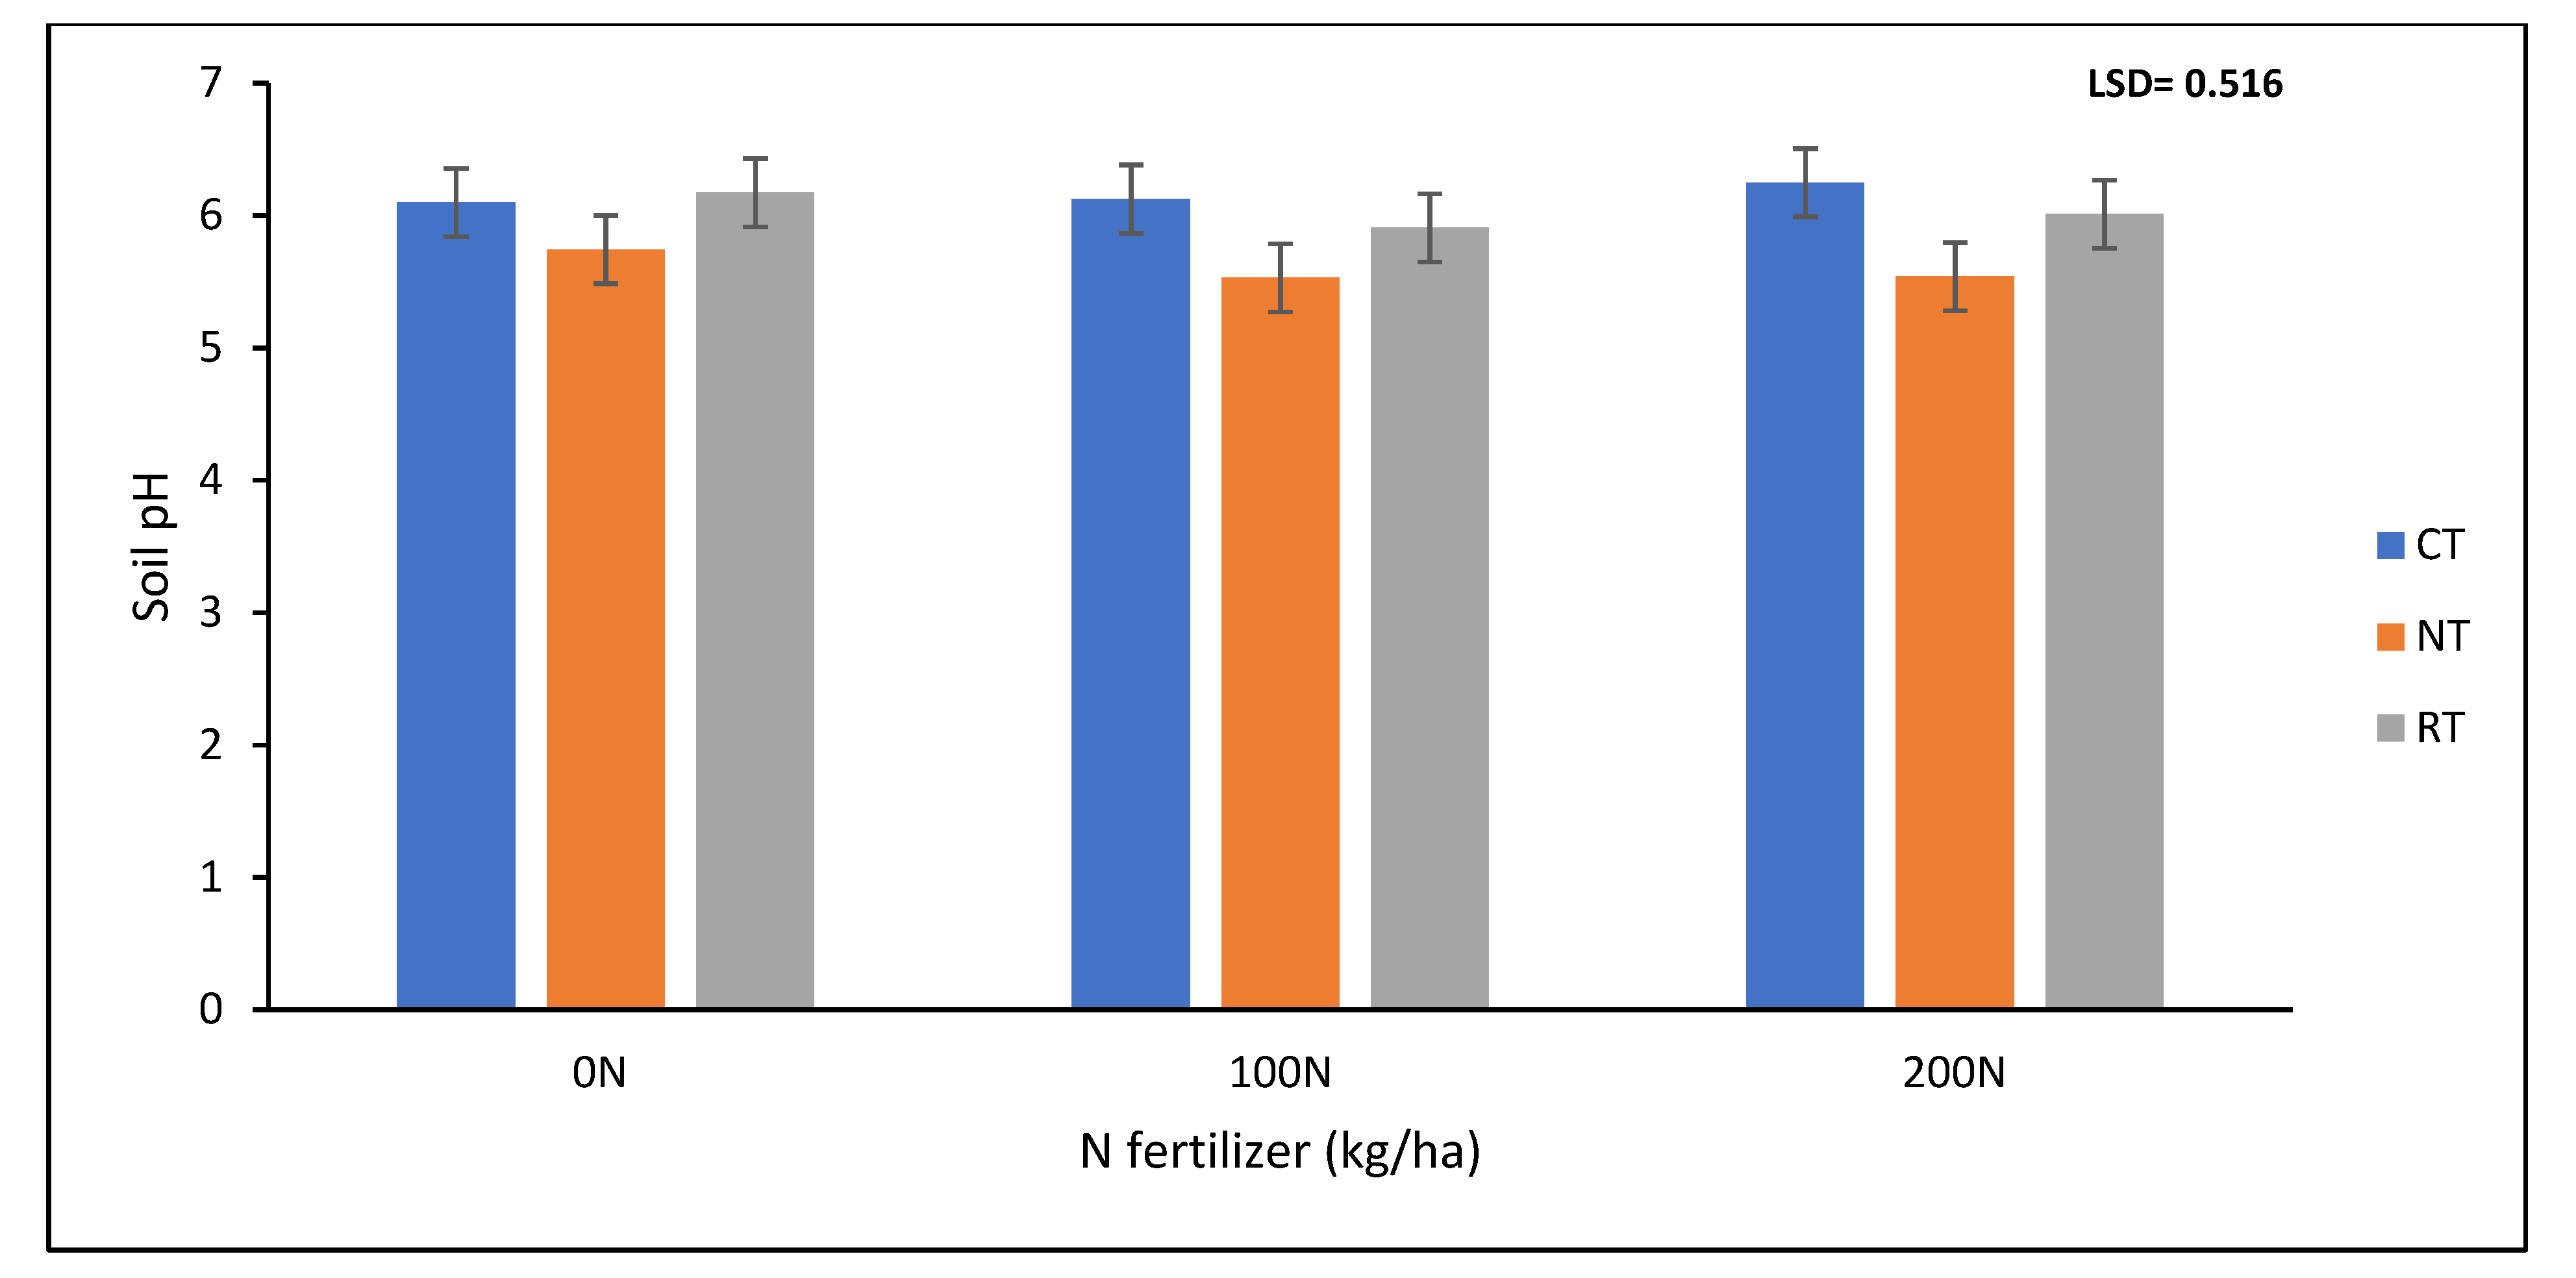
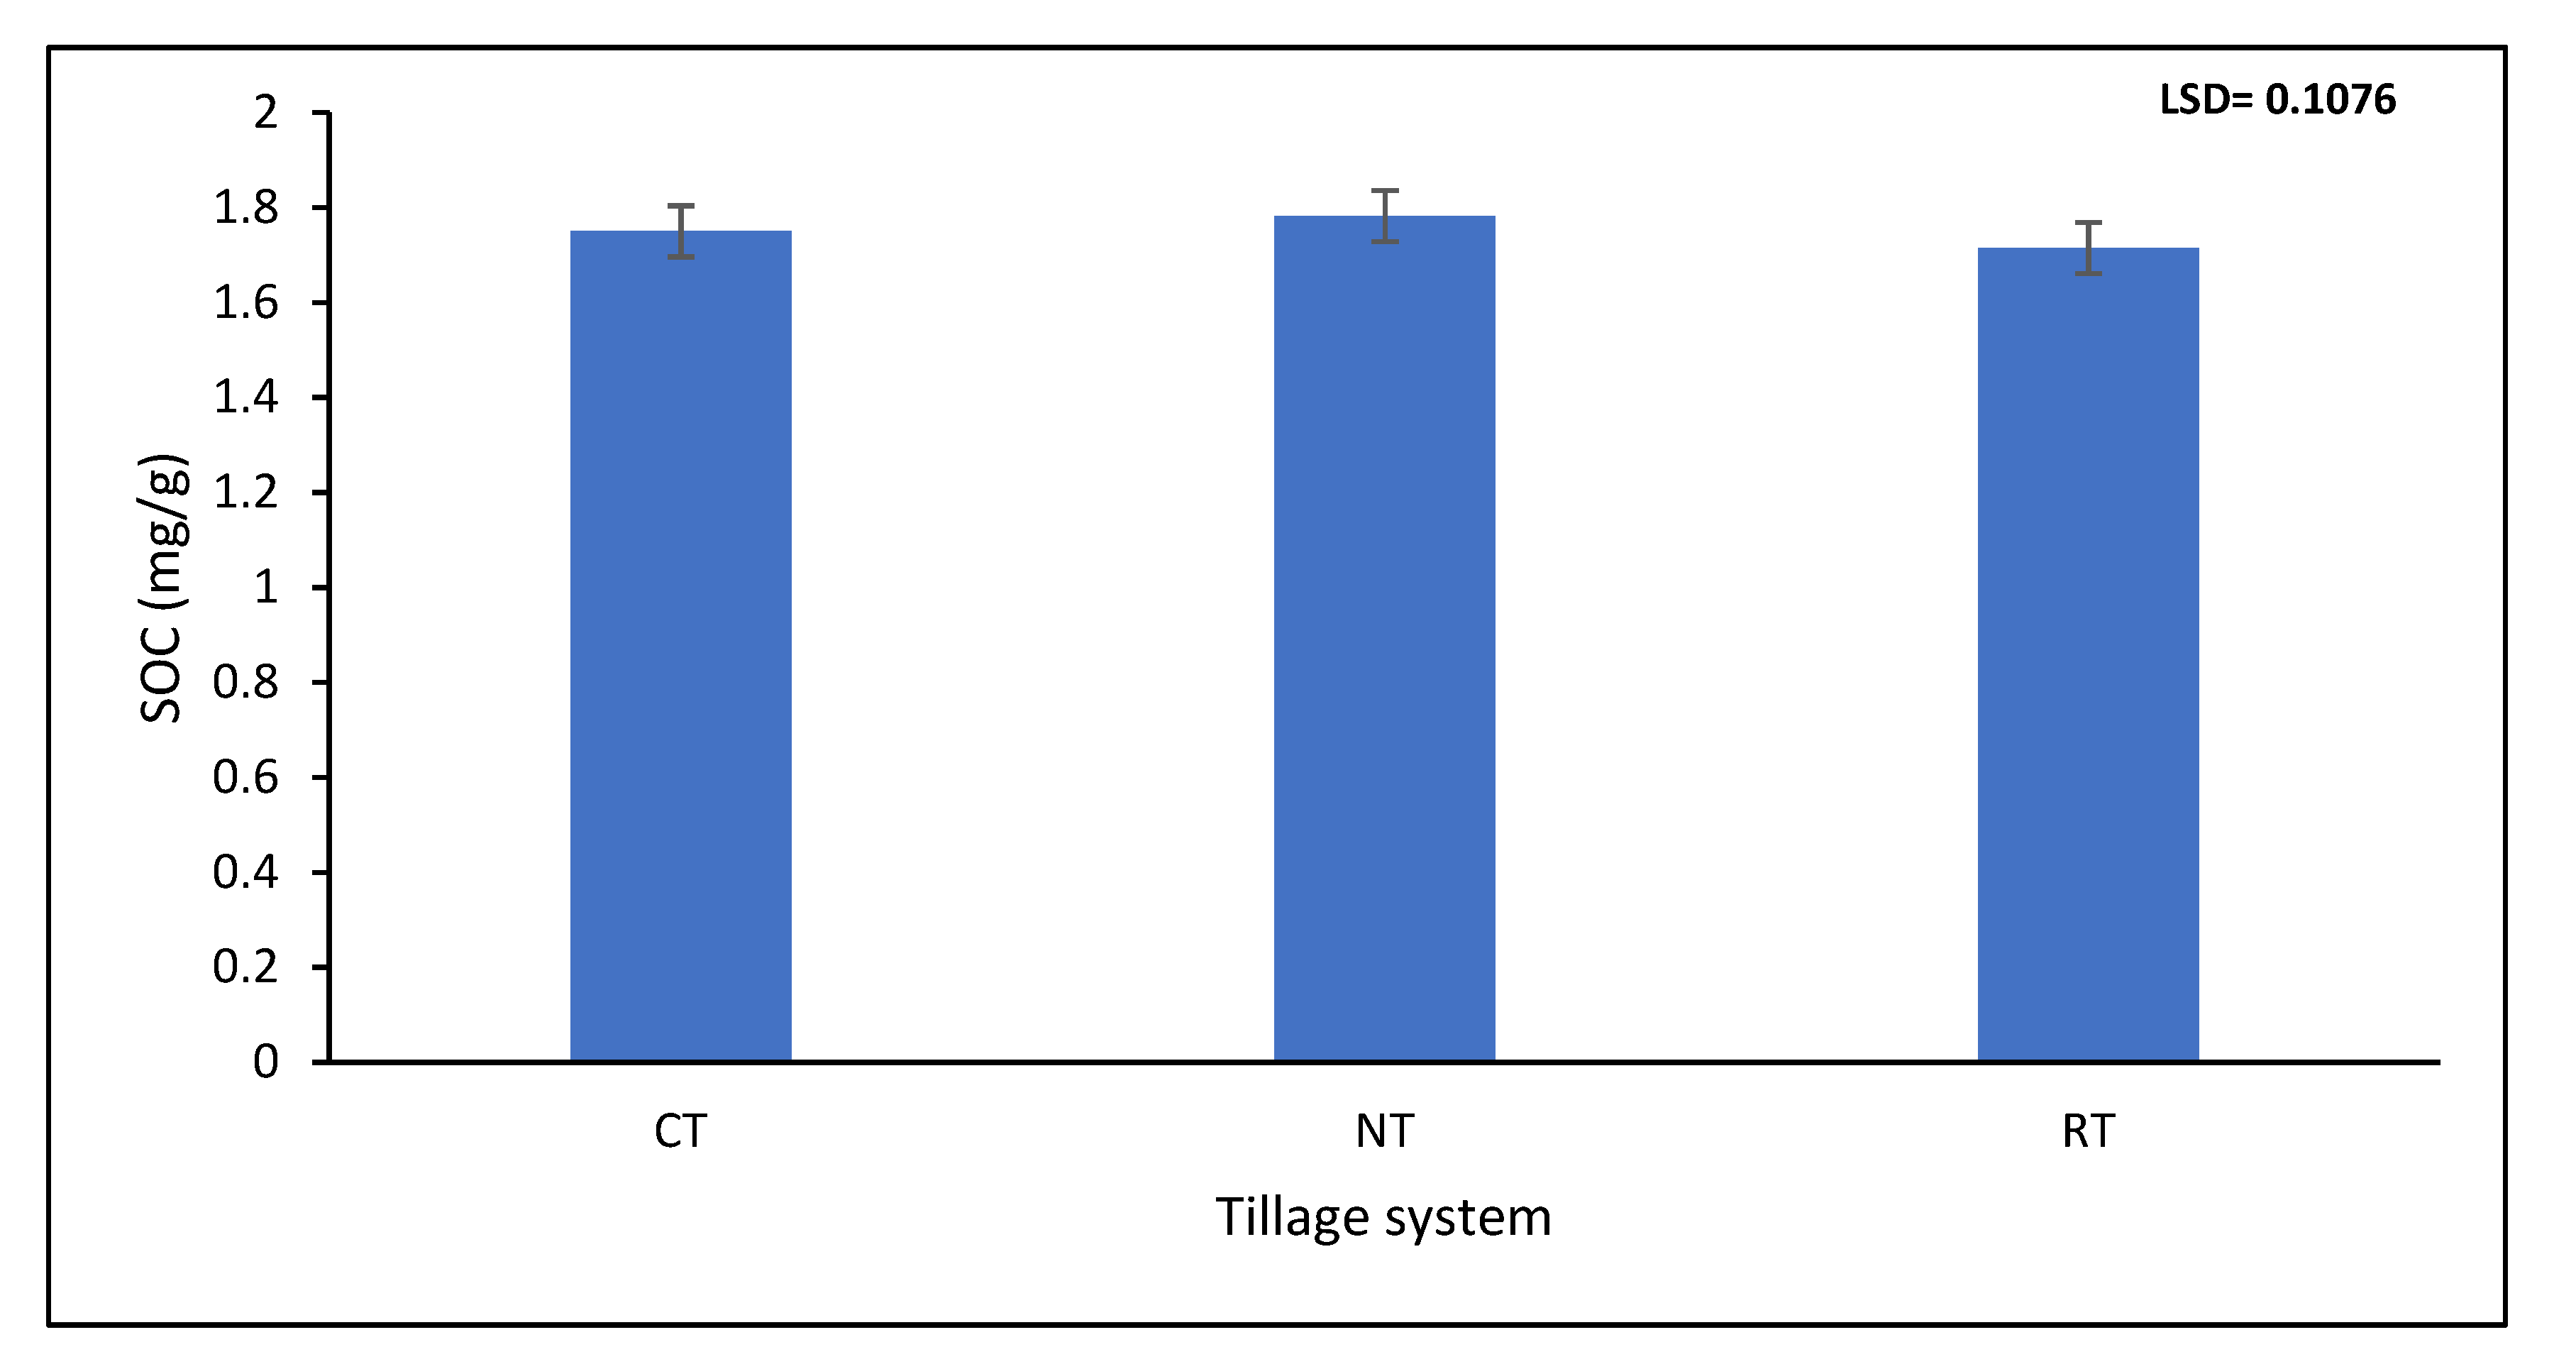
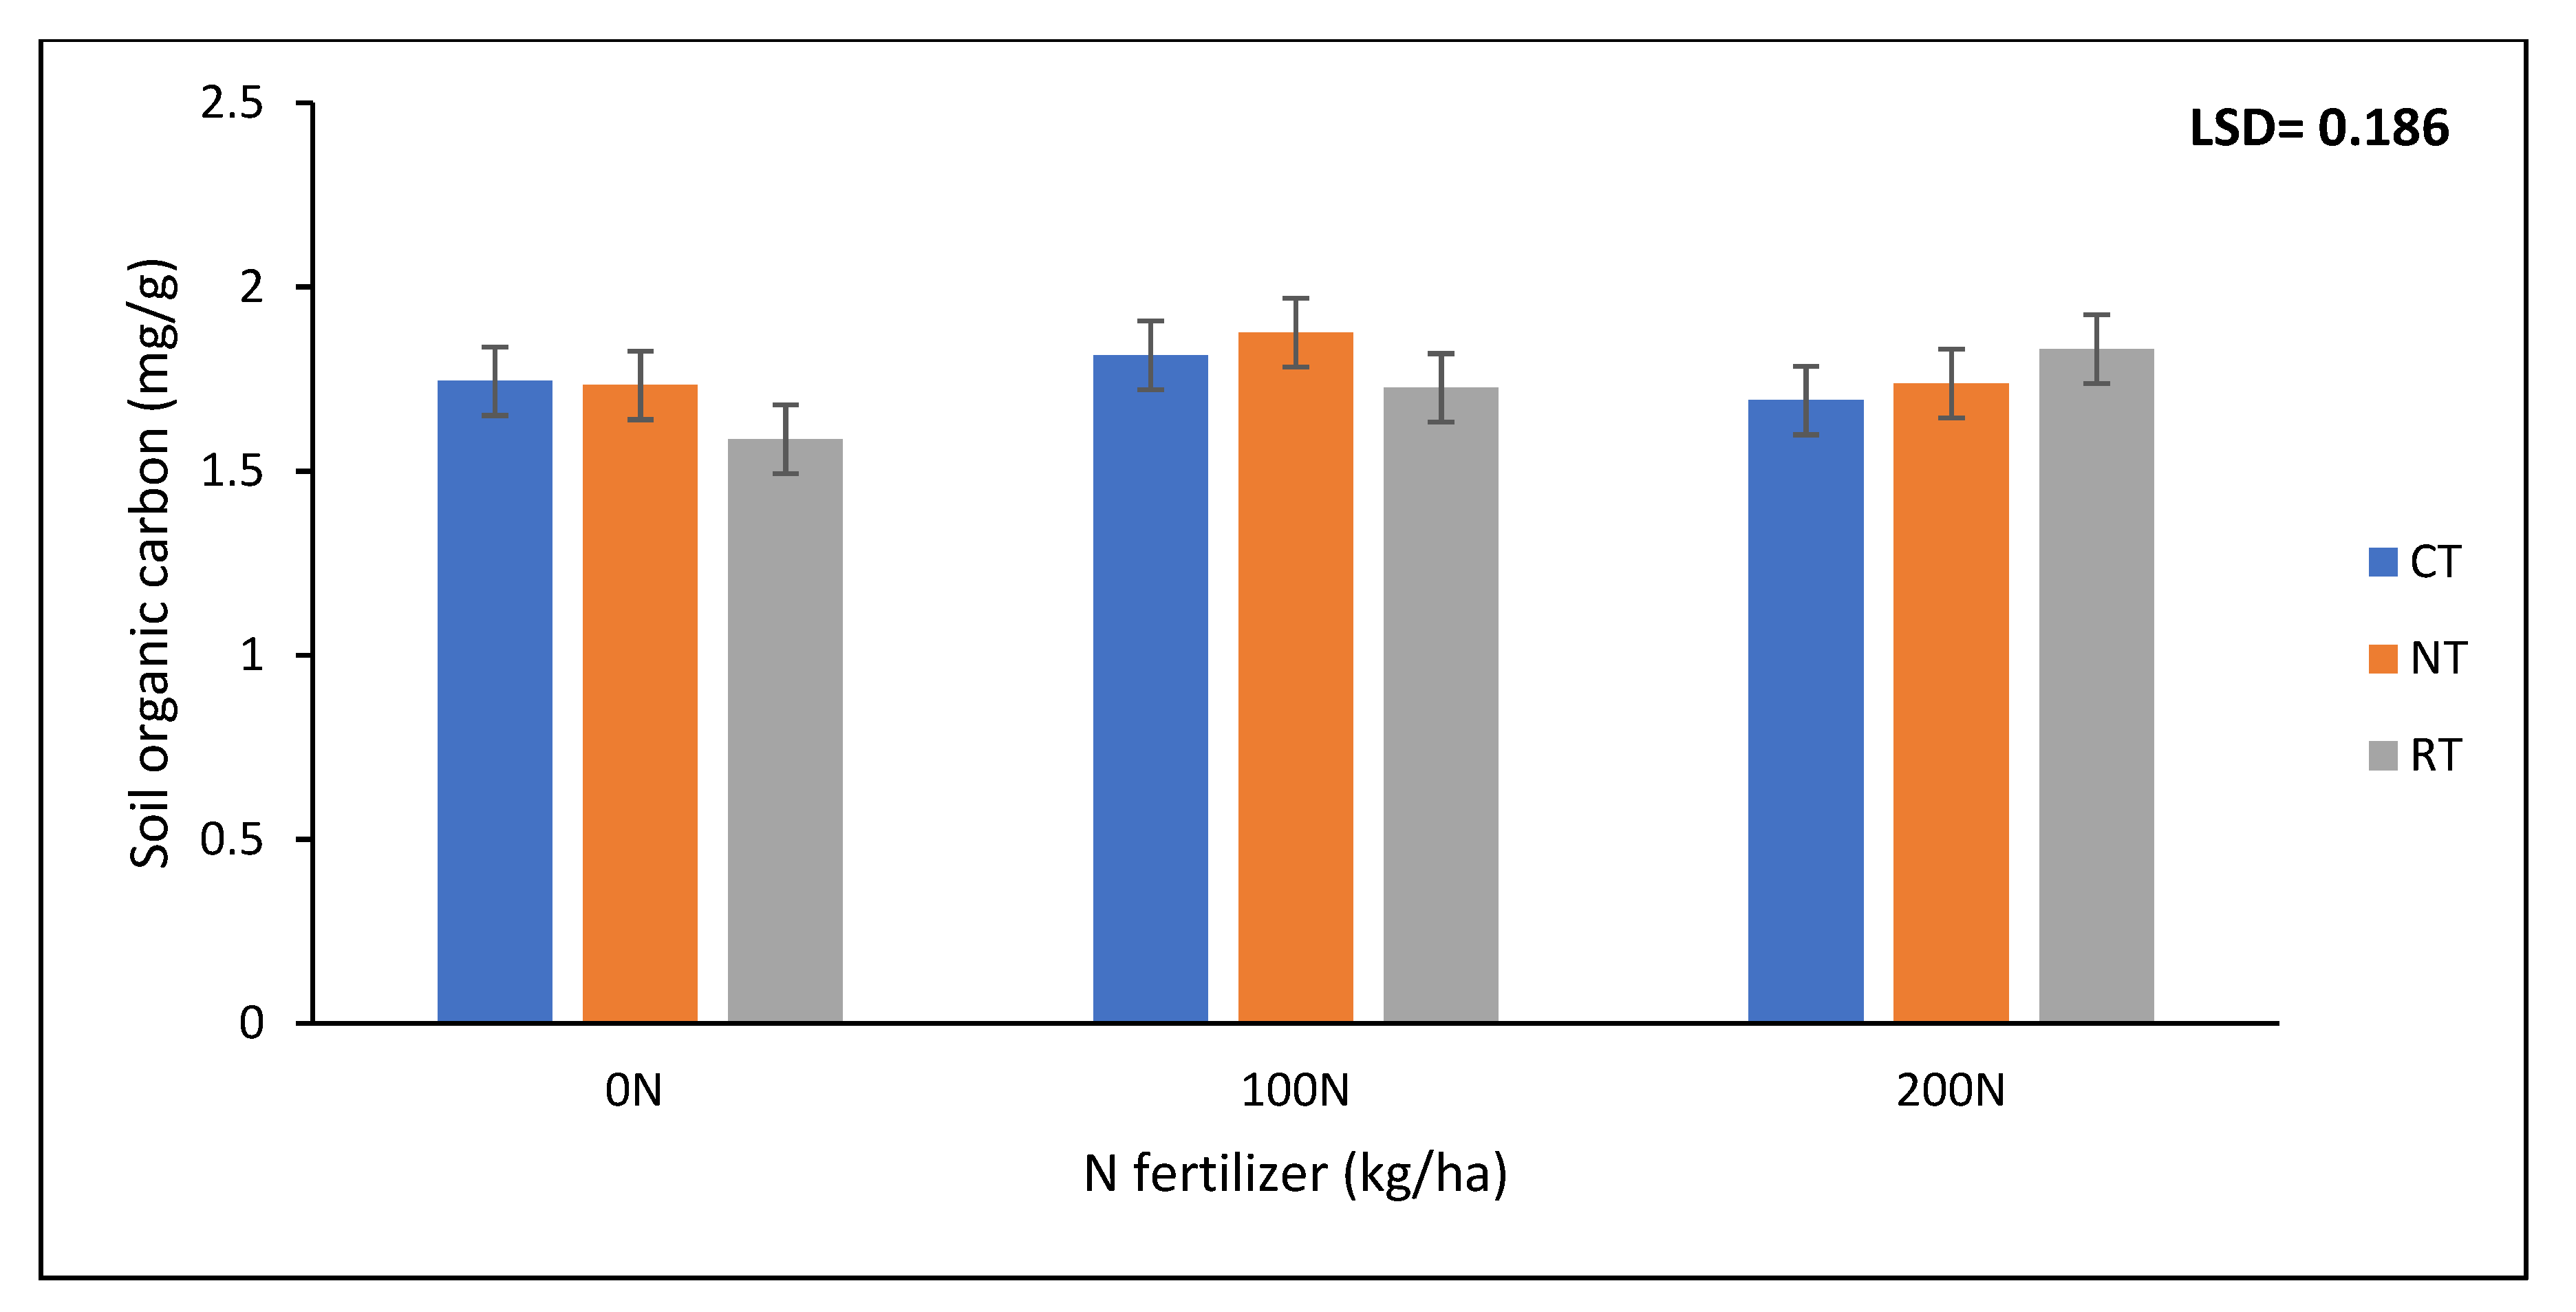
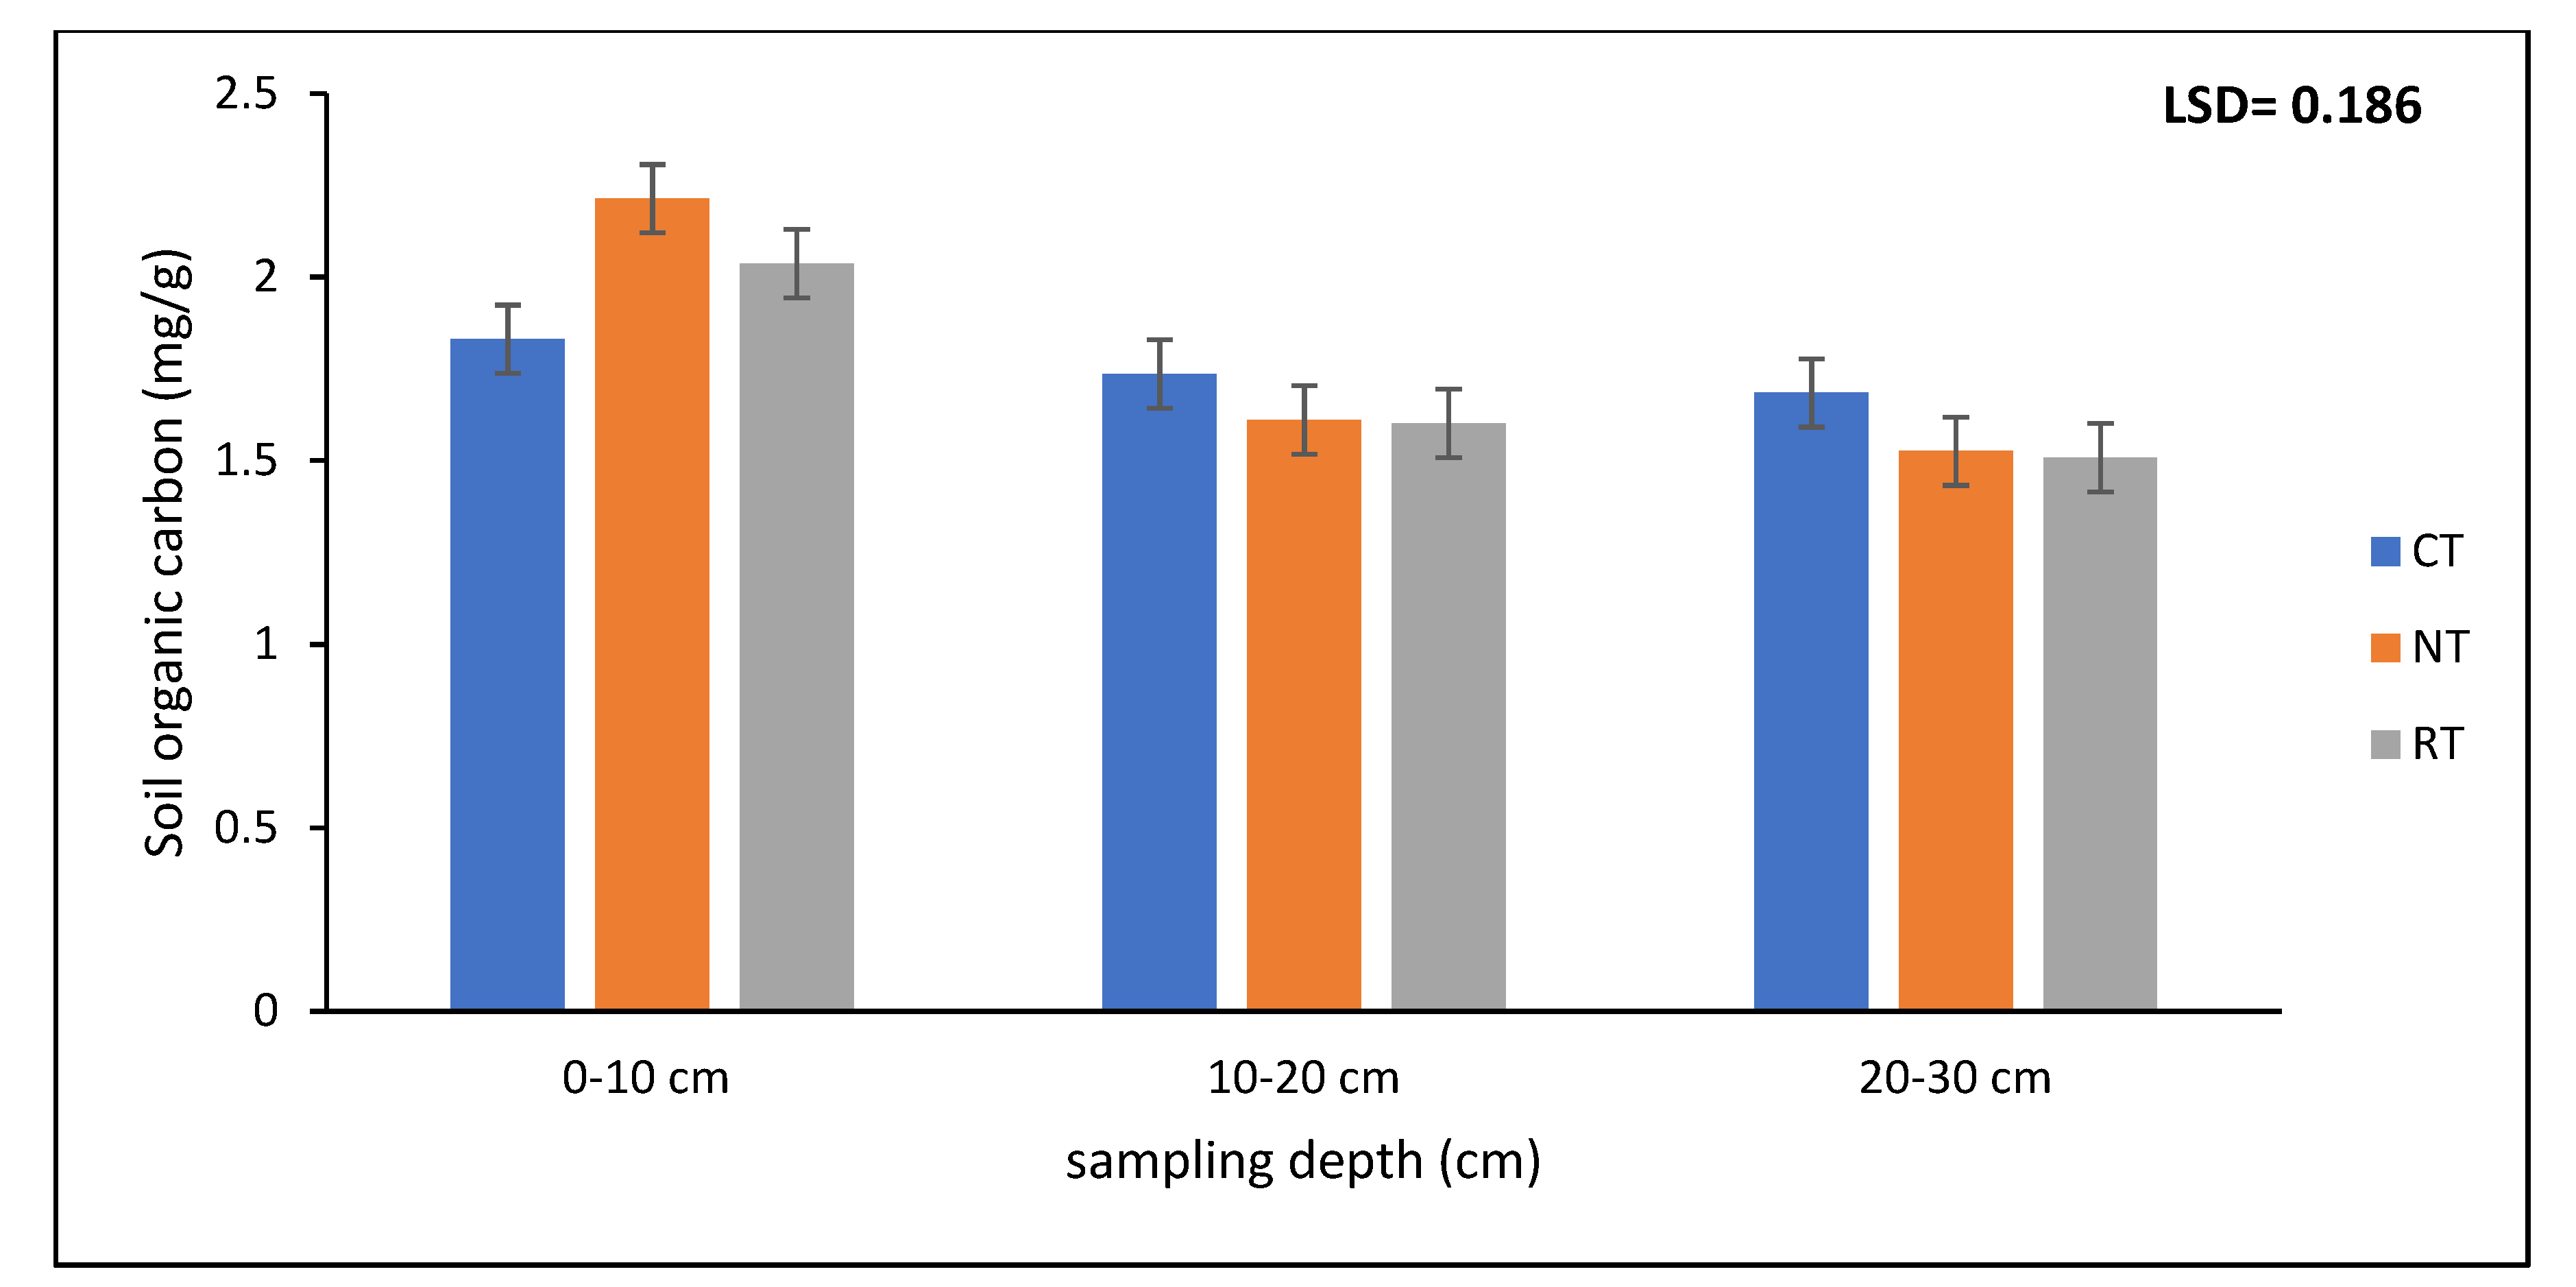
3.1. Soil pH and SOC

High significant differences (p < 0.001) in pH were observed between the tillage treatments (Table 2). No-till treatment (5.60) had significantly (p < 0.05) lower soil pH than RT (6.03) and CT (6.16) treatments (Figure 2). However, there were no significant differences (p > 0.05) found between RT and CT treatments. There were no differences (p > 0.05) found in soil pH with the increase in sampling depth in CT treatment. On the other hand, NT and RT had significantly (p < 0.05) lower pH at the 0–10 cm depth compared to CT treatment (Figure 3). In these treatments, particularly in RT treatment, it was seen to increase with sampling depth (Figure 3). Nitrogen fertilizer application rate did not influence (p > 0.05) soil pH with the increase in N application rate (Figure 4). In the treatment of no-till, pH was found to decrease with an increase in N fertilizer application rate, and a significantly lower (p < 0.05) pH was found in NT when compared to CT treatment in the 200 kg/ha N application rate.
No significant differences (p > 0.05) were found in soil organic carbon (SOC) between different tillage treatments (Table 2 and Figure 5). Although not significantly different, SOC was slightly higher under NT (1.78 mg/g) compared to RT (1.72 mg/g) and CT (1.75 mg/g) (Figure 5). Similar trends were observed in N fertilizer application rates where there were no differences (p > 0.05) found between treatments in SOC with the increase in N fertilizer application rate (Figure 6). A significant difference (p < 0.05) was observed in SOC when comparing depths (Table 2). The 0–10 cm depth of reduced tillage treatments (NT and RT) had significantly (p < 0.05) higher SOC compared to 10–20 and 20–30 cm depths (Figure 7). Conventional tillage on the other hand had uniform (p > 0.05) SOC across the treatment depths. In addition, no differences (p > 0.05) were found in all tillage treatments in the 10–20 and 20–30 cm depths (Figure 7).

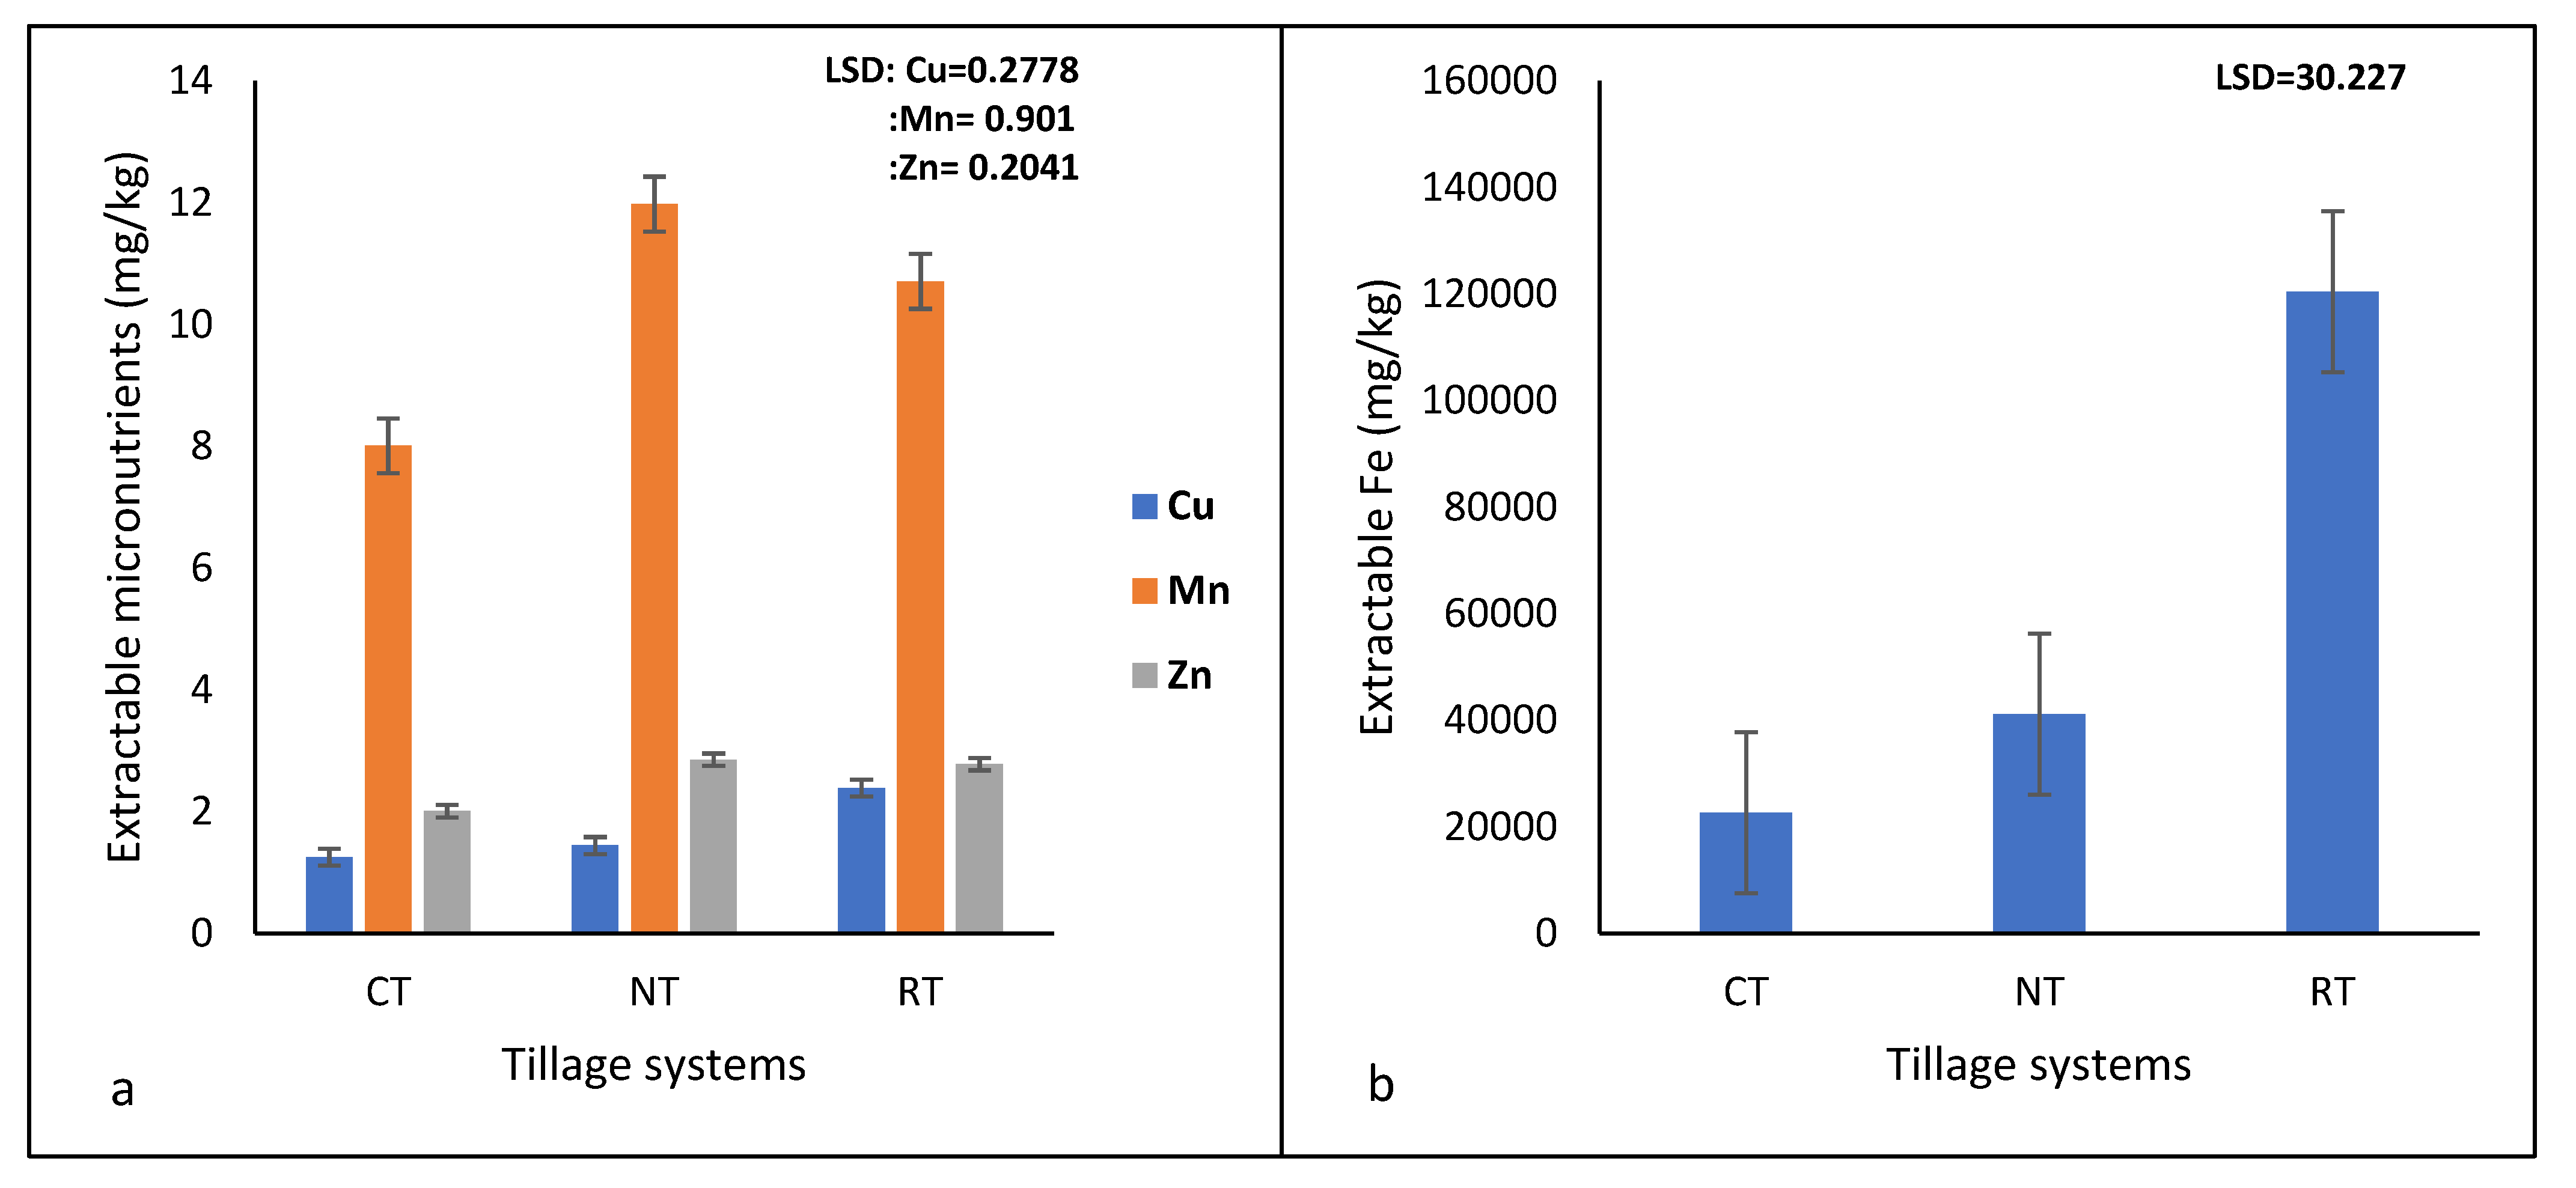
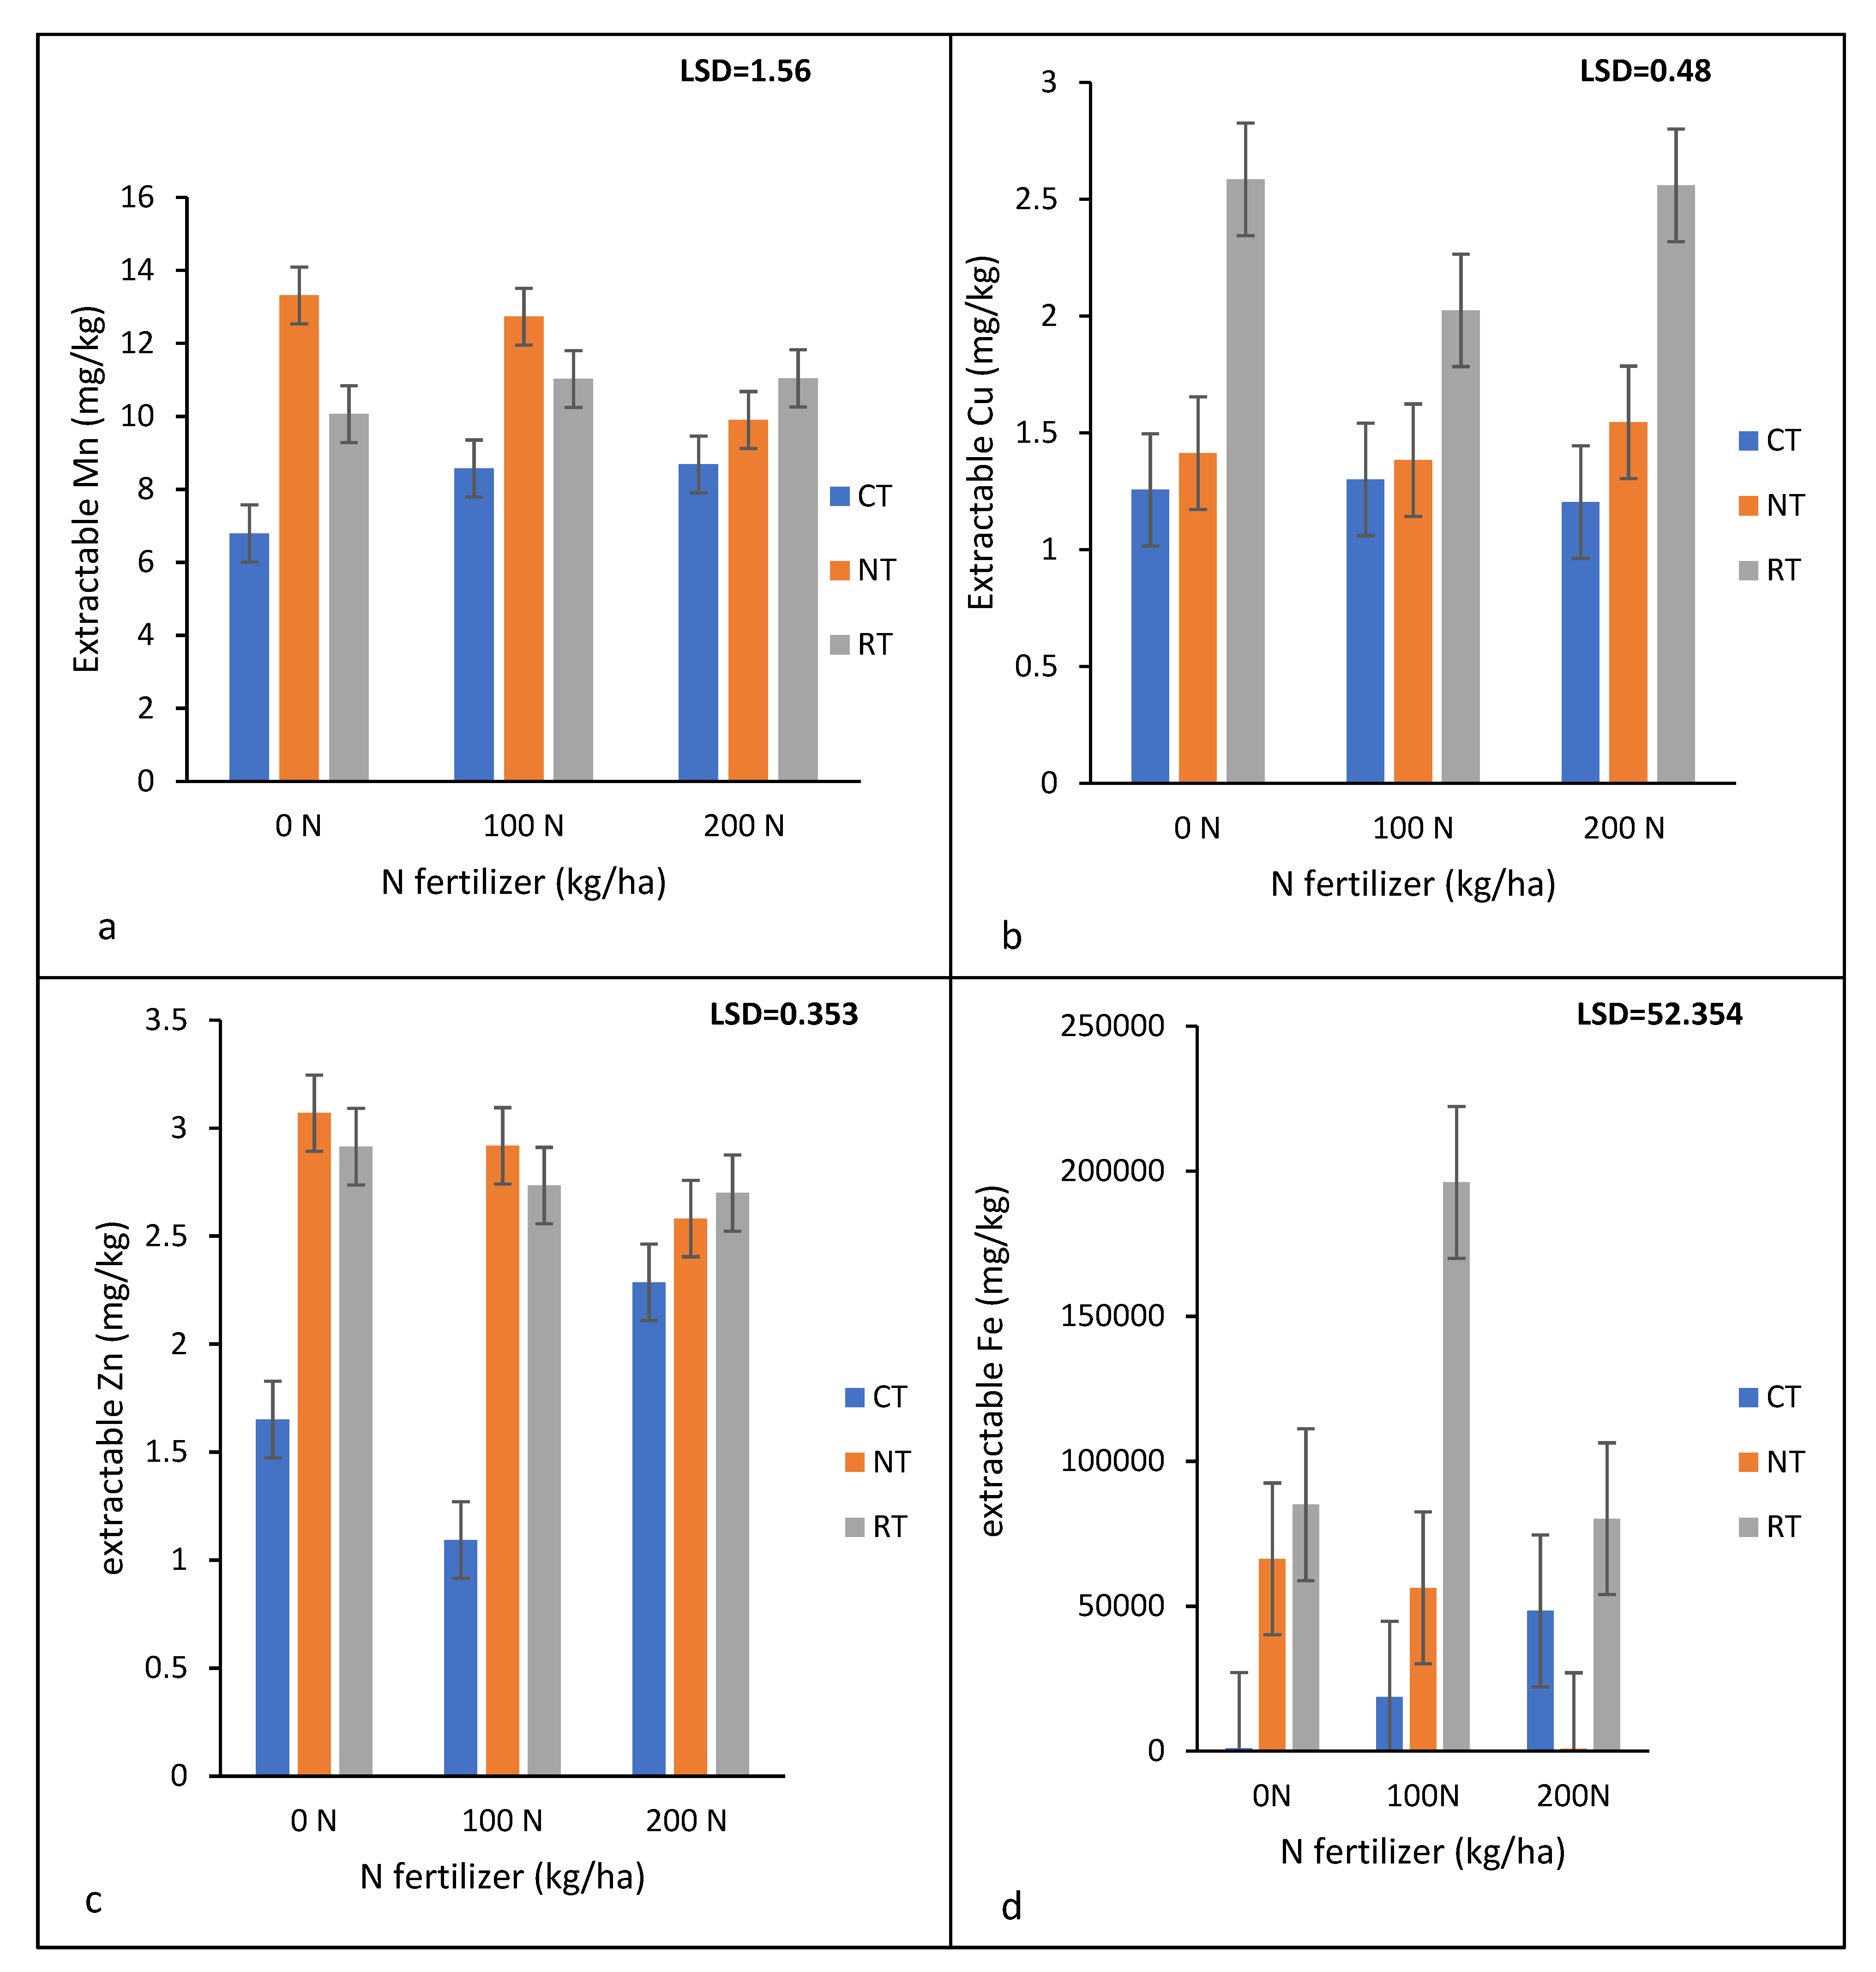
3.2. Micronutrients: Fe, Mn, Zn & Cu

High significant differences (p < 0.001) were observed in the concentration of Cu, Zn, Mn, and Fe among the three different tillage treatments (Table 3). In this study, the concentration of Fe was found to be very high and was followed by the concentration of Mn, Zn, and Cu, respectively (Figure 8). The concentration of Cu was significantly (p < 0.05) higher under RT, and NT as compared to CT treatments (Figure 8a). On the other hand, the concentration of Mn was significantly higher under NT, and RT than in CT treatment (Figure 8a). The concentration of Zn followed similar trends where it was observed to be significantly (p < 0.05) higher under NT and RT tillage treatments than in the CT treatment (Figure 8a). The concentration of Fe was found to be high in RT followed by NT, and lower in CT treatment (Figure 8b).
The concentration of Mn in the no-till at the 0–10 cm depth was found to be higher than at the 10–20 and 20–30 cm depths (Figure 9a). In RT treatment, the concentration of Mn was found to be similar in the 0–10 and 10–20 cm depths with a slight increase in the 20–30 cm depth. On the other hand, the Mn concentration was uniformly (p > 0.05) distributed in the CT treatment. Copper in NT and CT treatments was found to be distributed uniformly (p > 0.05) while in RT treatment it was significantly lower on the soil surface at 0–10 cm depth and increased with an increase in sampling depth (Figure 9b). The concentration of Zn was higher in the 0–10 and 10–20 cm depths as compared to the 20–30 cm depth (Figure 9c). In RT treatment it increased with depth while in CT treatment it was higher in the 0–10 cm depth and compared to the 10–20 and 20–30 cm depths (Figure 9c). Iron in NT treatment was higher on the soil surface at the 0–10 cm depth as compared to lower depths, while in RT treatment it showed no differences (p > 0.05) at different depths (Figure 9d). In CT treatment, no differences we found in Fe concentration although it was observed to be lower on the soil surface and increase with soil depth (Figure 9d).
Manganese (Mn) was lower (p < 0.05) at the 0 kg/ha N compared to 100 kg/ha and 200 kg/ha in the CT treatment (Figure 10a). The opposite was found in NT treatment where Mn decreased with an increase in N fertilizer application rate, while in RT treatment, no differences were found in different treatments of fertilizer. The concentration of Cu in NT and CT treatment was not influenced (p > 0.05) by the N fertilizer application rate (Figure 10b). In contrast, in RT treatment it was significantly lower at 100 kg/ha compared to 0 and 200 kg/ha N. The concentration of Zn was high in the 0 N fertilizer application rate and it decreased at 100 and 200 kg/ha N in NT and RT treatments (Figure 10c). In CT treatment it was lower in the 100 kg/ha N compared to 0 and 200 kg/ha N (Figure 10c). The concentration of Fe in 0 kg/ha was very low in CT treatment and it increased with an increase in N fertilizer application rate from 100 to 200 kg/ha (Figure 10d). In contrast, in NT treatment, the concentration of Fe decreased with an increase in N fertiliser rate while in RT treatment it showed no differences in 0 and 200 kg/ha (Figure 10d).
The results showed little to no significant interaction between tillage treatments and sampling depths on the concentration of Cu (Table 4). The interaction of tillage treatments combined with fertilizer levels was found to be significant (Table 4). The interaction of fertilizer levels, sampling depth, and sampling period were also significant (Table 3 and Table 4), while that of N fertilizer levels and sampling period was not significant (Table 3). The interaction of tillage treatments, sampling depths, and N fertilizer levels was significant (Table 4). The level of significance was very low on the interaction of tillage systems combined with the effect of sampling depth and the time of sampling (Table 3). The interaction between tillage treatments, N fertilizer levels, and sampling period was also a little significant (Table 3).
For Mn, significant interactions were observed between tillage and depth as well as on tillage treatments and N fertilizer level interactions (Table 4). The results showed a highly insignificant interaction between the sampling depth and fertilizer levels (Table 4). The interaction of tillage treatments combined with the effect of the sampling period was significant (Table 3). The study showed that the interaction of sampling depth and sampling period, N fertilizer levels combined with sampling period were significant (Table 3 and Table 4). The combined interaction of tillage treatments, sampling depth, and N fertilizer levels showed a high significant difference (Table 4). Results further indicated that there was a significant interaction between the combined effect of tillage treatments, sampling depth, and sampling period (Table 3). The interaction between tillage practices, N fertilizer levels, and sampling period together with that of sampling depth, N fertilizer level, and sampling period was also significantly different (Table 3 and Table 4).
For extractable Zn, the interactions of tillage treatments and sampling depths, tillage treatments and N fertilizer levels as well as that of tillage treatments and sampling period were significant (Table 3 and Table 5), while that of sampling depth combined with the levels of N fertilizer was not significant (Table 5). Significant interactions were observed between sampling depths and sampling periods (Table 3), N fertilizer levels plus sampling period (Table 3). The interaction of tillage treatments and sampling depth combined with the effect of N fertilizer levels was significant (Table 5). The interaction of tillage practices with sampling depth and sampling period was found to be significant (Table 3). Results showed that the interaction of tillage practices plus fertilizer levels and sampling period was significant (Table 3). The study further indicated that the interaction between the sampling depth, N fertilizer levels, and the period of sampling was significant (Table 3).
For extractable Fe, results showed a significant interaction between tillage treatments and sampling depths, sampling depth and N fertilizer levels, and that of tillage treatments and sampling period (Table 3 and Table 5). The interaction between tillage treatments and N fertilizer levels was slightly significant (Table 5). The study indicated that the interaction between sampling depths and sampling period (Table 3), N fertilizer levels combined with the effect of sampling period was significant (Table 3). The interaction of tillage treatments combined with the effect of sampling depth and N fertilizer levels was significant (Table 5). Slight significant differences were observed in the tillage treatment, sampling depth, and sampling period interaction (Table 3). Other interactions e.g., tillage practice, N fertilizer levels plus sampling period (Table 3); sampling depth, N fertilizer levels, and sampling period were also significant (Table 3).

3.3. Multivariate Analysis

The results of the principal component analysis showed that factor 1 and factor 2 contributed 42.88 % and 29.51 % to the total variation of the four extractable micronutrients (Cu, Mn, Zn and Fe) as well as soil pH and total organic carbon under NT (Figure 11). Factor 1 and 2 of rotational tillage contributed 46.56% and 23.47%. Factor 1 and 2 of conventional tillage contributed about 44.16% and 19.92% to the variation of the aforementioned micronutrients, soil pH, and SOC. Vectors showed a clear separation of extractable Mn and Cu under RT and CT, but Fe and Zn showed indistinct separation. The results showed that the concentration of Cu, Mn, Fe, and Zn was defined by the pH of the soil together with total carbon under NT and CT, these observations are derived from the close proximity of pH and total carbon vectors to those of micronutrients. The results also found an unclear separation of Zn, Fe, Mn and Cu under rotational tillage, however, soil pH and total carbon were clearly separated to micronutrient vectors. This indicated that the concentration of these micronutrients was hardly defined by these variables.

4. Discussion

4.1. Soil pH and SOC

The study found significantly lower pH under NT (5.6) compared to that of RT (6.0) and CT (6.2). These findings were in agreement with a number of studies that have reported lower pH under long-term no-till management practices when compared to conventional tillage treatments [31]. The pH of the soil was low at 0–10 cm depth followed by that of 20–30 cm depth. The highest pH level was found at 10–20 cm soil depth. These findings were not in agreement with those of [32,33]. Furthermore, nitrogen fertilization at 100 kg/ha decreased the pH by 0.2 units to that of 0 kg/ha (6.005), while 200 kg/ha N reduced the pH by 0.1 units when compared to 0 kg/ha N. The pH of the soil was slightly higher where there was no N fertilizer added, these findings were in agreement with those of [34,35]. The pH of the soil was found to be low under NT at different depths when compared to CT and RT. The decrease in soil pH under NT may be attributed to the mineralization of SOM and nitrification of applied urea on the upper soil layers in no-till. Most notably, pH levels were relatively low at 0–10 cm depth at different tillage treatments, our findings are in agreement with [33] findings. The results also found that the soil pH was relatively low under NT at different N fertilizer application rates compared to the interaction of N fertilization and other tillage treatments (CT and RT). The soil pH decreased with an increase in N fertilizer levels under NT, these findings were similar to those of [36], whereas, in CT, it increased with an increase in the application of N fertilizer, which is not in agreement with [36]. The decrease in pH is common in ferralsols, but it could also be attributed to N fertilization. The residues/mulching left on the surface under NT and RT together with N fertilization may have resulted in the nitrification of ammonium (NH4+) to nitrate (NO3−) causing acidic soil conditions [36]
In the present study, soil organic carbon (SOC) was found to be insignificant (p > 0.05) under different tillage treatments as well as at different N fertilizer levels. However, SOC was slightly higher under NT (1.782 mg/g) compared to RT (1.715 mg/g) and CT (1.750 mg/g). Slight significant differences in SOC were observed at different sampling depths. Soil organic carbon decreased with an increase in depth 0–10 cm (2.026 mg/g), 10–20 cm (1.649 mg/g) and 20–30 cm (1.572 mg/g)). This was similar to [37]. The study also showed that there were no significant differences in SOC at different N fertilization but the lowest SOC concentration was found at 0 kg/ha N. Intermediate N levels (100 kg/ha N) increased the concentration of SOC compared to 200 kg/ha N. Significant differences in SOC were also found in the interaction of tillage treatments and sampling depths. More SOC was found at 0–10 cm soil surface for all three tillage treatments, but NT recorded more SOC above them all. This was in agreement with [38] but contrary to [33] findings. The results found that N fertilization at the rate of 100 kg/ha increased the concentration of SOC under all three tillage treatments compared to 0 kg/ha N. The application of N at 200 kg/ha decreased the concentration of SOC compared to 100 kg/ha N under NT and CT. While under RT, 200 kg/ha N increased the concentration of SOC. Mulching under no-till may have increased the ratio of carbon to nitrogen (C:N), which slowed the decomposition rate of residues, organic matter, and soil organic carbon, hence low SOC concentration found at 0 kg/ha. Reportedly, adding N fertilizer in mulched soils helps to reduce the carbon to nitrogen ratio, which then fastens the decomposition of SOC and residues and increases soil available carbon. Conventional tillage accelerates the mineralization of SOC, and the removal of residues at harvesting also had an impact on the mineralization rate of SOC.

4.2. Effects of Tillage and Depth

The study found significant differences in the concentration of Fe, Mn, Zn, and Cu in different tillage treatments. The concentrations of these micronutrients were found to be high under reduced tillage treatments (NT and RT) and compared to conventional tillage treatment. This observation was consistent with that of [11,13] where they found that no-till and rational or reduced tillage treatments with mulch, enhanced the availability of extractable micronutrients compared to conventional tillage. Soil pH is reported to affect the availability, solubility as well as mobility of micronutrients. Previous research has shown that at high pH concentration, soil organic carbon and micronutrients become less soluble resulting in low concentrations in soil solution [39]. The percentage of adsorption of micronutrients is low at low pH concentrations, hence, the highest concentration of micronutrients was in the soil under NT compared to CT and RT which recorded high pH levels. In the present study, the concentration of SOC was slightly higher under NT compared to that of RT and CT, this observation suggests that the abundance of micronutrients at NT is attributed to the increase in soluble SOC because SOC and micronutrients are closely regulated. The mineralization of micronutrients, soil organic matter, and soil organic carbon occur faster under conventional tillage [40] and therefore, they are easily taken up by plants. Thus, these nutrients may be available in lower quantities in conventional tillage when compared to reduced tillage treatments, NT, and RT treatments. Low concentrations of these micronutrients under CT may be attributed to high pH, which favours less desorption and high adsorption, or due to high mineralization of SOC and micronutrients. The solubility of SOC and micronutrients is reported to be high at low pH levels [41], with the aforementioned statement supported by the results of the present study where the pH of the soil was relatively low at 0–10 cm while the concentration of SOC was higher at this depth.
Copper was found to be significant at different sampling depths while more Mn was found near the soil surface (0–10 cm) followed by that of a 20–30 cm depth (10.33 mg/kg) (Table 4). These findings were different from those of [20] but similar to [2]. More Zn was found at a 20–30 cm sampling depth (Table 5). These findings are similar to those of [14]. Fe was also found to be higher at 20–30 cm compared to other depths (Table 5), which is in agreement with [2]. The highest level of Cu was found at 20–30 cm depth, and Cu content increased with an increase in depth (Table 4). The experiment yielded similar results to that of [13] but conversely to [2]. Deep ploughing results in leaching, therefore more micronutrients are usually found at deeper soil depths. Micronutrients like Zn and Fe usually accumulate at lower depths because they tend to form chelates with soluble SOC and leach to lower depths [2]. Ferralsols consist of stable microaggregates, which promote porosity and infiltration, hence more micronutrients tend to leach to lower soil layers [42]. Micronutrients like Cu, Fe, and Mn tend to form stable bonds with organic matter, and mulching under NT and RT increased the organic matter content in the upper layers of the soil. Hence, a low concentration of these micronutrients in the upper layers of the soil may be attributed to their highest level of affinity towards the organic matter. Reportedly, high organic matter content resulting from mulching decreases the concentration of extractable micronutrients [43]. The accumulation of these micronutrients at deep layers of the soil may also be attributed to poor root penetration, such that crop plant roots could not reach and absorb these micronutrients. Higher micronutrient uptake by plants usually has no impact under high fertility, with the impact visible when soils are less fertile.

4.3. Effects on N Fertilizer Application Rates

The results showed no significant differences (p > 0.05) in the levels of extractable Cu, Mn, and Zn at different N fertilizer application rates. More Cu was found at the highest N fertilizer application rate followed by that of 0 N kg/ha. At intermediate N levels, the content of Cu was low. These findings were contrary to those of [20]. Refs. [20,44]. The content of Zn was found to be higher at 100 kg/ha N followed by that of 0 kg/ha. While 200 kg/ha of N had the lowest amount of Zn this may be attributed to the antagonistic interaction between high N fertilization and Zn concentration, whereby high levels of N increase the uptake of Zn by crop plants such that less Zn remains in the soil. Similar findings were observed by [20]. Just like Zn, Mn was found to be lower at 200 kg/ha N and higher at 100 kg/ha N. These findings were contrary to those of [20,37]. The study showed a slight significant difference in extractable Fe concentration, the significant differences were observed between 0 and 100 kg/ha N or between 100 and 200 kg/ha N whereas 0 and 200 kg/ha N were insignificant. The study showed a decrease in Fe content at 200 kg/ha N, while 100 kg/ha N had more Fe in both sampling periods. These findings indicate that the deficiencies of Zn and Mn at 200 kg/ha N were attributed to the deficiencies of Fe at this N rate since previous reports showed that Fe deficiencies increase the uptake of Zn and Mn by plants resulting in low soil available Zn and Mn [25]. Such results were contrary to those of [20,37]. Reportedly, N fertilization may result in the removal of more micronutrients from the soil at harvest. N fertilization has an indirect influence on available soil micronutrients through soil organic carbon (SOC) in long-term cropping systems. SOC and soil micronutrients are closely regulated, so the impact of N fertilization on SOC also influences the content and concentration of micronutrients [20]. Reportedly, SOC can be present in soluble and insoluble forms in the soil. The increase in soluble SOC causes an increase in soil available micronutrients like Cu, Mn, and Zn, but the opposite is also true. Acidification in soils can result from N fertilizer application, which then indirectly accelerates the weathering of minerals, releasing more micronutrients into the soil. The accumulation of Fe and Mn in the present study is attributed to acidification resulting from N fertilizer application and the solubility effect related to pH, hence acid soils contain high concentrations of Fe and Mn [20]. The application of Phosphorus in the present study may have favoured the accumulation of Fe because Fe and P tend to form precipitates such that they become unavailable for immediate use by crop plants. The lower concentration of Zn and Cu in the soil suggests the greater release of this element from acid soil layers and uptake by the crop, leaving less Zn and Cu in the soil [20]. Nitrogen fertilization is reported to reduce the pH of the soil, which then favours the availability of micronutrients [44]. Our findings showed that high N application rates decreased the concentration of Mn, Zn, and Fe, and this suggests that the depletion of micronutrients from the soil was not caused by acidification but may be due to other factors like low CEC, removal at crop harvest, temperature, etc.

5. Conclusions

No-till and rotational tillage with mulch had the highest concentration of micronutrients (Cu, Mn, Fe, and Zn) compared to conventional tillage treatment. However, the distribution of these nutrients varied for each micronutrient across the soil profile. More Mn was found near the 0–10 cm soil surface while Zn, and Fe were found deeper in the soil profile at a 20–30 cm depth. High levels of N fertilization decreased the concentration of zinc (Zn) under NT and RT, while in CT the concentration of Zn was relatively low at intermediate N fertilization compared to 0 and 200 kg/ha N. The concentration of Mn and Fe increased with an increase in N fertilization under conventional tillage and decreased with an increase in N fertilization under no-till. This was attributed to low pH levels under no-till at high N fertilization which favours the solubility of micronutrients (Fe and Mn) such that they are available for immediate use by crop plants. Slightly higher pH levels at high N fertilization under CT favoured the abundance of Fe and Mn by decreasing their solubility. On the other hand, rotational tillage showed no differences in the concentration of Mn and Fe. The results of this study indicate that the long-term application of N fertilizer will acidify the soil, especially under no-till, and liming would be required to reduce acidification. Low pH levels accelerate weathering of minerals as well as the solubility of minerals, soil organic carbon, and micronutrients. The greater release of these micronutrients during acidification may be beneficial to crop plants because they can be easily taken up by crops. However, in the long-term, they will cause toxicities that will be detrimental to soil health and crop yields and quality.

Author Contributions

Conceptualization, N.J.S. and N.M.M.; methodology, N.J.S.; software, K.N.; validation, N.J.S., S.G.Z. and L.S.M.; formal analysis, S.G.Z.; investigation, S.G.Z.; resources, L.S.M.; data curation, S.G.Z.; writing—original draft preparation, S.G.Z.; writing—review and editing, N.J.S.; visualization, K.N.; supervision, N.M.M.; project administration, N.M.M.; funding acquisition, L.S.M. All authors have read and agreed to the published version of the manuscript.

Funding

This Research was funded by National Research Foundation (NRF) of South Africa.

Conflicts of Interest

The authors declare no conflict of interest.

References

  1. Losak, T.; Hlusek, J.; Martinec, J.; Jandak, J.; Szostkova, M.; Filipcik, R.; Manasek, J.; Prokes, K.; Peterka, J.; Varga, L.; et al. Nitrogen fertilization does not affect micronutrient uptake in grain maize (Zea mays L.). Acta Agric. Scand. Sect. B–Soil Plant Sci. 2011, 61, 543–550. [Google Scholar]
  2. Miner, G.L.; Delgado, J.A.; Ippolito, J.A.; Barbarick, K.A.; Stewart, C.E.; Manter, D.K.; Del Grosso, S.J.; Halvorson, A.D.; Floyd, B.A.; D’Adamo, R.E. Influence of long-term nitrogen fertilization on crop and soil micronutrients in a no-till maize cropping system. Filed Crop Res. 2018, 228, 170–182. [Google Scholar] [CrossRef]
  3. Godecke, T.; Stein, A.J.; Qaim, M. The global burden of chronic and hidden hunger: Trends and determinants. Glob. Food Secur. 2018, 17, 21–29. [Google Scholar] [CrossRef]
  4. Graham, R.D.; Welch, R.M.; Bouis, H.E. Addressing micronutrient malnutrition through enhancing the nutritional quality of staple foods: Principles, perspectives and knowledge gaps. Adv. Agron. 2001, 70, 77–142. [Google Scholar]
  5. Nuss, E.T.; Tanumihardjo, S.A. Maize: A paramount staple crop in the context of global nutrition. Compr. Rev. Food Sci. Food Saf. 2010, 9, 417–436. [Google Scholar] [CrossRef]
  6. Fisher, G.E.J. Micronutrients and animal nutrition and the link between the application of micronutrients to crops and animal health. Turk. J. Agric. For. 2008, 32, 221–233. [Google Scholar]
  7. Lal, R. Sequestering carbon and increasing productivity by conservation agriculture. J. Soil Water Conserv. 2015, 70, 55A–62A. [Google Scholar] [CrossRef] [Green Version]
  8. Hobbs, P.R.; Sayre, K.; Gupta, R. The role of conservation agriculture in sustainable agriculture. Philos. Trans. R. Soc. B 2008, 363, 543–555. [Google Scholar] [CrossRef]
  9. Thierfelder, C.; Wall, P.C. Effects of conservation agriculture techniques on infiltration and soil water content in Zambia and Zimbabwe. Soil Tillage Res. 2009, 105, 217–227. [Google Scholar] [CrossRef]
  10. Thierfelder, C.; Wall, P.C. Rotation in conservation agriculture systems of Zambia: Effects on soil quality and water relations. Exp. Agriculrure 2010, 46, 309–325. [Google Scholar] [CrossRef] [Green Version]
  11. Verhulst, N.; Govaerts, B.; Verachtert, E.; Castellanos-Navarrete, A.; Mezzalama, M.; Wall, P.; Deckers, J.; Sayre, K.D. Conservation Agriculture, Improving Soil Quality for sustainable Production Systems? In Advances in Soil Science: Food Security and Soil Quality; Lal, R., Stewart, B.A., Eds.; CRC Press: Boca Raton, FL, USA, 2010; pp. 137–208. [Google Scholar]
  12. Pittelko, C.M.; Linquist, B.A.; Lundy, M.E.; Liang, X.; Van Groenigen, K.J.; Lee, J.; Van Gestel, N.; Six, J.; Venterea, R.T.; Van Kessel, C. When does no-till yield more? A global meta-analysis. Field Crops Res. 2015, 183, 156–168. [Google Scholar] [CrossRef] [Green Version]
  13. Rueda, M.; Munoz-Guerra, L.M.; Yunta, F.; Esteban, E.; Tenorio, J.L.; Lucena, J.J. Tillage and crop rotation effects on barley yield and soil nutrients on a Calciortidic Haploxeralf. Soil Tillage Res. 2007, 92, 1–9. [Google Scholar]
  14. Motta, A.C.V.; Reeves, D.W.; Touchton, J.T. Tillage Intensity Effects on Chemical Indicators of Soil Quality in Two Coastal Plain Soils. Commun. Soil Sci. Plant Anal. 2002, 33, 913–932. [Google Scholar] [CrossRef] [Green Version]
  15. Wysocki, D.; Hopkins, B. Acidifying Soil for Crop Production: Inland Pacific Northwest; Pacific Northwest Extension Publication: Moscow, ID, USA; Corvallis, OR, USA; Pullman, WA, USA, 2015; pp. 1–15. [Google Scholar]
  16. Impellitteri, C.A.; Lu, Y.; Saxe, J.K.; Allen, H.E.; Peijnenburg, W.J.G.M. Correlation of the partitioning of dissolved organic matter fractions with the desorption of Cd, Cu, Ni, Pb and Zn from 18 Dutch soils. Environ. Int. 2002, 28, 401–410. [Google Scholar] [CrossRef]
  17. Duiker, S.W.; Beegle, D.B. Soil fertility distributions in long-term no-till, chisel/disk and moldboard plow/disk systems. Soil Tillage Res. 2006, 88, 30–41. [Google Scholar] [CrossRef]
  18. Westermann, D.T.; Sojka, R.E. Tillage and nitrogen placement effects on nutrient uptake by potato. Soil Sci. J. 1996, 60, 1448–1453. [Google Scholar] [CrossRef] [Green Version]
  19. Marahatta, S.; Sah, S.K.; MacDonald, A.; Timilnisa, J.; Devkota, K.P. Influence of Conservation Agriculture Practices on Physical and Chemicl Properties of Soil. Int. J. Adv. Res. 2014, 2, 43–49. [Google Scholar]
  20. Malhi, S.S.; Nyborg, M.; Harapiak, J.T. Effects of long-term N fertilizer-induced acidification and liming on micronutrients in soil and in bromegrass hay. Soil Tillage Res. 1998, 48, 91–101. [Google Scholar] [CrossRef]
  21. Fan, X.; Zhou, X.; Chen, H.; Tang, M.; Xie, X. Cross-Talks between Macro- and Micronutrient Uptake and Signaling in Plants. Front. Plant Sci. 2021, 12, 663477. [Google Scholar] [CrossRef]
  22. Ward, J.T.; Lahner, B.; Yakubova, E.; Salt, D.E.; Raghothama, K.G. The effect of iron on the primary root elongation of Arabidopsis during phosphate deficiency. Plant Physiol. 2008, 147, 1181–1191. [Google Scholar] [CrossRef] [Green Version]
  23. Sun, Y.F.; Luo, W.Z.; Jain, A.; Liu, L.; Ai, H.; Liu, X.L.; Feng, B.; Zhang, L.; Zhang, Z.; Guohua, X.; et al. OsPHR3 affects the traits governing nitrogen homeostasis in rice. BMC Plant Biol. 2018, 18, 241. [Google Scholar] [CrossRef] [PubMed] [Green Version]
  24. Misson, J.; Raghothama, K.G.; Jain, A.; Jouhet, J.; Block, M.A.; Bligny, R.; Ortet, P.; Creff, A.; Somerville, S.; Rolland, N.; et al. A genome-wide transcriptional analysis using Arabidopsis thalianaAffymetrix gene chips determined plant responses to phosphate deprivation. Proc. Natl. Acad. Sci. USA 2005, 102, 11934–11939. [Google Scholar] [CrossRef] [Green Version]
  25. Kobayashi, T.; Nishizawa, N.K. Iron uptake, translocation, and regulation in higher plants. Annu. Rev. Plant Biol. 2012, 63, 131–152. [Google Scholar] [CrossRef] [PubMed] [Green Version]
  26. Soil Classification Working Group. Soil Classification—A Taxonomic System for South Africa; Memoirs on the Agricultural Natural Resources of South Africa No. 15; Department of Agricultural Development: Pretoria, South Africa, 1991.
  27. Zulu, S.G.; Motsa, N.M.; Sithole, N.J.; Magwaza, L.S.; Ncama, K. Soil Macrofauna abundance and taxonomic richness under long-term no-till conservation agriculture in a semi-arid environment of South Africa. Agronomy 2022, 12, 722. [Google Scholar] [CrossRef]
  28. Kowalenko, C.G. Assessment of Leco CNS-2000 analyzer for simultaneously measuring total carbon, nitrogen and sulphur in soil. Commun. Soil Sci. Plant Anal. 2001, 32, 14. [Google Scholar] [CrossRef]
  29. EPA. Method 3050B, Acid Digestion of Sediments, Sludges, and Soils, Revision 2; Environmental Protection Agency: Washington, DC, USA, 1996.
  30. Busari, M.A.; Kukal, S.S.; Kaur, A.; Bhatt, R.; Dulazi, A.A. Conservation tillage impacts on soil, crop and the environment. Int. Soil Water Conserv. Res. 2015, 3, 119–129. [Google Scholar] [CrossRef] [Green Version]
  31. Rahman, M.H.; Okubo, A.; Sugiyama, S.; Mayland, H.F. Physical, chemical and microbiological properties of an Andisol as related to land use and tillage practice. Soil Tillage Res. 2008, 101, 10–19. [Google Scholar] [CrossRef]
  32. Obour, A.K.; Mikha, M.M.; Holman, J.D.; Stahlman, P.W. Changes in soil surface chemistry after fifty years of tillage and nitrogen fertilization. Geoderma 2017, 308, 46–53. [Google Scholar] [CrossRef]
  33. Cookson, W.R.; Murphy, D.V.; Roper, M.M. Characterizing the relationships between soil organic matter components and microbial function and composition along a tillage disturbance gradient. Soil Biol. Biochem. 2008, 40, 763–777. [Google Scholar] [CrossRef]
  34. Tarkalson, D.D.; Hergert, G.W.; Cassman, K.G. Long-Term Effects of Tillage on Soil Chemical Properties and Grain Yields of a Dryland Winter Wheat–Sorghum/Corn–Fallow Rotation in the Great Plains. In Agronomy and Horticulture-Faculty Publications; University of Nebraska-Lincoln: Lincoln, NE, USA, 2006; Volume 95, pp. 1–9. [Google Scholar]
  35. Neugschwandtner, R.W.; Liebhard, P.; Kaul, H.P.; Wagentristl, H. Soil chemical properties as affected by tillage and crop rotation in a long-term field experiment. Plant Soil Environ. 2014, 60, 57–62. [Google Scholar]
  36. Schroder, J.L.; Zhang, H.; Girma, K.; Raun, W.R.; Penn, C.J.; Payton, M.E. Soil Acidification from Long-term use of nitrogen fertilizer on winter wheat. Soil Sci. Soc. Am. J. 2011, 75, 957–964. [Google Scholar] [CrossRef]
  37. Obour, A.; Holman, J.D. Long-Term Tillage and Nitrogen Fertilization Effects on Soil Surface Chemistry. Kans. Agric. Exp. Stn. Res. Rep. 2017, 3, 12. [Google Scholar] [CrossRef] [Green Version]
  38. Tolessa, D.; Du Preez, C.C.; Ceronio, G.M. Effect of tillage system and nitrogen fertilization on the pH, extractable phosphorus and exchangeable potassium of Nitisols in Western Ethiopia. Afr. J. Agric. Res. 2014, 9, 2669–2680. [Google Scholar]
  39. Singh, D.; Lenka, S.; Lenka, N.K.; Trivedi, S.K.; Bhattacharjya, S.; Sahoo, S.; Saha, J.K.; Patra, A.K. Effect of Reversal of Conservation Tillage on Soil Nutrient Availability and Crop Nutrient Uptake in Soybean in the Vertisols of Central India. Sustainability 2020, 12, 6608. [Google Scholar] [CrossRef]
  40. Neina, D. The Role of Soil pH in Plant Nutrition and Soil Remediation. Appl. Environ. Soil Sci. 2019, 2019, 5794869. [Google Scholar] [CrossRef]
  41. Oladele, S.O.; Adeyemo, A.J.; Awodun, M.A. Influence of rice husk biochar and inorganic fertilizer on soil nutrients availability and rain-fed rice yield in two contrasting soils. Geoderma 2019, 336, 1–11. [Google Scholar] [CrossRef]
  42. Kogel-Knabner, I.; Amelung, W. Dynamics, chemistry and preservation of organic matter in soils. In Treatise on Geochemistry, 2nd ed.; Holland, H.D., Turekian, K.K., Eds.; Elsevier: Amsterdam, The Netherlands, 2014; Volume 12, pp. 157–215. [Google Scholar]
  43. Shiwakoti, S.; Zheljazkov, V.D.; Gollany, H.T.; Kleber, M.; Xing, B. Micronutrients decline under long-term tillage and nitrogen fertilization. Sci. Rep. 2019, 9, 12020. [Google Scholar] [CrossRef]
  44. Khan, S.; Mulvaney, R.; Ellsworth, T.; Boast, C. The myth of nitrogen fertilization for soil carbon sequestration. J. Environ. Qual. 2007, 36, 1821–1832. [Google Scholar] [CrossRef] [Green Version]
Figure 1. The location of the study area (28°55′26.83″ S, 29°33′38.64″ E, 1038 m above sea level).
Agronomy 12 01411 g001
Figure 2. Soil pH at three different tillage treatments of no-till (NT), rotational tillage (RT), and conventional tillage (CT) after 17 years of trial establishment.
Agronomy 12 01411 g002
Figure 3. Soil pH at three different sampling depths (0–10, 10–20, 20–30 cm) after 17 years of trial establishment. CT = conventional tillage, RT = rotational tillage, NT = no-till.
Agronomy 12 01411 g003
Figure 4. Soil pH at three different N fertilizer levels (0, 100, 200 kg/ha) after 17 years of trial establishment. CT = conventional tillage, RT = rotational tillage, NT = no-till.
Agronomy 12 01411 g004
Figure 5. Soil organic carbon (SOC) at three different tillage treatments of no-till (NT), rotational tillage (RT), and conventional tillage (CT) after 17 years of trial establishment.
Agronomy 12 01411 g005
Figure 6. Soil organic carbon (SOC) at three different N fertilizer levels (0, 100, 200 kg/ha) after 17 years of trial establishment. CT = conventional tillage, RT = rotational tillage, NT = no-till.
Agronomy 12 01411 g006
Figure 7. Soil organic carbon (SOC) at three different sampling depths (0–10, 10–20, 20–30 cm) after 17 years of trial establishment. CT = conventional tillage, RT = rotational tillage, NT = no-till.
Agronomy 12 01411 g007
Figure 8. Extractable micronutrients [(copper (Cu), manganese (Mn), zinc (Zn) (a) and iron (Fe) (b)] in three different tillage treatments of no-till (NT), rotational tillage (RT), and conventional tillage (CT) after 17 years of trial establishment.
Agronomy 12 01411 g008
Figure 9. The concentration of extractable micronutrients [manganese (Mn) (a), copper (Cu) (b), zinc (Zn) (c) and iron (Fe) (d)] at three different sampling depths (0–10, 10–20 and 20–30 cm) recorded after 17 years of trial establishment. CT = conventional tillage, RT = rotational tillage, NT = no-till.
Agronomy 12 01411 g009
Figure 10. The concentration of extractable micronutrients [manganese (Mn) (a), copper (Cu) (b), zinc (Zn) (c) and iron (Fe) (d)] in three treatments of nitrogen (Urea) at 0, 100 and 200 kg/ha recorded after 17 years of trial establishment. N = nitrogen fertilizer. CT = conventional tillage, RT = rotational tillage, NT = no-till.
Agronomy 12 01411 g010
Figure 11. The principal component analysis showing distribution and the relationship between measured variables (extractable Zn, Cu, Mn, Fe, total C and pH) and tillage practices (CT, RT and NT). Zn = Zinc, Cu = Copper, Mn = Manganese, Fe = Iron, Total C = total soil organic carbon, pH = Soil pH, CT = conventional tillage, RT = rotational tillage, NT = no-till.
Agronomy 12 01411 g011
Table 1. Total rainfall and average temperature received between April 2019 and March 2020 [27].
19 Apr 19 May19 Jun19 Jul19 Aug19 Sep19 Oct19 Nov19 Dec20 Jan20 Feb20 Mar
Temp (°C)17.916.312.112.8516.317.5520.322.320.421.422.7520.2
Rainfall (mm)12424.2000.42.617.471.68388.2117.8128
Table 2. ANOVA results of the effect of tillage treatments (NT, RT, and CT), depth (0–10, 10–20, and 20–30 cm), N-levels (0, 100, 200 kg/ha), and their interaction on soil pH and SOC.
pH SOC
EffectsdfFpFp
Treatments (T)27.660.001 ***0.800.455
Depth (D)21.820.17241.03<0.001 ***
N Level (N)20.530.5942.390.102
T × D41.070.3815.61<0.001 ***
T × N 40.330.8571.740.156
D × N40.310.8710.470.758
T × D ×N 81.400.2200.600.775
N = nitrogen fertilizer application rates. The symbols ***, denote statistical significance at 0.001.
Table 3. ANOVA results of the effect of tillage treatments [no-till (NT), rotational tillage (RT), and conventional tillage (CT)], depth (0–10, 10–20, and 20–30 cm), N-levels (0, 100, 200 kg/ha), sampling time (April 2019 and August 2019) and their interaction on extractable copper (Cu), manganese (Mn), iron (Fe), and zinc (Zn).
EffectsCu Zn Mn Fe
DfFpFpFpFp
Treatments (T)237.61<0.001 ***41.42<0.001 ***39.69<0.001 ***23.21<0.001 ***
Depth (D)23.610.030 *0.010.9890.770.4660.160.852
N Level (N)21.250.2920.170.8452.180.1185.530.005
Season (S)15.450.021 *630.33<0.001 ***1094.33<0.001 ***96.09<0.001 ***
T × D42.290.0644.450.002 ***2.210.0721.310.272
T × N 41.240.2975.63<0.001***6.62<0.001 ***6.01<0.001 ***
D × N40.580.6752.190.0751.420.2325.22<0.001 ***
T × S240.31<0.001 *** 28.87<0.001 *** 17.24<0.001 *** 23.34<0.001 ***
D × S23.230.044 *4.060.020 *0.780.4590.160.851
N × S22.930.0584.020.021 *2.250.1115.520.005 *
T × D × N 80.890.5261.830.0791.870.0735.19<0.001 ***
T × D × S42.670.036 *1.700.1561.730.1481.320.267
T × N × S41.820.1312.930.024 *1.060.3826.00<0.001 ***
D × N × S40.320.8621.670.1612.590.041 *5.20<0.001 ***
T × D × N × S81.540.1523.78<0.001 ***5.13<0.001 ***5.20<0.001 ***
The symbols *, *** denote statistical significance at 0.05 and 0.001, respectively.
Table 4. Mean extractable copper (Cu) and manganese (Mn) (mg/kg) and standard errors of means found at different tillage treatments, sampling depths, and different N fertilizer application rates.
Cu (mg/kg) Mn (mg/kg)
Depth
Tillage N Levels 0–10 cm10–20 cm20–30 cm 0–10 cm10–20 cm20–30 cm
CT01.32 a ± 0.131.22 a ± 0.091.24 a ± 0.197.02 abc ± 1.606.13 a ± 1.127.22 abc ± 2.22
1001.27 a ± 0.181.30 a ± 0.171.34 a ± 0.198.13 abcd ± 2.098.48 abcde ± 2.299.09 abcde ± 2.40
2001.20 a ± 0.071.16 a ± 0.111.25 a ± 0.108.71 abcde ± 2.108.49 abcde ± 2.228.85 abcde ± 2.78
NT01.31 a ± 0.091.46 abc ± 0.161.47 abc ± 0.1413.21 de ± 2.9213.6 e ± 3.7813.1 de ± 3.46
1001.42 ab ± 0.081.41 ab ± 0.101.319 a ± 0.1812.6 de ± 2.8412.2 cde ± 2.9013.3 e ± 5.09
2001.391 a ± 0.181.31 a ± 0.141.94 abc ± 0.6813.4 e ± 4.369.42 abcde ± 2.676.86 ab ± 2.15
RT01.73 abc ± 0.552.98 bc ± 1.043.038 c ± 0.899.04 abcde ± 3.1110.3 abcde ± 3.5310.8 abcde ± 2.40
1001.26 a ± 0.192.24 abc ± 0.562.56 abc ± 0.4211.5 bcde ± 3.7410.0 abcde ± 3.2411.5 bcde ± 2.79
2002.54 abc ± 0.482.49 abc ± 0. 502.64 abc ± 0.4310.4 abcde ± 3.4010.6 abcde ± 2.4312.1 cde ± 3.98
N = nitrogen fertilizer application rates, cm = centimeter, CT = conventional tillage, RT = rotational tillage and NT = no-till. Numbers in the table not sharing the same letter differ significantly at LSD (p = 0.05).
Table 5. Mean extractable zinc (Zn) and iron (Fe) (mg/kg) and standard errors of means found at different tillage treatments, sampling depths, and different N fertilizer application rates.
Zn (mg/kg) Fe (mg/kg)
Depth
Tillage N Levels 0–10 cm10–20 cm20–30 cm 0–10 cm10–20 cm20–30 cm
CT01.81 abcd ± 0.351.50 a ± 0.181.64 ab ± 0.35139 a ± 526.7710 a ± 130.7893 a ± 227.2
1002.40 abcde ± 0.581.71 abc ± 0.282.17 abcde ± 0.52922 a ± 217.0863 a ± 222.854,171 ab ± 53,326.3
2002.44 abcde ± 0.532.16 abcde ± 0.532.25 abcde ± 0.47942 a ± 236.476,871 ab ± 76,066.267,273 ab ± 66,435.8
NT02.68 bcde ± 0.583.24 e ± 0.843.28 e ± 0.80196,576 b ± 88,665.31189 a ± 291. 21118 a ± 263.9
1002.88 de ± 0.663.00 e ± 0.682.87 cde ± 0.90939 a ± 188.062,062 ab ± 61,217.8105,884 ab ± 66,479.7
2003.18 e ± 0.962.75 bcde ± 0.631.81 abcd ± 0.361060 a ±280.9876 a ± 182.7701 a ±213.4
RT02.59 abcde ± 0.423.02 e ± 0.373.13 e ± 0.3767,045 ab ± 66,361.4187,183 b ± 83,960.1845 a ± 243.6
1002.41 abcde ± 0.622.85 cde ± 0.482.94 de ± 0.42212,393 b ± 94,841.0190,086 b ± 85,235.9185,931 b ± 83,266.8
2002.51 abcde ± 0.432.67 abcde ± 0.282.92 de ± 0.4060,551 ab ± 59,840.4758 a ± 276.2179,137 b ± 81,334.5
N = nitrogen fertilizer application rates, cm = centimeter, CT = conventional tillage, RT = rotational tillage and NT = no-till. Numbers in the table not sharing the same letter differ significantly at LSD (p = 0.05).
Publisher’s Note: MDPI stays neutral with regard to jurisdictional claims in published maps and institutional affiliations.

