Abstract
The influence of the geographical location and clone type on the contents of flavonols and organic acids of Sauvignon blanc grapes over the ripening process was investigated. The assay was carried out on three commercial clones of cv. Sauvignon blanc (Clone 242, Clone 107, and Clone 1-Davis) grown in two zones (referred to as low and high zones) in Casablanca Valley, Chile. The low zone is closer to the Pacific Ocean (i.e., 20 km away) than the high zone (which is 37 km away). Clear differences in the contents of total phenols, flavonols and organic acids of the grapes were observed during ripening. All the clones grown in the low zone exhibited a higher titratable acidity than those grown in the high zone. An analysis of the flavonol contents of the grape skins showed differences among clones associated with the geographical zone of cultivation. There was no difference in the tartaric acid concentration among clone types; however, a higher tartaric acid concentration was found in clones grown in the low zone than those grown in the high zone for all clone types. Similar results were found for the malic acid concentration. A discriminant analysis showed that the chemical analysis for the contents of total phenols, flavonols and organic acids influenced the classification based on the clone type. The results showed that grapes of different qualities can be grown in two geographical subunits into the larger area of Casablanca Valley.
1. Introduction
Flavonols are phenolic compounds mainly found in the skins of berries of grapevines and perform many fundamental functions, such as serving as antioxidants, photoprotection, and providing pigmentation at ripening [1,2,3], thus playing a fundamental role in wine as a copigment of anthocyanins [4] and conferring green to golden tones to white wine. The mechanism of regulation and synthesis of flavonols is well known, because this process provides protection against solar radiation [5,6,7]. Climatic factors play a crucial role during the synthesis of phenolic compounds, and therefore, different climatic conditions result in different viticultural zones. Liu et al. [8] demonstrated how vine canopy management modifies and regulates the synthesis of flavonol compounds. Gregan et al. [6] suggested that flavonol synthesis is reduced in the absence of UV-B radiation. Additionally, the organic acid content of grapes has an important effect on the taste, color, and stability of wine and is therefore is a determining factor for the quality of white wines [9]. The organic acid content is especially important in terms of meeting consumer preferences, because customers usually prefer fresh wines with balanced acidity [10]. The main acids produced in grapevines are tartaric, malic, and citric acids [11], the first of which is the most abundant in the berries. Malic and citric acids degrade faster than tartaric acid during ripening via respiration and oxidation processes that are influenced by the temperature [12]. The bound fraction of tartaric acid is more stable by comparison, although the unbound fraction of tartaric acid decreases during ripening via a dilution process [13,14]; therefore, the tartaric acid concentration does not vary abruptly during ripening, unlike the concentrations of other acids. As climate has a direct effect on chemical compounds, the composition and quantity of these compounds vary with the weather and meteorological conditions of the locations in which vines are grown. Furthermore, genetics play an important role in grapevine performance. Cloning is a breeding technique widely used in viticulture. Clonal selection has been used increasingly in recent decades and is becoming a means of enhancing many aspects of grapevines, including fruit quality [15,16]. Oenologists and winegrowers know that the quality of a wine is highly dependent on fruit quality, which is regulated by soil and climate, as well as genetics. The phenolic composition and organic acid content of grapes are mainly attributed to the variety [17]; however, little is known about the relationship between genetic variation among clones and climate and how these factors influence the effect and evolution of chemical compounds that determine wine quality.
Chile is one of the main exporters of wine worldwide [18]. Wine production in Chile is carried out from the north to the south of the country, and there are six wine regions that are subdivided into valleys [19]. One of the most important wine regions is the Central Valley, where different varieties of grapes are grown for producing high-quality wines. Sauvignon blanc grapes are one of the most cultivated grape varieties in Chile, contributing 14.4% to the total wine production of Chile [20]. This variety is mainly cultivated in central Chile, specifically in Casablanca Valley, Leyda Valley and San Antonio Valley and used to produce internationally renowned wines. There is evidence that the climate factors of Casablanca Valley, such as the temperature, relative humidity, and solar radiation level, provide an ideal environment for growing white varieties, and therefore producing high-quality wines. These conditions result from the proximity of Casablanca Valley to the Pacific Ocean and create a unique microclimate, such that the valley can be regionalized based on the climate gradient therein. Thus, oenologists have classified the valley into two subzones, a “low zone” and a “high zone” [21]. Compared to the high zone, the low zone is closer to the Pacific Ocean (20 km away), resulting in colder temperatures and a higher relative humidity. By comparison, the high zone is 37 km from the ocean and characterized by warmer temperatures, lower relative humidity, and a higher solar radiation level [22].
Considering the important effect of the contents of phenolic and organic acid compounds on white wine quality, many studies have been performed on how climate conditions affect berry composition. By comparison, few studies have been performed on how clone types affect berry composition. For this reason, the aim of this study was to elucidate changes in the chemical composition during ripening of Sauvignon blanc clones grown in two zones of a valley with a cool climate and a known gradient in climatic conditions.
2. Materials and Methods
2.1. Vineyard Site, Plant Material and Experimental Design
The assay was carried out on grapes from two commercial wineries, Veramonte Vineyard (33°22′12″ S, 71°17′40″ W) and Casas del Bosque Winery (33°19′03″ S, 71°26′05″ W), which are both located in Casablanca Valley in central Chile. With a straight-line distance of approximately 38 km to the Pacific Ocean, Veramonte Vineyard is representative of the high zone; by comparison, with a straight-line distance of approximately 20 km to the sea, Casas del Bosque Winery is representative of the low zone. The plant material used in the assay comprised of the own-rooted Vitis vinifera cv. Sauvignon blanc Clones 242, 107, and 1-Davis. The plant material varied from 13 to 16 years in age and was trained to a vertical trellising system pruned using a bilateral cordon with vines spaced 2.5 m × 1 m (vine × row spacing) apart in north–south oriented rows in both vineyards. The historical average yield varied from approximately 9 to 11 tons ha−1 in both vineyards. The plants were irrigated by a drip irrigation system. The canopy management was standard for vineyards located in this region that produce high-quality white wines. The soil parental material was the same throughout the area in which both vineyards were located and was located in an alluvial dejection plane; thus, the soils were granitic, stratified, and moderately deep with alluvial origin. The topography was gently undulated with medium fertility and exhibited mostly sandy loam texture in the first soil strata (0–90 cm). The pH of the soils in both zones was neutral and varied from 6.6 to 7.3. Some differences were found between the two areas in terms of the slope (low zone, 2–3%; high zone, 3–8%) and drainage (low zone, moderate drainage; high zone, excessive drainage) [23]. Table 1 presents the agroclimatic parameters for the growing season (January to April) for Casablanca Valley where the vineyards are located.

Table 1.
Climate data from January to April from the two zones of Casablanca Valley for the period of grapevine ripening.
An experimental design was used consisting of a randomized complete block with five replicates, where each replicate corresponded to seven consecutive vines, excluding plants at the borders of the vineyard or that presented evident disease symptoms. Berries were sampled for analysis on four dates: veraison (0), 15, 30 and 45 days after veraison (DAV). The samples consisted of 100 berries per replicate, where 50 berries were randomly collected from each side of the canopy throughout the ripening period. The collected berries were weighed, frozen, and stored at −20 °C until processed. The veraison date was determined by visual observation and berry firmness, where more than 75% of the clusters satisfied the parameter values for ripening. The following physical and chemical variables were measured: the weight of 50 berries, skin weight of 50 berries, seed weight of 50 berries, titratable acidity (g tartaric acid L−1), pH, and total soluble solids (°Brix) according to the OIV protocol [24].
2.2. Extraction of Phenolic Compounds from Grape Berries
The skins from 50 grapes were separated by hand and extracted using an ethanol/water (1:1, v/v) solution with a weight ten times that of the skins in a Turratec TE-102 homogenizer (Tecnal, Sao Paulo, Brazil). The mixture of the skins and extraction solution was subjected to mechanical stirring for 60 min in an orbital shaker. To separate the solids from the liquid fraction, the samples were centrifuged at 6000 rpm for 15 min at 4 °C in a refrigerated Centurion Scientific K 2015R centrifuge (Centurion, Stoughton, UK), followed by filtration through a 0.45-µm PVDF membrane and storage in amber-colored bottles [25].
2.3. Spectrophotometric Characterization
The total phenol content was determined by UV absorption at 280 nm using gallic acid as standard [26] and a UV-1280 UV-Vis spectrophotometer (Shimadzu, Kyoto, Japan).
2.4. Extraction of Organic Acids from Grapes and HPLC-DAD Analysis
Five grams of berries without seeds were weighed and shredded in a homogenizer, followed by centrifugation for 5 min in a refrigerated centrifuge. One milliliter of the supernatant was diluted in 9 mL of Milli-Q water. Subsequently, the dilution was homogenized in an orbital shaker for 10 min and filtered through a membrane with a 0.22 µm pore size. The sample was chromatographically separated using an Agilent 1260 Infinity Series chromatograph (Agilent Technologies, Santa Clara, CA, USA) equipped with a quaternary pump, an autosampler, a column oven and a diode array detector (DAD). A Supelcogel H column (250 mm × 4.6 mm, Sigma-Aldrich, Santiago, Chile) was used under isocratic conditions. The mobile phase was a 0.1% (v/v) phosphoric acid solution. Twenty microliters of each sample were injected into the column, and the elution of organic acids was monitored at 210 nm. Tartaric, malic, and citric acids (Sigma-Aldrich, Chile) were identified and quantified using external standards [27].
2.5. HPLC-DAD Analyses of Low-Molecular-Weight Phenolic Compounds
A 50 mL aliquot of the skins extracts was further extracted with diethyl ether (3 × 20 mL) and ethyl acetate (3 × 20 mL) to concentrate the phenolic compounds. The organic fractions were combined, dehydrated with 2.5 g of anhydrous sodium sulfate, and evaporated to dryness under a vacuum at 35 °C. The solid residue was dissolved in 2 mL of a methanol/water (1:1, v/v) solution and filtered through a membrane with a 0.22 μm pore size. The individual phenolic compounds were identified using a chromatographic system consisting of an Agilent Technologies 1100 Series instrument (Agilent Technologies, Santa Clara, CA, USA) equipped with a diode-array detector (DAD, Model G1315B), a quaternary pump (Model QuatPump G1311A), a degasser (Model G1379A), and an autosampler (Model G1329A). Aliquots (25 μL) of the final solution were subjected to reverse-phase chromatographic separation at 20 °C on a reverse-phase Nova Pack C18 column (4 μm, 3.9 mm i.d. × 300 mm; Waters Corp.). The range of the photodiode array detector was set from 210 to 360 nm. The following two mobile phases were used: A, water/acetic acid (98:2 v/v); and B, water/acetonitrile/acetic acid (78:20:2 v/v/v). The following gradient was applied at a flow rate of 1.0 mL/min from 0 to 55 min and 1.2 mL/min from 55 to 90 min: 100−20% A, 20−10% A from 55 to 57 min, and 10−0% A from 57 to 90 min. Each major peak in the HPLC chromatograms of the extracts was characterized in terms of both the retention time and the absorption spectrum (from 210 to 360 nm) according to Peña-Neira et al. [28]. Quantitative determinations were performed using the external standard method with commercial standards. Calibration curves were produced by injecting the column with standard solutions before extraction under the same conditions used to analyze the samples over the range of concentrations observed (r2 ≥ 0.93).
2.6. Statistical Analysis
The analyzed data were subjected to the Shapiro–Wilk Test to assess their normality. Bartlett test was used for homogeneity of variances. After these analyses, the analysis of variance (ANOVA) and Tukey’s honestly significant difference (HSD) test were used to determine the mean separation of the chemical data, at a significance level of 95% (p < 0.05). Linear discriminant analysis (LDA) was carried out to identify differences in treatments related to the chemical composition of the clones. A statistical analysis was performed using R statistical software version 3.6 (R Foundation for Statistical Computing, Vienna, Austria) and Statgraphic Centurion XV (Statpoint Technologies, Warrenton, VA, USA).
3. Results
3.1. General Physical and Chemical Composition of Sauvignon Blanc Clones
Table 2 shows the physical and chemical parameters in Sauvignon blanc clones from two cultivation areas. The weight of 50 berries varied from 25.52 to 70.56 g in the low zone and from 39.77 to 77.84 g in the high zone. Differences were observed among Sauvignon blanc clones cultivated in the same zone: in particular, in the high zone, a higher berry weight was obtained for Clone 1-Davis than the other clones on all sampling dates. The skin weight increased during ripening for all clone types grown in both zones, where clones cultivated in the high zone exhibited a higher skin weight than clones cultivated in the low zone. The seed weight decreased for all clone types grown in both zones from veraison to the last sampling date, although there were slight differences among clones.
Table 2.
Chemical and physical analysis in Sauvignon Blanc clones during ripening from two zones of Casablanca Valley.
The soluble solids content ranged from 3.36 to 19.48 °Brix in the low zone and from 4.01 to 21.36 °Brix in the high zone. The highest concentration of soluble solids was obtained on the last sampling date for Clone 242 cultivated in the low zone. In the high zone, the highest concentration of soluble solids was obtained for Clone 1-Davis. The pH of the grapes increased during ripening, especially in the low zone, and the highest pH for the grapes was obtained on the last sampling date for Clone 1-Davis. The titratable acidity decreased during ripening, from 14.23 to 4.65 g tartaric acid L−1 in the low zone and from 13.46 to 2.88 g tartaric acid L−1 in the high zone. Higher values of titratable acidities were observed for clones cultivated in the low zone than in the high zone, especially for Clone 107.
3.2. Phenolic Composition of Skins of cv. Sauvignon Blanc Clones
Figure 1 shows that the content of total phenols in the grape skins decreased gradually from 9.43 to 3.48 mg GAE g skins−1 (GAE: gallic acid equivalent) in the low zone and from 12.52 to 4.48 mg GAE g skins−1 in the high zone during ripening. The highest concentrations of total phenols were observed on the last sampling date for Clone 107 grown in both zones, followed by Clone 242, and the lowest concentration of phenols was observed for Clone 1-Davis, especially in the low zone.

Figure 1.
Evolution of total phenols in grape skins from cv. Sauvignon Blanc clones 242, 107, and 1-Davis throughout ripening from two zones of Casablanca Valley. Different lowercase letters indicate significant differences (p < 0.05) between different clones from the same zone in the same sampling date according to Tukey’s HSD test. * indicate significant difference (p < 0.05) between the same clones from different zones in the same sampling date according to Tukey’s HSD test. DAV: days after veraison.
Figure 2 shows the evolution of the concentration of the following flavonols during ripening: myricetin 3-O galactoside, quercetin 3-O galactoside, quercetin 3-O glucoside, kaempferol 3-O glucoside and kaempferol 3-O galactoside. The concentration of myricetin 3-O galactoside ranged from 2.5 to 331.0 mg kg−1 for clones cultivated in low zone and from 2.2 to 198.7 mg kg−1 for clones cultivated in the high zone. The concentration of myricetin 3-O galactoside varied with the type and cultivation zone of the clones, where Clone 242 and Clone 107 cultivated in the low zone exhibited the highest concentrations, especially on the last sampling date. The concentration of quercetin-3-O galactoside in the clones cultivated in both zones gradually increased over the ripening period from 3.1 to 400.5 mg kg−1 in the low zone and from 5.3 to 281.4 mg kg−1 in the high zone. The maximum concentration of quercetin-3-O galactoside in grapes cultivated in the low zone was observed for Clone 242, whereas the corresponding maximum value for the high zone was observed for Clone 1-Davis. Differences in the concentration of quercetin-3-O galactoside according to the cultivation zone were observed on all four sampling dates. The quercetin 3-O glucoside concentration increased from veraison to the peak value on 15 DAV but decreased on the third sampling date and then slightly increased on 45 DAV. A similar pattern was observed for the quercetin 3-O glucoside concentration during ripening for all clone types, but the concentration for each clone type depended on the zone. The kaempferol 3-O glucoside concentration only varied across clone types at the early stages of ripening (0 and 15 DAV) but varied across zone types on all four sampling dates. The maximum concentration of kaempferol 3-O glucoside (31.63 mg kg−1) was observed for Clone 107 cultivated in the low zone, whereas the highest concentration of kaempferol 3-O glucoside for Clone 107 cultivated in the high zone was 19.06 mg kg−1. There was a gradual increase in the concentration of kaempferol 3-O galactoside in the grape skins throughout ripening from 5.6 to 249.2 mg kg−1 in the grapes cultivated in the low zone and from 13.1 to 261.5 mg kg−1 in the grapes cultivated in the high zone. The concentration of kaempferol 3-O galactoside varied across clone types for the clones cultivated in the high zone, where the maximum concentration was reached for Clone 1-Davis cultivated in the high zone on the last sampling date.
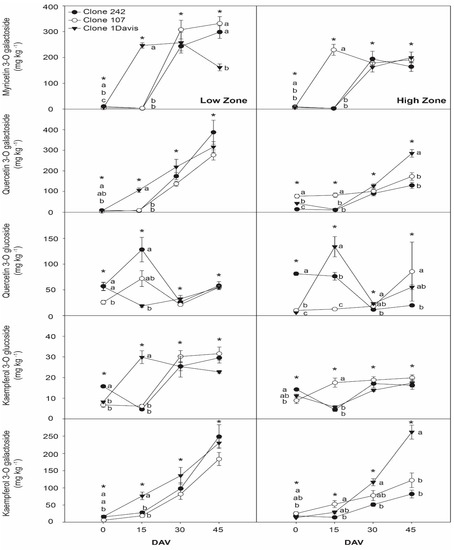
Figure 2.
Evolution of principal flavonols in grape skins from cv. Sauvignon Blanc clones 242, 107, and 1-Davis throughout ripening from two zones of Casablanca Valley. Different lowercase letters indicate significant differences (p < 0.05) between different clones from the same zone in the same sampling date according to Tukey’s HSD test. * indicate significant difference (p < 0.05) between the same clones from different zones in the same sampling date according to Tukey’s HSD test. DAV: days after veraison.
3.3. Composition of Organic Acids in Clones of cv. Sauvignon Blanc Grapes
Figure 3 shows the concentrations of tartaric, malic, and citric acids (mg kg−1) in grape berries of the three investigated Sauvignon blanc clones. The tartaric acid concentration decreased during ripening from 6708.2 to 2221.0 mg kg−1 in the grapes cultivated in the low zone and from 4797.6 to 1764.2 mg kg−1 in the grapes cultivated in the high zone. No differences were found among clones cultivated in the same geographical zone, and zonal differences were only observed on 0 DAV and at 45 DAV. Interestingly, on the last sampling date, all three clones cultivated in the low zone exhibited higher concentrations of tartaric acid than those cultivated in the high zone.
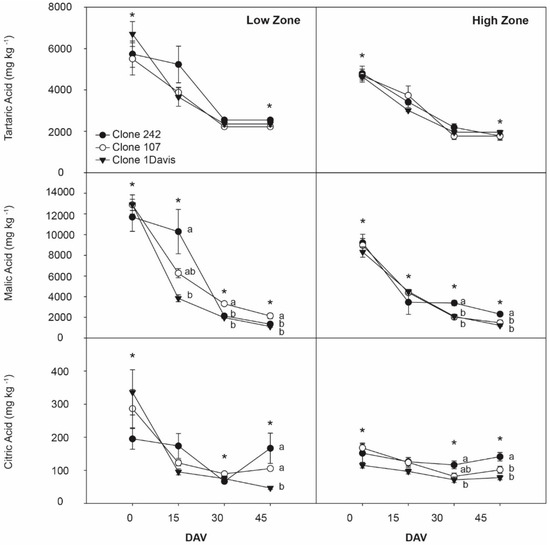
Figure 3.
Evolution of principal organic acids in grapes from cv. Sauvignon Blanc clones 242, 107, and 1-Davis throughout ripening from two zones of Casablanca Valley. Different lowercase letters indicate significant differences (p < 0.05) between different clones from the same zone in the same sampling date according to Tukey’s HSD test. * indicate significant difference (p < 0.05) between the same clones from different zones in the same sampling date according to Tukey’s HSD test. DAV: days after veraison.
The malic acid concentration during ripening exhibited a similar decreasing pattern, decreasing from 12,908.1 to 1120.8 mg kg−1 for grapes cultivated in the low zone and from 9208.4 to 1213.6 mg kg−1 for grapes cultivated in the high zone. Differences in the malic acid concentration were observed among clones in both zones, where for grapes cultivated in the low zone, Clones 242 and 107 had higher concentrations than Clone 1-Davis. There was a low concentration of malic acid in the grapes cultivated in the high zone on the first sampling date.
Finally, the citric acid concentration decreased gradually over the ripening period from 335.7 to 46.8 mg kg−1 for the grapes cultivated in the low zone and from 168.2 to 71.4 mg kg−1 for grapes cultivated in the high zone. On the last sampling date, the highest citric acid concentration was observed for Clones 242 and 107 cultivated in both zones, and zonal concentration differences were only observed for Clone 1-Davis.
3.4. Multivariate Analysis
A discriminant analysis was performed on the chemical data presented in Table 2, Figure 1, Figure 2, and Figure 3 to identify a grouping based on the geographical cultivation zones and clone types. A total of 14 chemical variables were used, resulting in 5 discriminant functions that represented 100% of the total variance (p < 0.05). However, only two discriminant functions were subsequently used: the first discriminant function (DF1) represented 56.5% of the total variability, and the second discriminant function (DF2) represented 32.5% of the total variability. Both discriminant functions enabled 89% of the samples to be classified (Figure 4). The variables with the highest incidence in DF1 were the concentrations of kaempferol 3-O glucoside and total phenols, which were positively influenced, and the myricetin 3-O galactoside concentration, which was negatively influenced; the variables with the highest incidence in DF2 were the concentrations of malic acid and quercetin 3-O glucoside, which were positively influenced, and the concentrations of kaempferol and tartaric acid, which were negatively influenced.
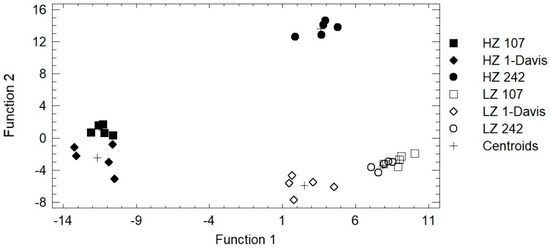
Figure 4.
Linear discriminant analysis from the chemical composition of cv. Sauvignon Blanc clones 242, 107, and 1-Davis from the Casablanca Valley at the last sampling date. HZ: high zone; LZ: low zone.
Our results indicate a clear separation among clones growing in the low and high zones, and a greater separation among clones growing in the high zone than in the low zone (i.e., Clone 1-Davis is separated from Clones 242 and 107 for the low zone, whereas Clone 242 is well separated from Clones 107 and 1-Davis for the high zone).
4. Discussion
The chemical composition of grapes and the effect of the geographical location on various parameters have paramount importance in current enology practices for determining how the behavior of several variables in specific geographical areas results in different styles of wines that appeal to consumers [29]. The edaphoclimatic conditions, cultural practices, and the grape variety interact to produce a distinct wine typicality and quality for a particular area [30].
In our study, global analyses revealed differences across clone types and cultivation zones (Table 2). For example, there were higher berry weights in grapes grown in the high zone and they showed an expected increase during ripening in accordance with that reported by other authors [31,32]. In other parameters, the high zone exhibited a higher skin weight compared with the clones from the low zone. With regard to the chemical parameters in grapes, the soluble solids content increased [31] throughout ripening for all clone types grown in both zones, with clear clonal differences that depend on the geographical area. The soluble solids concentration was approximately 3.7 °Brix, or ~2.2% in potential alcohol, higher for Clone 1-Davis cultivated in the high zone than in the low zone. These differences in the sugar content among clones are in agreement with those reported previously [33]. There were differences among the pHs of the Sauvignon blanc clones cultivated in the low zone, but no such differences were observed for clones cultivated in the high zone. As expected, the titratable acidity decreased during ripening in accordance with the results of previous studies [32]. Although the pH is generally inversely related to the acid concentration, there is no simple relationship between the titratable acidity and pH [34,35]. This result was supported by an analysis of the pH of the grapes: the pH varied among the clones cultivated in the low zone, with the highest pH corresponding to Clone 1-Davis, whereas no such differences were observed among the clones cultivated in the high zone; however, there were differences in the pH among clones cultivated in different zones, for example, the pHs were lower for Clones 242 and 1-Davis cultivated in the high zone than in the low zone. These results were discrepant with those for the acidity, which was higher for clones cultivated in the low zone than in the high zone and would lead to the expectation that the corresponding pH should be lower. However, compounds containing potassium and calcium that can form salts with organic acids [36,37] could be found in higher concentrations in the low zone than in the high zone; thus, a higher quantity of salts would be produced in the low zone than in the high zone, such that the pH of grapes would not be directly related to the acidity (even for grapes with high acidity). It would be very interesting to corroborate this hypothesis in a future study.
The results presented here clearly indicate that, compared to those cultivated in the high zone, all the clones cultivated in the low zone exhibited a higher titratable acidity and a lower concentration of soluble solids (especially Clone 1-Davis) (Table 2). This high acidity will undoubtedly affect the organoleptic characteristics of wines made from these grapes: high acidity is desirable for white wines [38], and a low alcohol concentration results from using the sugars of grape berries, which is especially the case for Clone 1-Davis; thus, the low zone may be more suitable for producing a white wine with high acidity and lower alcohol content. The relationship between the sugar content and acidity plays a very important role in monitoring grape ripeness; however, the considerable variation in climatic conditions, in terms of temperature and rainfall, from one harvest to another induced by climate change necessitates the use of information about the coupled effects of the environment, growing location, variety, and clone type [39]. Data on other parameters, such as the content of phenols and organic acids, are necessary for the appropriate management of these variables, because accumulation of these compounds may vary during ripening.
Differences were also observed in the content of total phenols measured in the berry skins of different clones. There is a decrease in the concentration in agreement with previously reported results [40]. Whereas there were few differences between the concentrations of total phenols in grapes grown in the two zones, the concentration of total phenols was found to be a function of the clone type. The high concentration of phenols in Clones 242 and 107 grown in both zones may be attributed to the highly oxidable substrate present in these grapes, such that the excessive presence of oxygen should be avoided during winemaking to reduce the risk of browning [41,42]. A specific analysis of some phenolic compounds, such as skin flavonols, could be an important tool for controlling the color of white wines made from these grapes and preventing negative effects, such as browning of wines [43,44,45].
Phenol accumulation mainly depends on climatic factors, especially light [46,47]. The differences in some of the flavonol concentrations in the clones between geographical zones could be explained in terms of the differences in specific climatic parameters. For example, solar radiation was most intense during the hottest months of the season, January and February (Table 1), which could explain the differences in the concentrations of the aforementioned types of phenolic compounds. By contrast, no clear zonal differences were observed in the analysis of the concentration of total phenols (Figure 1). Indeed, differences in the composition of the clones analyzed were observed depending on the cultivation zone, which demonstrated that the accumulation of specific compounds depends both on the climatic variables [48] and the clone type [49]. Although the use of clones is quite widespread in modern viticulture, to the best of our knowledge, this study is one of few in which the chemical composition of Sauvignon blanc grapes has been investigated in depth, which may be very important for obtaining grapes that produce wines with different characteristics that appeal to wine consumers.
Another interesting result was found when the concentrations were shown of tartaric, malic, and citric acids (mg kg−1) in grape berries of the three investigated Sauvignon blanc clones during ripening. Tartaric acid is the main acid in grapes and affects important parameters for wine quality, such as the acidity and pH [50,51]. High acidity feels fresh on the palate and is characteristic of white wines and wines from valleys with cold climates [52]. The acid concentration did not vary across clone types but did vary by the cultivation zone near veraison and on the last sampling date, where all the clones grown in the low zone had a higher tartaric acid concentration than those cultivated in the high zone. It is well known that the tartaric acid concentration is not strongly dependent on climatic conditions and decreases mainly via dilution processes in berries [31,50]. However, the results of this study demonstrated that grapes cultivated in the zone closer to the sea (the low zone) had a higher concentration of tartaric acid than those cultivated in the high zone. This result is important because the grape acidity affects the characteristics of the wines produced in these zones. The tartaric acid concentration did not vary across clone types but depended on the zone in which the vines were cultivated; therefore, wines produced from grapes cultivated in the low zone should have a higher acidity and feel fresher on the palate than those cultivated in the high zone [53]. With regard to the malic acid concentration during ripening, the high zone exhibited a lower concentration compared with the low zone. The effect of environmental conditions on the malic acid concentration in grapes [11,54] could explain this result (Table 1), where, again, the grapes cultivated in the low zone exhibited a higher malic acid concentration than those cultivated in the high zone, especially near veraison.
Finally, the citric acid concentration in the grapes was found to be lower than those of the other considered acids, which is consistent with previously reported results [55,56]. The results showed differences between clones on the last sampling date and zonal differences only in Clone 1-Davis. Citric acid is an important flavor precursor in grapes, because citric acid can be converted during malolactic fermentation of wines to diacetyl, a compound that imparts a “buttery” or “butterscotch” flavor to wines [35], which could be important for the sensory characteristics of the wine resulting from these grapes and that depends on the clone used for winemaking.
Casablanca Valley is located in central Chile, which has ideal conditions for producing high-quality white wines. This valley is mainly composed of geomorphological units such as the “Cordillera de la Costa” (Coastal Range) and the fluvial-marine plains; therefore, the geography and the proximity of the valley to the Pacific Ocean creates subclimates within the same valley. In general, the wines produced in this valley exhibit characteristics that are highly appealing to consumers, such as a high aromatic content, low concentrations of phenolic compounds, aromatic notes of vegetables and citrus fruits and high acidity, and vary according to the geographical area in which the grapes are cultivated.
The use of multivariate tools that allow us to appreciate chemical differences between grapes and wines is quite important for modern viticulture. In this assay, our results indicate a clear separation among clones growing in the low and high zones, and a greater separation among clones growing in the high zone than in the low zone. The geographical differentiation of clones is important for discriminating among wines produced in viticultural areas, that is, a large area can be classified into smaller geographical units to identify regions that produce grapes with desirable characteristics for making wine. In addition, the wine produced from these grapes, which could have different characteristics, can mean a new range of wines with different organoleptic qualities that allow expanding the portfolio of wines produced from this cool-climate variety. Zonal differences were identified among grapes grown in Casablanca Valley in a previous study, in agreement with the results obtained in this study [21].
5. Conclusions
The results of this study showed differences in the characteristics of grapes grown in Casablanca Valley, where there were clear differences in the chemical composition of grapes of different clone types cultivated in the low and high zones. The use of multivariate analysis corroborated the chemical analyses, and which led us to conclude that grapes of different qualities can be grown in two geographical subunits of Casablanca Valley. In the future, studies should be conducted to analyze other key compounds that affect grape quality, along with a more detailed study to identify additional subzones and the repetition of this assay in two or more years to appreciate the seasonal effect and to assess the impact of the clone type on the chemical quality of grape berries grown in small geographical areas that are used to produce high-quality wines that appeal to consumers.
Author Contributions
P.P.-B.: data curation; formal analysis; investigation; writing—original draft. F.H.-F.: investigation; methodology. I.F.C.: investigation; formal analysis; writing—review and editing; visualization. Á.P.-N.: resources; visualization. A.C.-M.: conceptualization; funding acquisition; project administration; resources; supervision; writing—original draft; writing—review and editing. All authors have read and agreed to the published version of the manuscript.
Funding
This research was funded by the Agencia Nacional de Investigación y Desarrollo (ANID-Chile), Fondecyt Iniciación Fund, grant number 11180265.
Data Availability Statement
The data presented in this study are available on request from the corresponding author.
Acknowledgments
The authors extend their thanks to Veramonte Vineyards and Casas del Bosque Winery (Casablanca Valley, Chile) for their collaboration with the plant material and field support.
Conflicts of Interest
The authors declare that this research was conducted in the absence of any commercial or financial relationships that could be constructed as a potential conflict of interest.
References
- Agati, G.; Tattini, M. Multiple functional roles of flavonoids in photoprotection. New Phytol. 2010, 186, 786–793. [Google Scholar] [CrossRef] [PubMed]
- Agati, G.; Brunetti, C.; Di Ferdinando, M.; Ferrini, F.; Pollastri, S.; Tattini, M. Functional roles of flavonoids in photoprotection: New evidence, lessons from the past. Plant Physiol. Biochem. 2013, 72, 35–45. [Google Scholar] [CrossRef] [PubMed]
- Downey, M.O.; Harvey, J.S.; Robinson, S.P. Synthesis of flavonols and expression of flavonol synthase genes in the developing grape berries of Shiraz and Chardonnay (Vitis vinifera L.). Aust. J. Grape Wine Res. 2003, 9, 110–121. [Google Scholar] [CrossRef]
- Boulton, R. The copigmentation of anthocyanins and its role in the color of red wine: A critical review. Am. J. Enol. Vitic. 2001, 52, 67–87. [Google Scholar]
- Kolb, C.; Kopecký, J.; Riederer, M.; Pfündel, E. UV screening by phenolics in berries of grapevine (Vitis vinifera). Funct. Plant Biol. 2003, 30, 1177–1186. [Google Scholar] [CrossRef] [Green Version]
- Gregan, S.M.; Wargent, J.J.; Liu, L.; Shinkle, J.; Hofmann, R.; Winefield, C.; Jordan, B. Effects of solar ultraviolet radiation and canopy manipulation on the biochemical composition of Sauvignon Blanc grapes. Aust. J. Grape Wine Res. 2012, 18, 227–238. [Google Scholar] [CrossRef]
- Del-Castillo-Alonso, M.; Diago, M.P.; Tomás-Las-Heras, R.; Monforte, L.; Soriano, G.; Martínez-Abaigar, J.; Núñez-Olivera, E. Effects of ambient solar UV radiation on grapevine leaf physiology and berry phenolic composition along one entire season under Mediterranean field conditions. Plant Physiol. Biochem. 2016, 109, 374–386. [Google Scholar] [CrossRef]
- Liu, L.; Gregan, S.M.; Winefield, C.; Jordan, B. Comparisons of controlled environment and vineyard experiments in sauvignon blanc grapes reveal similar UV-B signal transduction pathways for flavonol biosynthesis. Plant Sci. 2018, 276, 44–53. [Google Scholar] [CrossRef]
- Mendes Ferreira, A.; Mendes-Faia, A. The role of yeasts and lactic acid bacteria on the metabolism of organic acids during winemaking. Foods 2020, 9, 1231. [Google Scholar] [CrossRef]
- Cortez, P.; Cerdeira, A.; Almeida, F.; Matos, T.; Reis, J. Modeling wine preferences by data mining from physicochemical properties. Decis. Support Syst. 2009, 47, 547–553. [Google Scholar] [CrossRef] [Green Version]
- Waterhouse, A.L.; Sacks, G.L.; Jeffery, D.W. Understanding Wine Chemistry; John Wiley & Sons: Hoboken, NJ, USA, 2016. [Google Scholar]
- Sweetman, C.; Sadras, V.O.; Hancock, R.D.; Soole, K.L.; Ford, C. Metabolic effects of elevated temperature on organic acid degradation in ripening Vitis vinifera fruit. J. Exp. Bot. 2014, 65, 5975–5988. [Google Scholar] [CrossRef] [PubMed]
- Ford, C.M. The biochemistry of organic acids in the grape. In The Biochemistry of the Grape Berry; Bentham Books: Sharjah, United Arab Emirates, 2012; pp. 67–88. [Google Scholar]
- Jančářová, I.; Jančář, L.; Náplavová, A.; Kubáň, V. Changes of organic acids and phenolic compounds contents in grapevine berries during their ripening. Open Chem. 2013, 11, 1575–1582. [Google Scholar] [CrossRef] [Green Version]
- Šuklje, K.; Antalick, G.; Buica, A.; Langlois, J.; Coetzee, Z.A.; Gouot, J.; Schmidtke, L.; Deloire, A. Clonal differences and impact of defoliation on Sauvignon blanc (Vitis vinifera L.) wines: A chemical and sensory investigation. J. Sci. Food Agric. 2016, 96, 915–926. [Google Scholar] [CrossRef] [PubMed]
- Vujović, D.; Maletić, R.; Popović-Đorđević, J.; Pejin, B.; Ristić, R. Viticultural and chemical characteristics of Muscat Hamburg preselected clones grown for table grapes. J. Sci. Food Agric. 2017, 97, 587–594. [Google Scholar] [CrossRef]
- Mattivi, F.; Guzzon, R.; Vrhovsek, U.; Stefanini, M.; Velasco, R. Metabolite profiling of grape: Flavonols and anthocyanins. J. Agric. Food Chem. 2006, 54, 7692–7702. [Google Scholar] [CrossRef]
- OIV (International Organization of Vine and Wine). Statistical Report on World Vitiviniculture; OIV: Paris, France, 2019. [Google Scholar]
- SAG (Servicio Agrícola y Ganadero). Zonificación Vitícola y Denominación de Origen. Available online: https://www.sag.gob.cl (accessed on 2 January 2022).
- SAG (Servicio Agrícola y Ganadero). Informe Ejecutivo Producción de Vinos. Available online: https://www.sag.gob.cl/content/informe-ejecutivo-produccion-de-vinos-2019 (accessed on 19 January 2022).
- Saavedra, J.; Fuentealba, C.; Yáñez, L.; Bravo, M.; Quiroz, W.; Lukacsy, G.; Carot, J.M. Chemometric approaches for the zoning of Pinot Noir wines from the Casablanca valley, Chile. Food Chem. 2011, 127, 1842–1847. [Google Scholar] [CrossRef]
- Cuneo, I.; Salgado, E.; Castro, M.; Córdova, A.; Saavedra, J. Effects of climate and anthocyanin variables on the zoning of Pinot Noir wine from the Casablanca Valley. J. Wine Res. 2013, 24, 264–277. [Google Scholar] [CrossRef]
- Reyes, G.; Zamora, G. Estudio Agrológico V Región: Descripciones de Suelos, Materiales Y Símbolos; CIREN N°116; Chile. 2009. Available online: https://www.semanticscholar.org/paper/Estudio-agrol%C3%B3gico-V-Regi%C3%B3n.-Descripciones-de-y-Calvo-Gatica/302955f8cc07797d3a3b9b4c6482a4e6a09c815d (accessed on 15 May 2022).
- OIV (International Organization of Vine and Wine). Compendium of International Methods of Wine and Must Analysis; OIV: Paris, France, 2012. [Google Scholar]
- Bindon, K.; Kassara, S.; Cynkar, W.; Robinson, E.; Scrimgeour, N.; Smith, P. Comparison of extraction protocols to determine differences in wine-extractable tannin and anthocyanin in Vitis vinifera L. cv. Shiraz and Cabernet Sauvignon grapes. J. Agric. Food Chem. 2014, 62, 4558–4570. [Google Scholar] [CrossRef]
- Glories, Y. La coleur des vins rouges, 2eme Partier. Mesure, origine et interpretation. Connaiss. Vigne Vin 1984, 18, 253–271. [Google Scholar]
- Gil i Cortiella, M.; Ubeda, C.; Covarrubias, J.I.; Peña-Neira, A. Chemical, physical, and sensory attributes of Sauvignon blanc wine fermented in different kinds of vessels. Innov. Food Sci. Emerg. Technol. 2020, 66, 102521. [Google Scholar] [CrossRef]
- Peña-Neira, A.; Cáceres, A.; Pastenes, C. Low molecular weight phenolic and anthocyanin composition of grape skins from cv. Syrah (Vitis vinifera L.) in the Maipo Valley (Chile): Effect of clusters thinning and vineyard yield. Food Sci. Technol. Int. 2007, 13, 153–158. [Google Scholar] [CrossRef]
- Souza Gonzaga, L.; Capone, D.; Bastian, S.; Jeffery, D. Defining wine typicity: Sensory characterization and consumer perspectives. Aust. J. Grape Wine Res. 2021, 27, 246–256. [Google Scholar] [CrossRef]
- Van Leeuwen, C.; Friant, P.; Chone, X.; Tregoat, O.; Koundouras, S.; Dubourdieu, D. Influence of climate, soil, and cultivar on terroir. Am. J. Enol. Vitic. 2004, 55, 207–217. [Google Scholar]
- Coombe, B.; McCarthy, M. Dynamics of grape berry growth and physiology of ripening. Aust. J. Grape Wine Res. 2000, 6, 131–135. [Google Scholar] [CrossRef]
- Cataldo, E.; Salvi, L.; Battista, G. Effects of irrigation on ecophysiology, sugar content and thiol precursors (3-S-cysteinylhexan-1-ol and 3-S-glutathionylhexan-1-ol) on Vitis vinifera cv. Sauvignon Blanc. Plant Physiol. Biochem. 2021, 164, 247–259. [Google Scholar] [CrossRef] [PubMed]
- De Lorenzis, G.; Squadrito, M.; Rossoni, M.; Simone di Lorenzo, G.; Brancadoro, L.; Scienza, A. Study of intra-varietal diversity in biotypes of Aglianico and Muscat of Alexandria (Vitis vinifera L.) cultivars. Aust. J. Grape Wine Res. 2017, 23, 132–142. [Google Scholar] [CrossRef]
- Iland, P.; Dry, P.; Proffitt, T.; Tyerman, S. The Grapevine: From the Science to the Practice of Growing Vines for Wine; Patrick Iland Wine Promotions: Adelaide, Australia, 2011. [Google Scholar]
- Keller, M. The Science of Grapevines, 3rd ed.; Elsevier: Amsterdam, The Netherlands, 2020. [Google Scholar]
- Mpelasoka, B.; Schachtman, D.; Treeby, M.; Thomas, M. A review of potassium nutrition in grapevines with special emphasis on berry accumulation. Aust. J. Grape Wine Res. 2003, 9, 154–168. [Google Scholar] [CrossRef]
- Rogiers, S.; Zelmari, A.; Coetzee, Z.; Walker, R.; Deloire, A.; Tyerman, S. Potassium in the grape (Vitis vinifera L.) berry: Transport and function. Front. Plant Sci. 2017, 8, 1629. [Google Scholar] [CrossRef]
- Volschenk, H.; Van Vuuren, H.; Viljoen-Bloom, M. Malic acid in wine: Origin, function and metabolism during vinification. S. Afr. J. Enol. Vitic. 2006, 27, 123–136. [Google Scholar] [CrossRef] [Green Version]
- Poni, S.; Gatti, M.; Palliotti, A.; Dai, Z.; Duchêne, E.; Truong, T.; Ferrara, G.; Matarrese, A.; Gallotta, A.; Bellincontro, A.; et al. Grapevine quality: A multiple choice issue. Sci. Hortic. 2018, 234, 445–462. [Google Scholar] [CrossRef] [Green Version]
- Rustioni, L.; Fracassetti, D.; Prinsi, B.; Geuna, F.; Ancelotti, A.; Fauda, V.; Failla, O. Oxidations in white grape (Vitis vinifera L.) skins: Comparison between ripening process and photooxidative sunburn symptoms. Plant Physiol. Biochem. 2020, 150, 270–278. [Google Scholar] [CrossRef] [PubMed]
- George, N.; Clark, A.; Prenzler, P.; Scollary, G. Factors influencing the production and stability of xanthylium cation pigments in a model white wine system. Aust. J. Grape Wine Res. 2006, 12, 57–68. [Google Scholar] [CrossRef]
- Waterhouse, A.; Laurie, V. Oxidation of wine phenolics: A critical evaluation and hypotheses. Am. J. Enol. Vitic. 2006, 57, 306–313. [Google Scholar]
- Ortega, A.; López-Toledano, A.; Mayen, M.; Mérida, J.; Medina, M. Changes in color and phenolic compounds during oxidative aging of sherry white wine. J. Food Sci. 2003, 68, 2461–2468. [Google Scholar] [CrossRef]
- Li, H.; Guo, A.; Wang, H. Mechanisms of oxidative browning of wine. Food Chem. 2008, 108, 1–13. [Google Scholar] [CrossRef]
- Danilewicz, J. Review of oxidative processes in wine and value of reduction potentials in enology. Am. J. Enol. Vitic. 2012, 63, 1–10. [Google Scholar] [CrossRef] [Green Version]
- Czemmel, S.; Stracke, R.; Weisshaar, B.; Cordon, N.; Harris, N.; Walker, A.; Robinson, S.; Bogs, J. The grapevine R2R3-MYB transcription factor VvMYBF1 regulates flavonol synthesis in developing grape berries. Plant Physiol. 2009, 151, 1513–1530. [Google Scholar] [CrossRef] [Green Version]
- Matus, J.T.; Loyola, R.; Vega, A.; Peña-Neira, A.; Bordeau, E.; Arce-Johnson, P.; Alcalde, J.A. Post-veraison sunlight exposure induces MYB-mediated transcriptional regulation of anthocyanin and flavonol synthesis in berry skins of Vitis vinifera. J. Exp. Bot. 2009, 60, 853–867. [Google Scholar] [CrossRef] [Green Version]
- Martinez-Lücher, J.; Brillante, L.; Kaan Kurtural, S. Flavonol profile is a reliable indicator to assess canopy architecture and the exposure of red wine grapes to solar radiation. Front. Plant Sci. 2019, 10, 10. [Google Scholar] [CrossRef] [Green Version]
- Ewart, A.; Gawel, R.; Thistlewood, S.; McCarthy, M. Evaluation of must composition and wine quality of six clones of Vitis vinifera cv. Sauvignon Blanc. Aust. J. Exp. Agric. 1993, 33, 945–951. [Google Scholar] [CrossRef]
- Conde, C.; Silva, P.; Fontes, N.; Dias, A.; Tavares, R.; Sousa, M.J.; Agasse, A.; Delrot, S.; Gerós, H. Biochemical changes throughout grape berry development and fruit and wine quality. Food 2007, 1, 1–22. [Google Scholar]
- Hufnagel, J.; Hofmann, T. Quantitative reconstruction of the nonvolatile sensometabolome of a red wine. J. Agric. Food Chem. 2008, 56, 9190–9199. [Google Scholar] [CrossRef] [PubMed]
- Anderson, J.; Jones, G.; Tait, A.; Hall, A.; Trought, M.C. Analysis of viticulture region climate structure and suitability in New Zealand. Oeno One 2012, 46, 149–165. [Google Scholar] [CrossRef] [Green Version]
- Spellman, G. Wine, weather and climate. Weather 1999, 54, 230–239. [Google Scholar] [CrossRef]
- Rösti, J.; Schumann, M.; Cléroux, M.; Lorenzini, F.; Zufferey, V.; Rienth, M. Effect of drying on tartaric acid and malic acid in Shiraz and Merlot berries. Aust. J. Grape Wine Res. 2018, 24, 421–429. [Google Scholar] [CrossRef]
- Dai, Z.W.; Ollat, N.; Gomès, E.; Decroocq, S.; Tandonnet, J.; Bordenave, L. Ecophysiological, genetic, and molecular causes of variation in grape berry weight and composition: A review. Am. J. Enol. Vitic. 2011, 62, 413–425. [Google Scholar] [CrossRef] [Green Version]
- Keller, M.; Shrestha, P.M. Solute accumulation differs in the vacuoles and apoplast of ripening grape berries. Planta 2014, 239, 633–642. [Google Scholar] [CrossRef]
Publisher’s Note: MDPI stays neutral with regard to jurisdictional claims in published maps and institutional affiliations. |
© 2022 by the authors. Licensee MDPI, Basel, Switzerland. This article is an open access article distributed under the terms and conditions of the Creative Commons Attribution (CC BY) license (https://creativecommons.org/licenses/by/4.0/).