Abstract
Conservation management practices such as no-tillage and cover crops can decrease soil’s susceptibility to wind erosion, but adoption of these practices has been limited on the Texas High Plains (THP) where producers are concerned with cover crop water usage. The objective of this study was to evaluate the impact of no-tillage and cover crops on cotton (Gossypium hirsutum L.) lint yield and soil water content in a deficit irrigated cropping system. Soil water was observed bi-weekly in long-term, continuous cotton systems established in 1998 that included (1) conventional tillage, winter fallow, (2) no-tillage with rye (Secale cereale L.) cover, and (3) no-tillage with mixed species cover located in Lamesa, TX, USA. Results include observations from 2018–2020 (years 21–23 of the study period). The adoption of conservation practices did not significantly reduce cotton lint yield compared to conventionally tilled, winter fallow cotton. Soil water was initially depleted with cover crops but was greater throughout the growing season following cover crop termination. Throughout the soil profile, water depletion and recharge were more dynamic with conservation practices compared to the conventionally tilled control. There were no differences in cotton water use efficiency between treatments. Results from this study indicate cover crop water usage is likely not the cause of cotton lint yield decline in this deficit irrigated semi-arid production system.
1. Introduction
During the Dust Bowl of the 1930s, approximately 5 Tg of topsoil were eroded from the United States Great Plains, which prompted the formation of the Soil Conservation Service and, ultimately, the Natural Resources Conservation Service (NRCS) to combat the loss of this vital resource [1]. Since the Dust Bowl, agronomic conservation efforts such as reducing tillage and adopting crop rotations [1] coupled with governmental land-use policies such as the Conservation Reserve Program [2] have reduced wind erosion by 80% on the Great Plains. However, historic droughts [3] coupled with climate change have produced several haboobs reminiscent of the 1930s on the Texas High Plains (THP) [4] where conservation practices have limited adoption [5]. Across the United States of America (USA), conservation tillage in cotton production accounts for only an estimated 40% of the acres compared to more than 65% of corn, soybean, and wheat acres [6]. On the Great Plains, only 30% of cotton acres utilize conservation tillage, whereas 70% of southeastern cotton acres employ the practice. Producers’ limited adoption of conservation management practices on the THP is poorly understood, but research suggests producers are concerned with yield reductions, water availability, and costs associated with adopting conservation management practices, especially in semi-arid regions [5]. These concerns are compounded by the limited amount of cotton biomass produced during a growing season, which necessitates the use of cover crops with reduced tillage [6]. In addition to understanding the barriers to adoption on the THP, it is important for researchers to evaluate the agricultural, economical, and ecological benefits and consequences of these conservation practices for producers to make the most informed management decisions.
On the THP, cotton (Gossypium hirsutum L.) is the most widely planted agricultural crop, with 2.3 Mha planted in 2018, resulting in approximately USD 2.5 billion in annual revenue for the state and nearly 25% of the USA’s exported cotton [7,8]. The cotton productive capacity of the THP is largely dependent on underground irrigation from the Ogallala Aquifer [9], where irrigation helps to minimize intermittent moisture stress that can be problematic for cotton production in the region [10]. In the THP, precipitation or irrigation during the maturation phase ensures cotton yield [11], and shortages during flowering can result in significant yield reductions [12,13]. Pumping of the Ogallala and limited recharge has led the aquifer to a 50% decrease in irrigation capacity since the 1950s [9]. Ensuring continued agricultural productivity on the THP will require the adoption of conservation management practices to secure our soil and minimize soil water loss.
Reduced tillage and cover crops are generally the most broadly adopted conservation management practices on the THP [14]. The adoption of these practices in the region has been shown to increase carbon storage [14], soil aggregation [15,16], biological activity [17], nutrient cycling [18], and reduced susceptibility of the soils to wind and water erosion [19]. In a prior field assessment of the study presented in this manuscript in Lamesa, Texas (TX), USA, conservation management adoption in cotton cropping systems significantly increased soil water during key physiological growth stages [20] but resulted in yield decreases compared to traditional practices [14]. Prior to cover crop termination, soil water was depleted more where active cover growth was occurring than in the fallow control in all three years of the study [20]. However, after termination, soil water was generally greater throughout the profile following cover crops. Throughout active cotton growth, increases in soil water were greater in the conservation system, indicating greater water interception, infiltration, and percolation, while decreases in soil water were reduced following cover crops, indicating that they minimized soil water loss from the soil surface and throughout the profile. The authors concluded that the increases in soil water with no-tillage and cover crops were likely the result of increased water storage capacity and decreased evapotranspiration from shading of the soil surface.
No-tillage and cover crops can improve soil physical properties and soil C storage, which can increase water holding capacity [21]. Despite the benefits, studies show that cover crops can utilize the limited soil water in semi-arid agroecoregions, which can reduce the subsequent main crop yield in a variety of cropping systems [22,23,24,25]. The use of small grain cover crops resulted in reduced cotton lint yield of both dryland and irrigated cropping systems [14,26]. In the northern THP, soil water and cotton yields were increased by 16 and 50% compared to traditionally grown cotton in a dryland system, respectively [27]. In the Texas Rolling Plains, no-tillage and cover crop use significantly increased cotton lint yields compared to traditional practices in a terminated wheat cover crop system [28].
The production of cover crop herbage mass can be limited on the THP due to minimal precipitation, low temperatures, and high wind speeds during the traditional fallow winter period [14,18,20,29,30]. As stated previously, the use of cover crops in this region can substantially reduce soil susceptibility to wind erosion [19]. Small grains perform this function better in the semi-arid THP because they require smaller amounts of moisture to become established, and their growth physiology helps to slow wind across the soil surface, reducing wind erosion [14,29,30]. In dryland systems of west Texas, wheat (Triticum aestivum L.) and rye (Secale cereale L.) were more likely to establish and provide sufficient biomass to protect the soil surface when planted in the fall compared to 13 small grains and forage legumes that were evaluated [29]. The goal of this study was to evaluate the long-term effects of conservation management adoption on cotton lint yield and soil water dynamics. Based on previous research of conservation management practices in this semi-arid region, we hypothesize that cover crops and no-tillage will significantly reduce soil water prior to cover crop termination but increase soil water during active cotton growth.
2. Materials and Methods
2.1. Site Description, Experimental Design, and Cropping System Management
The long-term field experiment was initiated in 1998 at the Agricultural Complex for Advanced Research and Extension Systems located near Lamesa, TX, USA (N 32°46′2′′, W 101°56′1′′; 919 m a.s.l.). Prior to the initiation of the study, the site had been used exclusively for conventionally tilled, continuous cotton production for at least 50 years. Soil at the site was described according to USDA Soil Classification as an Amarillo fine sandy loam (fine-loamy, mixed, superactive, thermic Aridic Paleustalfs) with approximately 84, 10, and 6% g kg−1 sand, silt, and clay, respectively [31]. The Amarillo series is considered a benchmark soil with significant distribution (2.3 M ha) in the region. Additional soil characterization for the site is available in other reports [14,18,32]. This paper reports results from the 2018 through 2020 growing seasons (years 20–22 of the study).
In 1998, the conventional tillage and no-tillage with rye cover crop treatments were initiated as a randomized complete block design with three replications. The conventional tillage plots were 16 rows wide while the no-tillage with rye cover crop plots were 32 rows wide. In 2014, the no-till rye plots were split in half, and a mixed species cover was implemented, which included 50% rye, 33% Austrian winter pea (Pisum sativum L.), 10% hairy vetch (Vicia villosa Roth), and 7% radish (Raphanus sativus L.), by weight. The single and mixed species cover crops were planted using a grain drill at a rate of 45 kg ha−1. Cotton was planted annually as the main crop.
Treatments at the site included: (1) conventional tillage with a fallow period usually from November–May (CT); (2) no-tillage with rye cover (R-NT); and (3) no-tillage with mixed species cover (M-NT). Treatments were arranged as a randomized complete block design with three replications. Plots were 16 rows (1.02 m centers) wide and 76.2 m long. During active cotton growth, plots were irrigated using low energy precision application irrigation. Due to differences in annual precipitation and irrigation capacity, varying rates of irrigation were applied during each growing season to meet cotton water demands. Cover crops were not irrigated during the study. Any irrigation that occurred from October to April was applied after cover crop termination and prior to planting cotton (Table 1).

Table 1.
Pre-plant (October–April) and in-season (May–September) precipitation and irrigation for 2018, 2019, and 2020 at the Agricultural Complex for Advanced Research and Extension Systems, Lamesa, TX, USA.
The cropping sequences are graphically summarized in Figure 1. Cover crops were seeded using an 8-row grain drill on 19.1 cm row spacing on 17 November 2017, 4 December 2018, and 21 November 2019 following cotton harvest and were chemically terminated with glyphosate (potassium salt form) at a rate of 2.3 L ha−1 on 27 March 2018, 9 April 2019, and 27 March 2020. Prior to termination, cover crops were harvested from a 1 m2 area and dried for 7 d at 60 °C to determine herbage mass on a dry matter (DM) basis. Cotton was planted across all plots on 15 May 2018, 19 May 2019, and 18 May 2020. To aid harvest, the cotton was chemically defoliated in October of each year and mechanically harvested on 19 November 2018, 28 October 2019, and 31 October 2020. Annually, urea ammonium nitrate (32-0-0) was applied through fertigation in four equal applications for a total of 134.5 kg N ha−1. A thorough discussion of the cropping systems is available in a previously published report [14].
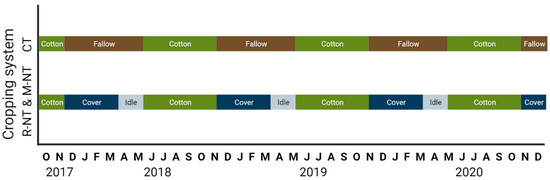
Figure 1.
Continuous cotton cropping system sequences for conventional tillage, winter fallow (CT), no-tillage with rye cover (R-NT), and no-tillage with mixed species cover (M-NT) at the Agricultural Complex for Advanced Research and Extension Systems, Lamesa, TX, USA from 1 October 2017 through 31 December 2020. Created with Biorender.com (accessed on 26 February 2022).
2.2. Sampling Protocol and Analysis
Soil samples were collected for general soil characterization on 6 April 2020 following cover crop termination on 27 March 2020 and prior to cotton planting on 18 May 2020 to a depth of 60 cm from each plot and analyzed for total N, nitrate-N, Mehlich III extractable macronutrients, pH, and electrical conductivity (EC). Soil samples were composites of three, 5.1 cm diameter cores per plot collected with a Giddings probe and separated into 0 to 15, 15 to 30, and 30 to 60 cm depth increments. Soil samples were dried at 60 °C for 7 d and ground to pass a 2 mm sieve using a flair grinder. Total N (TN) was determined by combustion following fine grinding with a ring-and-puck grinder [33]. Residual soil inorganic nitrate-N (NO3−-N) was determined using a colorimetric method involving cadmium reduction to nitrate following extraction with 2 M KCl using a 1:10 soil/extraction ratio (4 g soil:40 mL 2 M KCl) followed by analysis using flow injection spectrometry (FIAlab Instruments, Bellevue, WA, USA). Extractable soil nutrients including P, K, Ca, Mg, and S were extracted using a Mehlich III extractant and measured using inductively coupled plasma spectroscopy [34]. Soil pH and EC were determined in a 1:2 soil to deionized water slurry utilizing a pH probe and conductivity electrode [35,36]. An additional soil core was collected from each plot to determine the bulk density (BD) at 0 to 15, 15 to 30, and 30 to 60 cm depths [37].
A field-calibrated neutron probe (InstroTek Inc., Raleigh, NC, USA) was used to monitor soil water for volumetric water content (VWC, θ). Measurements were collected biweekly beginning in January 2018 and ran throughout the duration of the experiment unless we were unable to enter the field due to poor weather conditions [20,38]. In March 2015, aluminum access tubes (8 cm diameter) were installed into each plot to a depth of 140 cm. Measurements were collected in 20 cm depth increments. The access tubes were constructed with a 60 cm removable top that allowed the top to be removed for agronomic field operations including plowing (CT), planting, and harvesting. The VWC for each measurement was multiplied by the 20 cm depth interval to determine soil water content (mm). In each growing season, soil water was presented as days after planting (DAP) cotton; therefore, negative DAP values represented days prior to planting cotton. Total soil water was calculated as the sum of water at each individual depth increment for the entire profile. The rate of change in soil water was calculated as the difference in profile soil water from one sampling date to the next, divided by the sampling interval, as:
where θ represents VWC (m3 m−3) and t represents sampling date [20]. The same formula was used to determine changes in soil water at each depth. Cotton water use efficiency (CWUE) was calculated by dividing cotton lint yield (kg lint ha−1) by crop water use, where crop water use is defined as: (starting profile soil water (at planting) + in-season rainfall + in-season irrigation) − finishing profile soil water (at harvest) [20,39]. Runoff and deep drainage were assumed to be negligible because the field was level (0–1% slopes), had adequate water holding capacity in the subsoil (20.5 cm through 1 m depth), and did not receive substantial rainfall or irrigation during the study period based on methodologies common to the region [19,37,38].
Changes in soil water (mm day−1) = (θ2 − θ1)/(t2 − t1),
2.3. Statistical Approach and Analysis
All statistical analyses were performed using SAS version 9.4 (SAS Institute, Inc., Raleigh, NC, USA). Data analysis was conducted using a generalized linear mixed model (PROC GLIMMIX) with cropping system treated as the fixed effect and replication as the random effect. The effect of year and year × treatment was determined, and due to a significant year effect, treatment means were evaluated within year. Year × treatment effect was not significant. Normality was determined using the Shapiro–Wilk test, and all data were normally distributed. Means of treatment effects were compared within sample time using Fisher’s least significant difference (LSD) at p < 0.05. Contour maps were made using SigmaPlot version 14.5 (Systat Software, Palo Alto, CA, USA).
3. Results and Discussion
3.1. Temperature, Precipitation, and Irrigation
Monthly mean temperature followed similar trends from 2018–2020 (Figure 2) (National Centers for Environmental Information, National Oceanic and Atmospheric Administration). The average annual temperature at the research site was 16.7, 16.4, and 17.2 °C in 2018, 2019, and 2020, respectively. The observed annual temperatures were 5, 4, and 8% greater than the 30-year average. Increases in temperature were more likely observed in May and June of the study period compared to the long-term average. Annual precipitation was 342, 300, and 195 mm in 2018, 2019, and 2020, respectively, which was 39, 58, and 144% lower than the 30-year average precipitation. September and October 2019 experienced the greatest monthly precipitation with 97 and 105 mm, respectively. Variation in growing season precipitation resulted in variations in irrigation amounts; therefore, 231.1, 274.3, and 289.6 mm irrigation was applied during the cotton growing seasons of 2018, 2019, and 2020, respectively, to meet crop water demand based on estimated evapotranspiration (ET) at the study site (Table 1). Irrigation amounts in each month were based on approximately 35% estimated ET replacement when irrigation capacity allowed it. The peak months for irrigation use in all years were July and August, which coincided with peak cotton water demand [40,41]. Reliance on irrigation from the Ogallala Aquifer to meet crop water demand is not sustainable under current withdrawal rates due to its limited recharge in the Texas High Plains [3].
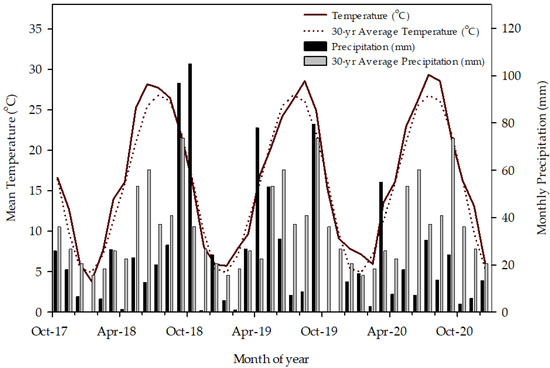
Figure 2.
Mean monthly temperature and total monthly precipitation from rainfall and irrigation events and 30-year (1991–2020) climate averages at the Agricultural Complex for Advanced Research and Extension Systems, Lamesa, TX, USA from 1 November 2017 through 30 November 2020 (National Oceanic and Atmospheric Administration—National Centers for Environmental Information, 2022).
3.2. Soil Characterization and Cover Crop Herbage Mass
Soil characteristics are presented in Table 2 and represent the effect of cropping system management after year 22 of the study period (established in 1998). Soil pH was reduced at the 0–15 cm depth with R-NT and M-NT treatments compared to CT. Reductions in soil pH at 0–15 cm were likely caused by increased C inputs and rhizodeposition of the cover crop systems compared to CT, which stimulated microbial activity and decreased soil pH through microbial respiration [42]. This phenomenon has been observed in other semi-arid cropping systems [14,16]. The reduction in soil pH observed in this study can increase soil nutrient availability in semi-arid ecosystems [43,44]. No differences in soil pH between cropping systems were determined at 15–30 and 30–60 cm depths. Electrical conductivity was significantly impacted at all depths; EC was greatest with R-NT compared to CT and M-NT. In semi-arid, irrigated cropping systems, salt leaching can increase land degradation and reduce crop yields [44]. Contrary to our study where R-NT increased EC at all depths, cover crops have been shown to reduce salt concentrations compared to fallow systems [45]. We hypothesize that the increased biomass production with R-NT compared to M-NT from 2015–2020 (Figure 3) [14] resulted in more numerous root channels for preferential water flow and that these channels allowed greater transport of soluble salts. This hypothesis is supported by significant increases in EC at the 30–60 cm depth compared to the 0–15 and 15–30 cm depths. Cropping systems had no impact on BD, total-N, K, Ca, Mg, and S at any depth. However, Ca and Mg significantly increased across treatments at the 30–60 cm depth. This was likely due to carbonate pedogenesis common to semi-arid regions [31].
Table 2.
Characterization of soil collected at the Agricultural Complex for Advanced Research and Extension Systems, Lamesa, TX, USA in April 2020 at soil depths of 0 to 15, 15 to 30, and 30 to 60 cm from the conventional tillage winter fallow (CT), no-tillage rye cover crop (R-NT), and no-tillage mixed species cover (M-NT) treatments. Different letters within columns indicate differences between cropping systems within depth (p < 0.05).
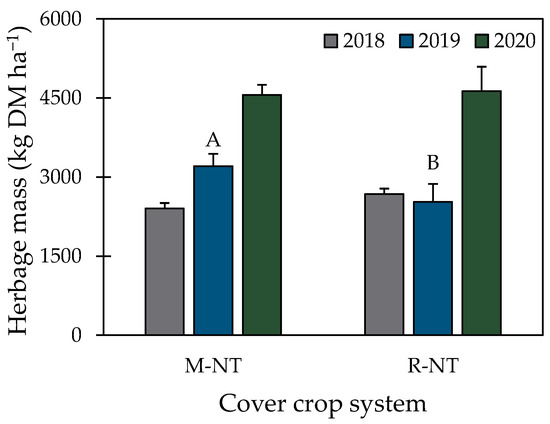
Figure 3.
Rye (R-NT) and mixed species (M-NT) cover crop herbage mass (DM, dry matter) produced in 2018, 2019, and 2020 in Lamesa, TX, USA. Letters indicate significant differences between cover crop treatment means within year at p < 0.05. Differences were not determined in 2018 and 2020. Error bars represent standard error of the sample mean.
While there were no significant differences in BD between treatments at any depth, BD in CT was generally smaller compared to R-NT and M-NT at the 0–15 cm depth. This was likely the result of surface plowing to a 15 cm depth in CT. Bulk density increased in the 15–30 cm depth and could indicate a potential restrictive layer, which has been observed in the past [32]. This increase in BD would likely not restrict cotton or cover crop root growth but may influence infiltration and percolation of irrigation and precipitation [32,46,47]. Earlier investigations of this cropping system showed little difference in bulk density, but R-NT decreased (in 2013) and then increased (in 2014) the penetration resistance based on soil moisture content at the two sampling events compared to the conventional control [32]. It is uncommon in our region for producers to implement no-tillage without cover crops because the limited amount of biomass that cotton produces would be insufficient to reduce wind erodibility. Since our study sought to replicate cropping systems common to the region (i.e., continuous cotton), it was impossible to separate the effects of cover cropping from no-tillage. The combined beneficial impacts of cover cropping and no-tillage have been shown to increase infiltration and water storage through greater soil organic carbon content [48] and preferential flow paths [49,50].
The adoption of conservation management practices (i.e., R-NT and M-NT) had a significant effect on nutrient availability (Table 2). Soil NO3−-N was significantly reduced by 88 and 84% at 0–15 and 15–30 cm, respectively, with R-NT and M-NT compared to CT. Reductions in soil NO3−-N with the adoption of cover crops is likely caused by the uptake of NO3−-N by the cover crop for growth and development [51,52,53]. In parts of the USA, cover crops are used to reduce NO3−-N leaching; however, in semi-arid regions where leaching is limited and biomass decomposition is slowed, NO3−-N uptake and immobilization may result in limited plant-available N at planting [54]. An evaluation of N demands of cotton following cover crops on the semi-arid THP demonstrated that an additional 38 kg N ha−1 would be required for adequate cotton production [55]. Regional evaluations of cover crop species showed that rye, wheat, Austrian winter pea, and hairy vetch were highly productive, but under dryland situations, the legumes produced limited biomass, which could indicate that the legume species would generate limited biologically fixed N [30]. On the THP, an evaluation of seeding rates showed that there was no significant difference in rye or wheat production regardless of seeding rate [56]. Implications suggest that conservation systems can receive similar ecosystem service benefits of cover crops at lower seeding rates, saving producers money and water while reducing the potential for N immobilization [57]. In addition to seeding rate, cover crop termination timing plays an important role in N availability. While delayed termination timing increased biomass production, N release from biomass decomposition was delayed, resulting in potential immobilization [58]. Producers should consider potential N limitations with cover crop adoption in semi-arid regions when determining cover crop seeding rate and termination timing in addition to N fertilization strategies following cover crop termination.
While leaching of NO3−-N is likely uncommon in this cropping system due to prescriptive nutrient management, historic over-application of inorganic fertilizers resulted in significant increases in NO3−-N leaching at depth in this cropping system [52]. Like NO3−-N, S showed significant increases at the 30–60 cm depth compared to the 0–15 and 15–30 cm depths. This was most likely the result of S leaching over time through over-application of S fertilizer [52]. In contrast to NO3−-N, P was 44% greater in R-NT and M-NT compared to CT at the 0–15 cm depth. Cover crops have been shown to increase soil P availability through increased soil exploration with fibrous roots [59], reduction in soil pH [60], P cycling enzyme activity [61], and microbial diversity [62]. The significant decrease in P concentrations at the 30–60 cm depth is likely the result of the limited activity of the aforementioned processes.
Cover crop herbage mass varied from 2406 to 4629 kg DM ha−1 through the duration of the study (Figure 3). Rye herbage mass ranged from 2528 to 4629 kg DM ha−1, and M-NT herbage mass ranged from 2406 to 4560 kg DM ha−1. The only significant differences in herbage mass production were observed in 2019, when M-NT produced greater herbage mass than R-NT. An earlier evaluation of the same cropping system from 2015–2017 resulted in significantly greater herbage mass with R-NT than M-NT in 2015 and 2017 and generally greater biomass in 2016 [14]. In 2018 and 2020, R-NT generally produced greater cover crop biomass compared to M-NT. Herbage mass was greater in 2020 compared to the other years in the study. In contrast to the THP, cover crop mixtures of wheat, Austrian winter pea, hairy vetch, and crimson clover (Trifolium incarnatum L.) produced more herbage mass compared to a single species (wheat) cover when averaged from 2013–2017 [40]. The authors attributed the herbage mass production to planting date and precipitation in March and early April. Like our study, their cover crops were seeded following cotton harvest in November, which was later than the historical first killing freeze (early November) for the region. Generally, fall-planted legumes should be seeded 6–8 weeks prior to that date, and this likely limited the legume production in our system. While non-cereals accounted for 50% of our cover crop seed mixture by weight, they produced less than 1% of herbage mass at termination annually (data not shown). Interseeding cover crops directly into established cotton in mid-September was not possible within our cropping system because cotton harvest aids (applied in October) would have been detrimental to the cover crop seedlings. Contrary to results from the Rolling Plains, cover crop herbage mass did not appear to be driven by precipitation in March and early April [40]. Additional research is needed to understand the primary driver of herbage mass production in semi-arid ecoregions.
3.3. Cotton Lint Yield and Water Use Efficiency
Cotton lint yield ranged from 540 to 853 kg lint ha−1 in 2018 to 2020 (Figure 4). There were no significant differences in cotton lint yield between treatments in any year. Cotton lint ranged from 724 to 853 kg lint ha−1, 683 to 765 kg lint ha−1, and 540 to 706 kg lint ha−1 in 2018, 2019, and 2020, respectively. On average, cotton lint yields were greater in 2018 (810 kg lint ha−1) followed by 2019 (728 kg lint ha−1) and finally 2020 (600 kg lint ha−1). In 2018, CT and R-NT generally produced greater cotton lint than M-NT, while in 2019 CT and M-NT generally produced greater cotton lint than R-NT. Averaged across the three years, cotton lint yield was generally greater in CT (765 kg lint ha−1), followed by R-NT (691 kg lint ha−1) and then M-NT (681 kg lint ha−1).
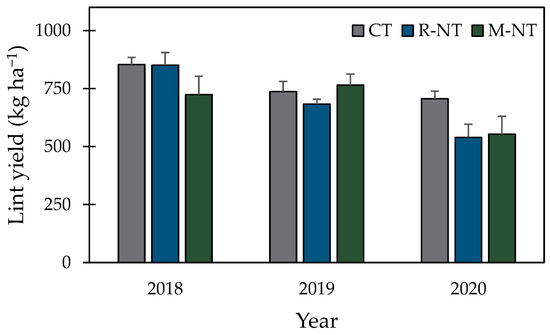
Figure 4.
Cotton lint yield in the 2018, 2019, and 2020 growing seasons in Lamesa, TX, USA. Differences were not determined in any year at p < 0.05. Error bars represent standard error of the sample mean. Conventional tillage winter fallow, no-tillage rye cover, and no-tillage mixed species cover are represented as CT, R-NT, and M-NT, respectively.
Our results complicate an already complicated understanding of the effects of conservation management practices on cotton lint yield in semi-arid regions. Previous studies showed both increases [27,28,29,63,64,65,66] and decreases [14,55] in lint production following conservation management. Lint yields were generally reduced compared to production from 2015–2017, which received greater rainfall than the 2018–2020 study period; however, the annual variability in lint yield is common for the region [14,20]. The reduction in yield observed in 2020 was likely caused by the greater amounts of herbage mass produced with the cover crops compared to 2018 and 2019. Increased herbage mass can result in N immobilization following termination [67], and additional N fertilization may be required for the subsequent cash crop to minimize yield loss [55]. However, given increased N fertilizer input costs and limited availability from disrupted supply chains [68], producers might be less inclined to apply supplemental N fertilizer. Therefore, alternatives to supplemental N fertilization may be required, including maximizing cover crop termination timing to limit herbage mass production and maximize net N mineralization [58,69,70].
Cotton water use efficiency ranged from 0.96 to 3.04 kg lint ha−1 mm−1 from 2018 to 2020 (Table 3). Like cotton lint yield, no differences in CWUE were observed during the study period. Cotton water use efficiency was greatest (p < 0.001) in 2018 (2.33 kg lint ha−1 mm−1) when compared to 2020 (1.64 kg lint ha−1 mm−1) and 2019 (1.59 kg lint ha−1 mm−1). When averaged across years, CWUE was generally greater in CT (1.99 kg lint ha−1 mm−1), followed by R-NT (1.80 kg lint ha−1 mm−1) and M-NT (1.76 kg lint ha−1 mm−1). Consistent with our results, previous evaluations showed no differences in cotton water use efficiency despite variability in cotton production from conservation practices [20,71,72,73]. The lack of differences in water use efficiency between treatments supports our hypothesis that water is not the most limiting factor for cotton production in these systems [14,20].
Table 3.
Water use efficiency for continuous cotton cropping systems at the Agricultural Complex for Advanced Research and Extension Systems, Lamesa, TX, USA in 2018, 2019, and 2020. Differences were not determined in any year at p < 0.05.
3.4. Soil Water Dynamics
3.4.1. Profile Soil Water
Profile soil water followed similar trends in each year of the study where soil water was depleted with cover crops but increased following cover crop termination (Figure 5a–c). In 2018, soil water was generally greater following cover crops (R-NT and M-NT) compared to CT throughout the entire growing season (Figure 5a). Conversely, in 2019 and 2020, profile soil water was greater in CT compared to R-NT and M-NT prior to cover crop termination (Figure 5b,c). Following cover crop termination and throughout the cotton growing season, profile soil water was greatest with R-NT and M-NT compared to CT. There was no difference in profile soil water between R-NT and M-NT at any sampling point during the study. There was little difference in profile soil water between any treatment in 2018. This is likely due to the limited amount of precipitation received from September 2017 [20] to April 2018 (Table 1), which decreased the profile soil water for all treatments. The difference in soil water between CT and R-NT/M-NT was greater in the first 50 days after planting (DAP) in 2019 compared to 2018 and 2020. In 2020, the differences in soil water between CT and R-NT/M-NT were greatest from 50–100 DAP. The differences in profile soil water between treatments decreased from 100–150 DAP in each year of the study.
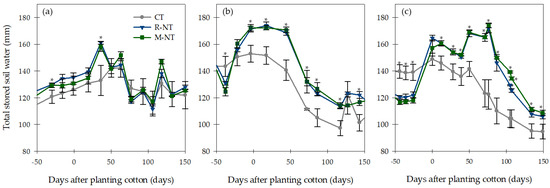
Figure 5.
Total soil water (0 to 140 cm depth) in (a) 2018, (b) 2019, and (c) 2020 at the Agricultural Complex for Advanced Research and Extension Systems, Lamesa, TX, USA. Negative values on the x-axis represent days prior to planting cotton. Bars represent standard error of the sample mean. Stars (*) represent significant differences between treatments at p < 0.05. Conventional tillage winter fallow, no-tillage rye cover, and no-tillage mixed species cover are represented as CT, R-NT, and M-NT, respectively.
Previously, these systems demonstrated four distinct trends in soil water changes [20], and our results support those findings, except in 2018 when there was greater soil water in the R-NT and M-NT systems compared to CT (Figure 5a). Prior to planting cotton at 0 DAP, there was a significant reduction in soil water with cover crops in 2019 and 2020 compared to CT. Cover crops have been reported to decrease soil water prior to termination in semi-arid regions [74,75]. However, following cover crop termination, timely rainfall or irrigation can replenish depleted soil water in conservation systems to a greater degree than conventional practices through greater water capture and storage [20]. Increases in water capture and storage with cover crops is likely the result of a combination of reduced evaporation from shading of the soil surface [76], increased infiltration deeper into the soil profile via fine root channels [22,32,40,77], and increased soil aggregation [78,79,80].
During active cotton growth (0–150 DAP), soil water was not different between treatments in 2018 (Figure 5a) but was significantly greater in R-NT and M-NT compared to CT at most sampling points in 2019 and 2020 (Figure 5b,c). In a former study at the same site from 2015–2017, differences in soil water between treatments were less pronounced than in this evaluation [20]. On average, there was greater precipitation during that evaluation period than in the current study. Cover crops can increase water storage capacity through the mechanisms discussed previously. During periods of episodic drought that are common on the THP, cover crops may help to increase water storage and minimize loss, resulting in increased drought mitigation potential [27]. Further investigations are needed to understand soil water dynamics following cover crop termination in semi-arid climates, especially where deficit irrigation is not possible.
Changes in profile soil water (Δwater) were dynamic throughout the 2018–2020 study period (Figure 6a–c). Overall, Δwater ranged from −2.44 to 2.54 mm day−1, with the greatest decrease observed in M-NT (107 DAP, 2020) and the greatest increase in CT (127 DAP, 2019). In 2018, Δwater ranged from −2.35 (77 DAP, M-NT) to 2.48 (118 DAP, M-NT) mm day−1 (Figure 6a). In 2019, Δwater ranged from −1.38 (72 DAP, M-NT) to 2.54 (127 DAP, CT) mm day−1 (Figure 6b). In 2020, Δwater ranged from −2.44 (107 DAP, M-NT) to 1.76 (76 DAP, M-NT) mm day−1 (Figure 6c). Overall, the variability in Δwater was greatest in the M-NT compared to CT and R-NT. Few differences in Δwater were observed between treatments. In 2019 and 2020, increases in Δwater were significantly greater for both R-NT and M-NT compared to CT immediately prior to 0 DAP. In 2018 and 2020, decreases in Δwater were greatest with M-NT and R-NT between 71 and 77 DAP compared to CT.
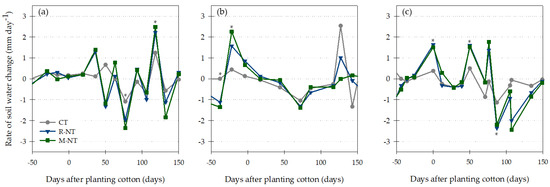
Figure 6.
Changes in soil water in (a) 2018, (b) 2019, and (c) 2020 at the Agricultural Complex for Advanced Research and Extension Systems, Lamesa, TX, USA. Negative values on the x-axis represent days prior to planting cotton. Stars (*) represent significant differences between treatments at p < 0.05. Conventional tillage winter fallow, no-tillage rye cover, and no-tillage mixed species cover are represented as CT, R-NT, and M-NT, respectively.
3.4.2. Soil Water at Depth
Soil water at depth for the evaluated cropping systems from 2018 to 2020 is presented in Figure 7. In 2018, soil water depletion at depth was greater in CT compared to R-NT and M-NT throughout most of the growing season except between ~75 to 150 DAP in the R-NT system, where water was more depleted from 60 to 100 cm below the soil surface compared to CT and M-NT (Figure 7a–c). There was greater soil water available from ~25 to 50 DAP throughout the profile in R-NT and M-NT compared to CT. Soil water dynamics were more pronounced in the top 40 cm of the soil profile, especially in CT. Overall, soil water at depth was greater in 2018 compared to the other growing seasons. In 2019, soil water depletion at depth was greater in CT compared to R-NT and M-NT (Figure 7 d–f). Soil water was reduced in R-NT and M-NT to ~50 and 70 cm below the surface, respectively, prior to planting cotton at −50 to −30 DAP (Figure 7e,f). From −25 to 60 DAP, there was significantly more soil water at depth in R-NT and M-NT compared to CT. Later in the growing season (75–125 DAP), soil water was more depleted at depth in CT compared to R-NT and M-NT. Soil water dynamics at depth followed similar trends in 2020 as they did in 2019 (Figure 7 g–i). From −50 to −20 DAP, soil water was depleted at depth with R-NT and M-NT compared to CT. Following the decrease in soil water at depth, soil water was greater with R-NT and M-NT compared to CT from −10 to 90 DAP. Later in the growing season (100–150 DAP), soil water decreased at depth with all treatments but was greater in CT compared to R-NT and M-NT.
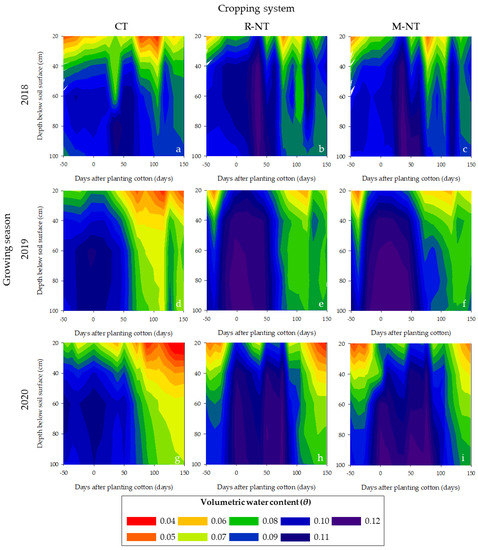
Figure 7.
Volumetric water content (VWC) at depth for each cropping system (columns) based on days after planting cotton in each growing season (rows) in (a–c) 2018, (d–f) 2019, and (g–i) 2020 at the Agricultural Complex for Advanced Research and Extension Systems, Lamesa, TX, USA for 0- to 100 cm below the soil surface. Negative values on the x-axis represent days prior to planting cotton. Conventional tillage winter fallow, no-tillage rye cover, and no-tillage mixed species cover are represented as CT, R-NT, and M-NT, respectively.
On the THP, potential evapotranspiration is generally greater than annual precipitation; thus, minimizing water loss from the soil profile is essential to ensuring agricultural productivity, especially during water stress periods. Greater soil water during the growing season throughout the profile in 2018–2020 could potentially reduce the susceptibility to water stress (Figure 7); however, the increased water did not result in a yield increase compared to CT, indicating that water is not the greatest limiting factor. The use of cover crops can cause difficulties for cash crop production following cover crops, but the increase in ground cover, residue, and photosynthetic energy capture may benefit soil health through increased carbon capture and storage [81]. When winter precipitation is limited on the THP, proper termination timing can help to offset water cost associated with the cover crop [52,53] and allow the systems to recover the maximum amount of water from spring precipitation events [20]. Additional research is needed within this system to determine if the greater soil water content throughout the profile during active cotton growth is plant available and the potential cause of yield decline with the conservation systems. We hypothesize that the general yield decline observed intermittently in these systems in 2016, 2017 [14], and 2020 was caused by N immobilization following cover crop termination [53].
Changes in soil water at depth followed similar patterns in 2018 and 2020 but were not similar in 2019 (Figure 8). In 2018, there was a 23% greater increase in the change in soil water with R-NT and M-NT compared to CT between −30 and −20 DAP to a 50 cm depth (Figure 8a–c). Patterns of positive and negative changes in soil water at depth were similar between all treatments in 2018, although the degree of change was greater in R-NT and M-NT than CT from 30 to 150 DAP. The greatest positive and negative changes in soil water occurred approximately 90 cm below the soil surface in the M-NT system at 77 (−0.52 mm day−1) and 118 (+0.39 mm day−1) DAP. From −50 to −10 DAP in 2019, positive increases in change in soil water from 20 to 30 cm below the soil surface were similar for all the treatments, averaging 127% increases in soil water prior to cotton planting. However, from −30 to −10 DAP, negative changes in soil water from 30 to 60 cm were 18% greater in R-NT and M-NT compared to CT. Deeper in the profile, positive changes in soil water were 21% greater at depth in R-NT and M-NT compared to CT at decreasing depth (90 to 20 cm below the soil surface) from −50 to 25 DAP. A similar trend occurred in CT (22% increase) from 50 to 125 DAP that was not observed to the same degree in R-NT and M-NT. In 2020, greater changes in soil water at depth were observed overall in R-NT and M-NT compared to CT (Figure 8g–i). From −30 to 0 DAP, 12% increases in soil water were observed throughout the profile of R-NT and M-NT than CT. The pattern continued at 45 to 50 (8%) and 90 to 105 (10%) DAP. At approximately 100 DAP, R-NT and M-NT had 16% negative changes in soil water from 75 to 100 cm and 90 to 100 cm, respectively. From 120 to 150 DAP, 32 and 24% decreases in soil water occurred in R-NT and M-NT from 20 to 65 and 20 to 90 cm below the soil surface, respectively, compared to CT.
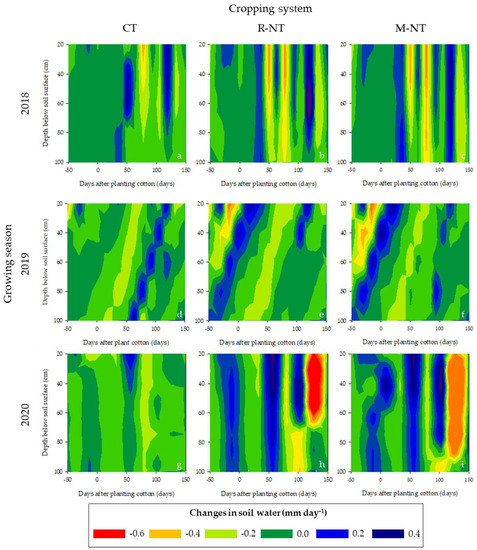
Figure 8.
Changes in soil water depth for each cropping system (columns) based on days after planting cotton in (a–c) 2018, (d–f) 2019, and (g–i) 2020 at the Agricultural Complex for Advanced Research and Extension Systems, Lamesa, TX, USA for 0 to 100 cm below the soil surface. Negative values on the x-axis represent days prior to planting cotton. Conventional tillage winter fallow, no-tillage rye cover, and no-tillage mixed species cover are represented as CT, R-NT, and M-NT, respectively.
Results from this study demonstrate that soil water increases were greater at depth with the conservation systems (R-NT and M-NT) compared to the CT system (Figure 8). This suggests precipitation and irrigation interception and storage were greater following cover crops. While there were no significant differences in BD at any depth, the increase in BD at the 30–60 cm depth might indicate there was a potential plow pan within that depth (Table 2). Other evaluations at the site showed a significant increase in penetration resistance and BD at depth in CT compared to R-NT [32]. The wetting barrier appeared to be at 75 and 45 cm in 2018 and 2020, respectively, for the CT system, while there did not appear to be a wetting barrier in the R-NT and M-NT systems in any year (Figure 8). Depletion of soil water throughout the profile in 2018 and 2020 was greater with the R-NT and M-NT systems compared to CT. Cotton rooting may have been more expansive through the profile in the conservation systems compared to CT because the roots utilized the preexisting root channels made by the cover crops [49,50], which allowed them to utilize additional soil water compared to traditionally cultivated cotton [38].
4. Conclusions
In semi-arid regions, water is often the primary limiting factor for agricultural production. Yield loss can be minimized with irrigation from surface and groundwater sources; however, on the THP where irrigation quality and quantity from the Ogallala Aquifer is declining, producers need alternatives to protect the valuable precipitation they receive. Compounding the problem in this region is wind erosion, which can be limited with the use of cover crops and reduced tillage. This study evaluated water usage following cover crop termination and throughout the cotton growing season. Our results challenge the supposition that cover crops limit water availability during active cotton growth. While the cover crops do limit moisture immediately prior to cotton planting, they increase water interception and storage compared to traditional practices. Overall, there was not a significant reduction in cotton lint yield with the adoption of conservation management practices compared to traditional practices. The findings of this study are among the few demonstrating the benefit in water dynamics of cover crops in coarse soils in semi-arid regions. The opportunity to utilize deficit irrigation to ensure cotton stand establishment is essential to minimize the risk associated with cover crop adoption in this area. The need for additional research on soil water dynamics following cover crops in dryland systems is essential to ensuring their successful adoption on the THP. With the very real potential for more limited water availability from the Ogallala Aquifer in the future, it is essential that any agronomic practices to reduce soil water loss be adopted for continued agricultural production in the region.
Author Contributions
Conceptualization, J.W.K., P.B.D. and K.L.L.; methodology, J.W.K., P.B.D. and K.L.L.; formal analysis, J.A.B., K.L.L. and J.W.K.; investigation, J.A.B., C.J.C. and K.L.L.; resources, K.L.L. and J.W.K.; data curation, J.A.B., K.L.L., C.J.C. and J.W.K.; writing—original draft preparation, J.A.B. and K.L.L.; writing—review and editing, J.A.B., K.L.L., P.B.D., C.J.C. and J.W.K.; visualization, J.A.B., K.L.L. and C.J.C.; supervision, K.L.L. and J.W.K.; project administration, K.L.L.; funding acquisition, J.W.K., P.B.D. and K.L.L. All authors have read and agreed to the published version of the manuscript.
Funding
This research was supported by the Texas State Support Committee of Cotton Incorporated (award #16-400-TX). J.A.B. graduate support provided by Texas A&M AgriLife Research through the Strategic Initiative Assistantship in Water and Soil Health (TX-2018).
Data Availability Statement
Not applicable.
Acknowledgments
We thank Dustin Kelley, C.D. Ray White, and Cecil Haralson of Texas A&M AgriLife Research for farm management and technical assistance. The Agricultural Complex for Advanced Research and Extension Systems in Lamesa, TX, USA is a collaborative site between Texas A&M AgriLife Research and Extension Center at Lubbock and the Lamesa Cotton Growers Association. We appreciate their ongoing support.
Conflicts of Interest
The authors declare no conflict of interest. The funders had no role in the design of the study; in the collection, analyses, or interpretation of data; in the writing of the manuscript, or in the decision to publish the results.
References
- Zobeck, T.M.; Van Pelt, R.S. Wind erosion. In Soil Management: Building a Stable Base for Agriculture; Hartfield, J.L., Sauer, T.J., Eds.; SSSA: Madison, WI, USA, 2012; pp. 209–227. [Google Scholar]
- Young, C.E.; Osborn, C.T. Cost and benefits of the Conservation Reserve Program. J. Soil Water Conserv. 1990, 45, 370–373. [Google Scholar]
- Cano, A.; Nunez, A.; Acosta-Martinez, V.; Schipanski, M.; Ghimire, R.; Rice, C.; West, C. Current knowledge and future research directions to link soil health and water conservation in the Ogallala Aquifer region. Geoderma 2018, 328, 109–118. [Google Scholar] [CrossRef]
- Kelley, M.C.; Ardon-Dryer, K. Analyzing two decades of dust events on the Southern Great Plains region of West Texas. Atmos. Pollut. Res. 2021, 12, 101091. [Google Scholar] [CrossRef]
- Prokopy, L.S.; Florees, K.; Arbuckle, J.G.; Church, S.P.; Eanes, F.R.; Gao, Y.; Gramig, B.M.; Ranjan, P.; Singh, A.S. Adoption of conservation practices in the United States: Evidence from 35 years of quantitative literature. J. Soil Water Conserv. 2019, 74, 520–534. [Google Scholar] [CrossRef] [Green Version]
- Claassen, R.; Bowman, M.; McFadden, J.; Smith, D.; Wallander, S. Tillage Intensity and Conservation Cropping in the United States; United States Department of Agriculture, Economic Research Service: Washington, DC, USA, 2018.
- USDA-ERS. Cotton and Wool Yearbook: 2018. Available online: https://www.ers.usda.gov/data-products/cotton-wool-and-textile-data/cotton-and-wool-yearbook/ (accessed on 18 November 2021).
- USDA-NASS. 2018 State Agriculture Overview: Texas. Available online: https://www.nass.usda.gov/Quick_Stats/Ag_Overview/stateOverview.php?state=TEXAS (accessed on 18 November 2021).
- Evett, S.R.; Colaizzi, P.D.; Lamm, F.R.; O’Shaughnessy, S.A.; Heeren, D.M.; Trout, T.J.; Kranz, W.L.; Lin, X. Past, present, and future of irrigation on the U.S. Great Plains. Trans. ASABE 2020, 63, 703–729. [Google Scholar] [CrossRef]
- Wanjura, D.F.; Upchurch, D.R.; Mahan, J.R.; Burke, J.J. Cotton yield and applied water relationships under drip irrigation. Agric. Water Manag. 2002, 55, 217–237. [Google Scholar] [CrossRef]
- Bordobsky, J.P.; Mustain, J.T.; Ritchie, G.L.; Lewis, K.L. Cotton irrigation timing with variable seasonal irrigation capacities on the Texas South Plains. Appl. Eng. Agric. 2015, 31, 883–897. [Google Scholar]
- Simao, F.; Ritchie, G.; Bednarz, C. Cotton physiological parameters affected by episodic irrigation interruption. J. Agric. Sci. Tech. 2013, 3, 443–454. [Google Scholar]
- Snowden, M.; Ritchie, G.; Simao, F.; Bordovsky, J. Timing of episodic drought can be critical in cotton. Agron. J. 2014, 106, 452–458. [Google Scholar] [CrossRef]
- Lewis, K.L.; Burke, J.A.; Keeling, W.S.; McCallister, D.M.; DeLaune, P.B.; Keeling, J.W. Soil benefits and yield limitations of cover crop use in Texas High Plains cotton. Agron. J. 2018, 110, 1616–1623. [Google Scholar] [CrossRef]
- Fultz, L.M.; Moore-Kucera, J.; Zobeck, T.M.; Acosta-Martinez, V.; Allen, V.G. Aggregate carbon pools after 13 years of integrated crop-livestock management in semi-arid soils. Soil Sci. Soc. Am. J. 2013, 77, 1659–1666. [Google Scholar] [CrossRef]
- Fultz, L.M.; Moore-Kucera, J.; Zobeck, T.M.; Acosta-Martinez, V.; Webster, D.B.; Allen, V.G. Organic carbon dynamics and soil stability in five semiarid agroecosystems. Agric. Ecosyst. Environ. 2013, 181, 231–240. [Google Scholar] [CrossRef] [Green Version]
- Acosta-Martinez, V.; Cotton, J. Lasting effects of soil health improvements with management changes in cotton-based cropping systems in a sandy soil. Biol. Fertil. Soils 2017, 53, 533–546. [Google Scholar] [CrossRef]
- Burke, J.A.; Lewis, K.L.; Ritchie, G.L.; Moore-Kucera, J.; DeLaune, P.B.; Keeling, J.W. Temporal variability of soil carbon and nitrogen in cotton production on the Texas High Plains. Agron. J. 2019, 111, 2218–2225. [Google Scholar] [CrossRef]
- Colazo, J.C.; Buschiazzo, D.E. Soil dry aggregate stability and wind erodible fraction in a semiarid environment of Argentina. Geoderma 2010, 159, 228–236. [Google Scholar] [CrossRef]
- Burke, J.A.; Lewis, K.L.; Ritchie, G.L.; DeLaune, P.B.; Keeling, J.W.; Acosta-Martinez, V.; Moore, J.M.; McLendon, T. Net positive soil water content following cover crops with no tillage in irrigated semi-arid cotton production. Soil Till. Res. 2021, 208, 104869. [Google Scholar] [CrossRef]
- Blanco-Canqui, H.; Mikha, M.M.; Pressley, D.R.; Claassen, M.M. Addition of cover crops enhances no-till potential for improving soil physical properties. Soil Sci. Soc. Am. J. 2011, 75, 1471–1482. [Google Scholar] [CrossRef]
- Dabney, S.M.; Delgado, J.A.; Reeves, D.W. Using winter cover crops to improve soil and water quality. Commun. Soil Sci. Plant. Anal. 2001, 32, 1221–1250. [Google Scholar] [CrossRef]
- Balkcom, K.; Schomberg, H.; Reeves, W.; Clark, A.; Baumhardt, L.; Collins, H.; Delgado, J.; Duiker, S.; Kaspar, T.; Mitchell, J. Managing cover crops in conservation tillage systems. In Managing Cover Crops Profitably, 3rd ed.; Beltsville, A.C., Ed.; United Book Press, Inc.: Baltimore, MD, USA, 2007; pp. 44–61. [Google Scholar]
- Nielsen, D.C.; Lyon, D.J.; Higgins, R.K.; Hergert, G.W.; Holman, J.D.; Vigil, M.F. Cover crop effect on subsequent wheat yield in the Central Great Plains. Agron. J. 2016, 108, 243–256. [Google Scholar] [CrossRef] [Green Version]
- Holman, J.D.; Arnet, K.; Dille, J.; Maxwell, S.; Obour, A.; Roberts, T.; Roozeboom, K.; Schlegel, A. Can cover or forage crops replace fallow in the semiarid Central Great Plains. Crop. Sci. 2018, 58, 932–944. [Google Scholar] [CrossRef] [Green Version]
- Baughman, T.; Keeling, W.; Boman, R. On-farm selected soil properties. Comm. Soil Sci. Plant. Anal. 2007, 25, 3087–3100. [Google Scholar]
- Baumhardt, R.L.; Schwartz, R.; Howell, T.; Evett, S.R.; Colaizzi, P. Residue management effects on water use and yield of deficit irrigated cotton. Agron. J. 2013, 105, 1026–1034. [Google Scholar] [CrossRef]
- DeLaune, P.B.; Mubvumba, P.; Ale, S.; Kimura, E. Impact of no-till, cover crop, and irrigation on cotton yield. Agric. Water Manage. 2020, 232, 106038. [Google Scholar] [CrossRef]
- Keeling, J.W.; Segarra, E.; Abernathy, J.R. Evaluation of conservation tillage cropping systems for cotton on the Texas Southern High Plains. J. Prod. Agric. 1989, 4, 566–571. [Google Scholar] [CrossRef]
- Keeling, J.W.; Matches, A.G.; Brown, C.P.; Karnezos, T.P. Comparison of interseeded legumes and small grains for cover crop establishment in cotton. Agron. J. 1996, 88, 219–222. [Google Scholar] [CrossRef]
- USDA-NRCS. Amarillo Soil Series. Available online: https://soilseries.sc.egov.usda.gov/OSD_Docs/A/AMARILLO.html (accessed on 21 February 2022).
- DeLaune, P.B.; Mubvumba, P.; Lewis, K.L.; Keeling, J.W. Rye cover crop impacts soil properties in a long-term cotton system. Soil Sci. Soc. Am. J. 2019, 83, 1451–1458. [Google Scholar] [CrossRef]
- McGeehan, S.L.; Naylor, D.V. Automated instrumental analysis of carbon and nitrogen in plant and soil samples. Commun. Soil Sci. Plant. Anal. 1988, 19, 493–505. [Google Scholar] [CrossRef]
- Mehlich, A. Mehlich-III soil test extractant: A modification of Mehlich-II extractant. Commun. Soil Sci. Plant. Anal. 1984, 15, 1409–1416. [Google Scholar] [CrossRef]
- Rhoades, J.D. Soluble salts. In Methods of Soil Analysis. Part 2, 2nd ed.; Page, A.L., Miller, R.H., Keeney, D.R., Eds.; ASA and SSSA: Madison, WI, USA, 1982; pp. 167–178. [Google Scholar]
- Schofield, R.K.; Taylor, A.W. The measurement of soil pH. Soil Sci. Soc. Am. Pro. 1955, 19, 164–167. [Google Scholar] [CrossRef]
- Blake, G.R.; Hartge, K.H. Bulk Density. In Methods of Soil Analysis. Part 1. Physical and Mineralogical Methods, 2nd ed.; Klute, A., Ed.; ASA & SSSA: Madison, WI, USA, 1986; pp. 363–375. [Google Scholar]
- Pabuayon, I.L.; Singh, S.; Lewis, K.L.; Ritchie, G.L. Water extraction and productivity of cotton, sorghum, and sesame under deficit irrigation. Crop. Sci. 2019, 59, 1692–1700. [Google Scholar] [CrossRef]
- Roth, G.; Harris, G.; Gillies, M.; Montgomery, J.; Wigginton, D. Water-use efficiency and productivity trends in Australian irrigated cotton: A review. Crop. Pasture Sci. 2013, 64, 1033–1048. [Google Scholar] [CrossRef] [Green Version]
- DeLaune, P.B.; Mubvumba, P. Winter cover crop production and water use in Southern Great Plains cotton. Agron. J. 2020, 112, 1943–1951. [Google Scholar] [CrossRef]
- Grimes, D.W.; Yamada, H. Relation of cotton growth and yield to minimum leaf water potential. Crop. Sci. 1982, 22, 134–139. [Google Scholar] [CrossRef]
- Ward, D.; Kirkman, K.; Hagenah, N.; Tsvuura, Z. Soil respiration declines with increasing nitrogen fertilization and is not related to productivity in long-term grassland experiments. Soil Biol. Biochem. 2017, 115, 415–422. [Google Scholar] [CrossRef]
- Thomas, G.A.; Dalal, R.C.; Standley, J. No-till effects on organic matter, pH, cation exchange capacity and nutrient distribution in a Luvisol in the semi-arid subtropics. Soil Till. Res. 2007, 94, 295–304. [Google Scholar] [CrossRef]
- Lopez-Fando, C.; Pardo, M.T. Changes in soil chemical characteristics with different tillage practices in a semi-arid environment. Soil Till. Res. 2009, 104, 278–284. [Google Scholar] [CrossRef]
- Gabriel, J.L.; Almendros, P.; Hontoria, C.; Quemada, M. The role of cover crops in irrigated systems: Soil salinity and salt leaching. Agric. Ecosyst. Environ. 2012, 158, 200–207. [Google Scholar] [CrossRef] [Green Version]
- Howard, T.; Gardner, H.R. Penetration of cotton seedling taproots as influenced by bulk density, moisture content, and strength of soil. Soil Sci. 1963, 96, 153–156. [Google Scholar]
- Blanco-Canqui, H.; Weinhold, B.J.; Jin, V.L.; Schmer, M.R.; Kibet, L.C. Long-term tillage impact on soil hydraulic properties. Soil Till. 2017, 170, 38–42. [Google Scholar] [CrossRef] [Green Version]
- Blanco-Canqui, H.; Ruis, S.J. No-tillage and soil physical environment. Geoderma 2018, 326, 164–200. [Google Scholar] [CrossRef]
- Meek, B.D.; Rechel, E.R.; Carter, L.M.; DeTar, W.E.; Urie, A.L. Infiltration rate of a sandy loam soil: Effects of traffic, tillage, and plant roots. Soil Sci. Soc. Am. J. 1992, 56, 908–913. [Google Scholar] [CrossRef]
- Mitchell, A.R.; Ellsworth, T.R.; Meek, B.D. Effect of root systems on preferential flow in swelling ground. Commun. Soil Sci. Plant. Anal. 1995, 26, 2655–2666. [Google Scholar] [CrossRef]
- Schipanski, M.E.; Barbercheck, M.; Douglas, M.R.; Finney, D.M.; Haider, K.; Kaye, J.P.; Kemanian, A.R.; Mortensen, D.A.; Ryan, M.R.; Tooker, J.; et al. A framework for evaluating ecosystem services provided by cover crops in agroecosystems. Agric. Syst. 2014, 125, 12–22. [Google Scholar] [CrossRef]
- Bronson, K.F.; Onken, A.B.; Keeling, J.W.; Booker, J.D.; Torbert, H.A. Nitrogen response in cotton as affected by tillage system and irrigation level. Soil Sci. Soc. Am. J. 2001, 65, 1153–1163. [Google Scholar] [CrossRef]
- White, C.D.R.; Lewis, K.L.; Keeling, J.W. Cover crop management in Texas High Plains cotton. In Proceedings of the Beltwide Cotton Conferences, Austin, TX, USA, 8–10 January 2020. [Google Scholar]
- Acharya, R.N.; Ghimire, R.; Apar, G.C.; Blayney, D. Effect of cover crop on farm profitability and risk in the Southern High Plains. Sustainability 2019, 11, 7119. [Google Scholar] [CrossRef] [Green Version]
- Wagger, M.G. Time of desiccation effects on plant composition and subsequent nitrogen release from several winter annual cover crops. Agron. J. 1989, 81, 236–241. [Google Scholar] [CrossRef]
- Richardson, A.E.; Lynch, J.P.; Ryan, P.R.; Delhaize, E.; Smith, F.A.; Smith, S.E.; Harvey, P.R.; Ryan, M.H.; Veneklaas, E.J.; Lambers, H.; et al. Plant and microbial strategies to improve phosphorus efficiency of agriculture. Plant Soil 2011, 349, 121–156. [Google Scholar] [CrossRef]
- Pypers, P.; Huybrighs, M.; Diels, J.; Abaidoo, R.; Smolders, E.; Merckx, R. Does the enhanced P acquisition by maize following legumes in a rotation result from improve soil P availability? Soil Biol. Biochem. 2007, 10, 2555–2566. [Google Scholar] [CrossRef]
- Nuruzzaman, M.; Lambers, H.; Bolland, M.D.A.; Beneklaas, E.J. Distribution of carboxylates and acid phosphatase and depletion of different phosphorus fractions in the rhizosphere of a cereal and three grain legumes. Plant Soil 2006, 281, 109–120. [Google Scholar] [CrossRef]
- Jorquera, M.A.; Hernandez, M.T.; Rengel, Z.; Marschner, P.; de la Luz Mora, M. Isolation of culturable phosphobacteria with both phytate-mineralization and phosphate-stabilization activity from the rhizosphere of plants grown in a volcanic soil. Biol. Fert. Soil 2008, 44, 1025. [Google Scholar] [CrossRef]
- Bordovsky, J.P.; Lyle, W.M.; Keeling, J.W. Crop rotation and tillage effects on soil water and cotton yield. Agron. J. 1994, 86, 1–6. [Google Scholar] [CrossRef]
- Nyakatawa, E.Z.; Reddy, K.C. Tillage, cover cropping, and poultry litter effects on cotton: I. Germination and seedling growth. Agron. J. 2000, 92, 992–999. [Google Scholar] [CrossRef]
- Boquet, D.J.; Hutchinson, R.L.; Breitenbeck, G.A. Long-term tillage, cover crop, and nitrogen rate effects on cotton: Yield and fiber properties. Agron. J. 2004, 96, 1436–1442. [Google Scholar] [CrossRef]
- Hanks, J.; Martin, S.W. Economic analysis of cotton conservation tillage practices in the Mississippi Delta. J. Cotton Sci. 2007, 11, 75–78. [Google Scholar]
- Cao, Y.; He, Z.; Zhu, T.; Zhao, F. Organic-C quality as a key driver of microbial nitrogen immobilization in soil: A meta-analysis. Geoderma 2021, 383, 114784. [Google Scholar] [CrossRef]
- Sinha, E.; Calvin, K.V.; Kyle, P.G.; Hejazi, M.I.; Waldhoff, S.T.; Huang, M.; Vishwakarma, S.; Zhang, X. Implication of imposing fertilizer limitations on energy, agriculture, and land systems. J. Environ. Manage. 2022, 305, 114391. [Google Scholar] [CrossRef]
- Otte, B.; Mirsky, S.; Schomberg, H.; Davis, B.; Tully, K. Effect of cover crop termination timing on pools and fluxes of inorganic nitrogen in no-till corn. Agron. J. 2019, 111, 2832–2842. [Google Scholar] [CrossRef]
- Alonso-Ayuso, M.; Gabriel, J.L.; Hontoria, C.; Ibanez, M.A.; Quemada, M. The cover crop termination choice to designing sustainable cropping systems. Eur. J. Agron. 2020, 114, 126000. [Google Scholar] [CrossRef]
- Tennakoon, S.B.; Hulugalle, N.R. Impact of crop rotation and minimum tillage on water use efficiency of irrigated cotton in a Vertisol. Irrig. Sci. 2006, 25, 45–52. [Google Scholar] [CrossRef]
- Krueger, E.S.; Ochsner, T.E.; Porter, P.M.; Baker, J.M. Winter rye cover crop management influences on soil water, soil nitrate, and corn development. Agron. J. 2011, 103, 316–323. [Google Scholar] [CrossRef]
- Nielsen, D.C.; Lyon, D.J.; Hergert, G.W.; Higgins, R.K.; Holman, J.D. Cover crop biomass production and water use in the Central Great Plains. Agron. J. 2015, 107, 2047–2058. [Google Scholar] [CrossRef]
- Unger, P.W.; Vigil, M.F. Cover crop effects on soil water relationships. J. Soil Water Conserv. 1998, 53, 2000–2007. [Google Scholar]
- Alfonso, C.; Barieri, P.A.; Hernandez, M.D.; Lewczuk, N.A.; Martinez, J.P.; Echarte, M.M.; Echarte, L. Water productivity in soybeans following a cover crop in a humid environment. Agric. Water Manage. 2020, 232, 106045. [Google Scholar] [CrossRef]
- Villalobos, F.J.; Fereres, E. Evaporation measurement beneath corn, cotton, and sunflower canopies. Agron. J. 1990, 82, 1153–1159. [Google Scholar] [CrossRef]
- Wagner-Riddle, C.; Gillespie, T.J.; Hunt, L.A.; Swanton, C.J. Modeling a rye cover crop and subsequent soybean yield. Agron. J. 1997, 89, 208–218. [Google Scholar] [CrossRef]
- Moebius-Clune, B.A.; van Es, H.M.; Idowu, O.J.; Schindelbeck, R.R.; Moebius-Clune, D.J.; Wolfe, D.W.; Abawi, G.S.; Thies, J.E.; Gugino, B.K.; Lucey, R. Long-term effects of harvesting maize stover and tillage on soil quality. Soil Sci. Soc. Am. J. 2008, 72, 960–969. [Google Scholar] [CrossRef]
- Mulumba, L.N.; Lal, R. Mulching effects on selected soil physical properties. Soil Tillage Res. 2008, 98, 106–111. [Google Scholar] [CrossRef]
- So, H.B.; Grabski, A.; Desborough, P. The impact of 14 years of conventional and no till cultivation on the physical properties and crop yields of a loam soil at Grafton NSW, Australia. Soil Tillage Res. 2009, 104, 180–184. [Google Scholar] [CrossRef] [Green Version]
- Mitchell, J.P.; Shrestha, A.; Irmak, S. Trade-offs between winter cover crop production and soil water depletion in the San Joaquin Valley, California. J. Soil Water Conserv. 2015, 70, 430–440. [Google Scholar] [CrossRef] [Green Version]
- Mirsky, S.B.; Curran, W.S.; Mortensen, D.A.; Ryan, M.R.; Shumway, D.L. Timing of cover crop management effects on weed suppression in no-till planted soybeans using a roller-crimper. Weed Sci. 2011, 66, 55–61. [Google Scholar] [CrossRef]
- Keene, C.L.; Curran, W.S.; Wallace, J.M.; Ryan, M.R.; Mirsky, S.B.; VanGessel, M.J.; Barbercheck, M.E. Cover crop termination timing is critical in organic rotational no-till systems. Agron. J. 2017, 109, 272–282. [Google Scholar] [CrossRef]
- Burke, J.A.; Lewis, K.L.; Foster, J.L. Nitrogen dynamics following cover crops in Texas High Plains cotton. In Proceedings of the Beltwide Cotton Conferences, Virtual, 5–7 January 2021. [Google Scholar]
Publisher’s Note: MDPI stays neutral with regard to jurisdictional claims in published maps and institutional affiliations. |
© 2022 by the authors. Licensee MDPI, Basel, Switzerland. This article is an open access article distributed under the terms and conditions of the Creative Commons Attribution (CC BY) license (https://creativecommons.org/licenses/by/4.0/).