Article

Adaptation of the SIMPLE Model to Oilseed Flax (Linum usitatissimum L.) for Arid and Semi-Arid Environments

1
College of Information Science and Technology, Gansu Agricultural University, Lanzhou 730070, China
2
Agricultural and Biological Engineering Department, University of Florida, Gainesville, FL 32611, USA
3
Food Systems Institute, University of Florida, Gainesville, FL 32611, USA
4
TUM School of Life Sciences, Technical University of Munich, 85354 Freising, Germany
5
College of Agronomy, Gansu Agricultural University, Lanzhou 730070, China
6
Network Information Center, Lanzhou Jiaotong University, Lanzhou 730070, China
*
Author to whom correspondence should be addressed.
Agronomy 2022, 12(6), 1267; https://doi.org/10.3390/agronomy12061267
Submission received: 26 April 2022 / Revised: 19 May 2022 / Accepted: 23 May 2022 / Published: 25 May 2022

Abstract

:
Oilseed flax (Linum usitatissimum L.) is an important oil crop, and the SIMPLE model is a very effective tool to simulate crop production. In this study, to adapt the SIMPLE model for the overall improvement of flax production and yield, three promising cultivars of North China—Longya Hybrid No. 1, Baxuan No. 3 and Zhangya No. 2—were selected. Experiments were conducted in Dingxi, Wulanchabu, Datong and Zhangjiakou in Northern China from 2016 to 2020. The SIMPLE model was first calibrated and then evaluated for the simulation of flax growth and development and grain yield and biomass. A base temperature of 5 °C was used for phenology, with optimum temperatures from 16 to 20 °C for the third pair of true leaves to unfolded to the budding stage, and from 20 to 25 °C for the flowering stage. In the results, the average simulated value of aboveground biomass in Dingxi was 8772 kg ha−1, with a root mean square error (RMSE) of 1239 kg ha−1 (d-index = 0.69). The simulations were also good in the other three sites according to a comparison of the predicted and observed biomasses (RMSE 135 kg ha−1 and d-index 0.90 at Zhangjiakou, RMSE 280 kg ha−1 and d-index 0.95 at Wulanchabu, and RMSE 140 kg ha−1 and d-index 0.97 at Datong). Flax grain yield was well simulated compared with the observed values, with a RMSE of 55 kg ha−1 and a d-index of 0.96 for Dingxi, a RMSE of 63 kg ha−1 and a d-index of 0.93 for Wulanchabu, and a RMSE of 5 kg ha−1 and a d-index of 0.97 for Zhangjiakou, whereas the yield was somewhat underestimated for Datong (RMSE of 176 kg ha−1 and d-index of 0.91). Overall, the SIMPLE model provided satisfactory predictions under different environments and management. Care should be taken when transferring the SIMPLE-Flax model to other environments, as vernalization and day-length sensitivity are not included in this model.

1. Introduction

Flax (Linum usitatissimum L.) is an annual flowering plant in the family Linaceae, which has been grown worldwide in various climates. There are two main types: oilseed flax and fiber flax [1]. Oilseed flax, also known as flaxseed, is one of the largest oil crops in the world beside rape, peanut, and soybean. Flaxseeds are rich in multiple functional nutrients beneficial to human health, including ω-3 fatty acids, vitamin E, dietary fibers and lignans, etc. [2,3]. With its wide use as a functional food and other applications [4], its demand and economic value are increasing. However, the grain yield of oilseed flax is lower than that of other oil crops [5]. Flax shows more suitability for planting in cold climate areas, with the largest cultivation areas in North America, Russia, North Europe, Kazakhstan, and China in Asia [6]. In China, it is mainly planted in Northwest and Northeast China because of the rich lighting conditions and vast land resources, most of which belong to arid, semi-arid, and alpine areas. Specifically, it is mainly cultivated in Gansu, Inner Mongolia, Shanxi, Ningxia, Hebei, Xinjiang, and so on [2,7]. In order to further improve the yield of oilseed flax in these areas, it is necessary to implement precision agriculture management.
The development and application of crop simulation models have provided powerful tools for supporting precision agriculture and optimizing management. Crop modeling is an effective supplementary method to field experimentation; numerical simulations can be used to evaluate an unlimited number of management practices in different environments. For flax simulation modeling, it is recommended to use canola or rape models as templates due to the similarity between the growth habits of flax and rape. The existing canola/rape model parameters were used in the development of the flax model [8,9,10]. Kiniry et al. [11] constructed the rape simulation model EPR95 based on the Environmental Policy Integrated Climate (EPIC) model. The LINTUL-BRASNAP model developed by Habekotté [12] can simulate the growth and development of rapeseed, but only under optimal conditions. Gabrielle et al. [13] established the CERES-Rape model based on CERES (Crop Environment Resource Synthesis). Robertson et al. [14,15] established the APSIM-Canola model. Deligios et al. [16] developed a rapeseed growth model (CSM-CROPGRO) based on the Decision Support System for Agrotechnology Transfer (DSSAT) crop system model. Gilardelli et al. [17] established the WOFOST-GTC model based on the WOFOST (World Food Studies) model to simulate the aboveground biomass of rapeseed to calculate the photosynthetic area index at different canopy depths. Others, including Liu et al. [18] and Cao et al. [19] established a dynamic simulation model of rapeseed development based on the CERES-Wheat vernalization model. Liu et al. [20] and Tang et al. [21] established a growth and development mechanism model of rapeseed. Other models, such as the PROSAIL model for rapeseed and investigating climate change, have also been developed [22,23,24].
So far, great efforts have been made to develop a good canola/rape model. Most rapeseed or canola models are based on physiological and ecological processes and can simulate the growth and development dynamics of rapeseed, the accumulation and distribution of photosynthetic substances in organs, and the formation of yield with fairly high detail. However, the accurate simulation of the above models requires the definition of many parameters. The number of parameters that are needed to simulate new crop for the APSIM model is 39. For the AquaCrop model this number is 29, and for WOFOST it is 97, based on which Gilardelli reduced the number of model parameters to 35 [17]. A considerable number of parameters are usually not easily obtained, which directly affects the accuracy of model simulation.
Until now, only a few flax models have been developed. Li et al. [25,26,27,28,29] described, in detail, the simulation of flax in relation to phenological development, leaf area growth, and yield formation based on the Agricultural Production Systems Simulator (APSIM) model [25,26,27,28]. The SIMPLE crop model is a very effective tool to simulate crop production for different environmental conditions and management practices. One of its main advantages is that it only needs a small number of parameters to define a new crop. The current version of the model requires only 14 parameters for the development of a new crop model, as well as for model calibration and the evaluation of the model [30]. Zhao et al. [30] demonstrated that SIMPLE had a good performance for the simulation of 14 crops for 17 test sites. Moreover, the SIMPLE model can not only accurately simulate popular major crops, such as wheat, corn and rice [31], but it has performed well in the simulation of oil and fiber crops, vegetables, fruits, and other crops.
This study aims to adopt the SIMPLE model to predict flax yield and biomass. Four representative sites of arid and semi-arid environments for planting flax—Dingxi, Zhangjiakou, Wulanchabu and Datong—were selected, and the three most promising cultivars of oilseed flax for the area—Longya Hybrid No. 1, Baxuan No. 3 and Zhangya No. 2—were used to assess the adaptability of the SIMPLE model to flax growth. As flax is an annual plant, the experimental data from 2017 were used for calibration and the data from 2018 were used for the evaluation of the SIMPLE model for Dingxi and Zhangjiakou locations, while the experimental data from 2016 were used for calibration and the data from 2017 were used for evaluation for the Datong and Wulanchabu locations. Moreover, the comparative analyses under several irrigation schemes and at different sowing dates were used to identify appropriate production measures for arid and semi-arid areas. It is expected that the application of the SIMPLE model for flax will be developed and its application extended to a wider range of environmental conditions and production management measures.

2. Materials and Methods

2.1. Experimental Sites

Field experiments were carried out in four sites including Dingxi (Gansu province), Zhangjiakou (Hebei province), Wulanchabu (Inner Mongolia) and Datong (Shanxi province) in China. The most promising cultivars of oilseed flax for the arid and semi-arid environments of North China, Longya Hybrid No. 1, Baxuan No. 3 and Zhangya No. 2 were selected as the materials. The detailed features of the sites and climatic conditions are shown in Table 1.
The Dingxi site used 0.2 m row spacing and a 0.03 m sowing depth, with a plant density of 7.5 × 10⁶ plants ha−1. Fertilization was set to 150 kg ha−1 N, 75 kg ha−1 of P2O5 and 35 kg ha−1 of K2O. Nitrogen was applied as urea (46% N), with 66.7% at planting and 33.3% before budding.
For the Zhangjiakou site, the row spacing was 0.2 m and the sowing depth was 0.03 m; a plant density of 10.5 × 10⁶ plants ha−1 was used. Fertilization was set to 150 kg ha−1 N, 75 kg ha−1 of P2O5 and 45.5 kg ha−1 of K2O. Nitrogen was applied as at the Dingxi site. Artificial weeding was performed two times during the period of fertility, and the field was irrigated on 14 July.
For the Wulanchabu site, the row spacing was 0.2 m and the sowing depth was 0.03 m, with a plant density of 9 × 10⁶ plants ha−1. Fertilization was applied as a base fertilizer and set to 75 kg ha−1 N, 150 kg ha−1 of P2O5 and 37.5 kg ha−1 of K2O. The amount of irrigation was 3.3 × 102 mm, with 22.7% at stemming, 27.2% at budding, 27.2% at flowering and 22.7% at the green fruit stage.
For the Datong site, the row spacing was 0.2 m and the sowing depth was 0.03 m, with a plant density of 7.5 × 10⁶ plants ha−1. “Dad loves me” bio-organic fertilizer was used at 150 kg ha−1 N.
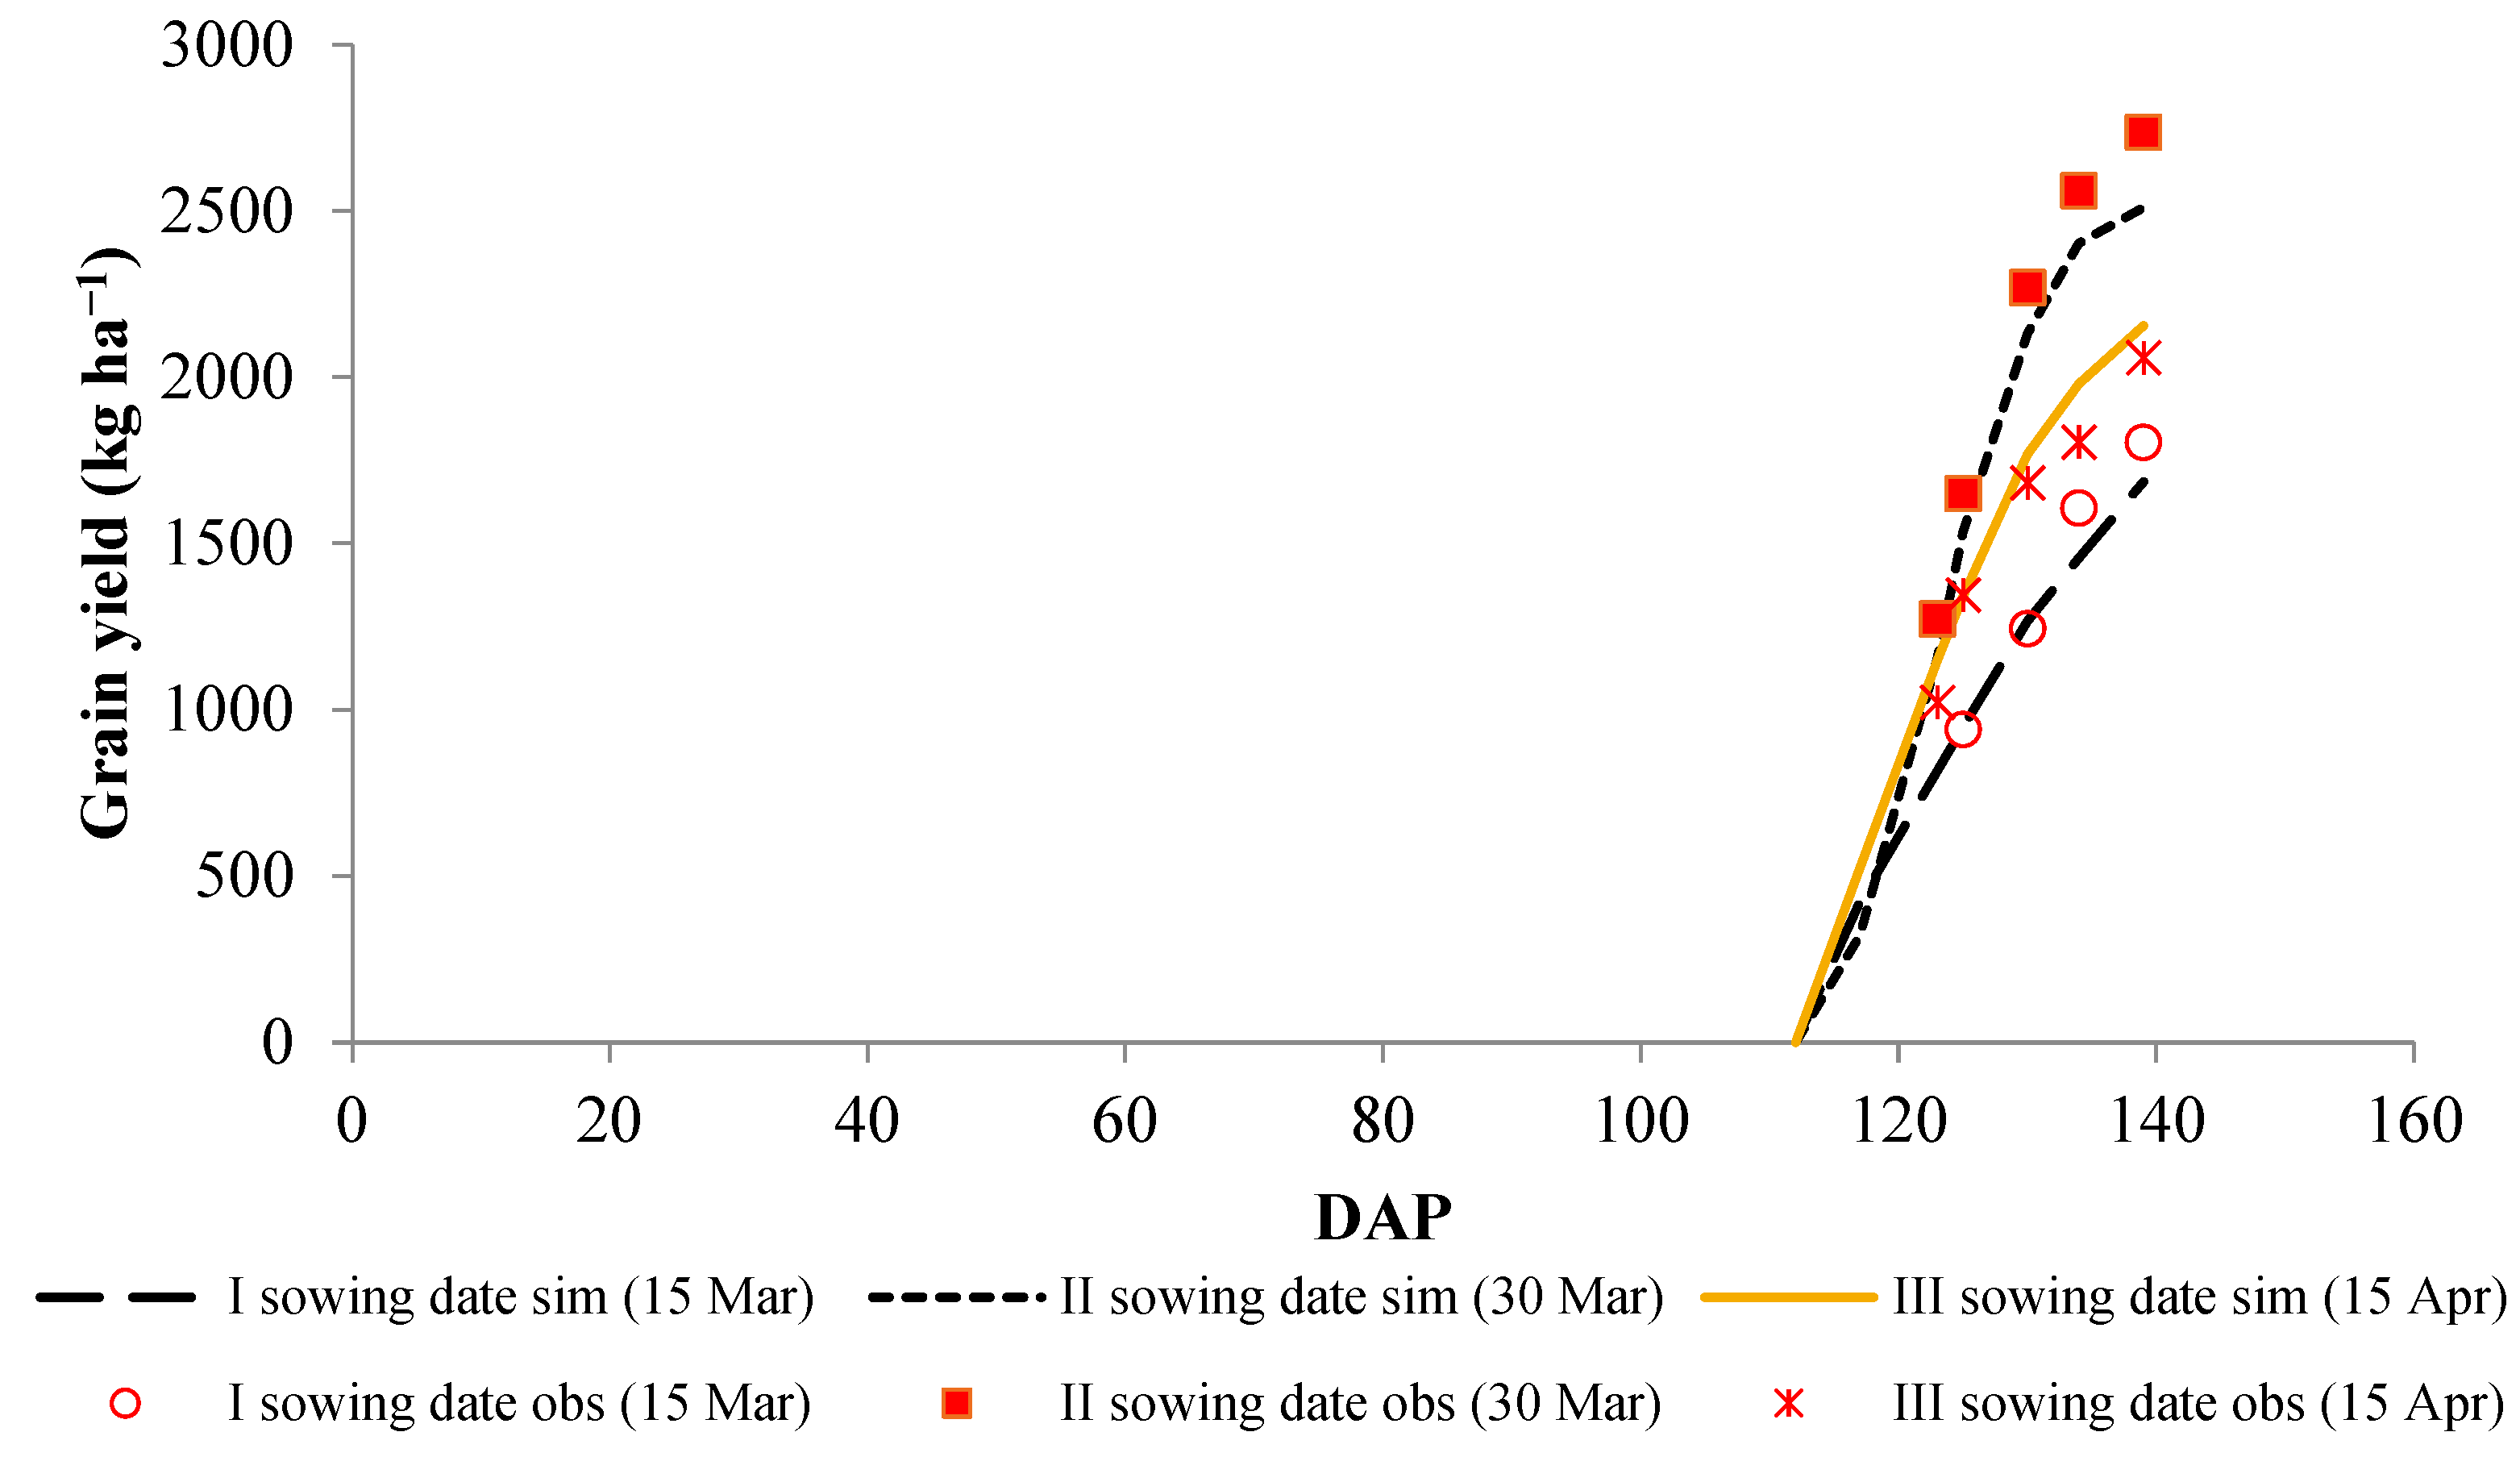
During the flax growing season, supplementary experiments were conducted in Dingxi in 2020 to obtain yield response to planting date. Seeds were planted on 15 and 30 March, and 15 April to determine the best sowing date for the Dingxi location. Sprinkler irrigation was used to supplement the insufficient rainfall to avoid drought stress. The other management scenarios were the same as for the 2017–2018 field experiment.

2.2. Measurements of Soil Physicochemical Indexes

Soil physicochemical analyses were conducted prior to planting. For Dingxi, the soil was classified as a Dark Loessial soil (Heilu soil) [32]. The values for the soil traits were: pH (H2O)—8.3; organic matter—10.8 g kg−1; rapidly available phosphorus—2.8 mg kg−1; total nitrogen—0.99 g kg−1; Olsen-P—8.31 mg kg−1; and quick-acting potassium—139 mg kg−1. For Datong, the soil was classified as a sandy loam [32] with a pH (H2O) of 7.75; organic matter—5.84 g kg−1; rapidly available phosphorus—27.28 mg kg−1; total nitrogen—0.42 g kg−1; alkali-hydrolysable nitrogen—32.89 mg kg−1; and quick-acting potassium—156.8 mg kg−1. The soil texture for Wulanchabu and Zhangjiakou were classified as Castanozems (Ligai soil) [32], with a pH (H2O) of 8.5; organic matter—22.5 g kg−1; rapidly available phosphorus—10.9 mg kg−1; total nitrogen—1.22 g kg−1; alkali-hydrolysable nitrogen—92 mg kg−1; and quick-acting potassium—137 mg kg−1. A summary for the critical topsoil horizon for each site is shown in Table 2.
Soil water content (SWC) was obtained by collecting soil samples every 10 days throughout the flax growing season, starting on 10 March and ending on 15 September 2020 in Dingxi. The samples were collected for the top 120 cm of the soil profile at 20 cm increments. The samples were dried in an oven at 105 ± 2 °C to a constant weight and then SWC was determined using the weight loss method. The mass percent of water was equal to the subtracted mass of dry soil from the mass of moist soil, which was then divided by the mass of dry soil. The volumetric water content was equal to the mass percent of water content multiplied by the dry bulk density of the soil.

2.3. Weather Data of the Sites

The weather data to be used in the SIMPLE model, including daily total solar radiation (SRAD), daily maximum temperature (TMAX), daily minimum temperature (TMIN) and daily precipitation (RAIN) were collected. For Dingxi, the weather data were obtained from a meteorological station managed by the Gansu Meteorological Bureau from 1 January 2020 to 31 December 2020. For Zhangjiakou, the weather data were obtained from Hebei Meteorological Bureau from 1 January 2017 to 31 December 2018; for Datong, the weather data were recorded by the Shanxi Meteorological Bureau; and for Wulanchabu, the daily weather data were recorded by the Mongolia Meteorological Bureau from 1 January 2016 to 31 December 2017.

2.4. Measurements of Flax Data

The main growth stages of flax plant include: the seedling stage (cotyledons exposed above the soil surface); the third pair of true leaves unfolded stage (≥three pairs of true leaves, plant height ≥5 cm); the budding stage (dense flower buds arising from the main stem); the flowering stage (flowers blooming on the inflorescence of the main stem); the seed-filling stage (1/3 to 1/2 of seeds being mature and some leaves falling); and the maturity stage (the upper capsule begins to harden, and all leaves have withered). The phenological growth stages of flax were observed and recorded manually every 7 days [16].
The leaf area was measured using a WDY-500A leaf area meter (Jinsheng Science and Technology Ltd., Co., Lianyungang, China). During the main growth phase of flax, continuous observations were obtained. Plants that had basically the same leaf age were marked using a non-water-soluble pen, and 10 plants were selected every 10 days for determinations. The dry weight of the stems, leaves, and capsules were determined by weighing after heating them at 105 °C for 30 min in an oven, followed by drying at 85 °C for 6–8 h to a constant weight. The aboveground dry matter accumulation was surveyed by modified method with half leaves. Samples were sent to an analytical laboratory (Gansu Provincial Key Laboratory of Aridland Crop Science, Gansu Agricultural University) for the determination of tissue composition including oil content, protein, dietary fiber, gum, palmitic acid, stearic acid, oleic acid, iodine, lignin, and alpha-linolenic acid.
At harvest maturity, the actual crop production was determined based on a sample of 15 plants for each plot. The grain yield, total aboveground biomass, the number of capsules per unit area, the number of grains per fruit, grain weight, yield component weights, and harvest index (HI) were measured by the conventional weighing method [25].

2.5. Model Introduction and Calibration

The SIMPLE model was applied to non-limiting water and nitrogen conditions. To simulate a new crop with the SIMPLE model in the R version frameworks, weather parameters, soil indexes, new crop species and cultivars parameters, irrigation, management and treatment data are required. The weather parameters include SRAD, RAIN, TMAX and TMIN [31]. The species parameters include Tbase, I50maxH, I50maxW, Topt, Tmax, RUE, Text, SWater and SCO2 [25]. In brief, Tbase and Topt are the base and optimal temperature for biomass growth, respectively (°C). I50maxH and I50maxW are the maximum daily reduction in I50B due to heat stress and water stress, respectively. RUE means the radiation use efficiency (above ground only and without respiration). Tmax is the threshold temperature to start accelerating senescence from heat stress. Text is the extreme temperature threshold when RUE becomes 0 owing to heat stress (°C), SCO2 is the crop-specific sensitivity of RUE to elevated CO2, and SWater is the sensitivity of RUE to the ARID index, which is a standardized index ranging from 0 (no water shortage) to 1 (extreme water shortage and associated drought stress).
Soil indexes were described by AWC, RCN, DDC and RZD (Table 2) [30]. Sowing and harvest data, atmospheric CO2 concentration, and irrigation dates and amounts were defined in an experimental input file. The species parameters to define a new crop were obtained from previous studies [33,34,35,36,37,38] and the experimental data.
The model requires four cultivar parameters including Tsum, HI, I50A and I50B for model calibration. Tsum is thermal time requirement from sowing to maturity (°C day). HI is calculated from Equation (1). I50A represents the thermal time required for the leaf area expansion process to intercept 50% of solar irradiance during the period of canopy closure, and I50B represents the thermal time required for the leaf area expansion process to intercept 50% of solar irradiance from maturity to canopy senescence. Tsum was calibrated to determine the aboveground dry matter accumulation, HI was used to calibrate grain yield, and I50A and I50B were used to calibrate radiation interception:
HI ( % ) = Economic   yield / Biologicalyield × 100 %
The final output of the SIMPLE model included total aboveground flax biomass, flax yield and canopy interception radiation. The calculation of biomass was simulated on the basis of photosynthesis [39]. The flax biomass was transformed from the photosynthetically active radiation (PAR) intercepted by the canopy, which was calculated from the intercepted radiation, radiation-use efficiency, a stress factor, and a CO2 factor. Ultimate yield was equal to the biomass times HI [40,41], as shown in Equations (2)–(5):
B radiation = Radiation × fSolar × RUE × f S × f C
Y final = HI × B radiation
f S = min ( f W , f T )
fSolar = { fSolar _ max 1 + e 0.01 × ( TT I 50 A ) ) ,   leaf   growth   period fSolar _ max 1 + e 0.01 × ( TT ( T sum I 50 B ) ) ,   leaf   senescence   period
where Bradiation represents the daily increase in biomass (kg ha−1) and total biomass is equivalent to the sum of the daily increase in biomass cumulative quantity. The radiation quantity is intercepted by the flax canopy expressed as fSolar, RUE (g MJ−1 m−2) represents the radiation use efficiency, fC represents the effect of CO2 on biomass growth, fS represents the stress factor and takes the minimum values of water stress (fW) and temperature stress (fT). Yfinal (kg ha−1) represents the ultimate yield, which is equal to Bradiation times HI. fSolar_max represents the maximum radiation interception percentage that crops can achieve. The value is set at 0.95 for bulk high-density crops [30].

2.6. Statistical Index of Model Evaluation

The following three criteria were used to statistically evaluate the performance of the flax model: the root mean square error (RMSE), the relative root mean square error (RRMSE) and the index of agreement (d-index), which is an aggregate overall indicator that is of more value than R2. The smaller the divergence between the predicted and observed values, the better the fit of the model fitting and the higher the simulation accuracy, with d-index close to 1 and both RMSE and RRMSE close to 0 [16,42,43,44]. These are shown in the following equations:
RMSE = i = 1 n ( P i O i ) 2 n
RRMSE = i = 1 n ( P i O i ) 2 / n μ
d index = 1 i = 1 n ( P i O i ) 2 i = 1 n ( | P i O ¯ | + | O i O ¯ | ) 2
where n represents the number of observations; P i represents the predicted value and O i represents the observed value for the ith measurement. O ¯ represents the mean of the observed values, P ¯ represents the mean of the simulated values, and μ represents the average of all observed values.

3. Results

3.1. Flax Parameters in the SIMPLE Model

The species parameters of flax were obtained from prior research results [33,34,35,36,37,38]. The suitable sowing temperature for flax was 4.5 to 5 °C in a 5 cm soil layer [7]. The lowest temperature for flaxseed germination was 1 to 3 °C. When the soil reached 18 to 20 °C, germination was most rapid [33,34]. Flaxseeds germinated at 5 °C, and 60% fat was preserved in the seeds, which is beneficial for healthy seedlings. Flax had a strong resistance to cold at the seedling stage, especially at the 2 to 3 true-leaf stage. The optimum temperature from the third pair of true leaves unfolded stage to the budding stage was 16 to 20 °C [35], and for flowering stage it was 20–25 °C. The main stem leaf stopped growing at 36 °C or higher [36]. After sowing, flaxseeds began to sprout and enter the vernalization stage, from seed germination to seedling emergence. Flax passed through the vernalization stage after 10 to 15 days at 2 to 12 °C. Flax is a quantitative long-day plant [37], and the most suitable day length for flax is between 10 and 14 h, whereas the long-day length in the northern region was 16 h. The suitable temperature of flax through the lighting stage was between 17 °C and 22 °C [38], and the length of the light stage was correlated with the day length hours and temperature. If the day length was prolonged, then the buds appeared in advance. Flax can only grow vegetative, but it cannot form flower buds or bloom for day lengths shorter than 8 h (Table 3).

3.2. Calibration of SIMPLE-Flax Model

The experimental data from 2017 were used for calibration and the data from 2018 were used for the evaluation of the SIMPLE model for the Dingxi and Zhangjiakou locations, while the experimental data from 2016 were used for calibration and the data from 2017 were used for evaluation for the Datong and Wulanchabu locations.
As mentioned above, the model was calibrated by adjusting the four cultivar parameters of the SIMPLE model. In phenology, 5 °C is regarded as the biological zero of flax. The effective thermal time of more than 5 °C required from sowing to maturity of flax, that is, the parameter Tsum, refers to the accumulation of a daily average temperature of more than 5 °C during the whole flax growth period. In accordance with the experiment, Tsum was set to 2350 °C day for Longya Hybrid No. 1, 2850 °C day for Zhangya No. 2, and 2285 °C day for Baxuan No. 3. The HI calibration was carried out using incremental changes between 0.1 and 0.5 (Table 4).
The simulation of the predicted biomass was better than that of the yield, as shown in Figure 1, Figure 2 and Figure 3, especially as it was uniformly overestimated for the Dingxi site (RMSE of 612 kg ha−1 and d-index of 0.37) (Figure 1A). However, for the other three sites, the predicted biomasses were good: Zhangjiakou had a RMSE of 213 kg ha−1 and a d-index of 0.89 (Figure 1B); Wulanchabu had a RMSE of 225 kg ha−1 and a d-index of 0.85 (Figure 1C); and Datong had a RMSE of 212 kg ha−1 and a d-index 0.91 (Figure 1D). Thus, the simulated yield at the harvest date was still approximately the final grain yield. HI was 0.30 for Longya Hybrid No. 1, 0.43 for Zhangya No. 2, and 0.30 for Baxuan No. 3. After the calibration of the cultivar parameters, yield was very well simulated for Dingxi with a RRMSE of 3.3% and a RMSE of 85 kg ha−1; Zhangjiakou had a RRMSE of 2.9% and a RMSE of 48 kg ha−1; and Wulanchabu had a RRMSE of 3.3% and a RMSE of 46 kg ha−1 (Figure 1 and Figure 2). There was a slight overprediction for Datong with a RRMSE of 13.8% and a RMSE of 212 kg ha−1. Simulations were considered accurate when the RRMSE values were less than 10% or the range from 10% to 20% was better [11,31] (Figure 2 and Figure 3). The statistical index of the model calibration is shown in Table 5.

3.3. Evaluation of SIMPLE-Flax Model

The ability of the model to predict grain yield and biomass was evaluated with experimental data from 2018 for the Dingxi and Zhangjiakou locations, and with data from 2017 for the Datong and Wulanchabu locations (Figure 4, Figure 5, Figure 6 and Figure 7).
With a RMSE of 55 kg ha−1 and d-index of 0.96, the simulation of the grain yield was accurate for Dingxi (Figure 5A). For Wulanchabu, the model estimated grain yield well (RMSE of 63 kg ha−1 and d-index of 0.93; Figure 5C), and this was also the case for Zhangjiakou (RMSE of 5 kg ha−1 and d-index 0.97; Figure 5B). For Datong, the yield was slightly overpredicted (RMSE of 176 kg ha−1 and d-index of 0.91; Figure 5D). The final yield was well simulated for all four locations. The final evaluation results are shown in Figure 4, including simulated values, measured values, and RRMSEs of yield and biomass for all the experimental sites.
For Dingxi, the simulated biomass was slightly overpredicted (RMSE of 1239 kg ha−1 and d-index of 0.69) (Figure 6A), while for Zhangjiakou, simulated biomass was under-predicted (RMSE of 135 kg ha−1 and d-index of 0.90, Figure 6B). For Wulanchabu, simulated biomass was relatively close to the observed biomass (RMSE of 280 kg ha−1 and d-index of 0.95, Figure 6C), and the same was found for Datong (RMSE of 140 kg ha−1 and d-index of 0.97, Figure 6D).
The statistical summary of the comparison between simulated flax biomass and yield by the SIMPLE model and observed data are shown in Table 6.
The results show that the grain and biomass simulations by the SIMPLE model for various environmental conditions and management practices of the four sites were mainly identical to the observed values as determined by the values for RMSE, RRMSE and d-index. In general, the SIMPLE model showed good agreement in simulating the flax yield and biomass under diverse levels of irrigation and nitrogen application conditions.

3.4. Effect of Sowing Date at the Dingxi Site

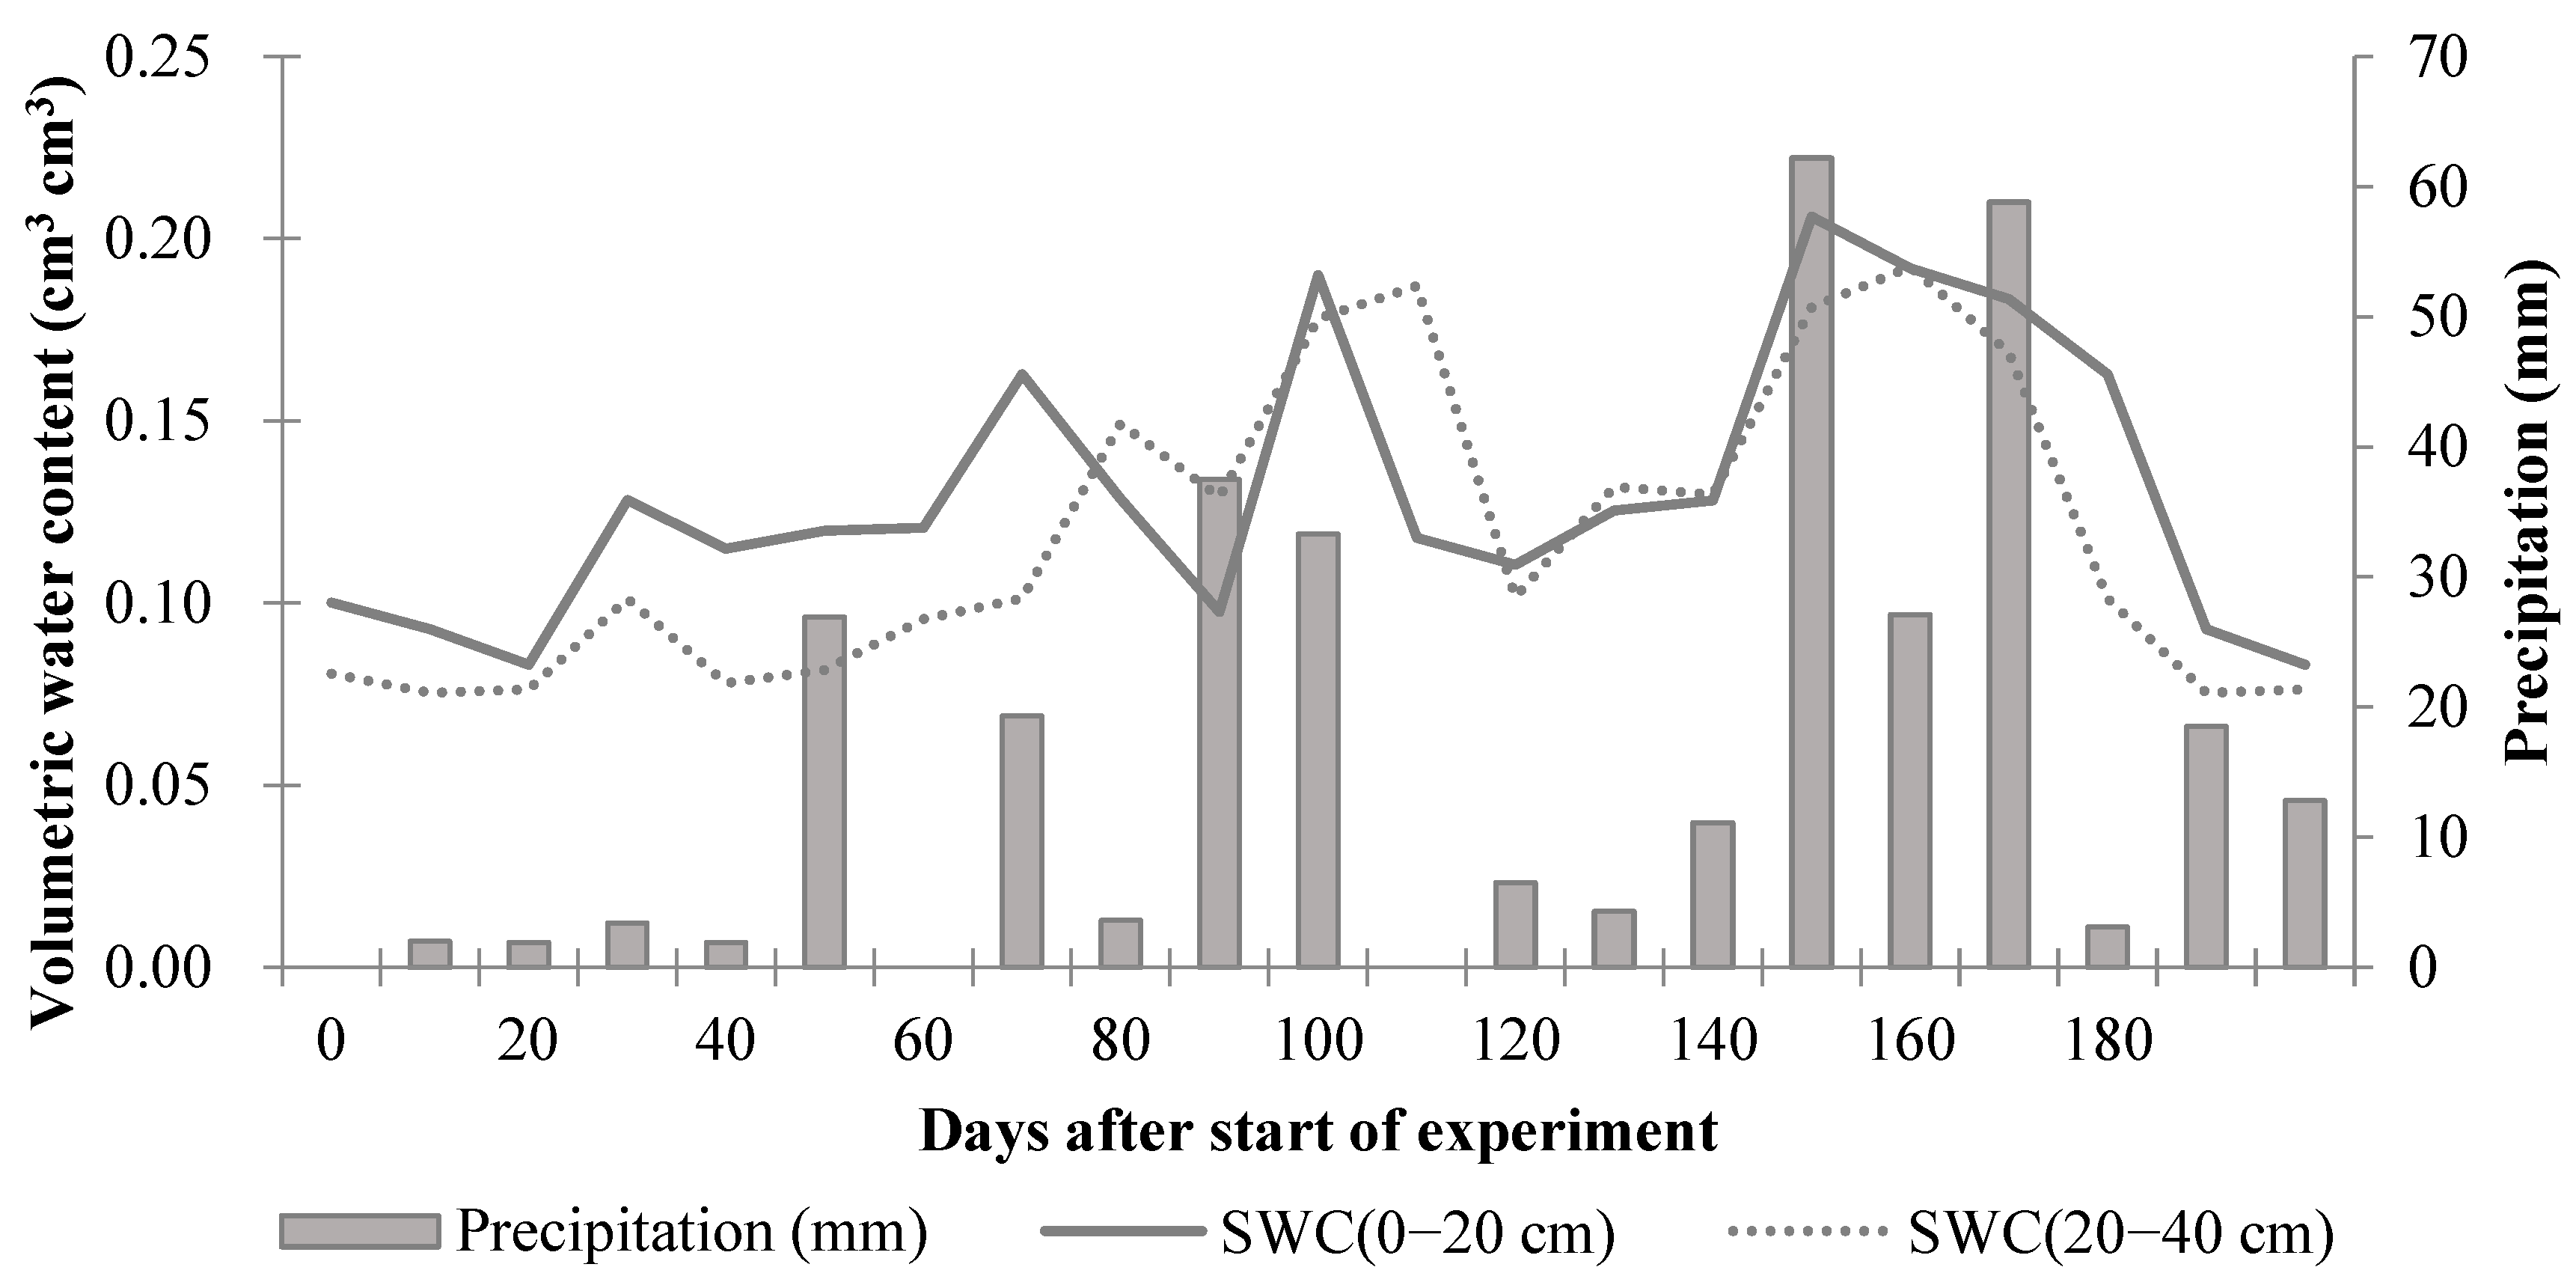
Dingxi is a dryland site, and there was adequate precipitation during the 2020 growing season (2020: 401 mm); therefore, no supplemental irrigation was needed (Figure 8). The dry sowing of flax can not only make full use of slurry water after thawing to improve the emergence rate, but it can also break through a last late frost hazard. In addition, it prolongs the growing time of seedlings, encourages full vegetative growth and, thus, creates good conditions for the later flowering and fruiting of flax. As shown in Figure 9, the highest simulated yield simulation was for the 30 March sowing compared to the 15 April and 15 March sowings. The average minimum temperature was 9.9 °C, and the average maximum temperature was 15.4 °C from sowing to the maturity of flax. To a large extent, this is in line with the actual situation in the area, but it should be emphasized that the earlier dates could make use of the water thawed in the surface soil during early spring to strengthen the seedling. However, the early sowing of flax resulted in a lower temperature during the seedling stage and a slower growth of the above-ground part, resulting in faster and earlier crop growth. Overall, a lower yield, as well as fewer flowers and fruits will take place when the sowing date is later. Thus, the SIMPLE model accurately predicted crop growth cycles and yields, as demonstrated by the statistical outcomes of the model evaluation for the three planting dates.

4. Discussion

In this study, to investigate the adaptability of the SIMPLE model in arid and semi-arid environments, four representative flax-producing areas and three of the most promising flax varieties were selected, and the model was developed and corrected. For annual plants, the model was developed by using 1-year experimental data, and the model was evaluated by using the test data of the next year, which was consistent with the research of Deligios et al. [16] and Singh et al. [45].
Biomass accumulation is the basis for yield formation, while photosynthetic production is the core of biomass accumulation [46]. The dynamic simulation of crop production began with the photosynthesis models [47,48]. In the past, crop photosynthesis models mostly used hierarchical structures for the simulation of canopy photosynthesis [49,50,51,52] and to obtain the daily photosynthetic rate of the whole canopy [46,53,54,55,56,57]. According to the characteristics of the ecological structure of flax canopies, if the layered structure model is used to calculate light energy interception and photosynthesis, the LAI will be difficult to accurately measure and simulate. For the three leaf layers, the differences in the photosynthetic rate among the long petiole, short petiole and sessile leaves cannot be considered; thus, it will inevitably cause simulation errors. In this study, we used the SIMPLE model to simulate phenological development using thermal time expressed as growing degree days. Photosynthesis was based on the radiation use efficiency, and the internal factors affecting the photosynthetic rate of flax were considered, including the development and structure of leaves and the output of photosynthetic products, as well as the external factors affecting the growth of flax, including light intensity, light quality, CO2, and temperature. Based on these factors, the photosynthetic parameters of the SIMPLE-Flax model were determined. The coefficients of flax were set, i.e., 110 for I50maxH, 18 for I50maxW, 25 for Topt, 0.86–1.09 for RUE, 45 for Text, 0.9 for SWater, and 0.07 for SCO2. Therefore, each coefficient in this model had certain biological significance and a strong explanatory ability, and the model could simulate the photosynthetic process for flax.
The RRMSE for the calibration of flax yield was 5.8%, while for model evaluation it was 4.1%. The average RRMSE was 25.4% for the 14 crops that were originally developed with the SIMPLE model [30]. This showed that the SIMPLE model is suitable for a non-common crop such as flax. The average RMSE for biomass simulations was 449 kg ha−1 with the SIMPLE model, and the average d-index value of the four experimental sites was 0.88. The simulated average RMSE value for yield was 74 kg ha−1, and the average d-index value of the four experimental sites was 0.94. These results showed that the SIMPLE model had been well simulated for most variables (biomass, yield, etc.), but there were a slight over prediction for the biomass of Dingxi and a slight over prediction for the yield of Datong. A possible reason may be that the limitations of the SIMPLE model led to these slight simulation errors. Compared with previous research, such as APSIM [25] and AquaCrop [29], used for simulating flax growth, the number of input parameters were different, i.e., 14 for SIMPLE, 39 for APSIM, and 29 for AquaCrop; the average RMSE of the biomass simulations for the same data sets with the APSIM model was 465 kg ha−1 and the R2 value was 0.93; the simulated average RMSE values of yield for the same data sets with APSIM was 110 kg ha−1 and the R2 value was 0.80. We evaluated and compared the differences between the previous AquaCrop model and this study, and ran the AquaCrop model with the different data sets. Therefore, the results showed that the simulated values of the model fit well with the observed values with, in general, good simulation results.
During the flax growth and development simulation process, biomass and yield were well simulated. This could help extension services provide guidance for flax production with relatively limited input data. However, the model did not include the vernalization response and photoperiod effect in the phenology because it was based on only 14 genotype-specific parameters. This is one of the limitations of the SIMPLE model. Another limitation of the SIMPLE model is the lack sensitivity to vernalization and photoperiod, which can be important for some crops that are photoperiod-sensitive. In addition, while RUE varies with temperature, drought stress, and CO2 level, the SIMPLE model does not consider the impact of diffused light on RUE [30]. Therefore, some factors that affect crop growth and development are not considered and, thus, could affect the accuracy of the simulations of the SIMPLE model. When it is difficult to obtain parameters required by other general models, or the sample size and quality of field experiments are limited, the SIMPLE model has more advantages, owing to the need for only a few parameters. In addition, the fitting, popularization and application of the model needs to be exposed to a wider range of regions and test samples, which will further improve the model. Assessments of the impact of climate change on the growth and development of flax will be one of the future applications of the new SIMPLE-Flax model [58,59,60,61].

5. Conclusions

In this research, the SIMPLE model was adapted for flaxseed to simulate biomass and grain yield for four experimental sites in northern China. The adaptability of the model to the arid and semi-arid regions was demonstrated by RMSE, RRMSE and d-index values, which indicated that the SIMPLE model can be used to simulate flax grain yields and growth cycles with relative precision for different management scenarios and environmental conditions. However, there might be a potential minor error when simulating the daily biomass of flax, because the SIMPLE model does not consider the effects of diffuse light on RUE. In addition, when transferring this model to other environments, it should be noted that it does not include vernalization or day-length sensitivity.

Author Contributions

Conceptualization, methodology, investigation, data curation, writing—original draft, writing—review and editing, Y.L.; methodology, writing—review and editing, G.H. and S.A.; data curation, formal analysis, investigation, J.-Y.N., L.W. and L.-H.K. All authors have read and agreed to the published version of the manuscript.

Funding

This research was jointly funded by National Natural Science Foundation (grant number 32060437 and 31360315), Young tutor fund project of Gansu Agricultural University (grant number GAU-QDFC-2020-12), Development Fund Project of information science and Technology College of Gansu Agricultural University (grant number GAU-XKFZJJ-2020-02), Sheng Tongsheng science and technology innovation fund project of Gansu Agricultural University (grant number GSAU-STS-2021-15), and Science and Technology plan in Gansu Province (grant number 18JR3RA165).

Acknowledgments

We are gratefully acknowledging the Food Systems Institute and the Department of Agricultural and Biological Engineering at the University of Florida for their help in providing a hosting and learning environment. Technical supports from Chuang Zhao are also much appreciated.

Conflicts of Interest

The authors declare no conflict of interest.

References

  1. Povkhova, L.V.; Melnikova, N.V.; Rozhmina, T.A.; Novakovskiy, R.O.; Pushkova, E.N.; Dvorianinova, E.M.; Zhuchenko, A.A.; Kamionskaya, A.M.; Krasnov, G.S.; Dmitriev, A.A. Genes associated with the flax plant type (oil or fiber) identified based on genome and transcriptome sequencing data. Plants 2021, 10, 2616. [Google Scholar] [CrossRef] [PubMed]
  2. Xie, Y.P.; Gan, Y.T.; Li, Y.; Niu, J.Y.; Gao, Y.H.; An, H.H.; Li, A.R. Effect of nitrogen fertilizer on nitrogen accumulation, translocation, and use efficiency in dryland oilseed flax. Agron. J. 2015, 107, 1931–1939. [Google Scholar] [CrossRef]
  3. Shekhara, N.R.; Anurag, A.P.; Prakruthi, M.; Mahesh, M.S. Flax Seeds (Linum usitatissimmum): Nutritional composition and health benefits. IP J. Nutr. Metab. Health Sci. 2020, 3, 35–40. [Google Scholar]
  4. Hall, C.; Tulbek, M.C.; Xu, Y.Y. Flaxseed. Adv. Food Nutr. Res. Acad. Press 2006, 51, 1–97. [Google Scholar] [CrossRef]
  5. Kumar, S.; Jordan, M.C.; Datla, R.; Cloutier, S. The LuWD40-1 Gene Encoding WD Repeat Protein Regulates Growth and Pollen Viability in Flax (Linum Usitatissimum L.). PLoS ONE 2013, 8, e69124. [Google Scholar] [CrossRef] [PubMed]
  6. Saleem, M.H.; Ali, S.; Hussain, S.; Kamran, M.; Chattha, M.S.; Ahmad, S.; Aqeel, M.; Rizwan, M.; Aljarba, N.H.; Alkahtani, S.; et al. Flax (Linum usitatissimum L.): A potential candidate for phytoremediation? Biological and economical points of view. Plants 2020, 9, 496. [Google Scholar] [CrossRef] [PubMed] [Green Version]
  7. Yu, Z.W. On Crop Cultivation (Northern Edition); China Agricultural Press: Beijing, China, 2003; pp. 32–369. [Google Scholar]
  8. Hoogenboom, G.; Porter, C.H.; Boote, K.J.; Shelia, V.; Wilkens, P.W.; Singh, U.; White, J.W.; Asseng, S.; Lizaso, J.I.; Moreno, L.P.; et al. The DSSAT crop modeling ecosystem. In Advances in Crop Modeling for a Sustainable Agriculture; Boote, K.J., Ed.; Burleigh Dodds Science Publishing: Cambridge, UK, 2019; pp. 173–216. [Google Scholar]
  9. Hoogenboom, G.; Porter, C.H.; Shelia, V.; Boote, K.J.; Singh, U.; White, J.W.; Hunt, L.A.; Ogoshi, R.; Lizaso, J.I.; Koo, J.; et al. Decision Support System for Agrotechnology Transfer (DSSAT) Version 4.7; DSSAT Foundation: Gainesville, FL, USA, 2017. [Google Scholar]
  10. Jones, J.W.; Hoogenboom, G.; Porter, C.H.; Boote, K.J.; Batchelor, W.D.; Hunt, L.A.; Wilkens, P.W.; Singh, U.; Gijsman, A.J.; Ritchie, J.T. DSSAT Cropping System Model. Eur. J. Agron. 2003, 18, 235–265. [Google Scholar] [CrossRef]
  11. Kiniry, J.R.; Williams, J.R.; Major, D.J.; Izaurralde, R.C.; Gassman, P.W.; Morrison, M.; Bergentine, R.; Zentner, R.P. EPIC model parameters for cereal, oilseed, and forage crops in the northern great plains region. Can. J. Plant Sci. 1995, 75, 679–688. [Google Scholar] [CrossRef]
  12. Habekotté, B. A model of the phenological development of winter oilseed rape (Brassica napus L.). Field Crops Res. 1997, 54, 127–136. [Google Scholar] [CrossRef]
  13. Gabrielle, B.; Denoroy, P.; Gosse, G.; Justes, E.; Andersen, M.N. Development and evaluation of a CERES-type model for winter oilseed rape. Field Crops Res. 1998, 57, 95–111. [Google Scholar] [CrossRef]
  14. Robertson, M.J.; Holland, J.F.; Kirkegaard, J.A.; Smith, C.J. Simulating growth and development of canola in Australia. In Proceedings of the 10th International Rapeseed Congress, Canberra, Australia, 26–29 September 1999. [Google Scholar]
  15. Robertson, M.J.; Lilley, J.M. Simulation of growth, development and yield of canola (Brassica napus) in APSIM. Crop Pasture Sci. 2016, 67, 332–344. [Google Scholar] [CrossRef]
  16. Deligios, P.A.; Farci, R.; Sulas, L.; Hoogenboom, G.; Ledda, L. Predicting growth and yield of winter rapeseed in a Mediterranean environment: Model adaptation at a field scale. Field Crops Res. 2013, 144, 100–112. [Google Scholar] [CrossRef]
  17. Gilardelli, C.; Stella, T.; Frasso, N.; Cappelli, G.; Bregaglio, S.; Chiodini, M.E.; Scaglia, B.; Confalonieri, R. WOFOST-GTC: A new model for the simulation of winter rapeseed production and oil quality. Field Crops Res. 2016, 197, 125–132. [Google Scholar] [CrossRef]
  18. Liu, H.; Jin, Z.Q. A phenological model to simulate rape development. Q. J. Appl. Meteorol. 2003, 14, 634–640. [Google Scholar]
  19. Cao, H.X.; Zhang, C.L.; Li, G.M.; Zhang, B.J.; Zhao, S.L.; Wang, B.Q.; Jin, Z.Q.; Gao, L.Z. Researches of simulation models of rape (Brassica napus L.) growth and development. Acta Agron. Sin. 2006, 32, 1530–1536. [Google Scholar]
  20. Liu, T.M.; Hu, L.Y.; Zhao, Z.H.; Cao, C.G.; Cao, W.X.; Yan, M.C. A mechanistic of phasic and phenological development in rape I. Description of the model. Chin. J. Oil Sci. 2004, 26, 28–32. [Google Scholar]
  21. Tang, L.; Zhu, Y.; Liu, T.M.; Cao, W.X. A process-based model for simulating phenological development in rapeseed. Sci. Agric. Sin. 2008, 41, 2493–2498. [Google Scholar]
  22. Rahimi-Moghaddam, S.; Eyni-Nargeseh, H.; Kalantar Ahmadi, S.A.; Azizi, K. Towards withholding irrigation regimes and drought-resistant genotypes as strategies to increase canola production in drought-prone environments: A modeling approach. Agric. Water Manag. 2021, 243, 106487. [Google Scholar] [CrossRef]
  23. Sun, B.; Wang, C.F.; Yang, C.H.; Xu, B.D.; Zhou, G.S.; Li, X.Y.; Xie, J.; Xu, S.J.; Liu, B.; Xie, T.J.; et al. Retrieval of rapeseed leaf area index using the PROSAIL model with canopy coverage derived from UAV images as a correction parameter. Int. J. Appl. Earth Obs. Geoinf. 2021, 102, 102373. [Google Scholar] [CrossRef]
  24. Qian, B.D.; Jing, Q.; Bélanger, G.; Shang, J.L.; Huffman, T.; Liu, J.G.; Hoogenboom, G. Simulated canola yield responses to climate change and adaptation in Canada. Agron. J. 2018, 110, 133–146. [Google Scholar] [CrossRef] [Green Version]
  25. Li, Y.; Wu, L.; Gao, Z.N.; Niu, J.Y. Simulation model of photosynthesis and dry matter accumulation in oilseed flax based on APSIM. Acta Prataculturae Sin. 2018, 27, 57–66. [Google Scholar] [CrossRef]
  26. Li, Y.; Wu, B.; Liu, D.; Gao, Z.N.; Xie, Y.P.; Yan, B.; Zhang, Z.K.; Niu, J.Y. Simulation model for flax yield formation of oilseed flax based on APSIM. Chin. J. Eco Agric. 2016, 24, 1246–1253. [Google Scholar] [CrossRef]
  27. Li, Y.; Niu, J.Y.; Xie, Y.P.; Wu, B.; Gao, Z.N.; Liu, D.; Yan, B. Simulation of oilseed flax leaf area index based on APSIM. Chin. J. Oil Crop Sci. 2015, 37, 329–335. [Google Scholar] [CrossRef]
  28. Li, Y.; Niu, J.Y.; Wu, B.; Xie, Y.P.; Yan, B. Simulation oilseed flax development duration based on APSIM. J. Nucl. Agric. Sci. 2015, 29, 972–979. [Google Scholar] [CrossRef]
  29. Li, Y.; Niu, J.Y.; Guo, L.Z. Application and validation of AquaCrop model in simulating biomass and yield of oil flax in Northwest China. Chin. J. Eco Agric. 2014, 22, 93–103. [Google Scholar] [CrossRef]
  30. Zhao, C.; Liu, B.; Xiao, L.J.; Hoogenboom, G. A SIMPLE crop model. Eur. J. Agron. 2019, 104, 97–106. [Google Scholar] [CrossRef]
  31. Ahmed, M. Systems Modeling; Springer: Singapore, 2020; pp. 1–44. [Google Scholar] [CrossRef]
  32. National Soil Survey Office (NSSO). Chinese Soil; China Agriculture Press: Beijing, China, 1998; pp. 32–140. [Google Scholar]
  33. Tiver, N.S.; Williams, R.F. Studies of the flax plant. II. The effect of artificial drought on growth and oil production in a linseed variety. Aust. J. Exp. Biol. Med. Sci. 1943, 21, 202. [Google Scholar] [CrossRef]
  34. Gusta, L.V.; O’Connor, B.J.; Bhatty, R.S. Flax (Linum usitatissimum L.) responses to chilling and heat stress on flowering and seed yield. Can. J. Plant Sci. 1997, 77, 97–99. [Google Scholar] [CrossRef]
  35. Li, X.; Fang, Z.; Niu, J. Study on configuration fabric and germination conditions of flax seed. Seed 2012, 31, 26–30. [Google Scholar] [CrossRef]
  36. Kraft, J.M.; Kommedahl, T.; Linck, A.L. Histological study of malformation in flaxseed after exposure to 31 °C. Bot. Gaz. 1963, 125, 367–371. [Google Scholar] [CrossRef]
  37. Darapuneni, M.; Morgan, G.D.; Ibrahim, A.M.H.; Duncan, R.W. Effect of vernalization and photoperiod on flax flowering time. Euphytica 2014, 195, 279–285. [Google Scholar] [CrossRef]
  38. Yermanos, D.M.; Goodin, J.R. Temperature effects: On vegetative growth and oil quality of FLAX. Calif. Agric. 1965, 19, 15–16. [Google Scholar] [CrossRef]
  39. Monteith, J.L. Light distribution and photosynthesis in field crops. Ann. Bot. 1965, 29, 17–37. [Google Scholar] [CrossRef]
  40. Amir, J.; Sinclair, T.R. A model of water limitation on spring wheat growth and yield. Field Crops Res. 1991, 28, 59–69. [Google Scholar] [CrossRef]
  41. Kanda, E.K.; Senzanje, A.; Mabhaudhi, T. Calibration and validation of AquaCrop model for full and deficit irrigated cowpea (Vigna unguiculata (L.)) Walp). Phys. Chem. Earth Parts A/B/C 2021, 124 Pt 1, 102941. [Google Scholar] [CrossRef]
  42. Willmott, C.J. Some comments on the evaluation of model performance. B Am. Meteorol. Soc. 1982, 63, 1309–1313. [Google Scholar] [CrossRef] [Green Version]
  43. Deihimfard, R.; Rahimi-Moghaddam, S.; Collins, B.; Azizi, K. Future climate change could reduce irrigated and rainfed wheat water footprint in arid environments. Sci. Total Environ. 2022, 807 Pt 3, 150991. [Google Scholar] [CrossRef]
  44. Elnashar, A.; Wang, L.; Wu, B.; Zhu, W.; Zeng, H. Synthesis of global actual evapotranspiration from 1982 to 2019. Earth Syst. Sci. Data 2020, 13, 447–480. [Google Scholar] [CrossRef]
  45. Singh, S.; Boote, K.J.; Angadi, S.V.; Grover, K.; Begna, S.; Auld, D. Adapting the CROPGRO model to simulate growth and yield of spring safflower in semiarid conditions. Agron. J. 2016, 108, 64–72. [Google Scholar] [CrossRef]
  46. Xue, L. Study of Development Simulation Models in Sesame. Master’s Thesis, Nanjing Agricultural University, Nanjing, China, 2012. [Google Scholar] [CrossRef]
  47. De Wit, C.T. Photosynthesis of Leaf Canopies; Agricultural Research Reports; Pudoc: Wageningen, The Netherlands, 1965; pp. 1–54. Available online: https://edepot.wur.nl/187115 (accessed on 1 November 2019).
  48. Duncan, W.G.; Loomis, R.S.; Williams, W.A.; Hanau, R. A model for simulating photosynthesis in plant communities. Hilgardia 1967, 38, 181–205. [Google Scholar] [CrossRef] [Green Version]
  49. Tang, L.Y.; Hou, C.; Huang, H.Y.; Chen, C.C.; Zou, J.; Lin, D. Light interception efficiency analysis based on three-dimensional peach canopy models. Ecol. Inf. 2015, 30, 60–67. [Google Scholar] [CrossRef] [Green Version]
  50. Chen, Q.; Baldocchi, D.; Gong, P.; Dawson, T. Modeling radiation and photosynthesis of a heterogeneous savanna woodland landscape with a hierarchy of model complexities. Agric. For. Meteorol. 2008, 148, 1005–1020. [Google Scholar] [CrossRef]
  51. Wen, W.L.; Guo, X.Y.; Li, B.J.; Wang, C.Y.; Wang, Y.J.; Yu, Z.T.; Wu, S.; Fan, J.C.; Gu, S.H.; Lu, X.J. Estimating canopy gap fraction and diffuse light interception in 3D maize canopy using hierarchical hemispheres. Agric. For. Meteorol. 2019, 276–277, 107594. [Google Scholar] [CrossRef]
  52. Bing, F. Research on the agriculture intelligent system based on IOT. In Proceedings of the 2012 International Conference on Image Analysis and Signal Processing, Huangzhou, China, 9–11 November 2012; pp. 1–4. [Google Scholar] [CrossRef]
  53. Liu, T.M. Simulation on Photosynthetic Production and Dry Matter Partitioning in Wheat. Ph.D. Thesis, Nanjing Agricultural University, Nanjing, China, 2000. [Google Scholar] [CrossRef]
  54. Zhang, L.Z.; Cao, W.X.; Zhang, S.P.; Luo, W.H. A process model of photosynthetic production and dry matter accumulation in cotton. Cotton Sci. 2003, 15, 138–145. [Google Scholar]
  55. Zhu, Y.J.; Feng, L.P.; Yi, P. A dynamic model simulating photosynthetic production and dry matter accumulation for alfalfa (Medicago sativa L.). Acta Agron. Sin. 2007, 33, 1682–1687. [Google Scholar] [CrossRef]
  56. Zhang, Y.J. Study on Direct-Seeding Rapeseed Growth Simulation Model. Master’s Thesis, Huazhong Agricultural University, Wuhan, China, 2013. [Google Scholar] [CrossRef]
  57. Zou, W. A Process-Based Simulation Model on Barley Growth and Development. Ph.D. Thesis, Nanjing Agricultural University, Nanjing, China, 2009. [Google Scholar] [CrossRef]
  58. Yang, J.M.; Yang, J.Y.; Liu, S.; Hoogenboom, G. An evaluation of the statistical methods for testing the performance of a crop simulation model with observed data. Agric. Syst. 2014, 127, 81–89. [Google Scholar] [CrossRef]
  59. Hoogenboom, G. Contribution of agrometeorology to the simulation of crop production and its applications. Agric. Forest Meteorol. 2020, 103, 137–157. [Google Scholar] [CrossRef]
  60. Boote, K.J.; Jones, J.W.; Hoogenboom, G. Crop simulation models as tools for agro-advisories for weather and disease effects on production. J. Agrometeorol. 2008, 10, 9–17. [Google Scholar]
  61. Tsuji, G.Y.; Hoogenboom, G.; Thornton, P.K. Part of the Systems Approaches for Sustainable Agricultural Development book series (SAAD). In Understanding Options for Agricultural Production; Kluwer Academic Publishers: Dordrecht, The Netherlands, 1998; Volume 7, p. 400. [Google Scholar]
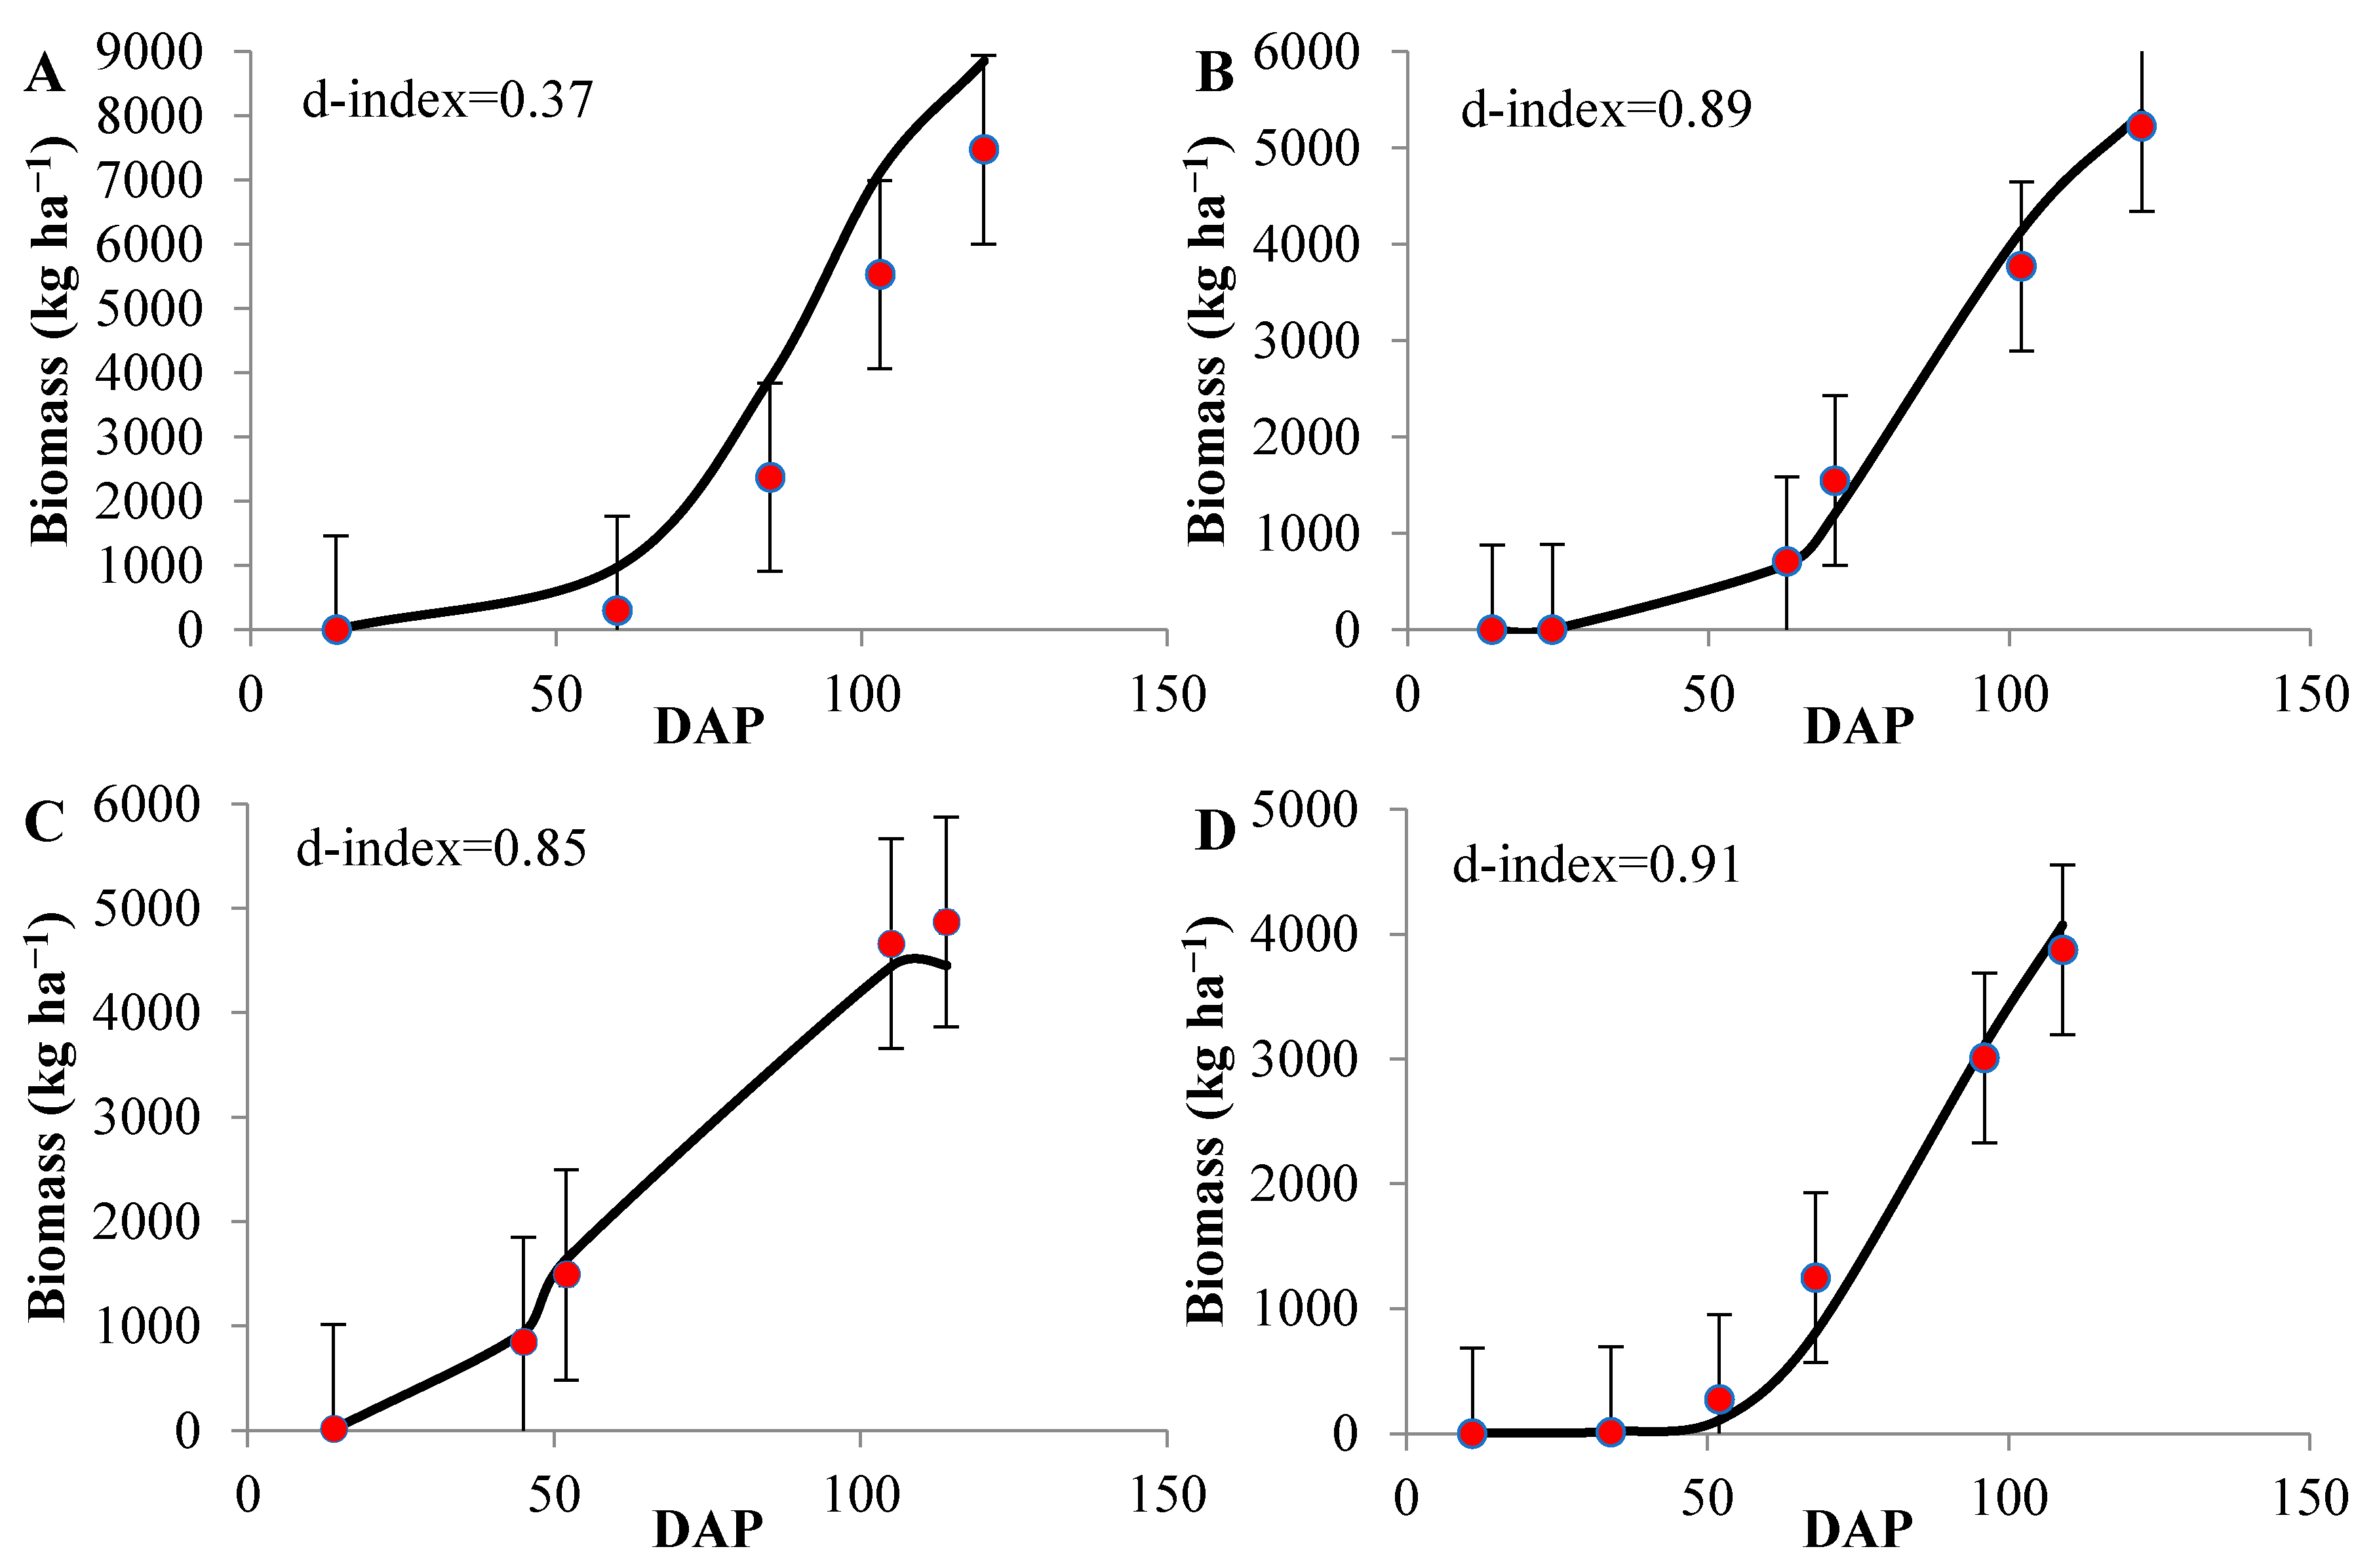
Figure 1. Simulated (lines) and observed (symbols) biomass for oilseed flax for the cultivar Longya Hybrid No. 1 grown in Dingxi (A) and in Wulanchabu (C); Baxuan No. 3 grown in Zhangjiakou (B); and Zhangya No. 2 grown in Datong (D). DAP—days after planting. Note: the error bars denote S.D. for the degree of dispersion of the observed, indicating a reasonable margin of simulated error.
Agronomy 12 01267 g001
Figure 2. Calibration of simulated (Sim) and observed (Obs) yield, biomass, and fSolar as a function of DAP for oilseed flax cultivar Longya Hybrid No. 1 grown in Dingxi (A); Baxuan No. 3 grown in Zhangjiakou (B); Longya Hybrid No. 1 grown in Wulanchabu (C); and Zhangya No. 2 grown in Datong (D). RRMSE—relative root mean square.
Agronomy 12 01267 g002
Figure 3. Simulation (lines) and measurement (symbols) of grain yield for oilseed flax cultivar Longya Hybrid No. 1 grown in Dingxi (A) and in Wulanchabu (C); Baxuan No. 3 grown in Zhangjiakou (B); and Zhangya No. 2 grown in Datong (D).
Agronomy 12 01267 g003
Figure 4. Evaluation of simulated (Sim) and observed (Obs) yield, biomass and fSolar as a function of DAP for oilseed flax cultivar Longya Hybrid No. 1 grown in Dingxi (A); Baxuan No. 3 grown in Zhangjiakou (B); Longya Hybrid No. 1 grown in Wulanchabu (C); and Zhangya No. 2 grown in Datong (D). RRMSE—relative root mean square.
Agronomy 12 01267 g004
Figure 5. Evaluation of simulated yield for oilseed flax for the studies conducted in Dingxi (A); Zhangjiakou (B); Wulanchabu (C); and Datong (D). Note: the horizontal and vertical error bars denote S.E. for the simulated and observed.
Agronomy 12 01267 g005
Figure 6. Evaluation of simulated biomass for oilseed flax for the studies conducted in Dingxi (A); Zhangjiakou (B); Wulanchabu (C); and Datong (D).
Agronomy 12 01267 g006
Figure 7. A comparison between simulated and observed yield (A) and biomass (B) for the four experimental sites.
Agronomy 12 01267 g007
Figure 8. Observed soil volumetric soil moisture content and precipitation events tested in fields at Dingxi in 2020 from sowing to maturity.
Agronomy 12 01267 g008
Figure 9. A comparison between simulated (lines) and observed (symbols) of grain yield for the three sowing dates for the Dingxi site for the 2020 growing season. DAP—days after planting.
Agronomy 12 01267 g009
Table 1. Detailed features of the four sites where the trials were conducted.
FeatureDingxiZhangjiakouWulanchabuDatong
Provinces of ChinaGansuHebeiInner MongoliaShanxi
Average elevation (m)2050145014191067
Longitude and latitude104°37′12″ E, 35°34′48″ N104°10′ E, 40°57′ N113°0′ E, 41°9′ N113°20′ E, 40°6′ N
Average total annual rainfall (mm)300–400392150–450392.7
Average annual temperature (°C)3.26.67.85.7
Average annual frost-free period (days)146125110135
Flax cultivarLongya Hybrid No. 1Baxuan No. 3Longya Hybrid No. 1Zhangya No. 2
Sowing date23 April 2017;
9 April 2018;
15 March 2020;
30 March 2020;
15 April 2020;
5 May 2017;
6 May 2018
10 May 2016;
5 May 2017
24 April 2016;
19 April 2017
Harvesting date20 August 2017;
10 August 2018;
1 August 2020;
8 August 2020;
27 August 2020;
3 September 2017;
8 September 2018
12 September 2016;
7 September 2017
10 August 2016;
2 September 2017
Table 2. Soil variable indexes for the four field experimental sites.
SitesSoil TypeSoil TextureSoil Depth (cm)AWC (mm)RCNDDCRZD (mm)
DingxiDark Loessial soilClay loam0–210.12800.3700
Wulanchabu and DatongCastanozemsClay loam0–400.19750.31300
ZhangjiakouSandy loamSandy clay loam0–200.13750.6550
AWC—fraction of the plant’s available water-holding capacity, one number for entire soil profile (limited by potential root depth); RCN—runoff curve number; DDC—deep drainage coefficient; RZD—root zone depth (mm); Soil Depth—tillage layer (cm). Data were obtained from reference [30,32].
Table 3. The SIMPLE model species parameters of flax.
ParameterUnitValueSource of Data
Tbase°C4.5–5[7]
Topt°C20–25[7,35]
RUEg MJ−1m−20.86–1.09Calibrated
I50maxH°C day110 ± 2Calibrated
I50maxW°C day18 ± 2Calibrated
Tmax°C36[36]
Text°C45[36]
SCO2--0.07[30]
Swater--0.9[30]
Tbase—base temperature for biomass growth; Topt—optimal temperature for biomass growth; I50maxH—maximum daily reduction in I50B due to heat stress; I50maxW—maximum daily reduction in I50B due to water stress; RUE—radiation use efficiency (above ground only and without respiration); Tmax—threshold temperature to start accelerating senescence from heat stress; Text—extreme temperature threshold when RUE becomes 0 owing to heat stress; SCO2—crop-specific sensitivity of RUE to elevated CO2; SWater—sensitivity of RUE to the ARID index. --—no data.
Table 4. Cultivar parameters of the SIMPLE model for flax.
SitesCultivarTsumHII50AI50BSource of Data
Dingxi and WulanchabuLongya Hybrid No. 123500.30530500Calibrated
DatongZhangya No. 228500.43600550Calibrated
ZhangjiakouBaxuan No. 322850.30680650Calibrated
Tsum—thermal time requirement from sowing to maturity (°C day); HI—potential harvest index; I50A—thermal time requirement for leaf area development to intercepted 50% of radiation (°C day); I50B—thermal time till maturity to reach 50% radiation interception due to leaf senescence (°C day).
Table 5. Statistical summary for calibration of the SIMPLE-Flax model.
SiteYearBiomassGrain YieldfSolar
RMSE (kg ha1)d-IndexRMSE (kg ha1)RRMSE (%)RMSE
Dingxi20176120.37853.30.396
Zhangjiakou20172130.89482.90.208
Wulanchabu20162250.85463.30.448
Datong20162120.9121213.80.435
Table 6. Statistics for the evaluation of the SIMPLE-Flax model.
SiteYearBiomassYieldfSolar
RMSE (kg h1)d-IndexRMSE (kg ha−1)RRMSE (%)RMSE
Dingxi201812390.695520.440
Zhangjiakou20181350.9050.40.530
Wulanchabu20172800.95634.80.669
Datong20171400.971769.10.544
Publisher’s Note: MDPI stays neutral with regard to jurisdictional claims in published maps and institutional affiliations.