
Climate Change Projections for Bioclimatic Distribution of Castanea sativa in Portugal


Abstract
:1. Introduction
2. Materials and Methods
2.1. Land Use Maps
2.2. Meteorological Variables and Climate Projections
2.3. Bias Correction and Downscaling of the EURO-CORDEX Dataset
2.4. Bioclimatic Indices
2.5. Optimum Bioclimatic Thresholds
- (i)
- (ii)
- (iii)
- (iv)
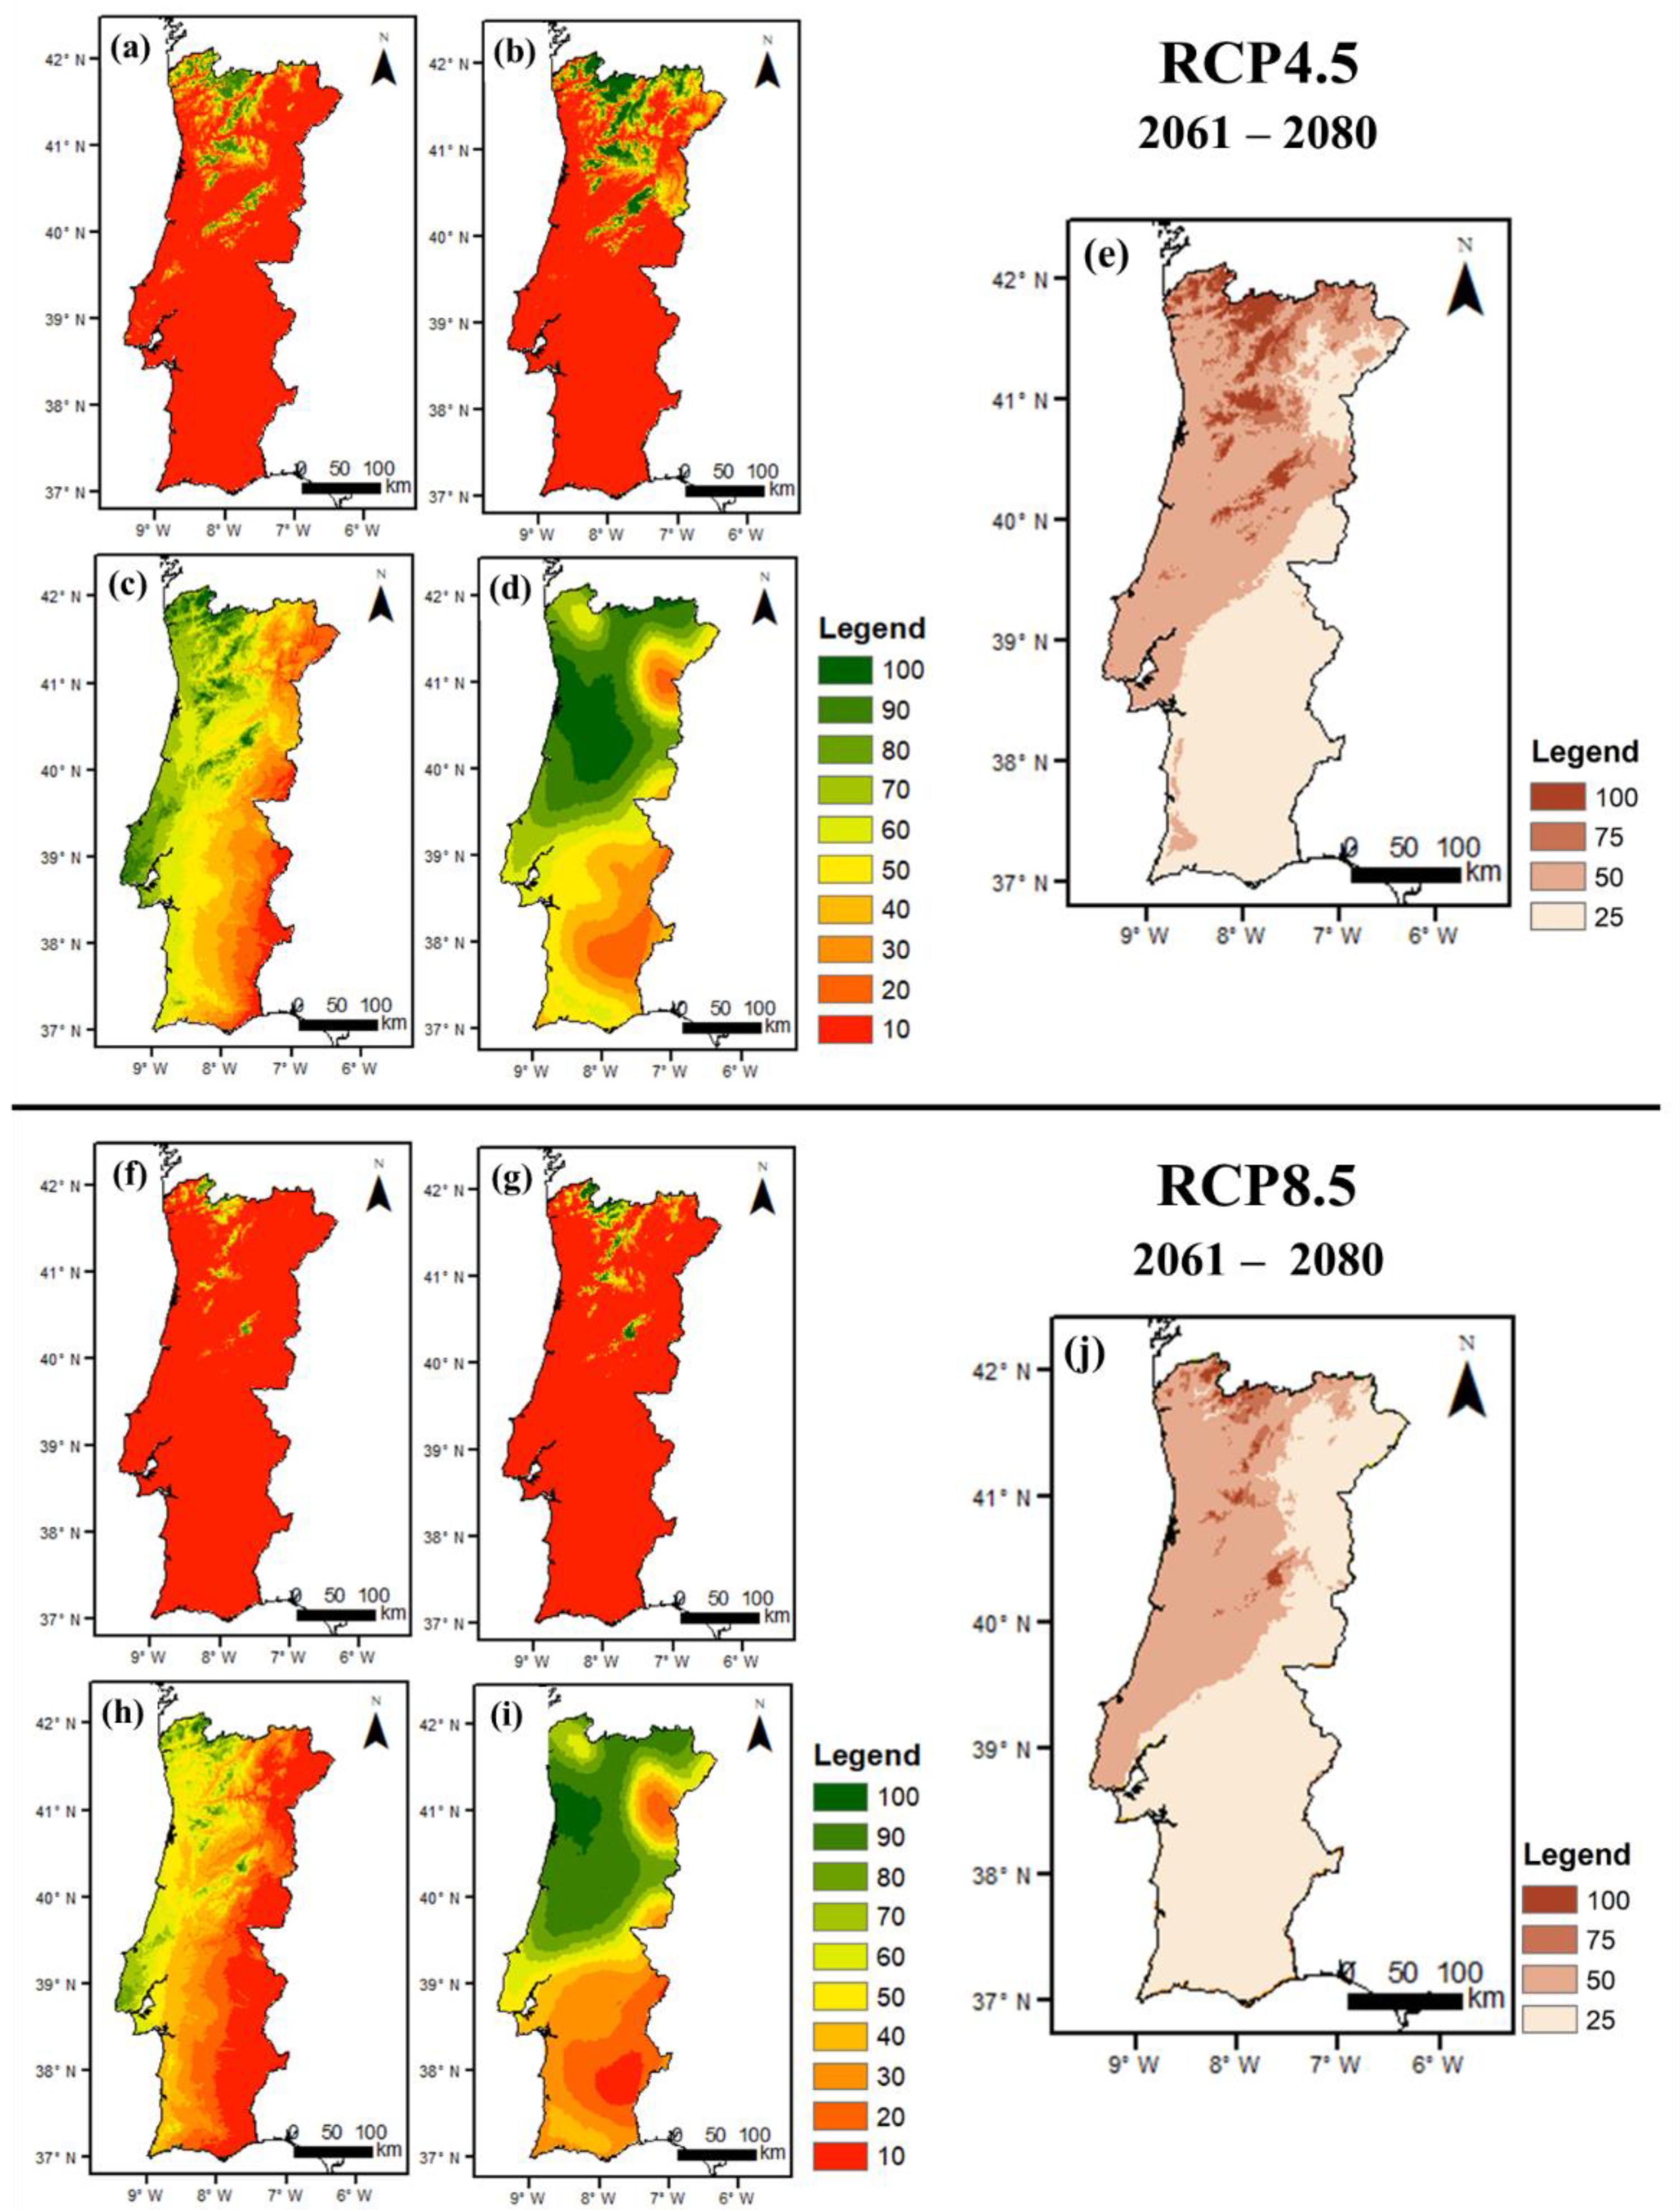
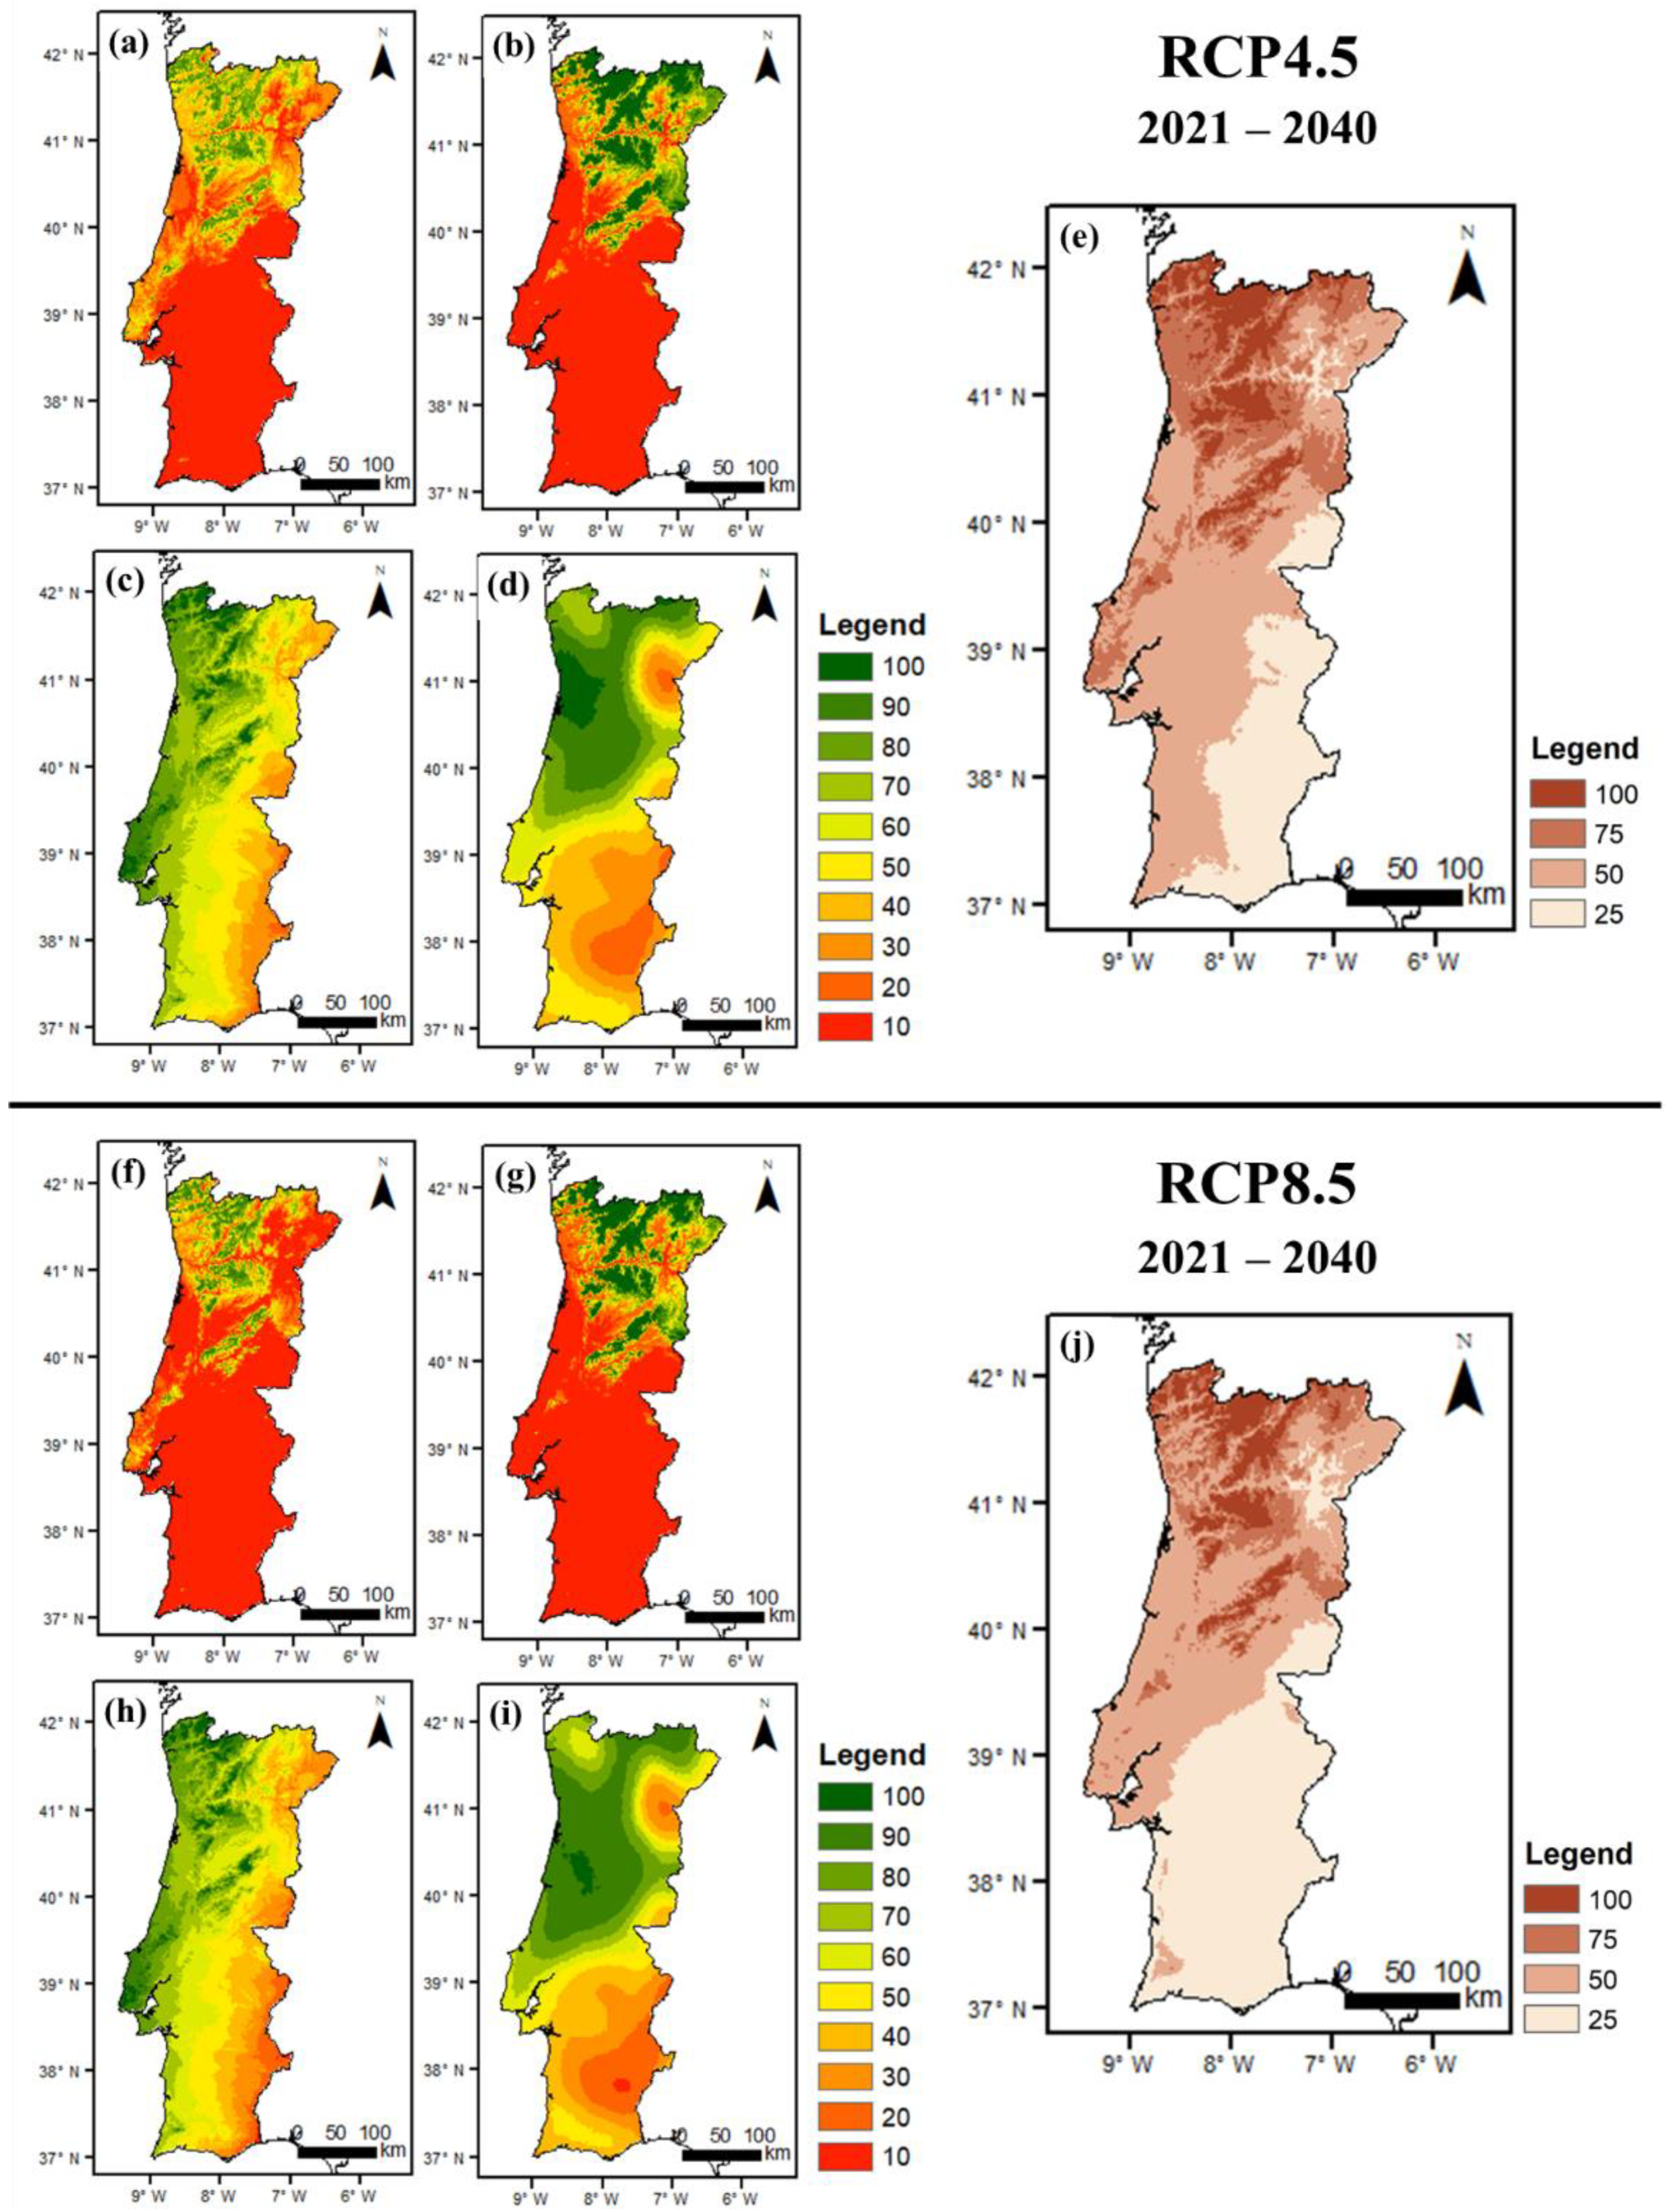
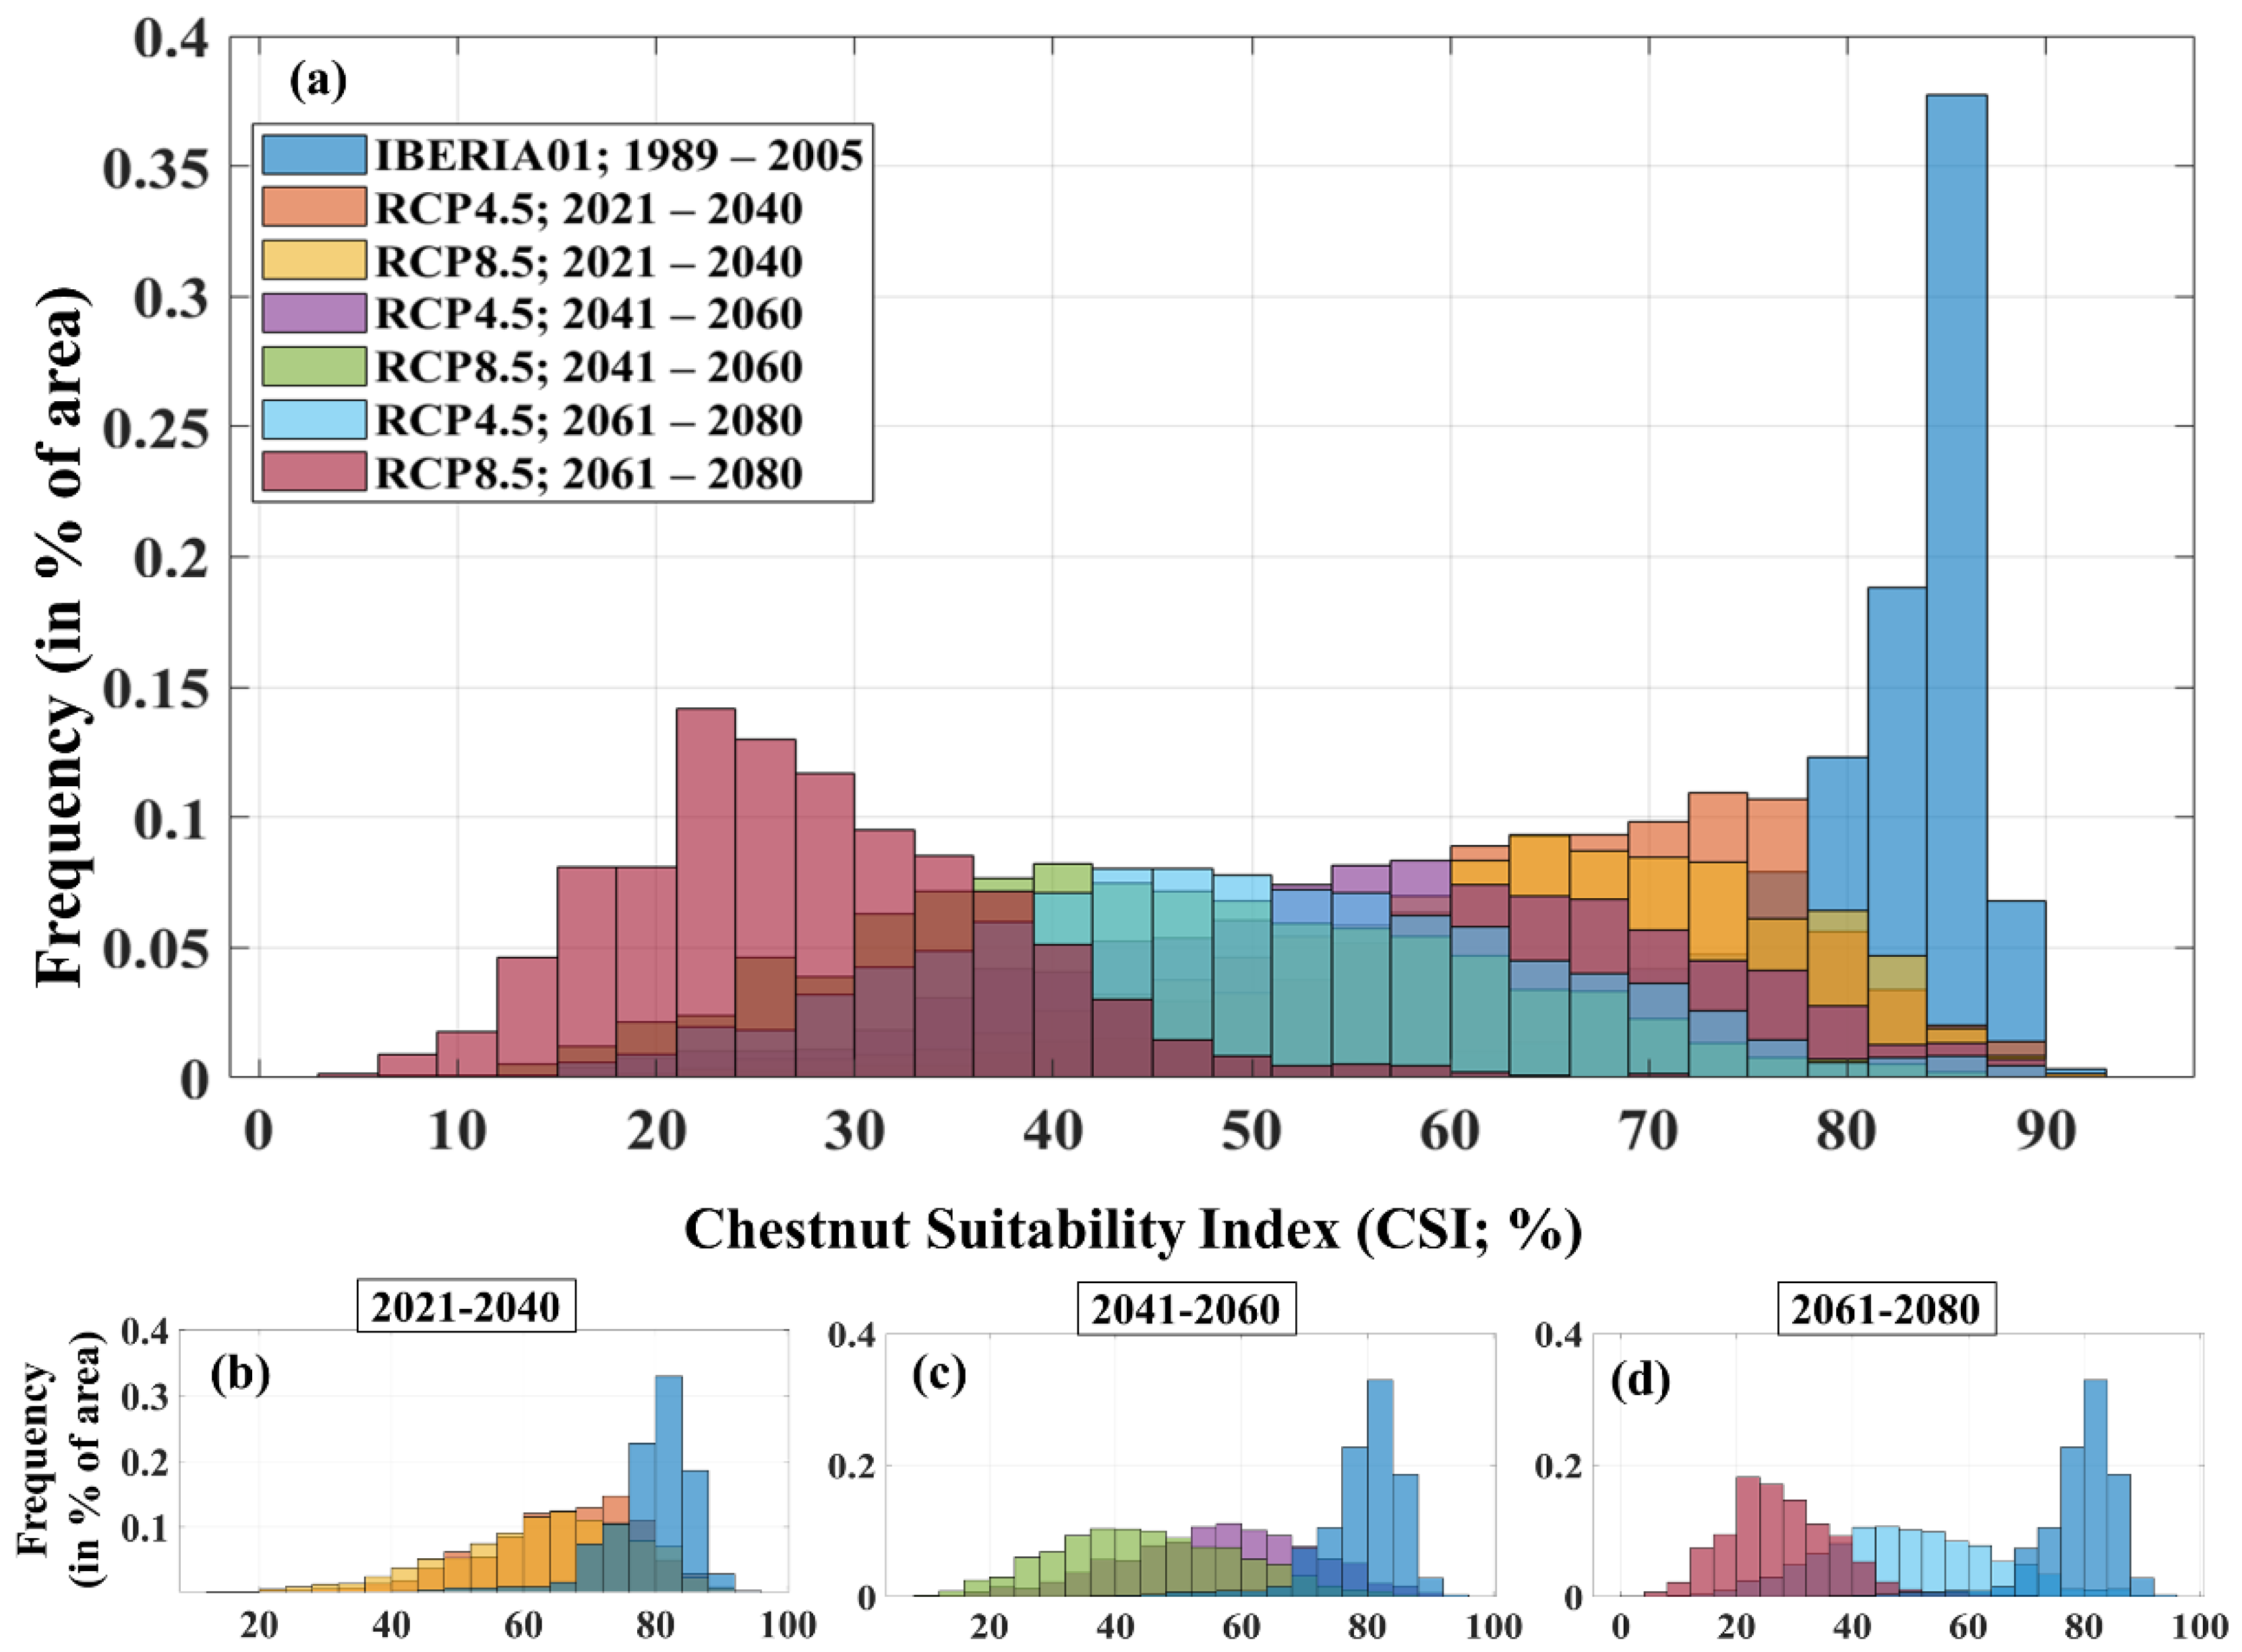
3. Results
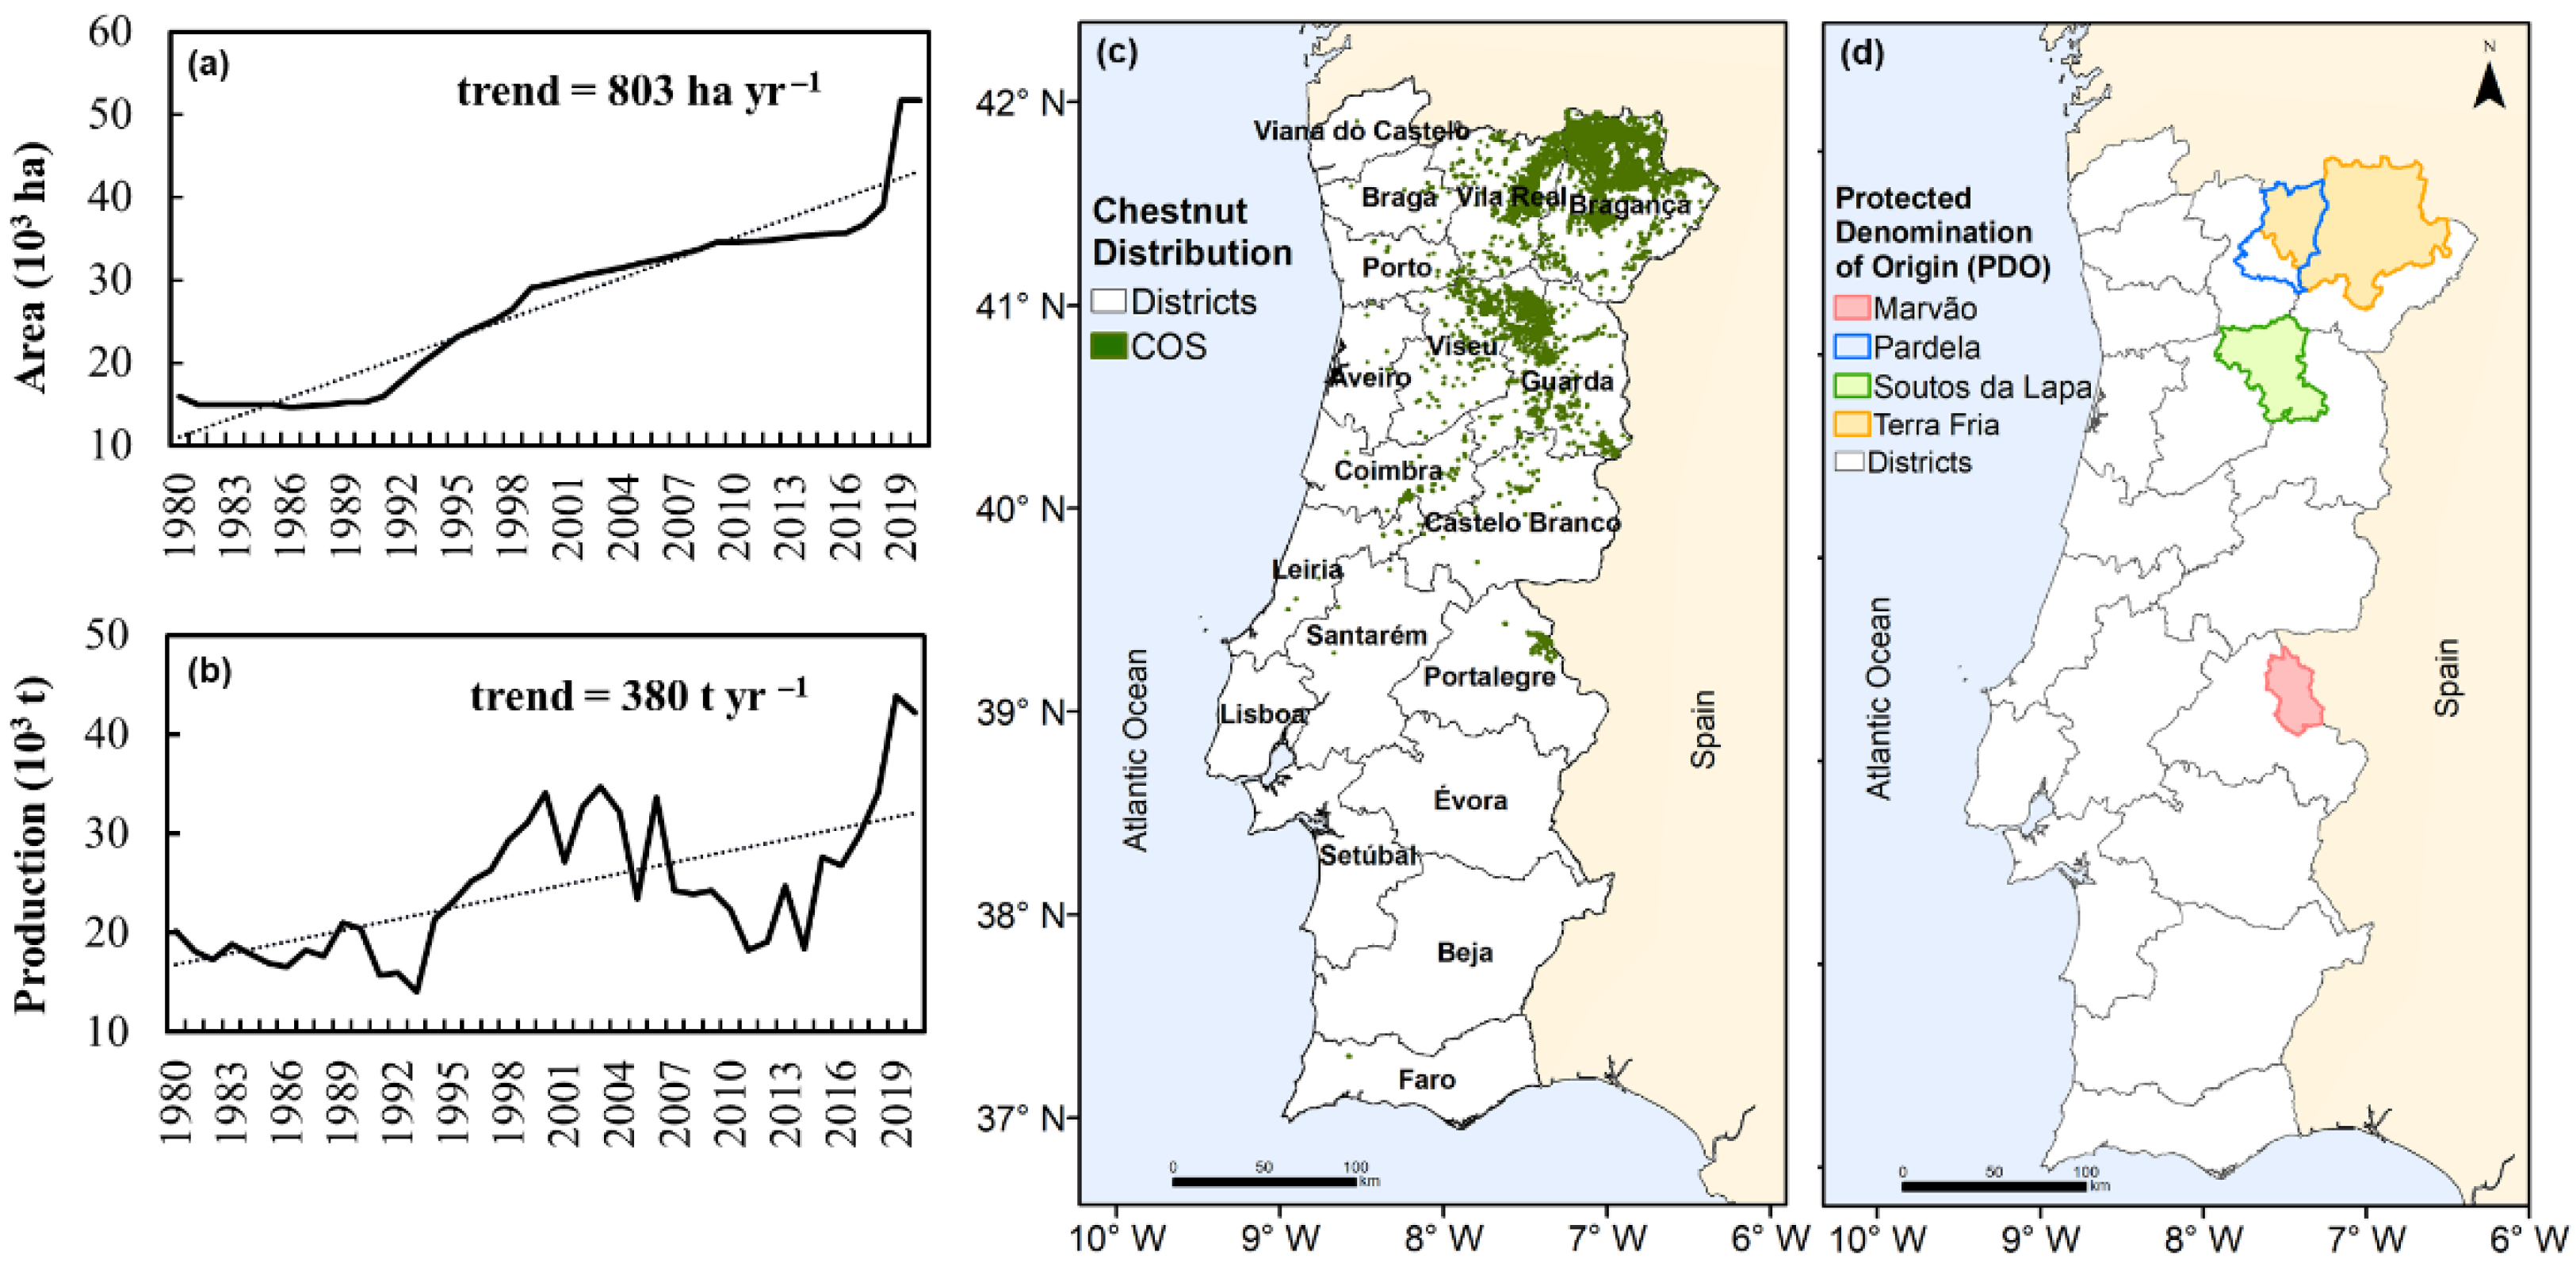
3.1. Current Chestnut Tree Distribution vs. Optimal Zoning
3.2. Bioclimatic Indices
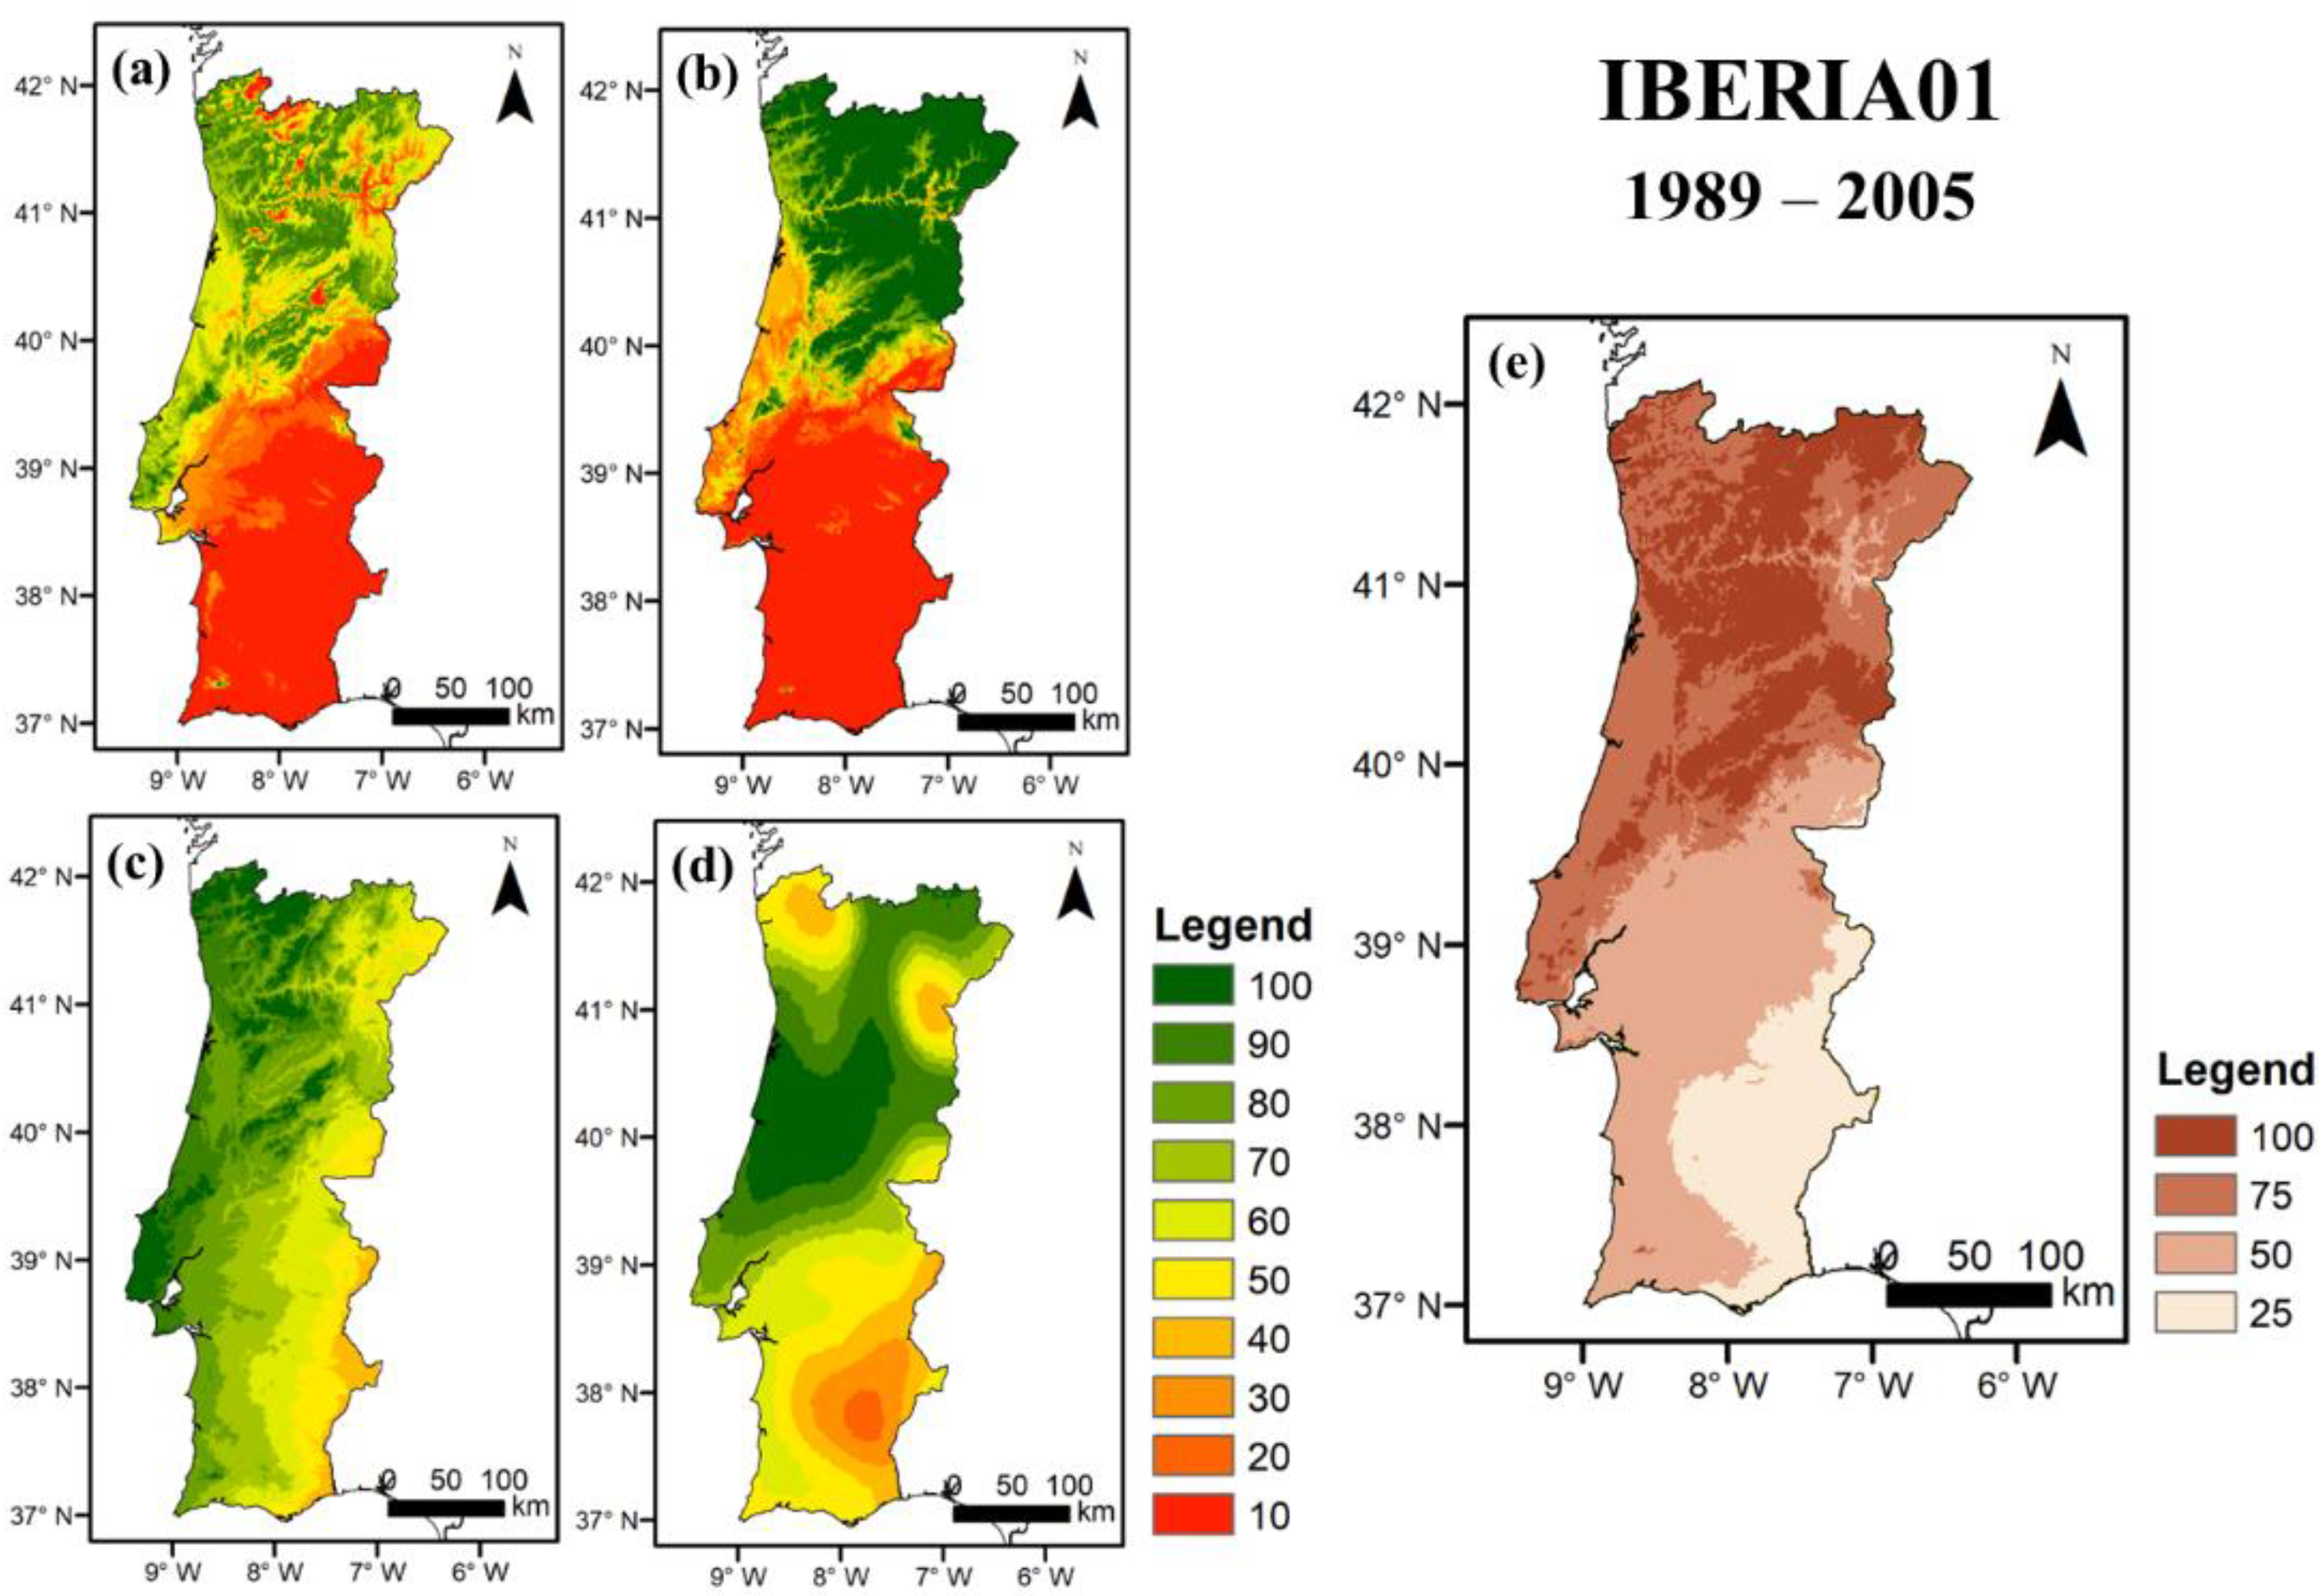
3.2.1. Current Conditions
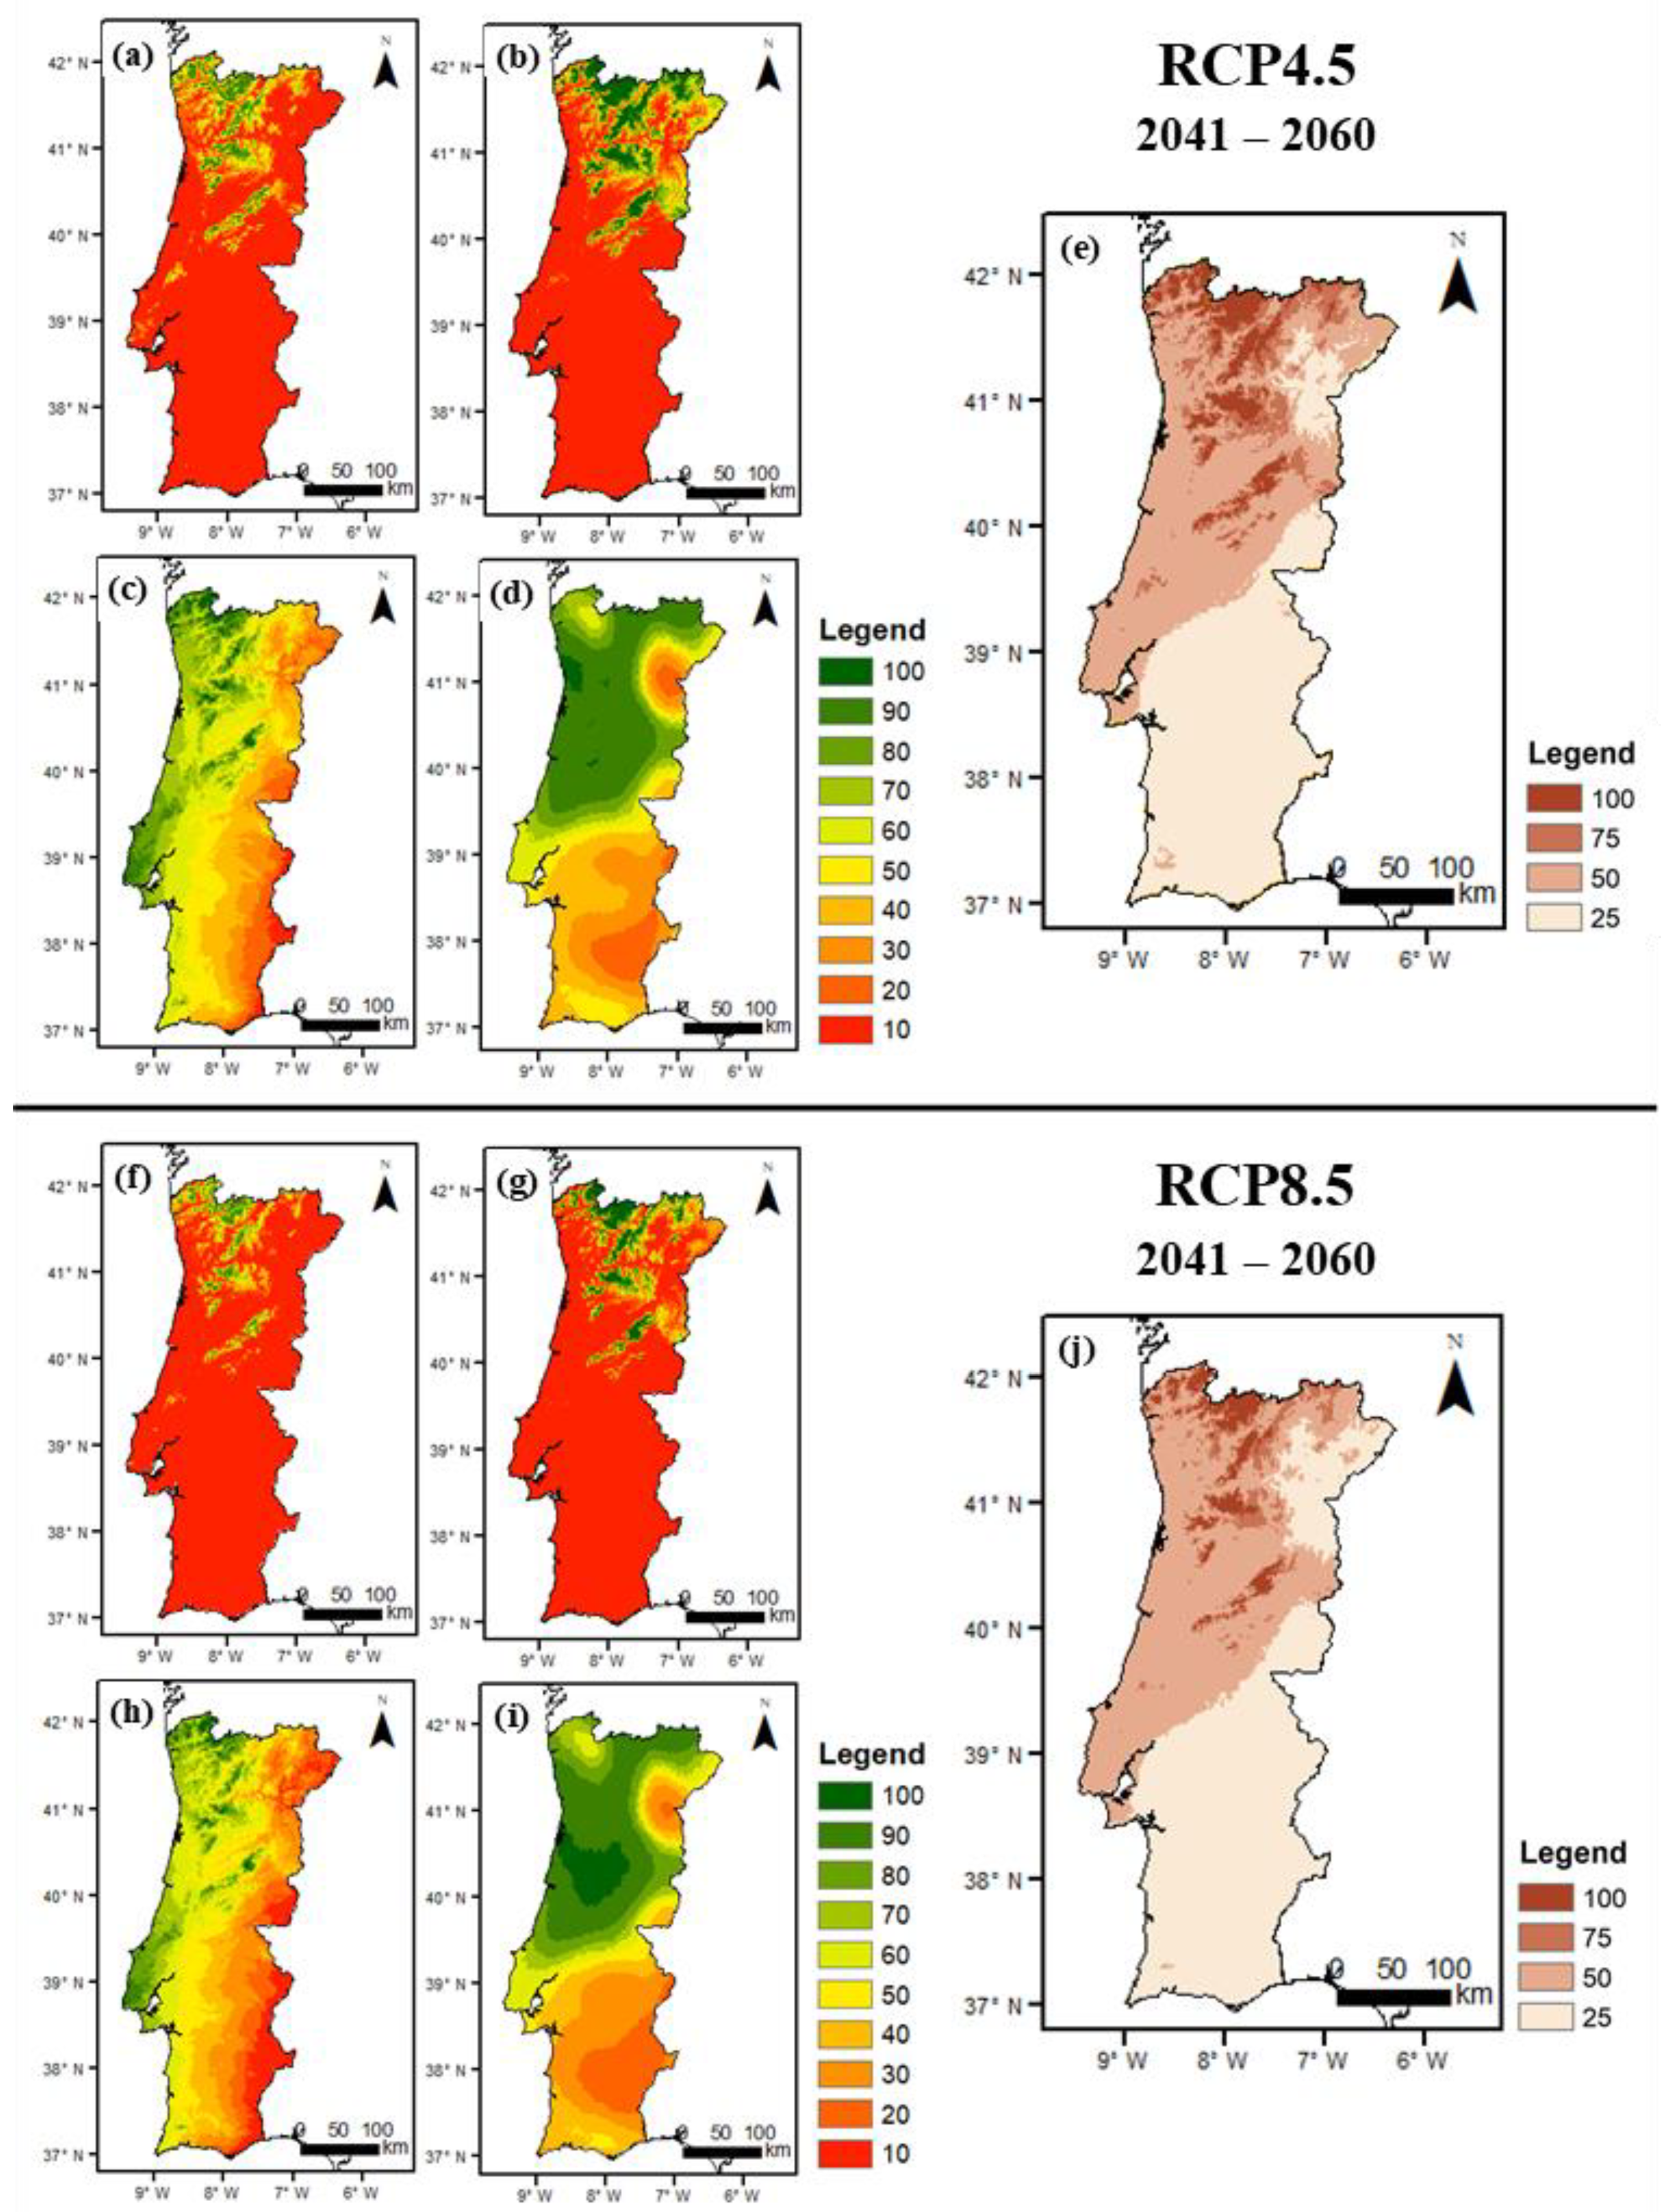
3.2.2. Future Conditions
4. Discussion
5. Conclusions
Author Contributions
Funding
Data Availability Statement
Conflicts of Interest
References
- Dinis, L.T.; Peixoto, F.; Pinto, T.; Costa, R.; Bennett, R.N.; Gomes-Laranjo, J. Study of morphological and phenological diversity in chestnut trees (“Judia” variety) as a function of temperature sum. Environ. Exp. Bot. 2011, 70, 110–120. [Google Scholar] [CrossRef]
- Massantini, R.; Moscetti, R.; Frangipane, M.T. Evaluating progress of chestnut quality: A review of recent developments. Trends Food Sci. Technol. 2021, 113, 245–254. [Google Scholar] [CrossRef]
- FAOSTAT Crops. Available online: https://www.fao.org/faostat/en/#data/QCL (accessed on 10 March 2022).
- Freitas, T.R.; Santos, J.A.; Silva, A.P.; Fraga, H. Influence of climate change on chestnut trees: A review. Plants 2021, 10, 1463. [Google Scholar] [CrossRef] [PubMed]
- Carneiro-Carvalho, A.; Pinto, T.; Ferreira, H.; Martins, L.; Pereira, C.; Gomes-Laranjo, J.; Anjos, R. Effect of silicon fertilization on the tolerance of Castanea sativa Mill. seedlings against Cryphonectria parasitica Barr. J. Plant Dis. Prot. 2020, 127, 197–210. [Google Scholar] [CrossRef]
- Ferreira-Cardoso, J.; Portela, E.; Abreu, C.G. Castanheiros. In Programa Agro; Universidade de Trás-os-Montes e Alto Douro: Vila Real, Portugal, 2007. [Google Scholar]
- Santos, M.; Fraga, H.; Belo-Pereira, M.; Santos, J.A. Assessment of growing thermal conditions of main fruit species in Portugal based on hourly records from a weather station network. Appl. Sci. 2019, 9, 3782. [Google Scholar] [CrossRef] [Green Version]
- Direção-Geral do Território Cartografia de Uso e Ocupação do Solo—2007. Available online: http://www.dgterritorio.pt/ (accessed on 15 March 2021).
- Baptista, P.; Martins, A.; Tavares, R.M.; Lino-Neto, T. Diversity and fruiting pattern of macrofungi associated with chestnut (Castanea sativa) in the Trás-os-Montes region (Northeast Portugal). Fungal Ecol. 2010, 3, 9–19. [Google Scholar] [CrossRef] [Green Version]
- Gomes-Laranjo, J.; Peixoto, F.; Wong Fong Sang, H.W.; Torres-Pereira, J. Study of the temperature effect in three chestnut (Castanea sativa Mill.) cultivars’ behaviour. J. Plant Physiol. 2006, 163, 945–955. [Google Scholar] [CrossRef]
- Carneiro-Carvalho, A.; Vilela, A.; Ferreira-Cardoso, J.; Marques, T.; Anjos, R.; Gomes-Laranjo, J.; Pinto, T. Productivity, chemical composition and sensory quality of “Martaínha” chestnut variety treated with Silicon. CYTA J. Food 2019, 17, 316–323. [Google Scholar] [CrossRef]
- Pérez-Girón, J.C.; Álvarez-Álvarez, P.; Díaz-Varela, E.R.; Mendes Lopes, D.M. Influence of climate variations on primary production indicators and on the resilience of forest ecosystems in a future scenario of climate change: Application to sweet chestnut agroforestry systems in the Iberian Peninsula. Ecol. Indic. 2020, 113, 106199. [Google Scholar] [CrossRef]
- Dinis, L.T.; Ferreira-Cardoso, J.; Peixoto, F.; Costa, R.; Gomes-Laranjo, J. Study of morphological and chemical diversity in chestnut trees (var. “judia”) as a function of temperature sum. CYTA J. Food 2011, 9, 192–199. [Google Scholar] [CrossRef]
- Menéndez, M.M.; Álvarez, Á.P.; Majada, J.; Canga, E. Effects of soil nutrients and environmental factors on site productivity in Castanea sativa Mill. coppice stands in NW Spain. New For. 2015, 46, 217–233. [Google Scholar] [CrossRef]
- Guo, L.; Dai, J.; Ranjitkar, S.; Xu, J.; Luedeling, E. Response of chestnut phenology in China to climate variation and change. Agric. For. Meteorol. 2013, 180, 164–172. [Google Scholar] [CrossRef]
- Furones Pérez, P.; Fernández López, J. Morphological and phenological description of 38 sweet chestnut cultivars (Castanea sativa Miller) in a contemporary collection. Span. J. Agric. Res. 2009, 7, 829. [Google Scholar] [CrossRef] [Green Version]
- Casazza, G.; Malfatti, F.; Brunetti, M.; Simonetti, V.; Mathews, A.S. Interactions between land use, pathogens, and climate change in the Monte Pisano, Italy 1850–2000. Landsc. Ecol. 2021, 36, 601–616. [Google Scholar] [CrossRef]
- Conedera, M.; Krebs, P.; Gehring, E.; Wunder, J.; Hulsmann, L.; Abegg, M.; Maringer, J. How future-proof is Sweet chestnut (Castanea sativa) in a global change context? For. Ecol. Manag. 2021, 494, 119320. [Google Scholar] [CrossRef]
- Bellat, J.-L.; Dasue, J.; Guérin, B.; Gomes-Laranjo, J.; Fernandez, J.; Castelloti, T.; Beccaro, G.; Forget, L. European Chestnut White Paper; EUROCASTANEA/AREFLH: Bordeaux, France, 2019. [Google Scholar]
- Santos, J.A.; Costa, R.; Fraga, H. Climate change impacts on thermal growing conditions of main fruit species in Portugal. Clim. Change 2017, 140, 273–286. [Google Scholar] [CrossRef]
- Larue, C.; Barreneche, T.; Petit, J. Scientia Horticulturae Efficient monitoring of phenology in chestnuts. Sci. Hortic. 2021, 281, 109958. [Google Scholar] [CrossRef]
- Portela, E.; Ferreira-Cardoso, J.; Louzada, J.; Gomes-Laranjo, J. Assessment of Boron Application in Chestnuts: Nut Yield and Quality. J. Plant Nutr. 2015, 38, 973–987. [Google Scholar] [CrossRef]
- Iglesias, A.; Quiroga, S.; Moneo, M.; Garrote, L. From climate change impacts to the development of adaptation strategies: Challenges for agriculture in Europe. Clim. Change 2012, 112, 143–168. [Google Scholar] [CrossRef]
- Pereira, M.G.; Caramelo, L.; Gouveia, C.; Gomes-Laranjo, J.; Magalhães, M. Assessment of weather-related risk on chestnut productivity. Nat. Hazards Earth Syst. Sci. 2011, 11, 2729–2739. [Google Scholar] [CrossRef] [Green Version]
- Bindi, M.; Olesen, J.E. The responses of agriculture in Europe to climate change. Reg. Environ. Change 2011, 11, 151–158. [Google Scholar] [CrossRef]
- Fraga, H.; Moriondo, M.; Leolini, L.; Santos, J.A. Mediterranean Olive Orchards under Climate Change: A Review of Future Impacts and Adaptation Strategies. Agronomy 2020, 11, 56. [Google Scholar] [CrossRef]
- Costa, R.; Fraga, H.; Fernandes, P.M.; Santos, J.A. Implications of future bioclimatic shifts on Portuguese forests. Reg. Environ. Change 2017, 17, 117–127. [Google Scholar] [CrossRef]
- Fraga, H.; Santos, J.A. Assessment of Climate Change Impacts on Chilling and Forcing for the Main Fresh Fruit Regions in Portugal. Front. Plant Sci. 2021, 12, 1263. [Google Scholar] [CrossRef]
- Santos, M.; Fonseca, A.; Fraga, H.; Jones, G.V.; Santos, J.A. Bioclimatic conditions of the Portuguese wine denominations of origin under changing climates. Int. J. Climatol. 2020, 40, 927–941. [Google Scholar] [CrossRef]
- Fraga, H.; Guimar, N.; Freitas, T.R.; Malheiro, A.C.; Santos, J.A. Future Scenarios for Olive Tree and Grapevine Potential Yields in the World Heritage Côa Region, Portugal. Agronomy 2022, 12, 14. [Google Scholar] [CrossRef]
- Fraga, H.; Guimarães, N.; Santos, J.A. Future changes in rice bioclimatic growing conditions in Portugal. Agronomy 2019, 9, 674. [Google Scholar] [CrossRef] [Green Version]
- Fraga, H.; Pinto, J.G.; Santos, J.A. Olive tree irrigation as a climate change adaptation measure in Alentejo, Portugal. Agric. Water Manag. 2020, 237, 106193. [Google Scholar] [CrossRef]
- Rahman, I.U.; Hart, R.; Afzal, A.; Iqbal, Z.; Abdallah, E.F.; Alqarawi, A.A.; Ijaz, F.; Ali, N.; Kausar, R.; Muzammil, S.; et al. Phenological plasticity in berberis lycium royle along temporal and altitudinal gradients. Appl. Ecol. Environ. Res. 2019, 17, 331–341. [Google Scholar] [CrossRef]
- Blanco-Ward, D.; Monteiro, A.; Lopes, M.; Borrego, C.; Silveira, C.; Viceto, C.; Rocha, A.; Ribeiro, A.; Andrade, J.; Feliciano, M.; et al. Climate change impact on a wine-producing region using a dynamical downscaling approach: Climate parameters, bioclimatic indices and extreme indices. Int. J. Climatol. 2019, 39, 5741–5760. [Google Scholar] [CrossRef]
- Fraga, H.; Pinto, J.G.; Viola, F.; Santos, J.A. Climate change projections for olive yields in the Mediterranean Basin. Int. J. Climatol. 2020, 40, 769–781. [Google Scholar] [CrossRef] [Green Version]
- EURO-CORDEX Data European nodes. Available online: https://esgf-data.dkrz.de/search/cordex-dkrz/ (accessed on 31 March 2021).
- Jacob, D.; Petersen, J.; Eggert, B.; Alias, A.; Christensen, O.B.; Bouwer, L.M.; Braun, A.; Colette, A.; Déqué, M.; Georgievski, G.; et al. EURO-CORDEX: New high-resolution climate change projections for European impact research. Reg. Environ. Change 2014, 14, 563–578. [Google Scholar] [CrossRef]
- Thomson, A.M.; Calvin, K.V.; Smith, S.J.; Kyle, G.P.; Volke, A.; Patel, P.; Delgado-Arias, S.; Bond-Lamberty, B.; Wise, M.A.; Clarke, L.E.; et al. RCP4.5: A pathway for stabilization of radiative forcing by 2100. Clim. Change 2011, 109, 77–94. [Google Scholar] [CrossRef] [Green Version]
- Barredo, J.I.; Caudullo, J.I.; Mauri, G. Mediterranean Habitat Loss under RCP4.5 and RCP8.5 Climate Change Projections; Assessing impacts on the Nature 2000 protected area network, EUR 28547 EN; Publications Office of the European Union: Luxemburg, 2017. [Google Scholar] [CrossRef]
- Cofiño, A.S.; Bedia, J.; Iturbide, M.; Vega, M.; Herrera, S.; Fernández, J.; Frías, M.D.; Manzanas, R.; Gutiérrez, J.M. The ECOMS User Data Gateway: Towards seasonal forecast data provision and research reproducibility in the era of Climate Services. Clim. Serv. 2018, 9, 33–43. [Google Scholar] [CrossRef]
- Fei, S.; Liang, L.; Paillet, F.L.; Steiner, K.C.; Fang, J.; Shen, Z.; Wang, Z.; Hebard, F.V. Modelling chestnut biogeography for American chestnut restoration. Divers. Distrib. 2012, 18, 754–768. [Google Scholar] [CrossRef] [Green Version]
- Mesquita, S.; Sousa, A.J. Bioclimatic mapping using geostatistical approaches: Application to mainland Portugal. Int. J. Climatol. 2009, 29, 2156–2170. [Google Scholar] [CrossRef]
- Arnold, C.Y. Maximum-Minimum temperatures as a basis for computing heat units. Proc. Am. Soc. Hortic. Sci. 1960, 76, 682–692. [Google Scholar]
- Henriques, C.; Borges, A. O Castanheiro:Estado da Produção; Centro Nacional de Competências dos Frutos Secos: Bragança, Portugal, 2017. [Google Scholar]
- Zhang, C.; Gomes-Laranjo, J.; Correia, C.M.; Moutinho-Pereira, J.M.; Carvalho Goncalves, B.; Bacelar, E.; Peixoto, F.P.; Galhano, V. Response, Tolerance and Adaptation to Abiotic Stress of Olive, Grapevine and Chestnut in the Mediterranean Region: Role of Abscisic Acid, Nitric Oxide and MicroRNAs. Plants Environ. 2011, 8, 179–206. [Google Scholar] [CrossRef] [Green Version]
- Calheiros, T.; Pereira, M.G.; Pinto, J.G.; Caramelo, L.; Gomes-Laranjo, J.; Dacamara, C.C. Assessing potential changes of Chestnut productivity in Europe under future climate conditions. Geophys. Res. Abstr. 2012, 14, 13–14. [Google Scholar] [CrossRef]
- Magness, J.R.; Traub, H.P. Climatic adaptation of fruit and nut crops. In Climate and Man; University Press of the Pacific: Honolulu, HI, USA, 1941; pp. 400–420. [Google Scholar]
- Rosenvald, K.; Lõhmus, K.; Rohula-Okunev, G.; Lutter, R.; Kupper, P.; Tullus, A. Elevated atmospheric humidity prolongs active growth period and increases leaf nitrogen resorption efficiency of silver birch. Oecologia 2020, 193, 449–460. [Google Scholar] [CrossRef]
- Andrade, C.; Fraga, H.; Santos, J.A. Climate change multi-model projections for temperature extremes in Portugal. Atmos. Sci. Lett. 2014, 15, 149–156. [Google Scholar] [CrossRef]
- Martins, J.; Fraga, H.; Fonseca, A.; Santos, J.A. Climate projections for precipitation and temperature indicators in the douro wine region: The importance of bias correction. Agronomy 2021, 11, 990. [Google Scholar] [CrossRef]
- Valentini, N.; Me, G.; Ferrero, R.; Spanna, F. Use of bioclimatic indexes to characterize phenological phases of apple varieties in Northern Italy. Int. J. Biometeorol. 2001, 45, 191–195. [Google Scholar] [CrossRef] [PubMed]
- Yılmaz, H. Weather response of sweet chestnut (Castanea sativa Mill.) radical growth increment in Belgrad forest. Fresenius Environ. Bull. 2015, 2, 2491–2495. [Google Scholar]
- Lobell, D.B.; Field, C.B.; Cahill, K.N.; Bonfils, C. Impacts of future climate change on California perennial crop yields: Model projections with climate and crop uncertainties. Agric. For. Meteorol. 2006, 141, 208–218. [Google Scholar] [CrossRef] [Green Version]
- Míguez-Soto, B.; Fernández-Cruz, J.; Fernández-López, J. Mediterranean and northern Iberian gene pools of wild Castanea sativa Mill. Are two differentiated ecotypes originated under natural divergent selection. PLoS ONE 2019, 14, e0211315. [Google Scholar] [CrossRef] [Green Version]
- Fonseca, A.R.; Santos, J.A. High-resolution temperature datasets in Portugal from a geostatistical approach: Variability and extremes. J. Appl. Meteorol. Climatol. 2018, 57, 627–644. [Google Scholar] [CrossRef]
- Costa, A.C.; Santos, J.A.; Pinto, J.G. Climate change scenarios for precipitation extremes in Portugal. Theor. Appl. Climatol. 2012, 108, 217–234. [Google Scholar] [CrossRef]
- Mathbout, S.; Lopez-Bustins, J.A.; Royé, D.; Martin-Vide, J.; Bech, J.; Rodrigo, F.S. Observed Changes in Daily Precipitation Extremes at Annual Timescale over the Eastern Mediterranean during 1961–2012. Pure Appl. Geophys. 2018, 175, 3875–3890. [Google Scholar] [CrossRef]
- Conedera, M.; Barthold, F.; Torriani, D.; Pezzatti, G.B. Drought sensitivity of Castanea sativa: Case study of summer 2003 in the Southern Alps. Acta Hortic. 2010, 866, 297–302. [Google Scholar] [CrossRef]
- Mota, M.; Pinto, T.; Vilela, A.; Marques, T.; Borges, A.; Caço, J.; Ferreira-Cardoso, J.; Raimundo, F.; Gomes-Laranjo, J. Irrigation positively affects the chestnut’s quality: The chemical composition, fruit size and sensory attributes. Sci. Hortic. 2018, 238, 177–186. [Google Scholar] [CrossRef]


| Institute | Global Climate Model | Regional Climate Model |
|---|---|---|
| Institut Pierre-Simon Laplace | IPSL IPSL CM5A MR | WRF331F |
| Koninklijk Nederlands Meteorologisch Instituut | ICHEC EC EARTH | RACMO22E |
| Max Planck Institute for Meteorology | MPI M MPI ESM LR | CCLM4-8-17 |
| Sveriges Meteorologiska och Hydrologiska Institut | CNRM CERFACS CNRM CM5 | RCA4 |
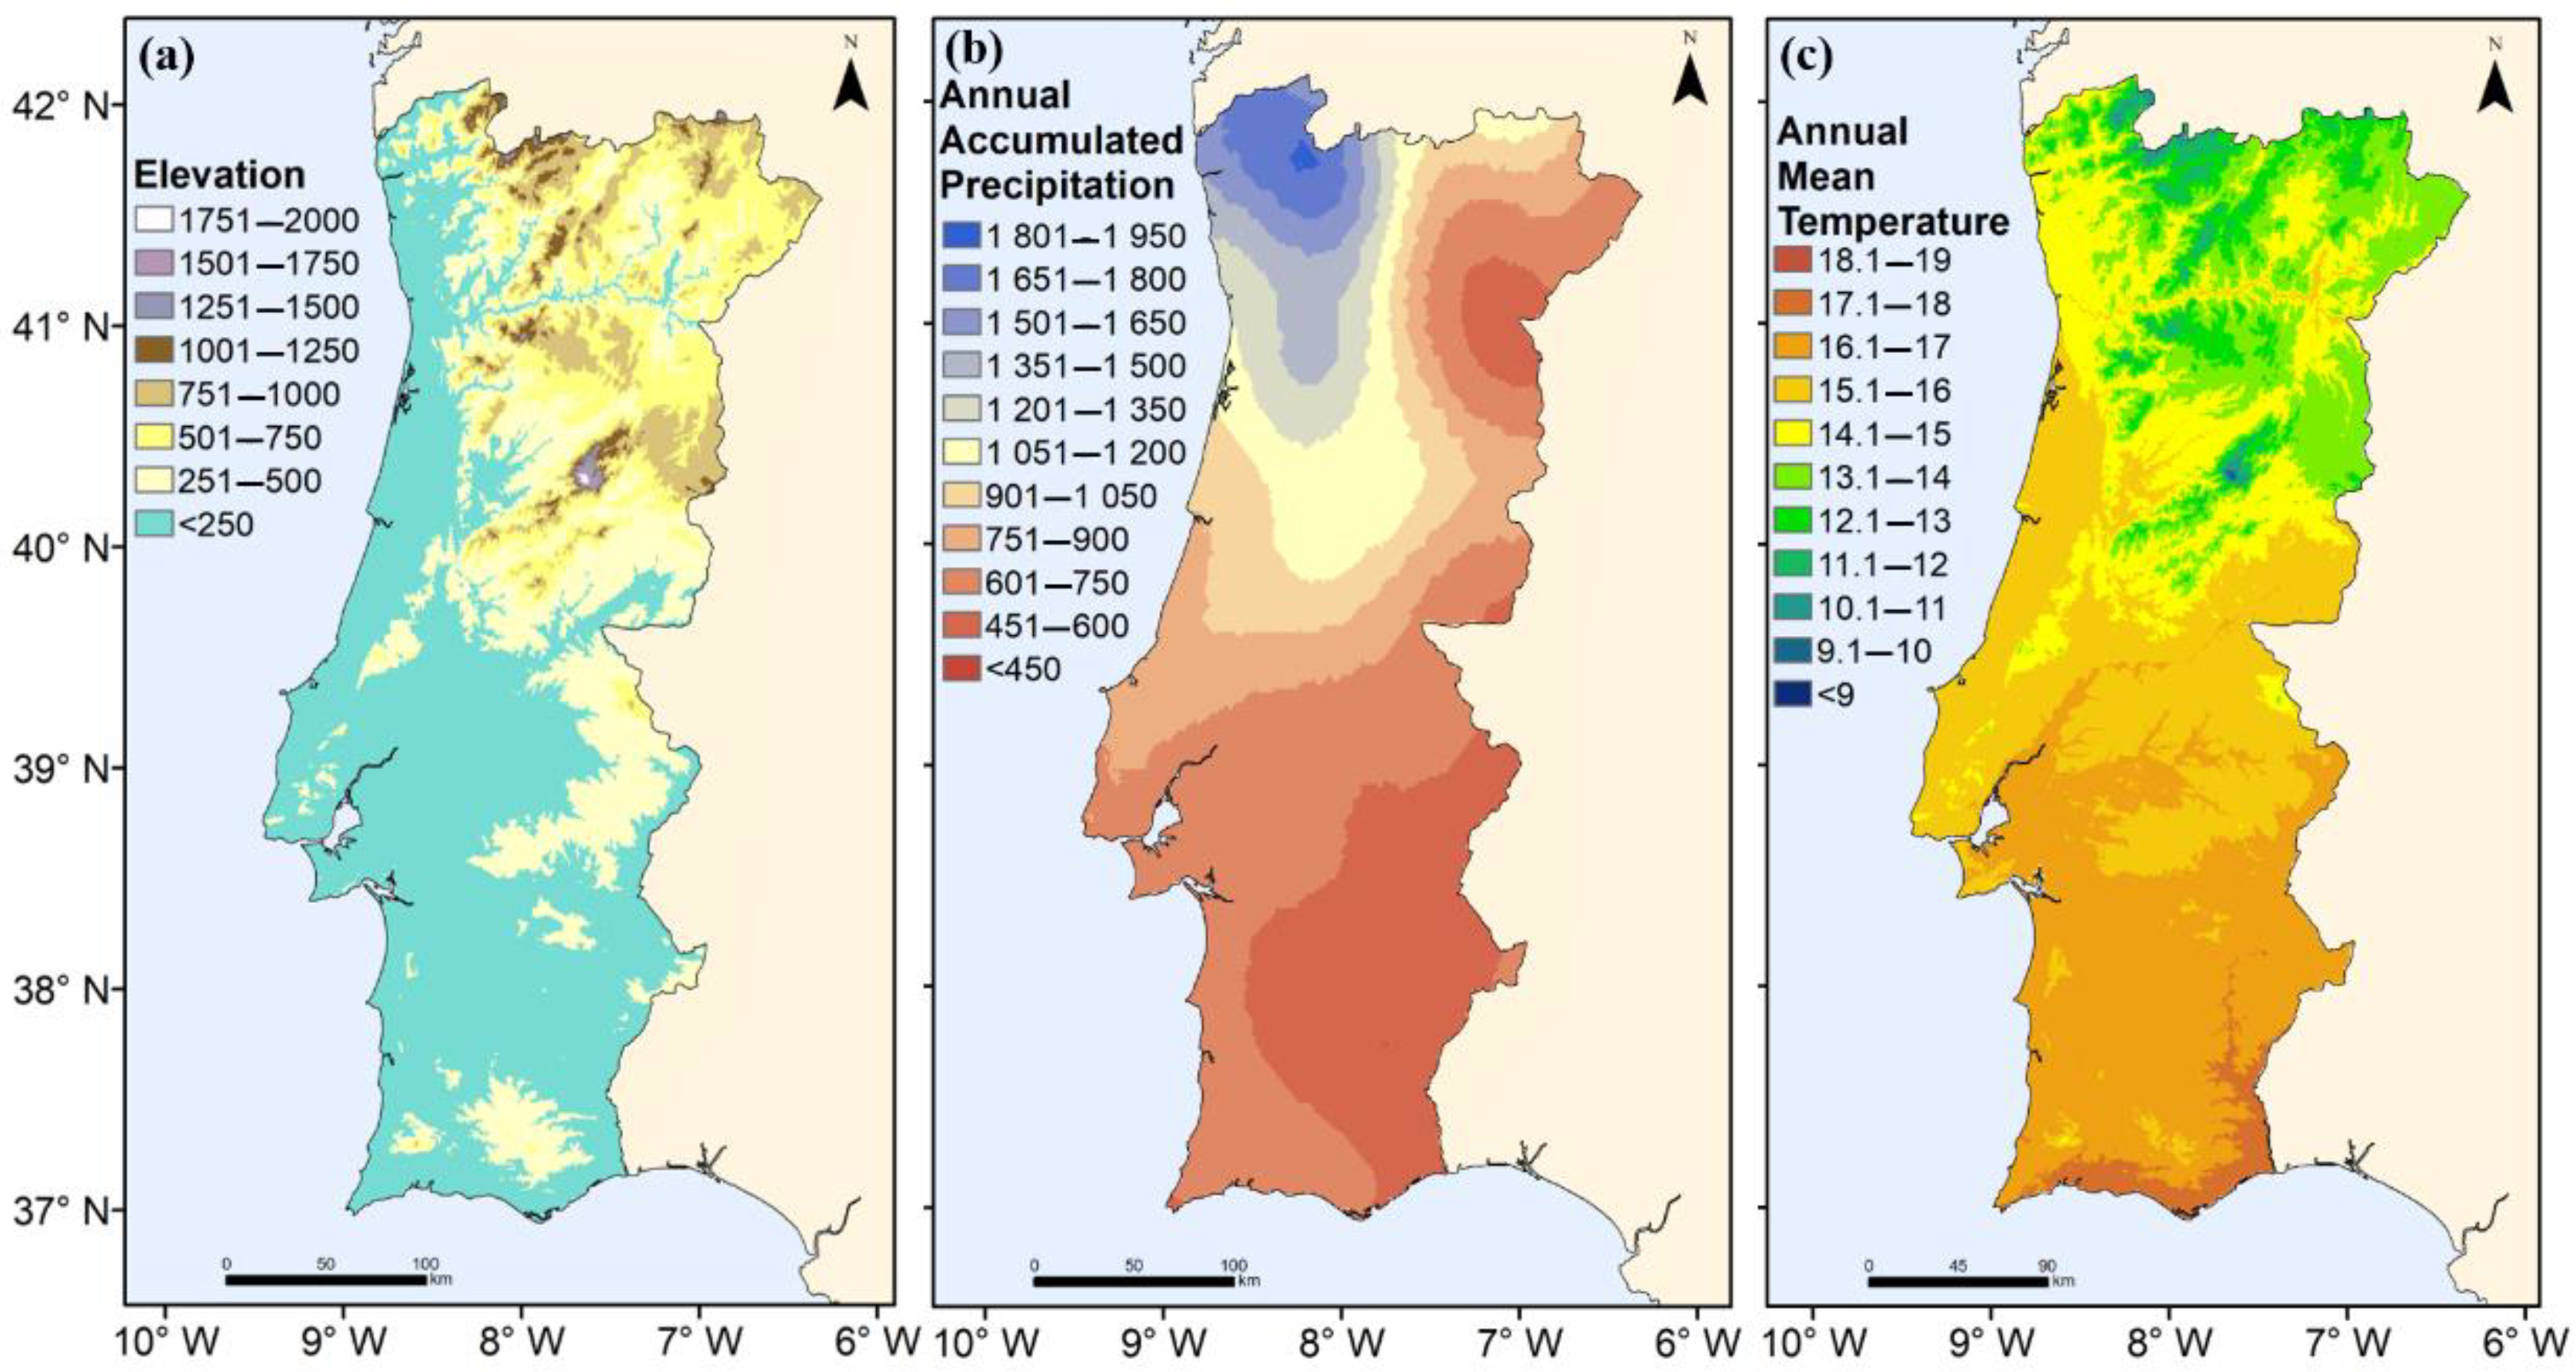
| Elevation (m) | Frequency (%) | Chestnut Cover Ratio (%) |
| 1751–2000 | <0.1 | <0.1 |
| 1501–1750 | <0.1 | <0.1 |
| 1251–1500 | <0.1 | <0.1 |
| 1001–1250 | 1.3 | 0.4 |
| 751–1000 | 61.3 | 3.7 |
| 501–750 | 34.5 | 1.1 |
| 251–500 | 2.6 | <0.1 |
| <250 | 0.3 | <0.1 |
| Mean temperature (°C) | Frequency (%) | Chestnut Cover Ratio (%) |
| 18.1–19 | <0.1 | <0.1 |
| 17.1–18 | <0.1 | <0.1 |
| 16.1–17 | <0.1 | <0.1 |
| 15.1–16 | 0.2 | <0.1 |
| 14.1–15 | 3.0 | <0.1 |
| 13.1–14 | 42.2 | 1.2 |
| 12.1–13 | 53.7 | 4.2 |
| 11.1–12 | 0.8 | 0.2 |
| 10.1–11 | <0.1 | <0.1 |
| 9.1–10 | <0.1 | <0.1 |
| <9 | <0.1 | <0.1 |
| Mean precipitation (mm) | Frequency (%) | Chestnut Cover Ratio (%) |
| 1801–1950 | <0.1 | <0.1 |
| 1651–1800 | <0.1 | <0.1 |
| 1501–1650 | 0.1 | <0.1 |
| 1351–1500 | 0.3 | <0.1 |
| 1201–1350 | 1.8 | 0.2 |
| 1051–1200 | 13.4 | 0.7 |
| 901–1050 | 29.4 | 1.3 |
| 751–900 | 35.1 | 1.1 |
| 601–750 | 19.0 | 0.3 |
| 451–600 | <0.1 | <0.1 |
| <450 | <0.1 | <0.1 |
Publisher’s Note: MDPI stays neutral with regard to jurisdictional claims in published maps and institutional affiliations. |
© 2022 by the authors. Licensee MDPI, Basel, Switzerland. This article is an open access article distributed under the terms and conditions of the Creative Commons Attribution (CC BY) license (https://creativecommons.org/licenses/by/4.0/).
Share and Cite
Freitas, T.R.; Santos, J.A.; Silva, A.P.; Martins, J.; Fraga, H. Climate Change Projections for Bioclimatic Distribution of Castanea sativa in Portugal. Agronomy 2022, 12, 1137. https://doi.org/10.3390/agronomy12051137
Freitas TR, Santos JA, Silva AP, Martins J, Fraga H. Climate Change Projections for Bioclimatic Distribution of Castanea sativa in Portugal. Agronomy. 2022; 12(5):1137. https://doi.org/10.3390/agronomy12051137
Chicago/Turabian StyleFreitas, Teresa R., João A. Santos, Ana P. Silva, Joana Martins, and Hélder Fraga. 2022. "Climate Change Projections for Bioclimatic Distribution of Castanea sativa in Portugal" Agronomy 12, no. 5: 1137. https://doi.org/10.3390/agronomy12051137
APA StyleFreitas, T. R., Santos, J. A., Silva, A. P., Martins, J., & Fraga, H. (2022). Climate Change Projections for Bioclimatic Distribution of Castanea sativa in Portugal. Agronomy, 12(5), 1137. https://doi.org/10.3390/agronomy12051137