
Influence of Water Management Farming Practices on Soil Organic Carbon and Nutrients: A Case Study of Rice Farming in Kilombero Valley, Tanzania


Abstract
:1. Introduction
2. Materials and Methods
2.1. Study Area
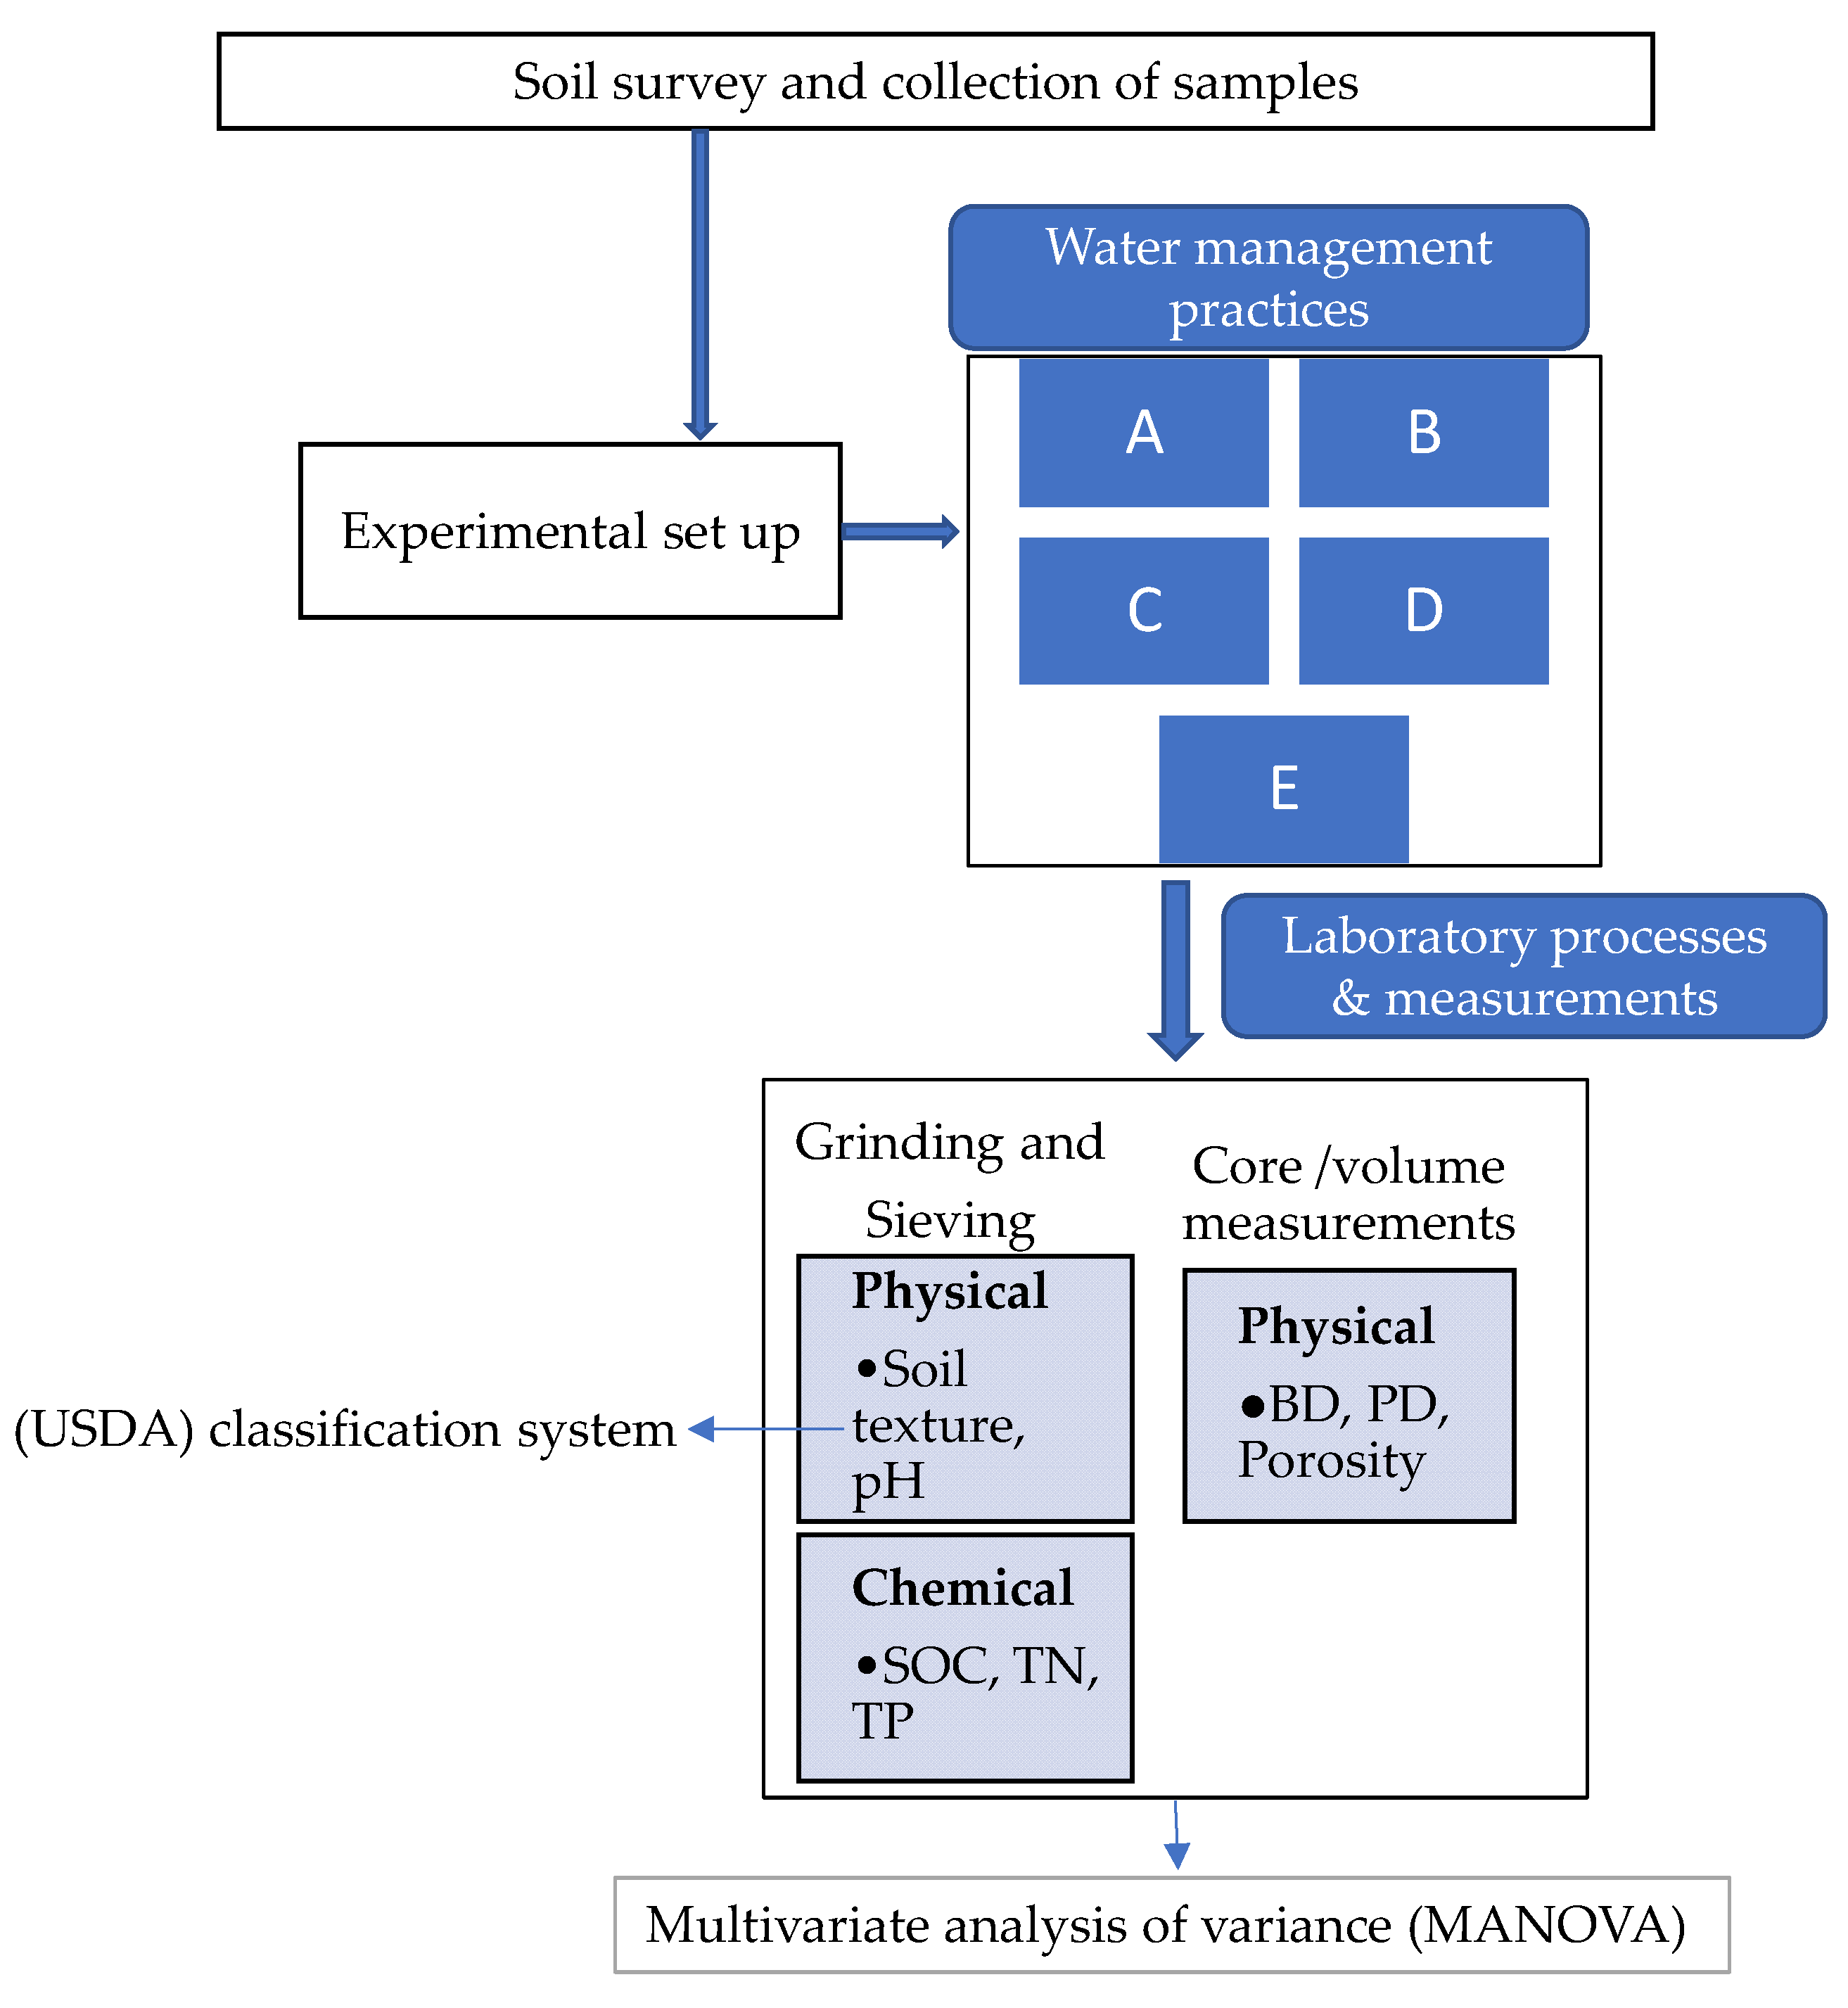
2.2. Sampling Design and Experimental Set up
2.3. Laboratory Analyses
2.4. Statistical Analyses
3. Results
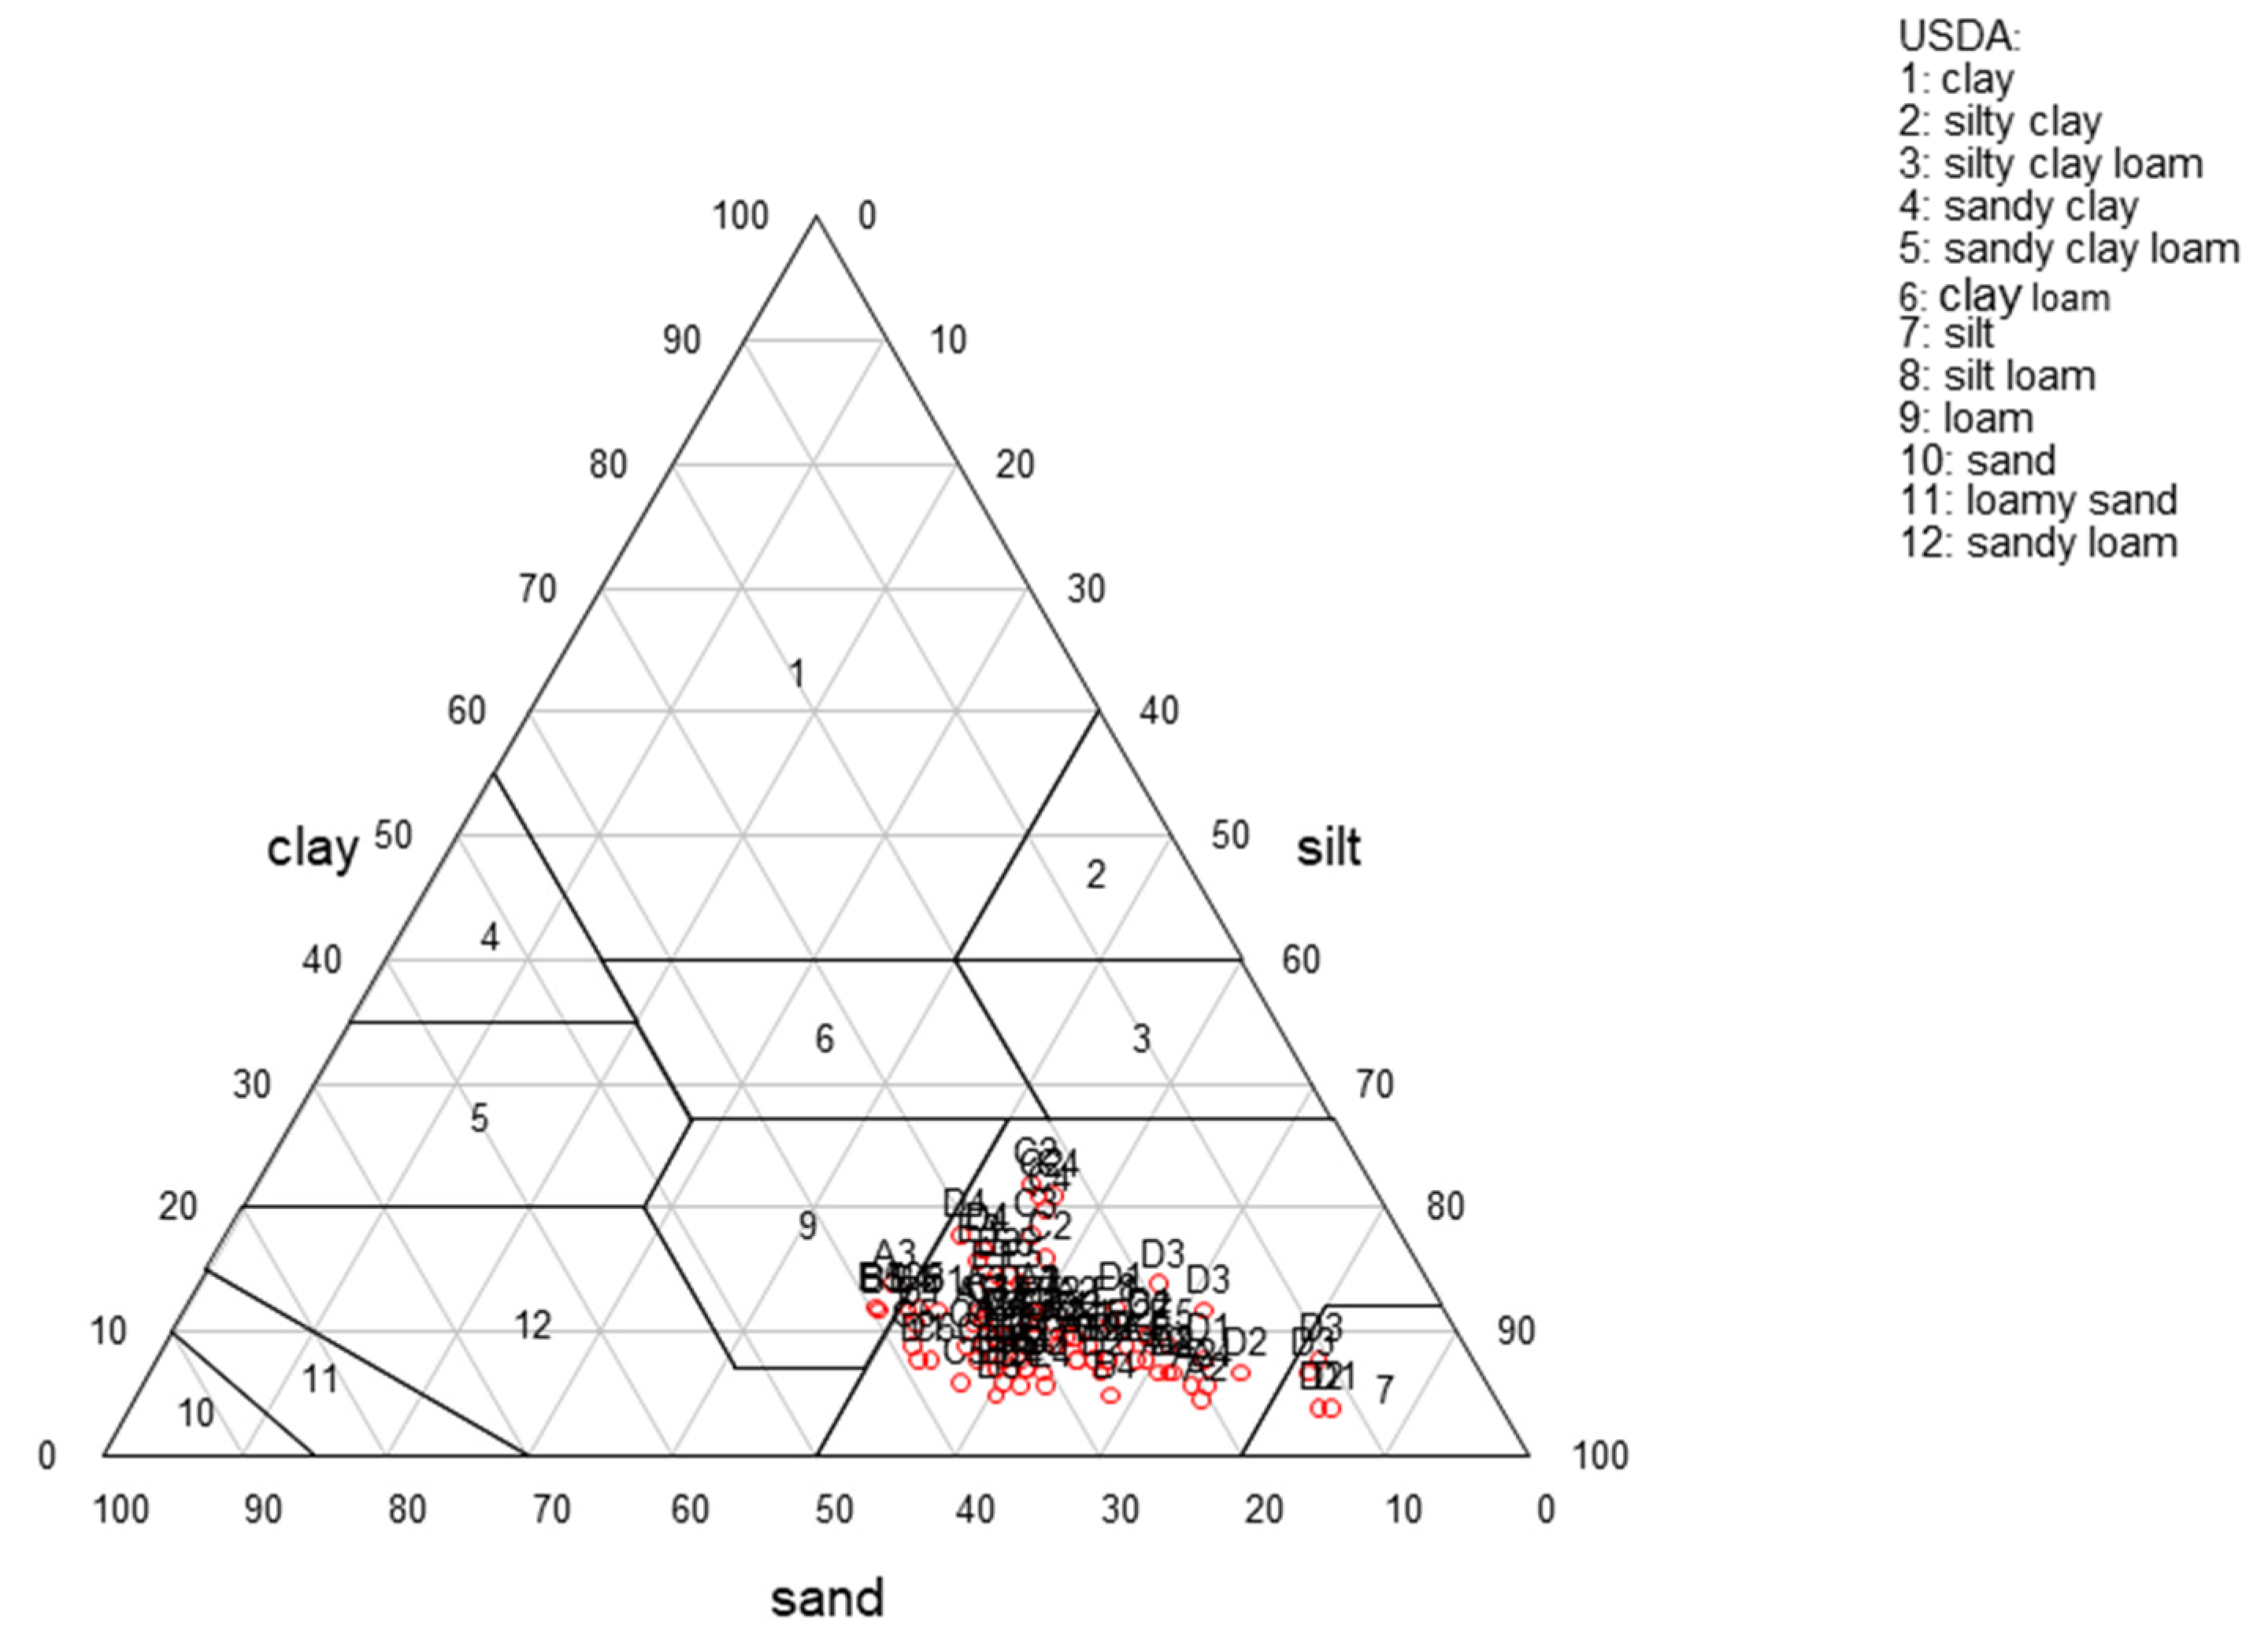
3.1. Soil Texture
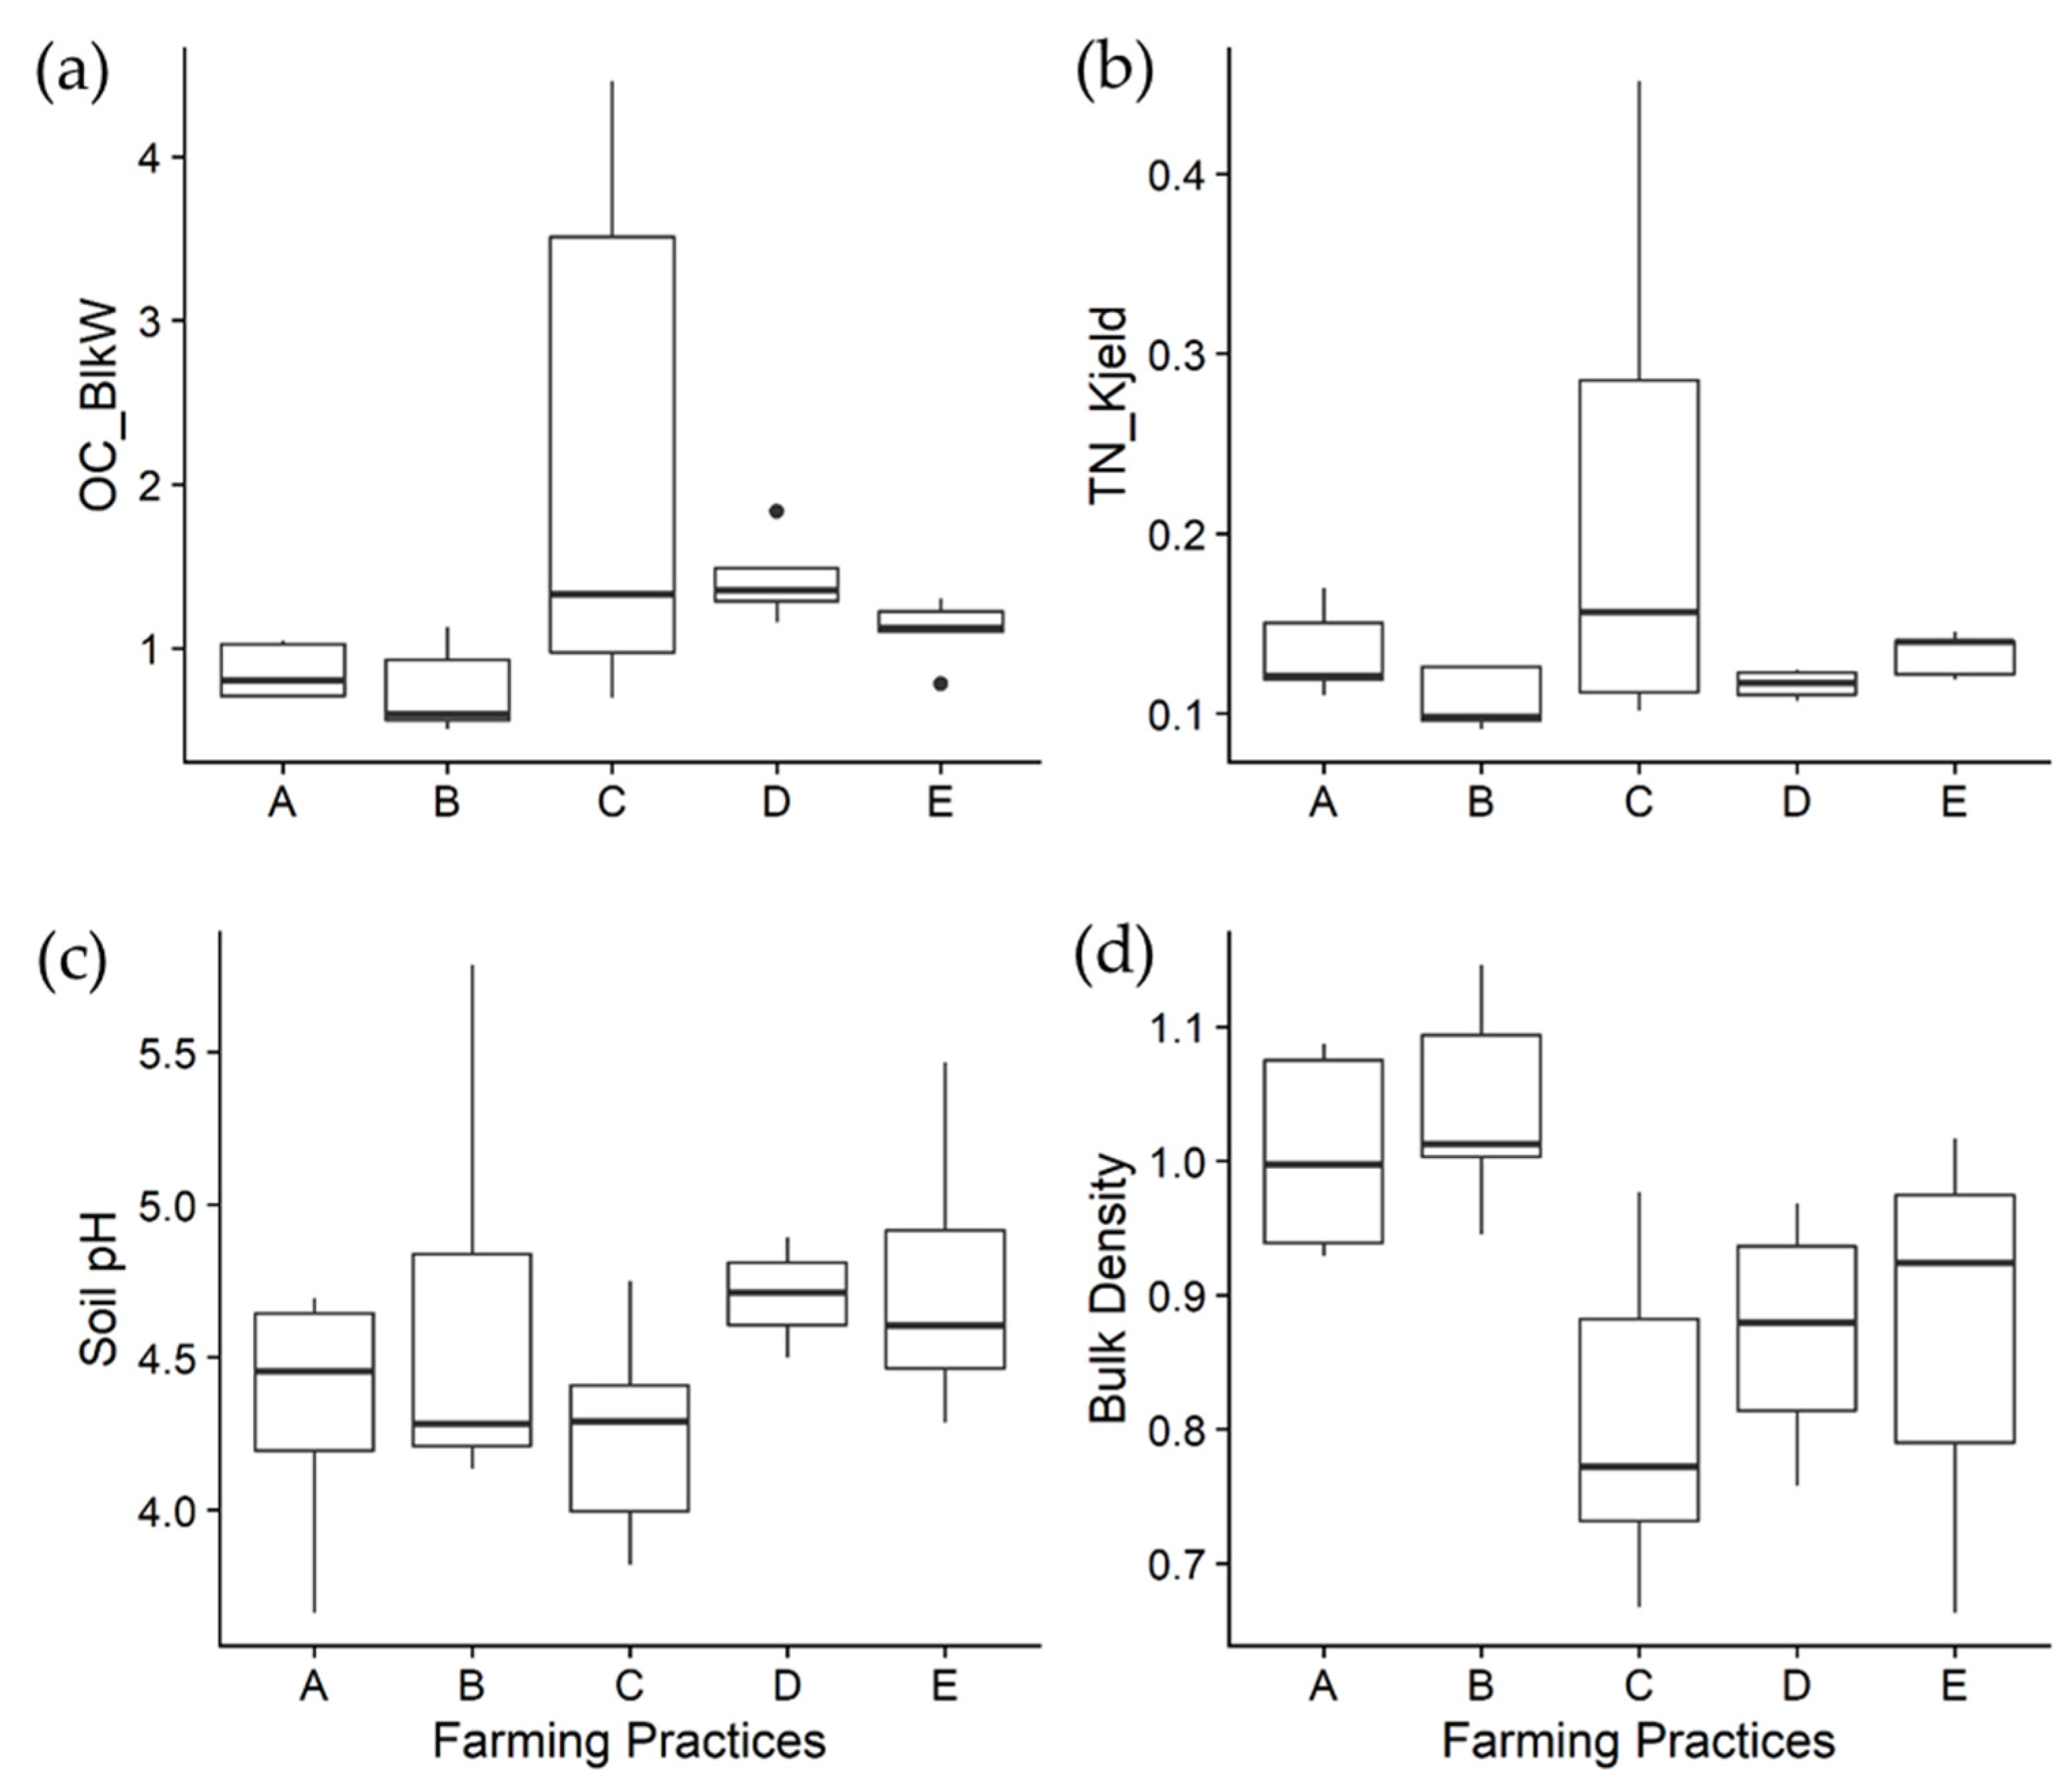
3.2. Variation in SOC and Nutrients across Farming Practices
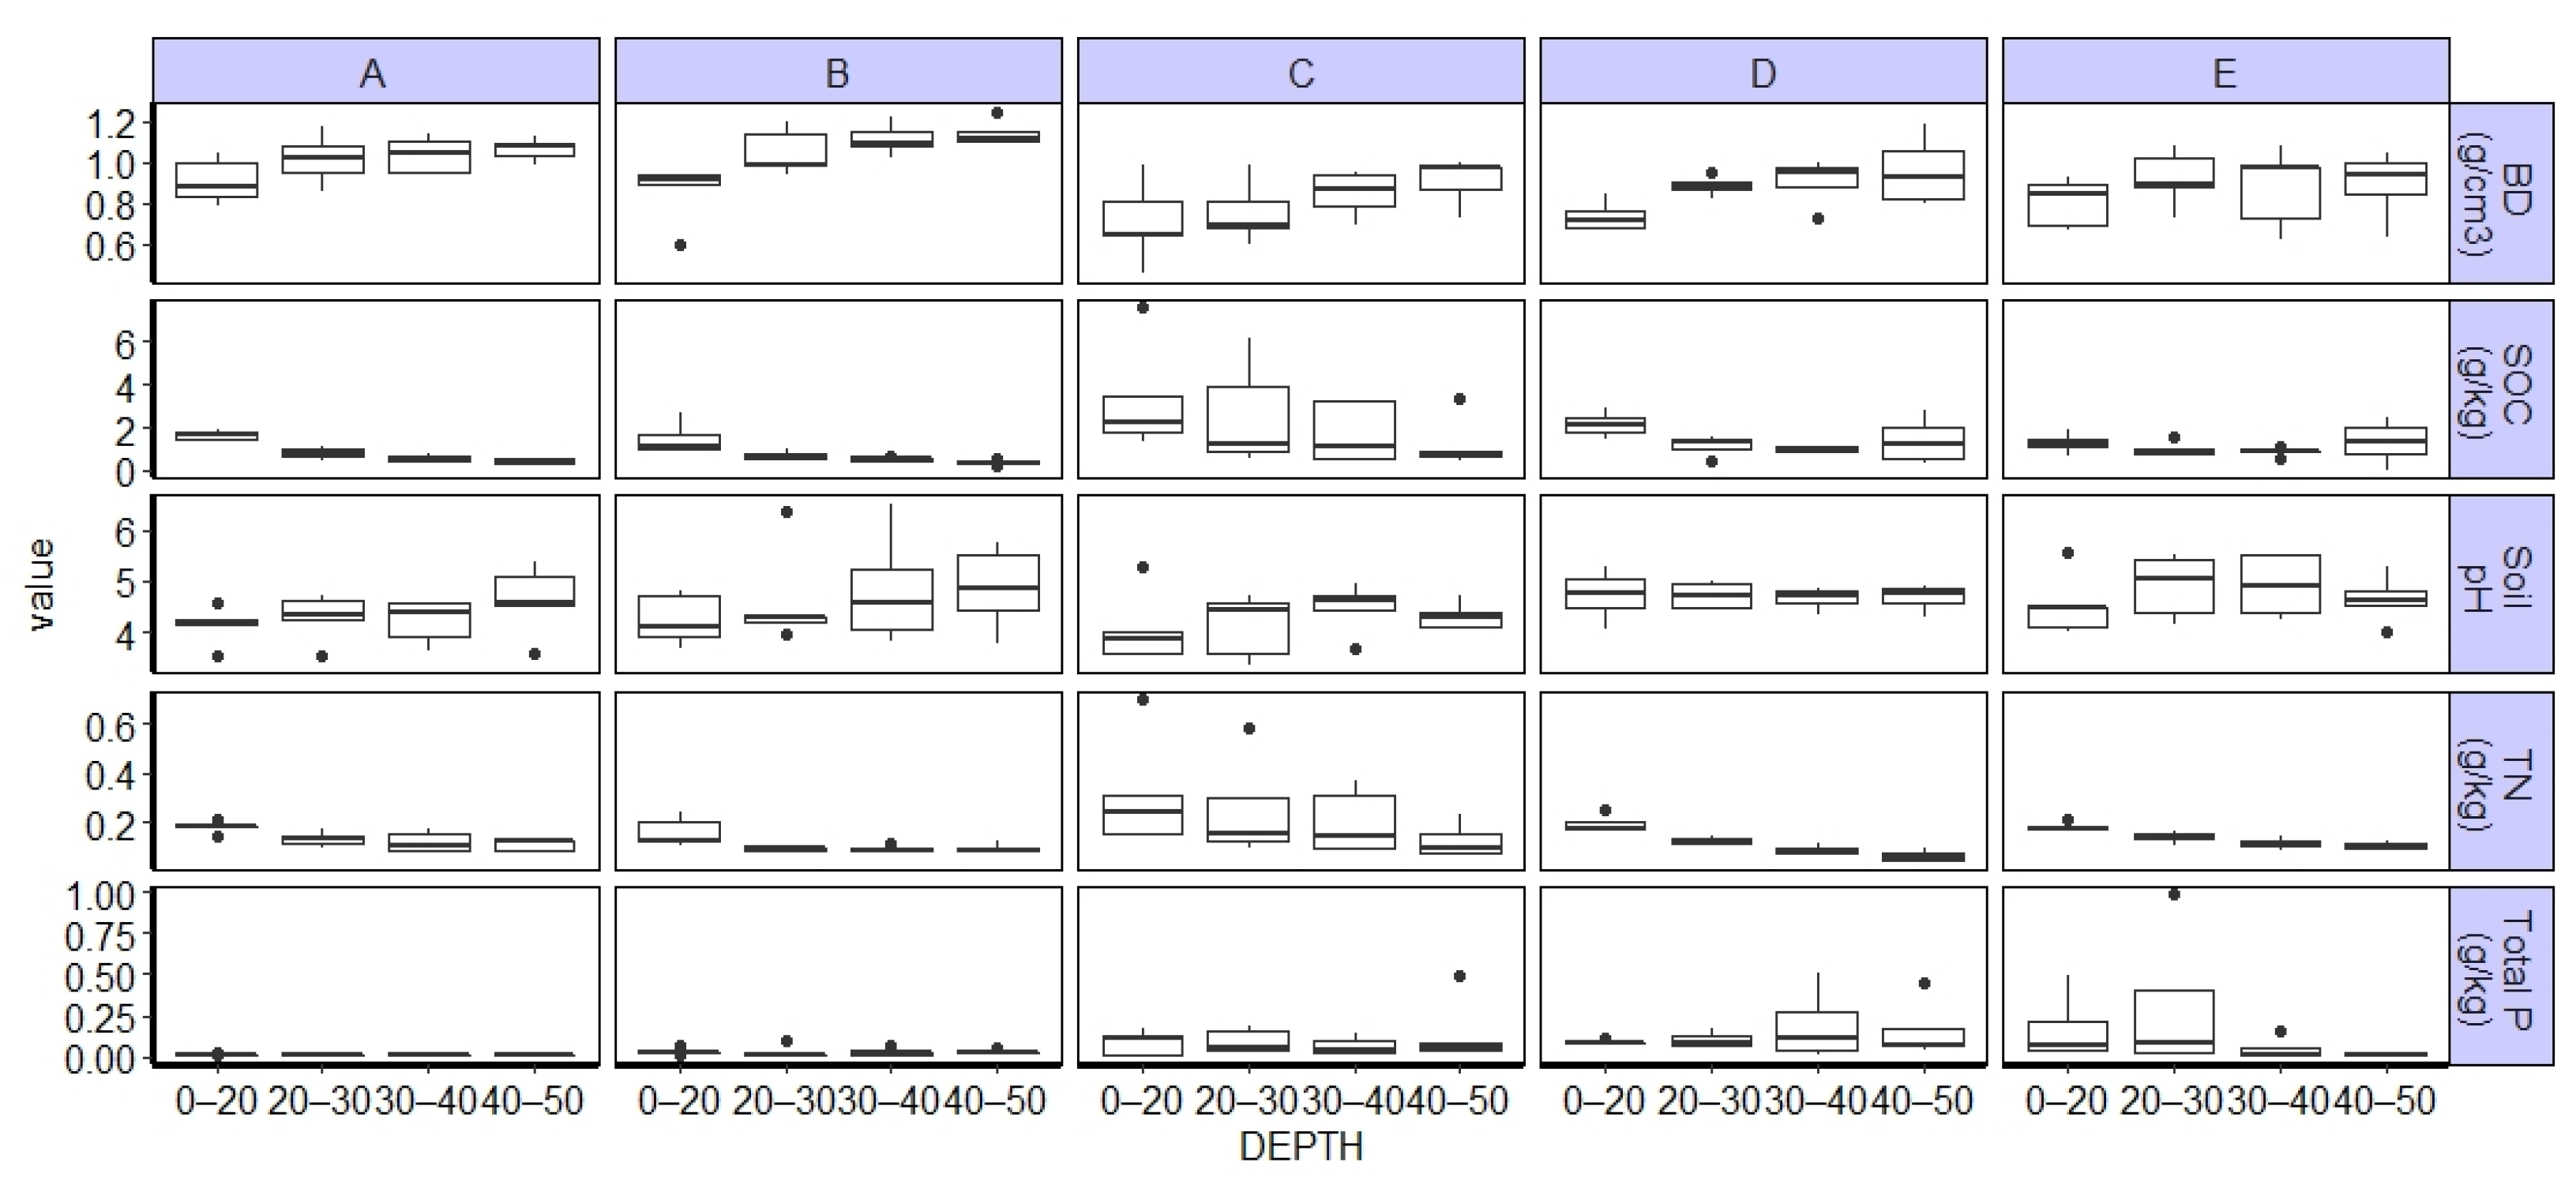
3.3. Effects of Farming Practices and Depths on BD, SOC, Soil pH, TN, and TP
3.4. Relationship among SOC, Nutrients (TN and TP), and Physical Characteristics of Soils
4. Discussion
4.1. Variation in SOC, TN, and TP with Management Practices
4.2. Influence of Management Practices and Depth on SOC, TN, and TP
4.3. Environmental Factors and SOC and Nutrient Dynamics
5. Conclusions
Supplementary Materials
Author Contributions
Funding
Institutional Review Board Statement
Informed Consent Statement
Data Availability Statement
Acknowledgments
Conflicts of Interest
References
- FAO. The State of the World’s Land and Water Resources for Food and Agriculture (SOLAW)–Managing Systems at Risk; Food and Agriculture Organization of the United Nations: Rome, Italy; Earthscan: London, UK, 2011; ISBN 9780203142837. [Google Scholar]
- Chauhan, B.S.; Jabran, K.; Mahajan, G. Rice Production Worldwide; Springer International Publishing: Berlin/Heidelberg, Germany, 2017; ISBN 9783319475165. [Google Scholar]
- Bouman, B.; Lampayan, R.M.; Tuong, T.P. Water Management in Irrigated Rice: Coping with Water Scarcity; International Rice Research Institute: Los Banos, Philippines, 2007; ISBN 9789712202193. [Google Scholar]
- Maclean, J.L.; Dawe, D.C.; Hardy, B.; Hettel, G.P. Rice Almanac, 3rd ed.; CABI Publishing: Wallingford, UK, 2003; Volume 92. [Google Scholar]
- Cao, X.; Wu, L.; Lu, R.; Zhu, L.; Zhang, J.; Jin, Q. Irrigation and fertilization management to optimize rice yield, water productivity and nitrogen recovery efficiency. Irrig. Sci. 2021, 39, 235–249. [Google Scholar] [CrossRef]
- Guo, J.; Fan, J.; Xiang, Y.; Zhang, F.; Yan, S.; Zhang, X.; Zheng, J.; Lii, Y.; Tang, Z.; Li, Z. Coupling effects of irrigation amount and nitrogen fertilizer type on grain yield, water productivity and nitrogen use efficiency of drip-irrigated maize. Agric. Water Manag. 2022, 261, 107389. [Google Scholar] [CrossRef]
- Linquist, B.A.; Anders, M.M.; Adviento-Borbe, M.A.A.; Chaney, R.L.; Nalley, L.L.; da Rosa, E.F.F.; van Kessel, C. Reducing greenhouse gas emissions, water use, and grain arsenic levels in rice systems. Glob. Chang. Biol. 2015, 21, 407–417. [Google Scholar] [CrossRef] [PubMed]
- Mote, K.; Rao, V.P.; Avil, V.R.K.; Uma, K.M. Performance of rice (Oryza sativa (L.)) under AWD irrigation practice—A brief review. Paddy Water Environ. 2021, 20, 5–15. [Google Scholar] [CrossRef]
- Rejesus, R.M.; Palis, F.G.; Rodriguez, D.G.P.; Lampayan, R.M.; Bouman, B.A.M. Impact of the alternate wetting and drying (AWD) water-saving irrigation technique: Evidence from rice producers in the Philippines. Food Policy 2011, 36, 280–288. [Google Scholar] [CrossRef]
- Carrijo, D.R.; Lundy, M.E.; Linquist, B.A. Rice yields and water use under alternate wetting and drying irrigation: A meta-analysis. Field Crop. Res. 2017, 203, 173–180. [Google Scholar] [CrossRef]
- Islam, M.; Rahman, M.; Mian, M.; Ali, M. Effect of Fertilizer Management on NPKS Leaching Loss from Sandy Loam Soil under Alternate Wetting and Drying Condition. Bangladesh Rice J. 2016, 20, 59–64. [Google Scholar] [CrossRef]
- Alavaisha, E.; Manzoni, S.; Lindborg, R. Different agricultural practices affect soil carbon, nitrogen and phosphorous in Kilombero-Tanzania. J. Environ. Manage. 2019, 234, 159–166. [Google Scholar] [CrossRef] [PubMed]
- Li, Y.; Barker, R. Increasing water productivity for paddy irrigation in China. Paddy Water Environ. 2004, 2, 187–193. [Google Scholar] [CrossRef]
- Livsey, J.; Alavaisha, E.; Tumbo, M.; Lyon, S.W.; Canale, A.; Cecotti, M.; Lindborg, R.; Manzoni, S. Soil Carbon, Nitrogen and Phosphorus Contents along a Gradient of Agricultural Intensity in the Kilombero Valley, Tanzania. Land 2020, 9, 121. [Google Scholar] [CrossRef] [Green Version]
- Alavaisha, E.; Lyon, S.W.; Lindborg, R. Assessment of water quality across irrigation schemes: A case study ofwetland agriculture impacts in Kilombero Valley, Tanzania. Water 2019, 11, 671. [Google Scholar] [CrossRef] [Green Version]
- Moyano, F.E.; Manzoni, S.; Chenu, C. Responses of soil heterotrophic respiration to moisture availability: An exploration of processes and models. Soil Biol. Biochem. 2013, 59, 72–85. [Google Scholar] [CrossRef]
- Manzoni, S.; Jackson, R.B.; Trofymow, J.A.; Porporato, A. The global stoichiometry of litter nitrogen mineralization. Science 2008, 321, 684–686. [Google Scholar] [CrossRef] [PubMed]
- Pan, G.; Smith, P.; Pan, W. The role of soil organic matter in maintaining the productivity and yield stability of cereals in China. Agric. Ecosyst. Environ. 2009, 129, 344–348. [Google Scholar] [CrossRef]
- Wu, J. Carbon accumulation in paddy ecosystems in subtropical China: Evidence from landscape studies. Eur. J. Soil Sci. 2011, 62, 29–34. [Google Scholar] [CrossRef]
- Chiti, T.; Gardin, L.; Perugini, L.; Quaratino, R.; Vaccari, F.P.; Miglietta, F.; Valentini, R. Soil organic carbon stock assessment for the different cropland land uses in Italy. Biol. Fertil. Soils 2012, 48, 9–17. [Google Scholar] [CrossRef]
- Witt, C.; Cassman, K.G.; Olk, D.C.; Biker, U.; Liboon, S.P.; Samson, M.I.; Ottow, J.C.G. Crop rotation and residue management effects on carbon sequestration, nitrogen cycling and productivity of irrigated rice systems. Plant Soil 2000, 225, 263–278. [Google Scholar] [CrossRef]
- Pampolino, M.F.; Laureles, E.V.; Gines, H.C.; Buresh, R.J. Soil carbon and nitrogen changes in long-term continuous lowland rice cropping. Soil Sci. Soc. Am. J. 2008, 72, 798–807. [Google Scholar] [CrossRef]
- Buresh, R.J.; Reddy, K.R.; van Kessel, C.; Schepers, J.S.; Raun, W.R. Nitrogen Transformations in Submerged Soils. In Nitrogen in Agricultural Systems; American Society of Agronomy: Madison, WI, USA, 2008; Available online: https://pdfs.semanticscholar.org/1b1f/607ab0e90ce820e583234ff01525e6623c42.pdf (accessed on 21 October 2019).
- Wei, L.; Ge, T.; Zhu, Z.; Ye, R.; Peñuelas, J.; Li, Y.; Lynn, T.M.; Jones, D.L.; Wu, J.; Kuzyakov, Y. Paddy soils have a much higher microbial biomass content than upland soils: A review of the origin, mechanisms, and drivers. Agric. Ecosyst. Environ. 2022, 326, 107798. [Google Scholar] [CrossRef]
- Lal, R. Enhancing eco-efficiency in agro-ecosystems through soil carbon sequestration. Crop Sci. 2010, 50, S120–S131. [Google Scholar] [CrossRef] [Green Version]
- Cleveland, C.C.; Liptzin, D. C:N:P stoichiometry in soil: Is there a “Redfield ratio” for the microbial biomass? Biogeochemistry 2007, 85, 235–252. [Google Scholar] [CrossRef]
- RAMSAR. Information Sheet on Ramsar Wetland: The Kilombero Valley Floodplain. 2002, pp. 1–17. Available online: https://doi.org/1173RIS.pdf (accessed on 8 November 2018).
- Massawe, B.H.J. Digital Soil Mapping and GIS-Based Land Evaluation for Rice Suitability in Kilombero Valley, Tanzania; The Ohio State University: Columbus, OH, USA, 2015. [Google Scholar]
- Nindi, S.J.; Maliti, H.; Bakari, S.; Kija, H.; Machoke, M. Conflicts Over Land and Water Resources in the Kilombero Valley Floodplain, Tanzania. Rev. Afr. Polit. Econ. 2014, 50, 173–190. [Google Scholar] [CrossRef]
- Alavaisha, E. Agricultural Expansion Impacts on Wetland Ecosystem Services from Kilombero Valley, Tanzania; Stockholm University: Stockholm, Sweden, 2020. [Google Scholar]
- Klute, A.; Danielson, R.E.; Sutherland, P.L. Methods of Soil Analysis, 2nd ed.; American Society of Agronomy: Madison, WI, USA, 1986. [Google Scholar] [CrossRef]
- Van Reeuwijk, L.P. Technical Paper 9; ISRIC: Wageningen, The Netherlands, 2002; ISBN 9066720441. [Google Scholar]
- Lemly, A.D.; Kingsford, R.T.; Thompson, J.R. Irrigated agriculture and wildlife conservation: Conflict on a global scale. Environ. Manag. 2000, 25, 485–512. [Google Scholar] [CrossRef] [PubMed]
- Vandermeer, J.; van Noordwijk, M.; Anderson, J.; Ong, C.; Perfecto, I. Global change and multi-species agroecosystems: Concepts and issues. Agric. Ecosyst. Environ. 1998, 67, 1–22. [Google Scholar] [CrossRef]
- Haque, M.; Biswas, J.C.; Kim, S.Y.; Kim, P.J. Intermittent drainage in paddy soil: Ecosystem carbon budget and global warming potential. Paddy Water Environ. 2017, 15, 403–411. [Google Scholar] [CrossRef] [Green Version]
- Setyanto, P.; Pramono, A.; Adriany, T.A.; Susilawati, H.L.; Tokida, T.; Padre, A.T.; Minamikawa, K. Soil Science and Plant Nutrition Alternate wetting and drying reduces methane emission from a rice paddy in Central Java, Indonesia without yield loss. Soil Sci. Plant Nutr. 2018, 64, 23–30. [Google Scholar] [CrossRef]
- Adhya, T.K.; Linquist, B.; Searchinger, T.; Wassmann, R.; Yan, X. Wetting and Drying: Reducing Greenhouse Gas Emissions and Saving Water from Rice Production; Working Paper, Installment 8 of Creating a Sustainable Food Future; World Resources Institute: Washington, DC, USA, 2014; pp. 1–28. [Google Scholar]
- Ye, Y.; Liang, X.; Chen, Y.; Liu, J.; Gu, J.; Guo, R.; Li, L. Alternate wetting and drying irrigation and controlled-release nitrogen fertilizer in late-season rice. Effects on dry matter accumulation, yield, water and nitrogen use. Field Crop. Res. 2013, 144, 212–224. [Google Scholar] [CrossRef]
- Ranatungaa, T.; Hiramatsub, K.; Onishib, T.; Ishiguro, Y. Process of Denitrification in Flooded Rice Soils. Rev. Agric. Sci. 2018, 6, 21–33. [Google Scholar] [CrossRef] [Green Version]
- Li, Q.; Allen, E.L.; Wollum, A.G. Effects of Irrigation and Fertilization on Soil Microbial Biomass and Functional Diversity. J. Sustain. For. 2005, 20, 17–35. [Google Scholar] [CrossRef]
- Kukal, S.S.; Benbi, D.K. Soil organic carbon sequestration in relation to organic and inorganic fertilization in rice-wheat and maize-wheat systems. Soil Tillage Res. 2009, 102, 87–92. [Google Scholar] [CrossRef]
- Poirier, V.; Angers, D.A.; Rochette, P.; Chantigny, M.H.; Ziadi, N.; Tremblay, G.; Fortin, J. Interactive Effects of Tillage and Mineral Fertilization on Soil Carbon Profiles. Soil Sci. Soc. Am. J. 2009, 73, 255. [Google Scholar] [CrossRef]
- Jobbágy, E.G.; Jackson, R.B. The Vertical Distribution of Soil Organic Carbon and Its Relation to Climate and Vegetation. Ecol. Appl. 2000, 10, 423–436. [Google Scholar] [CrossRef]
- Wright, H.R. Soil Drying and Re-Wetting Effects on Phosphorus Availability and Plant Yields; Lancaster University: Lancaster, UK, 2018. [Google Scholar]
- Entry, J.A.; Sojka, R.E.; Shewmaker, G.E. Management of Irrigated Agriculture to Increase Organic Carbon Storage in Soils. Soil Sci. Soc. Am. J. 2002, 66, 1957. [Google Scholar] [CrossRef] [Green Version]
- Liu, Z.; Rong, Q.; Zhou, W.; Liang, G. Effects of inorganic and organic amendment on soil chemical properties, enzyme activities, microbial community and soil quality in yellow clayey soil. PLoS ONE 2017, 12, e0172767. [Google Scholar] [CrossRef] [PubMed]
- Angst, G.; John, S.; Mueller, C.W.; Kögel-Knabner, I.; Rethemeyer, J. Tracing the sources and spatial distribution of organic carbon in subsoils using a multi-biomarker approach. Sci. Rep. 2016, 6, 29478. [Google Scholar] [CrossRef] [Green Version]
- Zheng, C.; Zhang, Z.; Wu, Y.; Mwiya, R. Response of Vertical Migration and Leaching of Nitrogen in Percolation Water of Paddy Fields. Water 2019, 11, 868. [Google Scholar] [CrossRef] [Green Version]
- Kamoni, P.T.; Mburu, M.W.K.; Gachene, C.K.K. Influence of Irrigation and Nitrogen Fertiliser on Maize Growth, Nitrogen Uptake and Yield in a Semiarid Kenyan Environment. East Afr. Agric. For. J. 2003, 69, 99–108. [Google Scholar] [CrossRef]
- Dodd, I.C.; Puértolas, J.; Huber, K.; Pérez-Pérez, J.G.; Wright, H.R.; Blackwell, M.S.A. The importance of soil drying and re-wetting in crop phytohormonal and nutritional responses to deficit irrigation. J. Exp. Bot. 2015, 66, 2239–2252. [Google Scholar] [CrossRef]
- Dalai, R.C. Soil Organic Phosphorus. Adv. Agron. 1977, 29, 83–117. [Google Scholar] [CrossRef]
- Murphy, B.W. Soil Organic Matter and Soil Function–Review of the Literature and Underlying Data; Department of the Environment: Canberra, Australia, 2014. [Google Scholar]
- Rondon, T.; Hernandez, R.M.; Guzman, M. Soil organic carbon, physical fractions of the macro-organic matter, and soil stability relationship in lacustrine soils under banana crop. PLoS ONE 2021, 16, e0254121. [Google Scholar] [CrossRef]
- Olivares, B.O.; Calero, J.; Rey, J.C.; Lobo, D.; Landa, B.B.; Gómez, J.A. Correlation of banana productivity levels and soil morphological properties using regularized optimal scaling regression. Catena 2022, 208, 105280. [Google Scholar] [CrossRef]


| % Clay | % Silt | % Sand | pH | BD g cm−3 | Porosity | SOC g kg−1 | TN g kg−1 | TP g kg−1 | |
|---|---|---|---|---|---|---|---|---|---|
| %Clay | 1 | 0.088 | −0.869 ** | −0.142 | −0.070 | 0.051 | 0.009 | 0.081 | −0.168 |
| %Silt | 1 | −0.570 ** | −0.073 | −0.563 ** | 0.538 ** | 0.485 ** | 0.454 ** | 0.122 | |
| %Sand | 1 | 0.153 | 0.338 ** | −0.310 ** | −0.248 * | −0.293 ** | 0.077 | ||
| pH | 1 | 0.216 * | −0.210 * | −0.254 * | −0.260 * | 0.028 | |||
| BD g cm−3 | 1 | −0.835 ** | −0.685 ** | −0.587 ** | −0.221 * | ||||
| Porosity | 1 | 0.569 ** | 0.477 ** | 0.227 * | |||||
| SOC g kg−1 | 1 | 0.881** | 0.137 | ||||||
| TN g kg−1 | 1 | 0.133 | |||||||
| TP g kg−1 | 1 |
Publisher’s Note: MDPI stays neutral with regard to jurisdictional claims in published maps and institutional affiliations. |
© 2022 by the authors. Licensee MDPI, Basel, Switzerland. This article is an open access article distributed under the terms and conditions of the Creative Commons Attribution (CC BY) license (https://creativecommons.org/licenses/by/4.0/).
Share and Cite
Alavaisha, E.; Tumbo, M.; Senyangwa, J.; Mourice, S. Influence of Water Management Farming Practices on Soil Organic Carbon and Nutrients: A Case Study of Rice Farming in Kilombero Valley, Tanzania. Agronomy 2022, 12, 1148. https://doi.org/10.3390/agronomy12051148
Alavaisha E, Tumbo M, Senyangwa J, Mourice S. Influence of Water Management Farming Practices on Soil Organic Carbon and Nutrients: A Case Study of Rice Farming in Kilombero Valley, Tanzania. Agronomy. 2022; 12(5):1148. https://doi.org/10.3390/agronomy12051148
Chicago/Turabian StyleAlavaisha, Edmond, Madaka Tumbo, Jacqueline Senyangwa, and Sixbert Mourice. 2022. "Influence of Water Management Farming Practices on Soil Organic Carbon and Nutrients: A Case Study of Rice Farming in Kilombero Valley, Tanzania" Agronomy 12, no. 5: 1148. https://doi.org/10.3390/agronomy12051148
APA StyleAlavaisha, E., Tumbo, M., Senyangwa, J., & Mourice, S. (2022). Influence of Water Management Farming Practices on Soil Organic Carbon and Nutrients: A Case Study of Rice Farming in Kilombero Valley, Tanzania. Agronomy, 12(5), 1148. https://doi.org/10.3390/agronomy12051148