Article

Short-Term Responses of Soil Organic Carbon Pool and Crop Performance to Different Fertilizer Applications

1
Division of Applied Life Science (BK21), Gyeongsang National University, Jinju 52828, Korea
2
Institute of Agriculture and Life Science (IALS), Gyeongsang National University, Jinju 52828, Korea
3
Department of Environmental Horticulture, University of Seoul, Seoul 02504, Korea
4
Department of Agricultural Environment, National Institute of Agricultural Science, Jeonju 55365, Korea
*
Authors to whom correspondence should be addressed.
Agronomy 2022, 12(5), 1106; https://doi.org/10.3390/agronomy12051106
Submission received: 5 April 2022 / Revised: 23 April 2022 / Accepted: 29 April 2022 / Published: 30 April 2022
(This article belongs to the Special Issue Application of Organic Amendments in Agricultural Production)

Abstract

:
Some intensive farmers tend to expect short-term beneficial effects by applying soil amendments, but inconsistent fertilization practices are often conducted, causing economic losses and environmental problems. This study aimed at investigating the short-term application effects of different soil amendments on soil organic carbon (SOC) fractions, biogeochemical properties, and crop performance for finding the best land management approach using one-year field trial growing Chinese cabbages. This filed experiment was conducted in 2020 and included eight fertilizer treatments: control (w/o fertilizers), chemical fertilizer (CF), manure compost (MC), double MC amount (2MC), CF + MC, CF + rice husk (RH), MC + RH, and CF + MC + RH. As a result, the concentrations of recalcitrant to labile C forms, including Loss-On-Ignition C (LOIC), Walkley-Black C, permanganate oxidizable C (POXC), and microbial biomass C, were the highest in a mixture of MC and RH and 2MC. Additionally, the treatment with the largest difference from the control in key soil parameters was 2MC: bulk density (10%), total N (30%), available P (186%), and CO2 (433%) and N2O (825%) emissions, followed by MC + RH. Moreover, more than 20% higher fresh weight (FW) of cabbage was found in 2MC and MC + RH than in the control. Therefore, these two organic amendments appeared to benefit SOC storage and overall soil biogeochemical processes, contributing to higher biomass crop production. Moreover, LOIC significantly correlated to bulk density, available P and K, and FW, while POXC significantly correlated to N concentration in plants, indicating the short-term fertilization effects on the status of SOC fractions and the qualities of soil and plant by applying soil amendments. Overall, our findings suggest that applying MC + RH would be an alternative to replace the conventional farming practices for promoting soil quality and crop performance, but further studies to sustain the application effects of this amendment should be monitored for longer durations.

1. Introduction

Historically, fertilization practices have played an important role in soil-based agricultural activities by improving soil fertility and quality, contributing to an increase in crop yield [1]. In general, various organic by-products generated by agriculture practices, including livestock manure and crop residue, have been converted into arable soils for successful crop production since approximately 4000 years ago [1]. Indeed, since the 1880s, when chemical fertilizer (CF) use was introduced, the global agricultural production boomed upward, and meeting the growing demands for food production stability and security was possible [2]. However, intensive agricultural activities accompanying CF abuse are currently causing severe adverse effects globally: e.g., eutrophication, air pollution, soil acidification, and mineral depletion [3,4]. In turn, such environmental problems can exacerbate agricultural soil quality and health, consequently degrading crop production sustainability and threatening overall agricultural ecosystems. Meanwhile, with the recent increase in consumption preferences for organic and eco-friendly agricultural foods, adding large amounts of organic amendments (OAs) in farmlands is strongly encouraged; this is different from the main purpose of nutrient input in the past agricultural era. Moreover, adding OAs is considered a sustainable method to address the environmental and ecological challenges faced today, including recycling organic wastes, improving carbon sequestration, and reducing greenhouse gases (GHGs) emissions [5,6]. However, given the sustainability of crop production and farmer’s profitability, the question remains as to whether applying OAs alone is more efficient than conventional fertilization, which relies mainly on CF; thus, many studies related to this are continuously required.
Soil organic matter (SOM) is a critical determinant for overall agricultural soil quality because it primarily influences the regulation of a wide range of soil functions e.g., dynamics of water and key nutrients and provisions of habitat and energy source for soil biota [7,8]. Thus, SOM functionality considerably affects the sustainability of agroecosystem services, but it varies with the organic compound’s composition and amount [9] as well as the environmental conditions (e.g., soil texture, vegetation, and climate) and land management approaches (e.g., tillage, fertilization, and crop rotation) [7,10]. Therefore, proper soil management is required on an ongoing basis to maintain and maximize SOM function in agricultural soil.
The dynamics of SOM pool depend on the balance between the input and output of organic sources [1], which has been quantified indirectly by measuring soil organic carbon. Generally, the SOC pool consists of three distinct forms depending on their decomposition rate: stable, intermediate, and labile. The stable C form is the dominant component in SOC consisting of a recalcitrant or humified fraction of carbon (e.g., humus) and converting slowly over decades to centuries. In contrast, the labile C form, a small fraction of the total organic C (TOC) (5–20%), can be decomposed relatively quickly within days to a few years. Labile SOC (LSOC) commonly originates from decomposing plant and animal residues, root exudates, and dead microbial biomass [11]. Thus, it has a greater impact on short-term turnover and availability of nutrients in the terrestrial ecosystem than recalcitrant SOC (RSOC). Moreover, it has been widely reported that LSOC has great leverage in controlling key soil functional processes linked to soil aggregation, biological activity, and C sequestration under proper soil management [12,13,14]. Therefore, LSOC pool promotion with OA addition, especially in agricultural soil, would contribute to improving crop productivity and soil quality and health [12,15,16].
Several studies have shown that LSOC is highly sensitive to changes in soil management practices or environmental conditions, especially rather than TOC or RSOC, which may not respond to recent changes in land management [8,17,18,19]. Therefore, LSOC has been widely used as an indicator to assess the quality and health of agricultural soils that are significantly affected by changes in land use and soil management [12]. Commonly, the pool of labile SOC includes various C fractions, such as particulate organic C, POXC, dissolved organic C, MBC, and potentially mineralizable C (PMC), etc., discernable by physical, chemical, or biological fractionation methodology [18]. In recent decades, the analysis of these labile fractions has been widely used to evaluate LSOC degree, although most are costly and labor intensive as well as constrain routine tests in the field [8,20]; of these, POXC and PMC are relatively rapid, affordable, or easy to modify for field use [14,20].
Globally, total soil organic carbon content has been most frequently determined in the laboratory using the Loss-On-Ignition and Walkley-Black methods [19]; thus, the values of Loss-On-Ignition C (LOIC) and Walkley-Black C (WBC) are widely adopted as an indicator of soil carbon monitoring and climate policy establishment. However, because their values are characterized mainly by high levels of C in recalcitrant or passive forms [19], it could be thought that both LOIC and WBC have limitations in their use as an overall soil quality indicator (SQI), especially for short-term agricultural soil management and environmental changes. Conversely, LSOC, often considered the active C pool, has demonstrated its high sensitivity to such changes in land use and management practice [12,18], suggesting the high potential of LSOC as the SQI in actively managed arable soils. Therefore, studies on the LSOC role with various fractions in response to several land management practices should be considered to broaden the application range as an SQI in agricultural systems.
Applying soil amendments can influence the dynamics of SOM regulating SOC stock and overall biogeochemical processes of soil; thus, it can be an important farming practice for effectively managing poor agricultural soils. In modern agriculture, organic fertilization alone or in combination with inorganic additives has become more popular than chemical fertilization alone in terms of eco-friendliness and economic feasibility. Moreover, long-term applications of OAs would be better for providing benefits for improving soil quality and health. Nevertheless, in situ, many farmers tend to have high expectations of obtaining such benefits through short-term applications. This study aims at investigating the short-term application effects of different soil amendments on the SOC pool, biogeochemical properties, and crop performance and their interrelationships. We hypothesized that applying combinations of organic additives (e.g., manure compost, rice husk, etc.) that can affect different types of carbon pools in soil has positive effects on soil biogeochemistry and plant performance as well as soil C sequestration over a short period of time. Moreover, by conducting this experiment, we could expect to determine the most effective fertilization method for the farmland of this study, which has been practiced intensively but ineffectively during the past decade, as well as identify some SOC fractions that have high potential as SQI indicators to evaluate the status of overall soil characteristics according to a short-term change in land management practices.

2. Materials and Methods
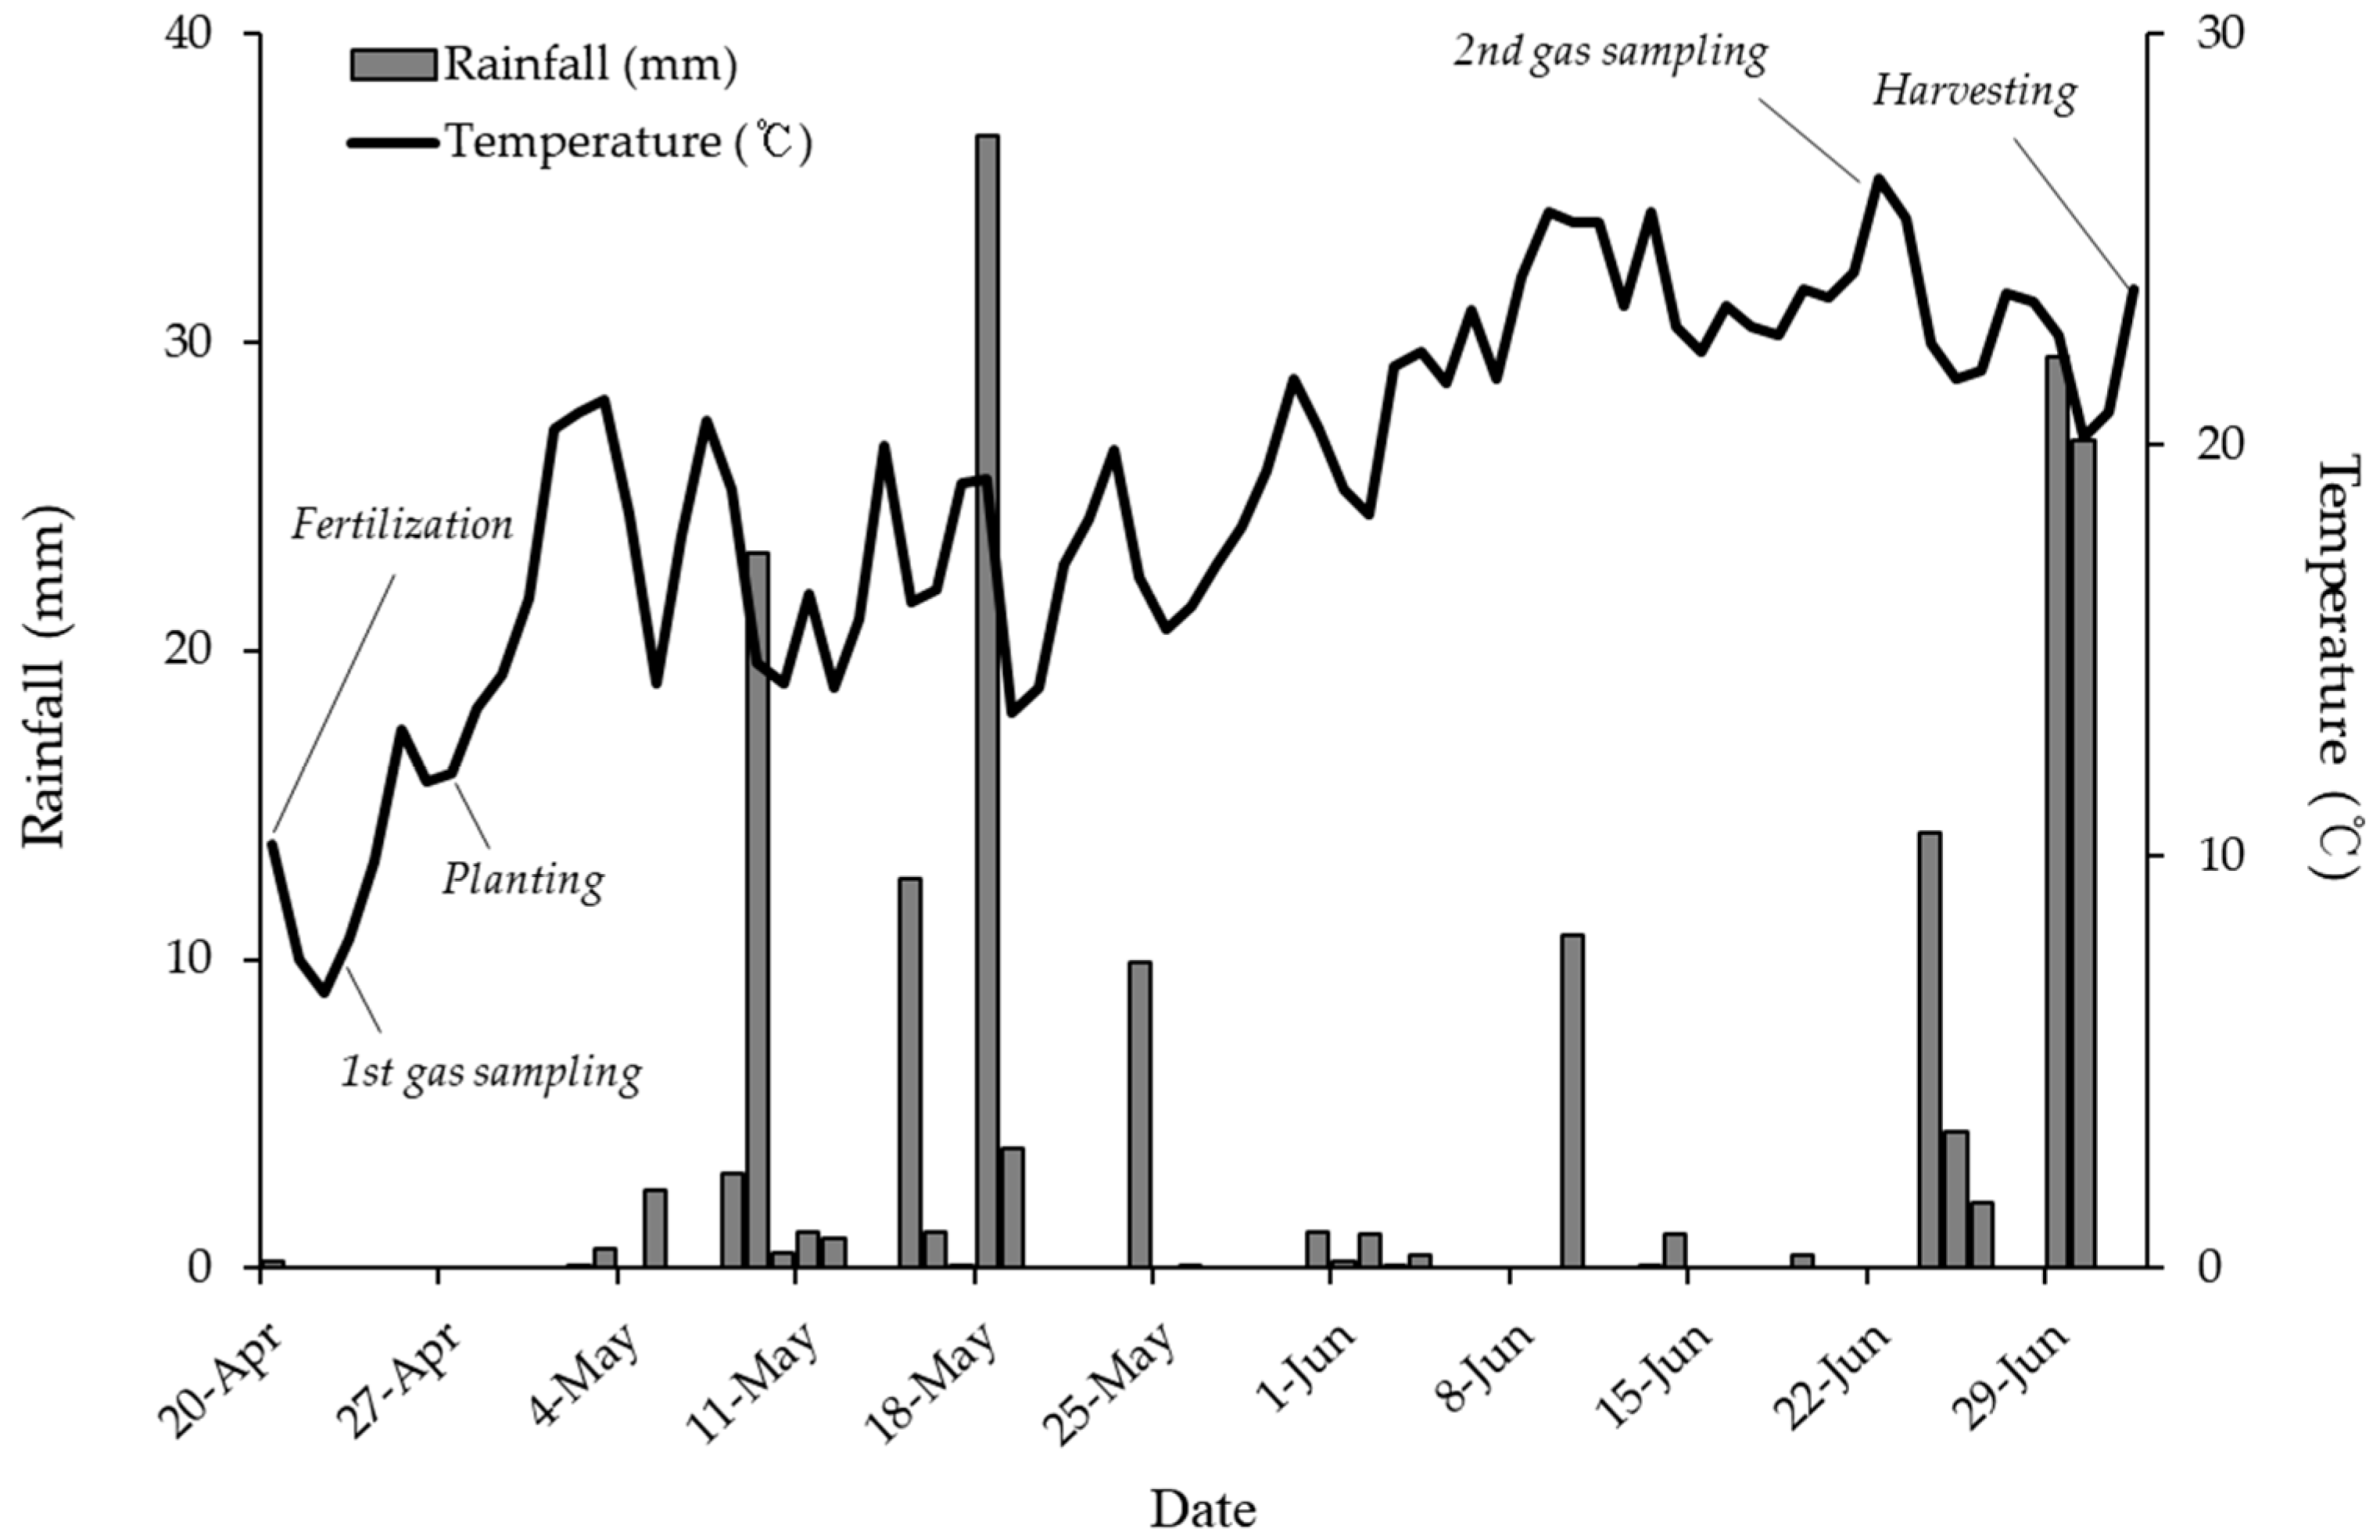
2.1. Study Area

An upland field (about 300 m2) located in Ansan, South Korea, was selected for this study. This farmland has a 10-year constant history of farming practices producing Chinese cabbage (Brassica rapa L. subsp. Pekinensis) and soybean (Glycine max L.) cultivated from April to July and from July to October, respectively. Meanwhile, the upland soil has been identically managed by applying mineral fertilizers with livestock manure compost (MC). Additionally, different types of soil additives such as rice straw and husk, etc., were treated in this field, but their composition and quantity differed yearly. Following the preliminary soil analysis performed in the Soil Environment Laboratory of the University of Seoul, the properties of this agricultural soil were as follows: pH 7.75; electrical conductivity (EC)—0.08 dS m−1; SOM—21.1 g kg−1; available (Av.) P2O5—193.1 mg kg−1; exchangeable (Ex.) Ca, K, and Mg—12.2, 3.4, and 4.3 cmolc kg−1, respectively. This upland was homogeneously plowed a month before the cabbage cultivation.

2.2. Treatments and Sampling

A total of eight different fertilizers were applied to an upland on 20 April 2020: Control (w/o fertilizers), CF, MC, manure compost (MC), double MC amount (2MC), CF + MC, CF + rice husk (RH), MC + RH, and CF + MC + RH. Commercial CF was applied to the upland soil as 240 kg ha−1 based on the Korean fertilizer recommendation rate (N-P-K = 46-17-22). Moreover, commercial MC, mainly consisting of cow and pig manure as well as sawdust, was applied to the soil as 8000 kg ha−1 based on the recommendation rate. RH was amended as 7500 kg ha−1 to the soil, equivalent to 1 kg C per 3.3 m2. The properties of MC and RH used in this study are shown in Table 1; generally, MC had higher nutrients (C, N, P, K, Ca, Mg, and K) and a lower C/N ratio than RH. All treatment plots (2.5 m × 2.5 m) were installed as the randomized complete block design and each treatment had three replicates.
Approximately 1000 seeds of B. rapa were germinated and grown in a greenhouse for three weeks, and then these seedlings were transplanted into the field site. A week after fertilization, 16 cabbage seedlings were planted in each treatment plot with a 50 cm space. The water supply was conducted every 3–4 days using sprinklers and a commercial eco-friendly organic product was treated to protect cabbage disease and insect pests during cultivation. Following a 10 week cultivation, each plot’s surface soil (0–15 cm depth) was collected on 2 July 2020, sieved with a 2 mm steel sieve after air-drying, and stored in a container before analyzing the soil properties. For plant sampling, four individuals were randomly selected from each experimental plot, and then they were gently washed with tap water before recoding biomass. Gas sampling was performed using a static closed chamber at the beginning (three days after fertilization) and at the end (ten days before soil and plant sampling) of this field study.

2.3. Analytical

2.3.1. SOC Fractions

Different types of organic C fractions in the soil sample were determined in this study: LOIC, WBC, POXC, and PMC corresponding as recalcitrant, slightly labile, moderate labile, and readily forms of SOC, respectively. To assess LOIC, the oven-dried (105 °C soil sample was analyzed using the LOI method at 550 °C in a muffle furnace [21]. WBC was evaluated with the WB chromic acid wet oxidation–titration method, which is the common method to determine SOC content in agricultural soil [22]. POXC, known as active C, was measured via the oxidation process based on the methods of Culman et al. [20] and Weil et al. [19]. Two replicate subsamples of each soil were prepared. Twenty milliliters of 0.02 mol L−1 KMnO4 were added to a 50 mL centrifuge tube containing 2.5 g air-dried soil. The tube was shaken for two minutes at 240 oscillations min−1 and allowed to settle for ten minutes. The supernatant (0.5 mL) was transferred to another centrifuge tube and diluted with 49.5 mL deionized (DI) water. Sample absorbance values were detected using a microplate reader (Epoch, BioTek, Winooski, VT, USA) at 550 nm, and the POXC concentration of the sample was calculated using the formula described by Hurisso et al. [14]. PMC was quantified by measuring CO2 flush during a day of aerobic incubation [14,23]. In the 50 mL centrifuge tube screw-up, 10 g air-dried soil was rewetted with DI water to adjust to 50% water-filled pore space, and then it was incubated at 25 °C. A day after, approximately 5 mL air sample was collected from the headspace of the centrifuge tube and injected into a portable gas analyzer, GT5000 Terra (Gasmet Technologies, Vantaa, Finland) to estimate CO2 concentrations. Moreover, MBC as an indicator of soil microbial abundance of the field soils was determined using the method of Vance et al. [24]. Following fumigation with ethanol-free CHCl3, the samples were extracted with 0.5 M K2SO4 and organic C in the extracts was determined using a TOC-L analyzer (Shimadzu, Kyoto, Japan).

2.3.2. Soil Physical and Chemical Parameters

According to a core method [25], the soil bulk density (BD) of each plot was determined. The total soil volume was estimated as the internal volume of the cylinder (100 cm3). The soil sample was oven-dried at 105 °C for three days, and then the mass of the dried sample was measured. The BD value was calculated as this formula: BD (Mg m−3) = Ms (the weight of the dry soil sample)/Vs (the volume of the dried soil sample in m3).
The pH and EC of air-dried soil samples were measured in 1:5 DI water:soil using a pH meter (MP220, Mettler Toledo, Leicester, UK) and EC meter (MC226, Mettler Toledo, Leicester, UK), respectively.
To determine total nitrogen, the soil sample sieved with a 0.5 mm sieve was digested with concentrated sulfuric acid and Kjeltabs Se/3.5® (3.5 g K2SO4 + 3.5 mg Se) and then analyzed using Kjeldahl distiller (Kjeldahl 2300, Foss, Hillerød, Denmark).
Available P was determined colorimetrically using a UV spectrophotometer (UV-160 A, Shimadzu, Kyoto, Japan) after extraction with Bray No. 1 solution [26].
Cation exchangeable capacity (CEC) and soluble macronutrients (Ex. K, Ca, and Mg) in soil were determined using a Kjeldahl 2300 distiller and inductively coupled plasma–optical emission spectroscopy (ICP–OES) (Agilent 5110, Agilent Technologies, Santa Clara, CA, USA), respectively, following extraction with 1 M NH4OAc solution at pH 7.0 [25].

2.3.3. Plant Performance

The fresh weight of collected plant samples (n = 4 of each plot) was measured. The N concentration in the plant samples was determined using a Kjeldahl distiller (Kjeldahl 2300, Foss, Hillerød, Denmark) following the wet digestion with H2SO4–HClO4 solution [25].
To determine chlorophyll (Chl.) and carotenoid contents in the plant leaves, fresh leaves (0.1 g) of each sample were placed in a glass test tube with screw cap containing 10 mL 80% acetone [27]. The samples were stored in darkness at room temperature for one day, and the extract was measured at 663, 645, and 470 nm wavelengths of UV spectrophotometer (UV–160 A, Shimadzu, Kyoto, Japan). The photosynthetic pigments, such as Chl. a, Chl. b, total Chl. (a + b), and total carotenoid, were estimated with the following formula:
Chl. a = 12.7 A663 − 2.69 A645
Chl. b = 22.9 A645 − 4.68 A663
Total Chl. (a + b) = 20.29 A645 + 8.02 A663
Total carotenoid = (1000 A470 − 1.82 Chl. a − 85.02 Chl. b)/198
where A is the absorbance value at appropriate wavelength.

2.3.4. Emission of CO2 and N2O

The static closed chamber was used to collect CO2 and N2O gases emitted from the soil of each plot. Gas measurement was conducted twice on the 3rd and 60th d from the fertilization date and climatic information during this field experiment was recorded (Figure 1). In general, with the increasing trend of daily average temperature during the field experiment, it was 8 °C at the first gas measurement and 25.5 °C at the second measurement. Identically, sampling for both gases was conducted between 9 am and 12 pm daily. The aliquots (~15 mL) of headspace gas were injected at 0, 20, and 40 min after sealing and determined using a portable gas analyzer, GT5000 Terra (Gasmet Technologies, Vantaa, Finland). The headspace volume was 7.2 L, and the soil surface area was 133 cm2.

2.4. Statistical Analysis

Data shown in this study indicate the mean of triple measurements. To compare differences in soil biogeochemical properties, plant physiological properties, and GHGs emission among different fertilizer treatments, one-way ANOVA with the Tukey’s honestly significant difference (HSD) post hoc test at the 0.05 probability level was conducted (n = 3). Omega squared (ω2) from the ANOVA results was used to compare the difference in effect size for a single parameter, depending on fertilizer types. Pearson’s correlation analysis was used to measure how soil organic C fractions correlate with soil and plant parameters. Principal component analysis (PCA) was conducted to investigate patterns of variation in the dataset, focusing on the degree of relationships of different SOC fractions with key parameters throughout different fertilizer treatments. Moreover, a linear regression test was performed to find a SOC fraction with a high potential to be used as a soil index to predict soil biogeochemistry, plant performance, and greenhouse gas emission. All statistical analyses were conducted using the R program (version 3.3.3).

3. Results

3.1. SOC Fractions

All SOC fraction concentrations varied with the type of soil amendment used in this study (Table 2). Among the fractions, LOIC had the highest concentration in soil treated with CF + RH (72.9 g kg−1), followed by MC + RH > 2MC > MC > CF + MC + RH > CF + MC > CF. CF + RH and MC + RH showed similar concentrations of LOIC and other treatments induced intermediate values significantly higher than control (53.0 g kg−1) (p < 0.05). For WBC, the highest concentration (22.9 g kg−1) was found in the soil of 2MC treatment. However, there were no significant differences in WBC concentrations among all treatments (p > 0.05), indicating WBC was not markedly influenced by amendment supply. POXC was in the order MC + RH (807 mg kg−1) > 2MC > MC > CF + MC + RH > CF + MC > CF + RH > CF > control (643 mg kg−1), but there were not found significant differences among the treatments (p > 0.05). The highest PMC concentration was found in the control soil (43.8 mg kg−1), while CF soil represented the lowest value (17.9 mg kg−1). MBC concentrations among the treatments were listed in the following order: MC + RH > 2MC > MC > CF + MC + RH > CF + RH > CF + MC > CF > control. In particular, the MBC value was approximately 1.9-fold higher in 2MC treatment (48.8 mg kg−1) than the control (25.2 g kg−1). Among the intermediate values, WBC concentration in 2MC (46.1 mg kg−1) was significantly higher than the control (p < 0.05), while those in the remaining treatments (26.8−38.9 mg kg−1) were not significantly different from the control (p > 0.05).

3.2. Soil Physicochemical Properties

Table 3 shows the difference in the physicochemical properties of soils according to the type of soil amendments. Soil BD showed the most significant difference among all treatments, with the following order: control > CF > MC > CF + MC, MC + RH > 2MC, CF + RH > CF + MC + RH. Among the intermediate values, BD in CF, MC, and MC + RH were not significantly different from the control (p > 0.05), while the remaining treatments showed significantly lower BD than control (p < 0.05). For soil chemistry, the highest values for each relevant parameter were observed in different treatments: pH (7.78), T-N (2.37 g kg−1), and Av. P2O5 (238 mg kg−1) in 2MC; Ex. Ca, and Mg (10.6 and 3.40 cmolc kg−1, respectively) in MC + RH, EC (0.240 dS m−1); Ex. K (2.47 cmolc kg−1) in CF + RH; and CEC (12.9 cmolc kg−1) in CF + MC. Conversely, the control soil had the lowest values of all chemical parameters except for soil pH.

3.3. GHG Emission

Three days after fertilization, we found significant differences in the amounts of carbon dioxide and nitrous oxide emitted from soils, depending on the soil amendment type (Table 4). The concentration of CO2 emission from all treatments ranged from 14.3 to 44.3 kg ha−1 d−1. The highest CO2 concentration was observed in 2MC treatment, followed by CF + MC + RH (40.3 kg ha−1 d−1), MC + RH (36.6 kg ha−1 d−1), and CF + MC (34.3 kg ha−1 d−1). These CO2 emission values were significantly higher (approximately 2–3 times) than that in the control treatment (p < 0.05). On the 60th day after fertilization, we also found a similar trend in the difference between CO2 emission amounts depending on the soil amendment type; however, the concentrations in all treatments considerably decreased compared to those on the third day. The highest CO2 concentration in the 2MC treatment (0.636 kg ha−1 d−1) was more than five times higher than that in the control (0.124 kg ha−1 d−1). MC +RH and CF + MC + RH treatments showed similar values of CO2 emission, which were significantly different from the remaining treatments, including CF, CF + MC, CF + RH, and control (p < 0.05).
For N2O emission, the treatments of 2MC and CF + MC had the highest concentrations, approximately 5.6-times higher than the control (2 g ha−1 d−1) on the third day after fertilization (Table 4). Moreover, intermediate values of N2O emission were found in treatments of CF, MC, MC + RH, and CF + MC + RH (8.16–9.51 g ha−1 d−1), which were significantly higher from control (p < 0.05). Unlike carbon dioxide, N2O emission from the soils of all treatments increased on the 60th day after fertilization, and the order by treatment was as follows: 2MC > CF + MC + RH > CF + MC > MC + RH > CF + RH > CF > MC > control. In particular, there was approximately a 9.3-fold difference in N2O emission between the control (5.89 g ha−1 d−1) and 2MC (54.6 g ha−1 d−1). Other treatments showed intermediate values of N2O emission, which were not significantly different from the control (p > 0.05).

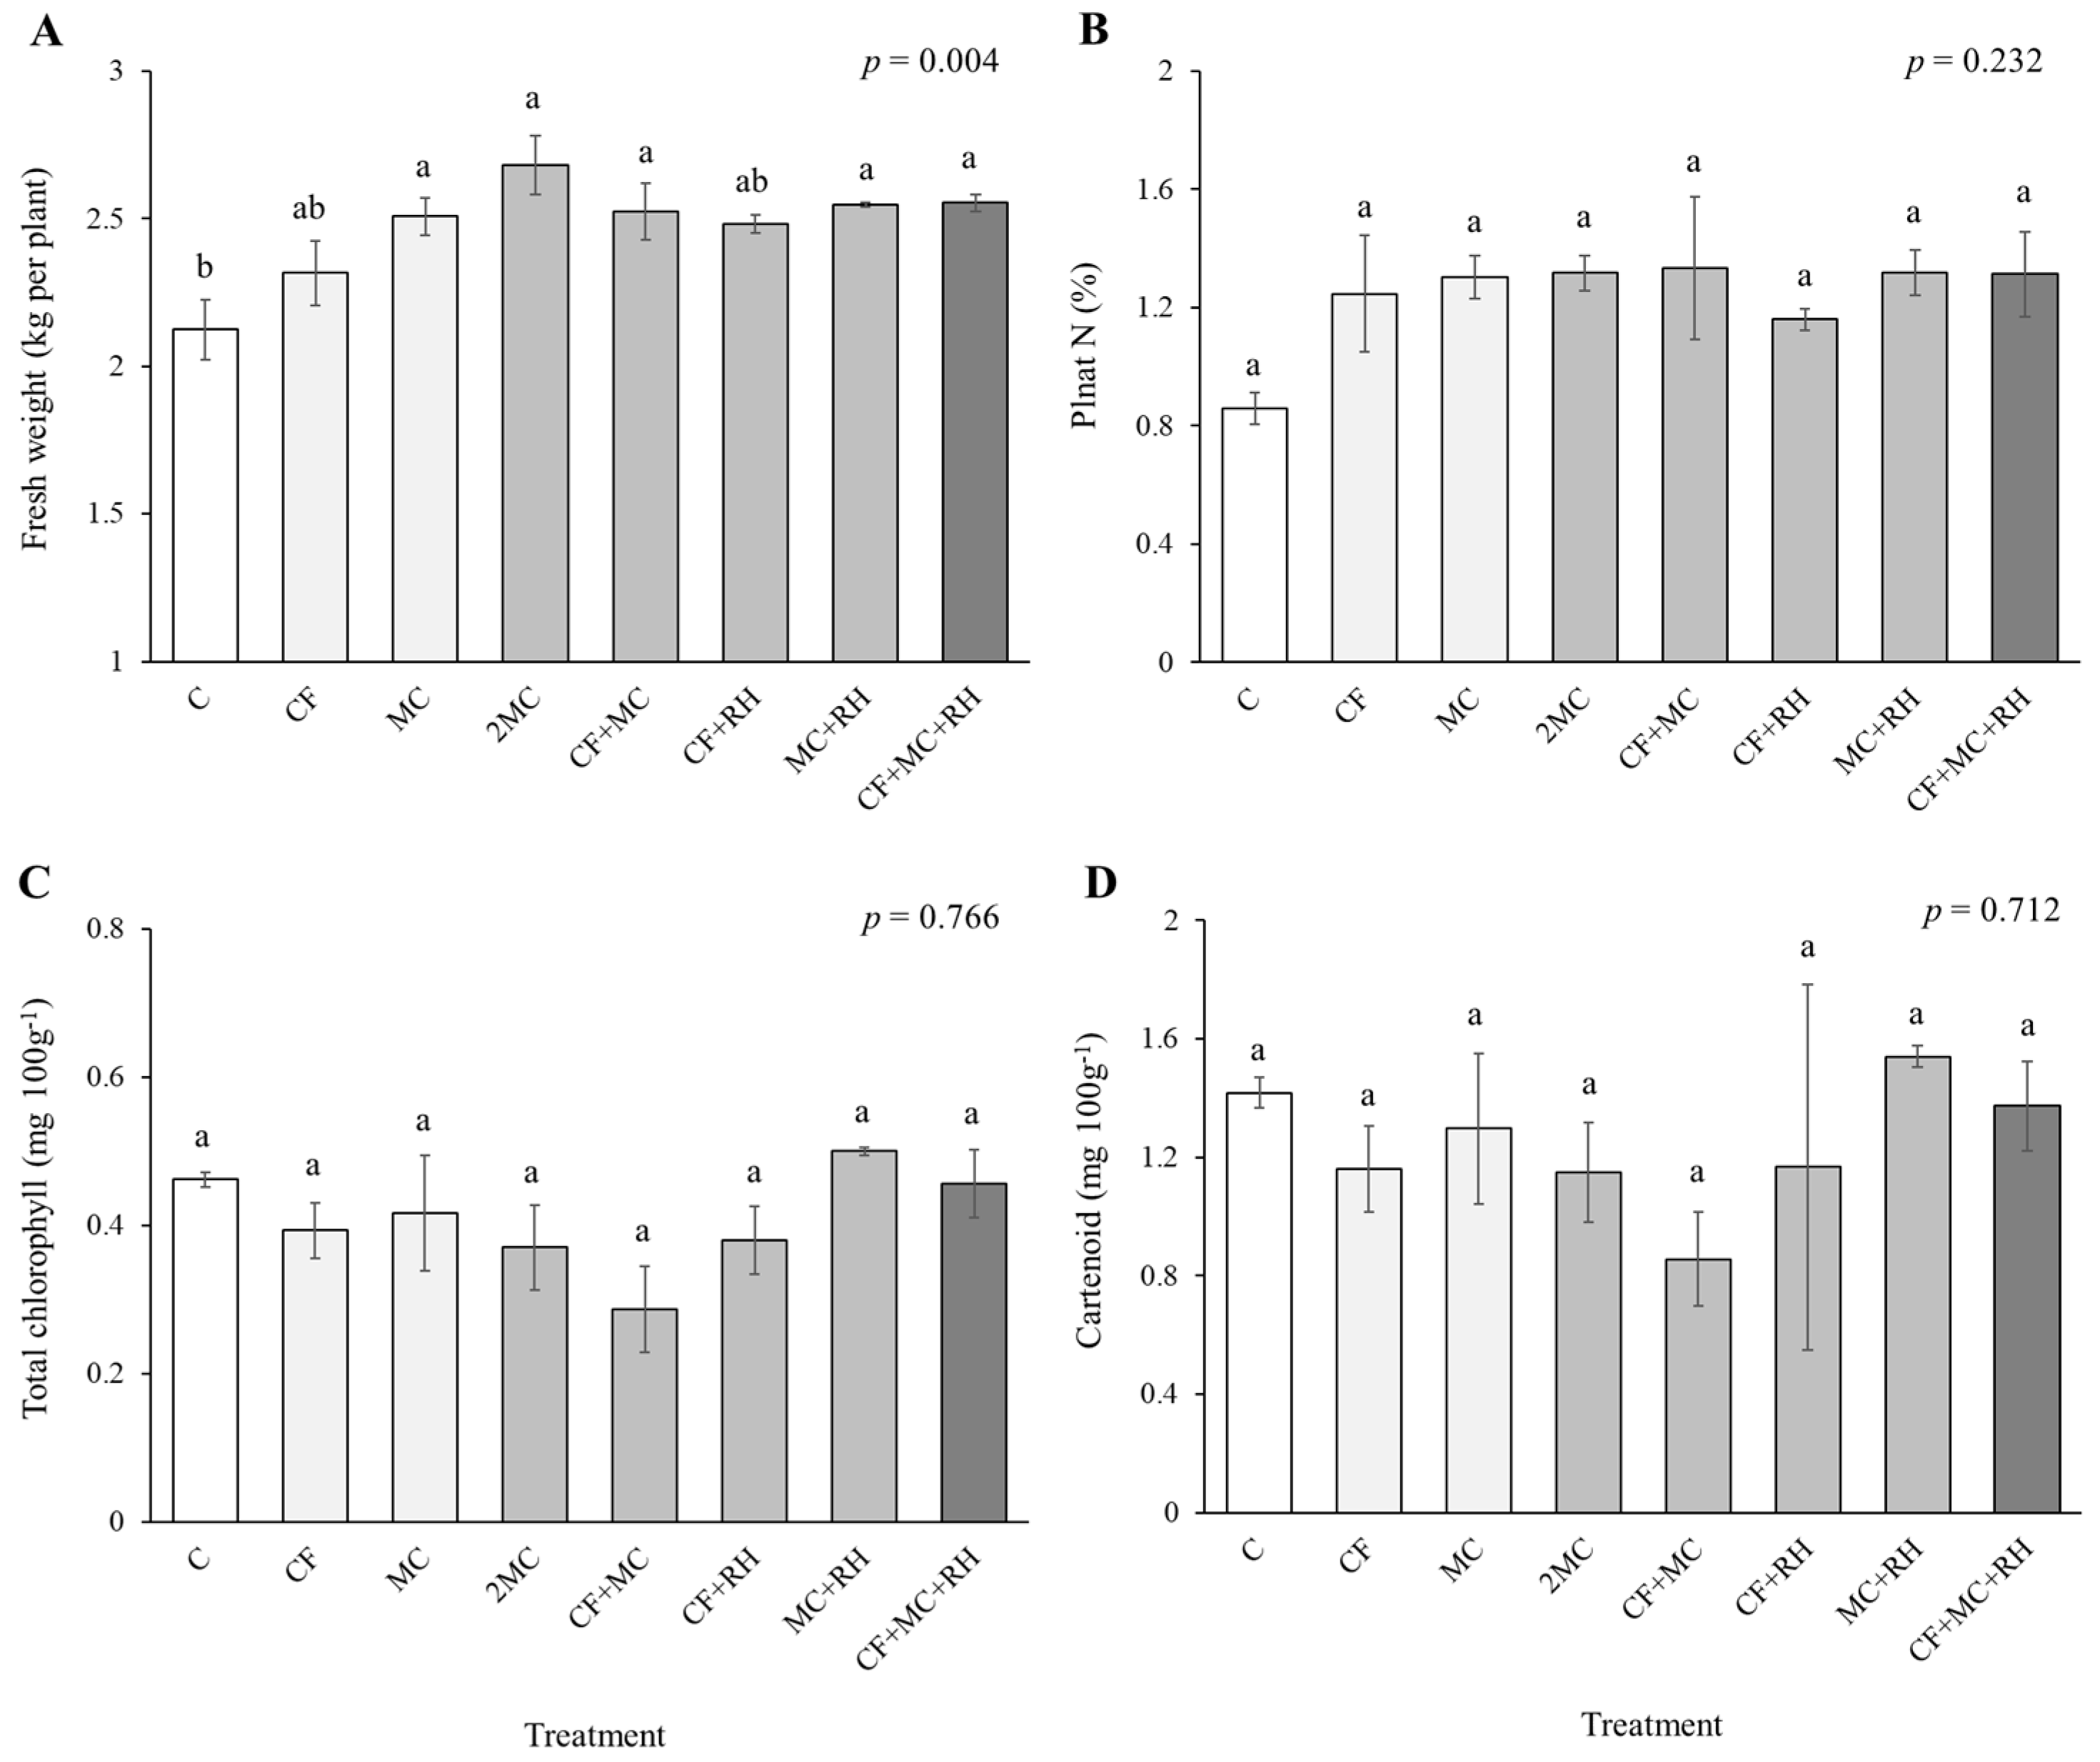
3.4. Crop Biomass and Physiological Properties

Differences in FWs of plant samples depending on the soil amendment type are shown in Figure 2. The highest FW was observed in 2MC treatment (2.7 kg plant−1), while the lowest FW was found in CF treatment (2.3 kg plant−1). The FWs in 2MC and CF treatments were 26% and 9% larger, respectively, than that in the control. As a result of measuring N concentration in plant leaves, CF + MC, MC + RH, 2MC, CF + MC + RH, and MC showed similar plant N concentrations (>1.3%), which were approximately 1.5 times higher than the control (0.86%). However, there were no significant differences in plant N concentrations among the treatments (p > 0.05). For photosynthetic pigments, the highest values of total chlorophyll and carotenoid contents were observed in MC + RH treatment, followed by CF + MC + RH, control, MC, and so on, but there were insignificant differences in those among the treatments (p > 0.05, respectively).

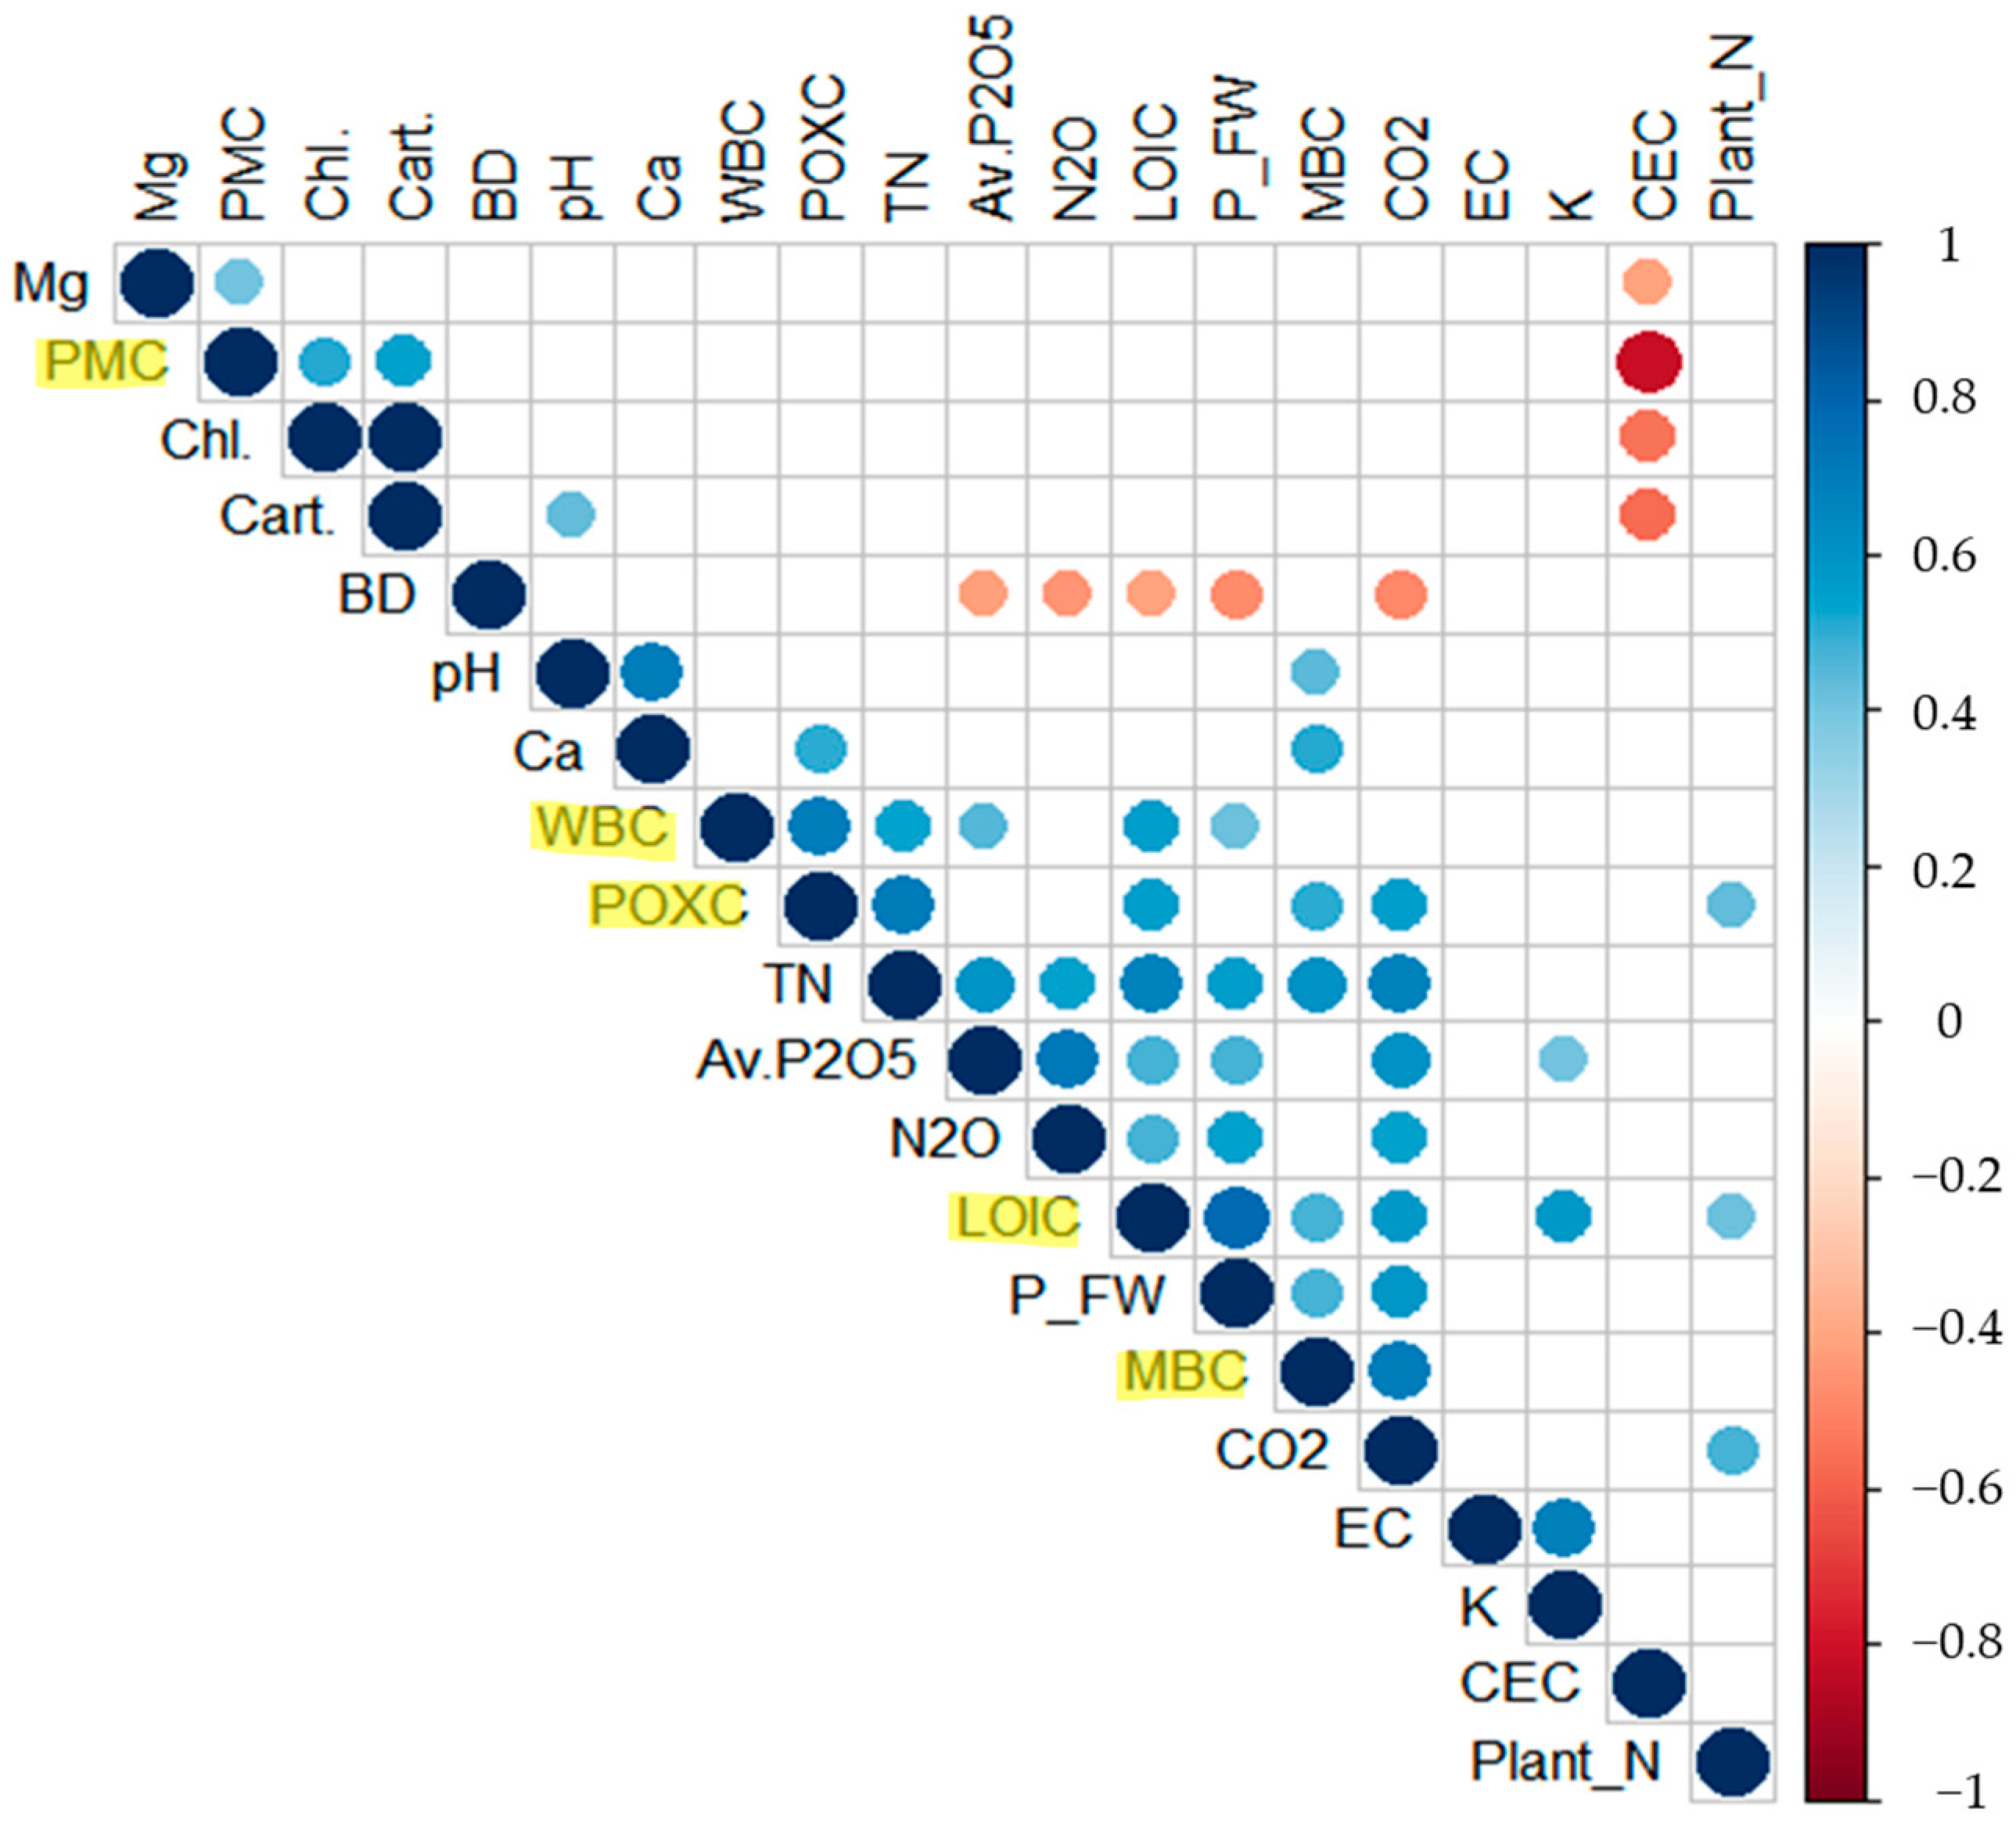
3.5. Correlations of SOC Fractions with Whole Parameters

Figure 3 represents the correlations between soil organic C fractions and parameters of soil, plant, and GHG across all treatments of soil amendments. There were significantly strong correlations among the SOC fractions (p < 0.05), except for PMC. Of the fractions, LOIC correlated positively with T-N, Av. P2O5, Ex. K, CO2, N2O, plant FW, and plant N (r = 0.67, 0.47, 0.57, 0.57, 0.48, 0.78, and 0.42, respectively), but correlated negatively with soil BD (r = −0.41). WBC had positive correlations with T-N, Av. P2O5, and plant FW (r = 0.54, 0.45, and 0.41, respectively). POXC correlated positively with T-N, Ex. Ca, and CO2 (r = 0.71, 0.50, and 0.55, respectively). PMC correlated positively with Ex. Mg and total chlorophyll and carotenoid contents (r = 0.41, 0.52, and 0.54, respectively) but negatively correlated with CEC (r = −0.82). MBC had significant correlations with pH, Ex. Ca, T-N, plant FW, and CO2 (r = 0.45, 0.52, 0.60, 0.47, and 0.70, respectively).

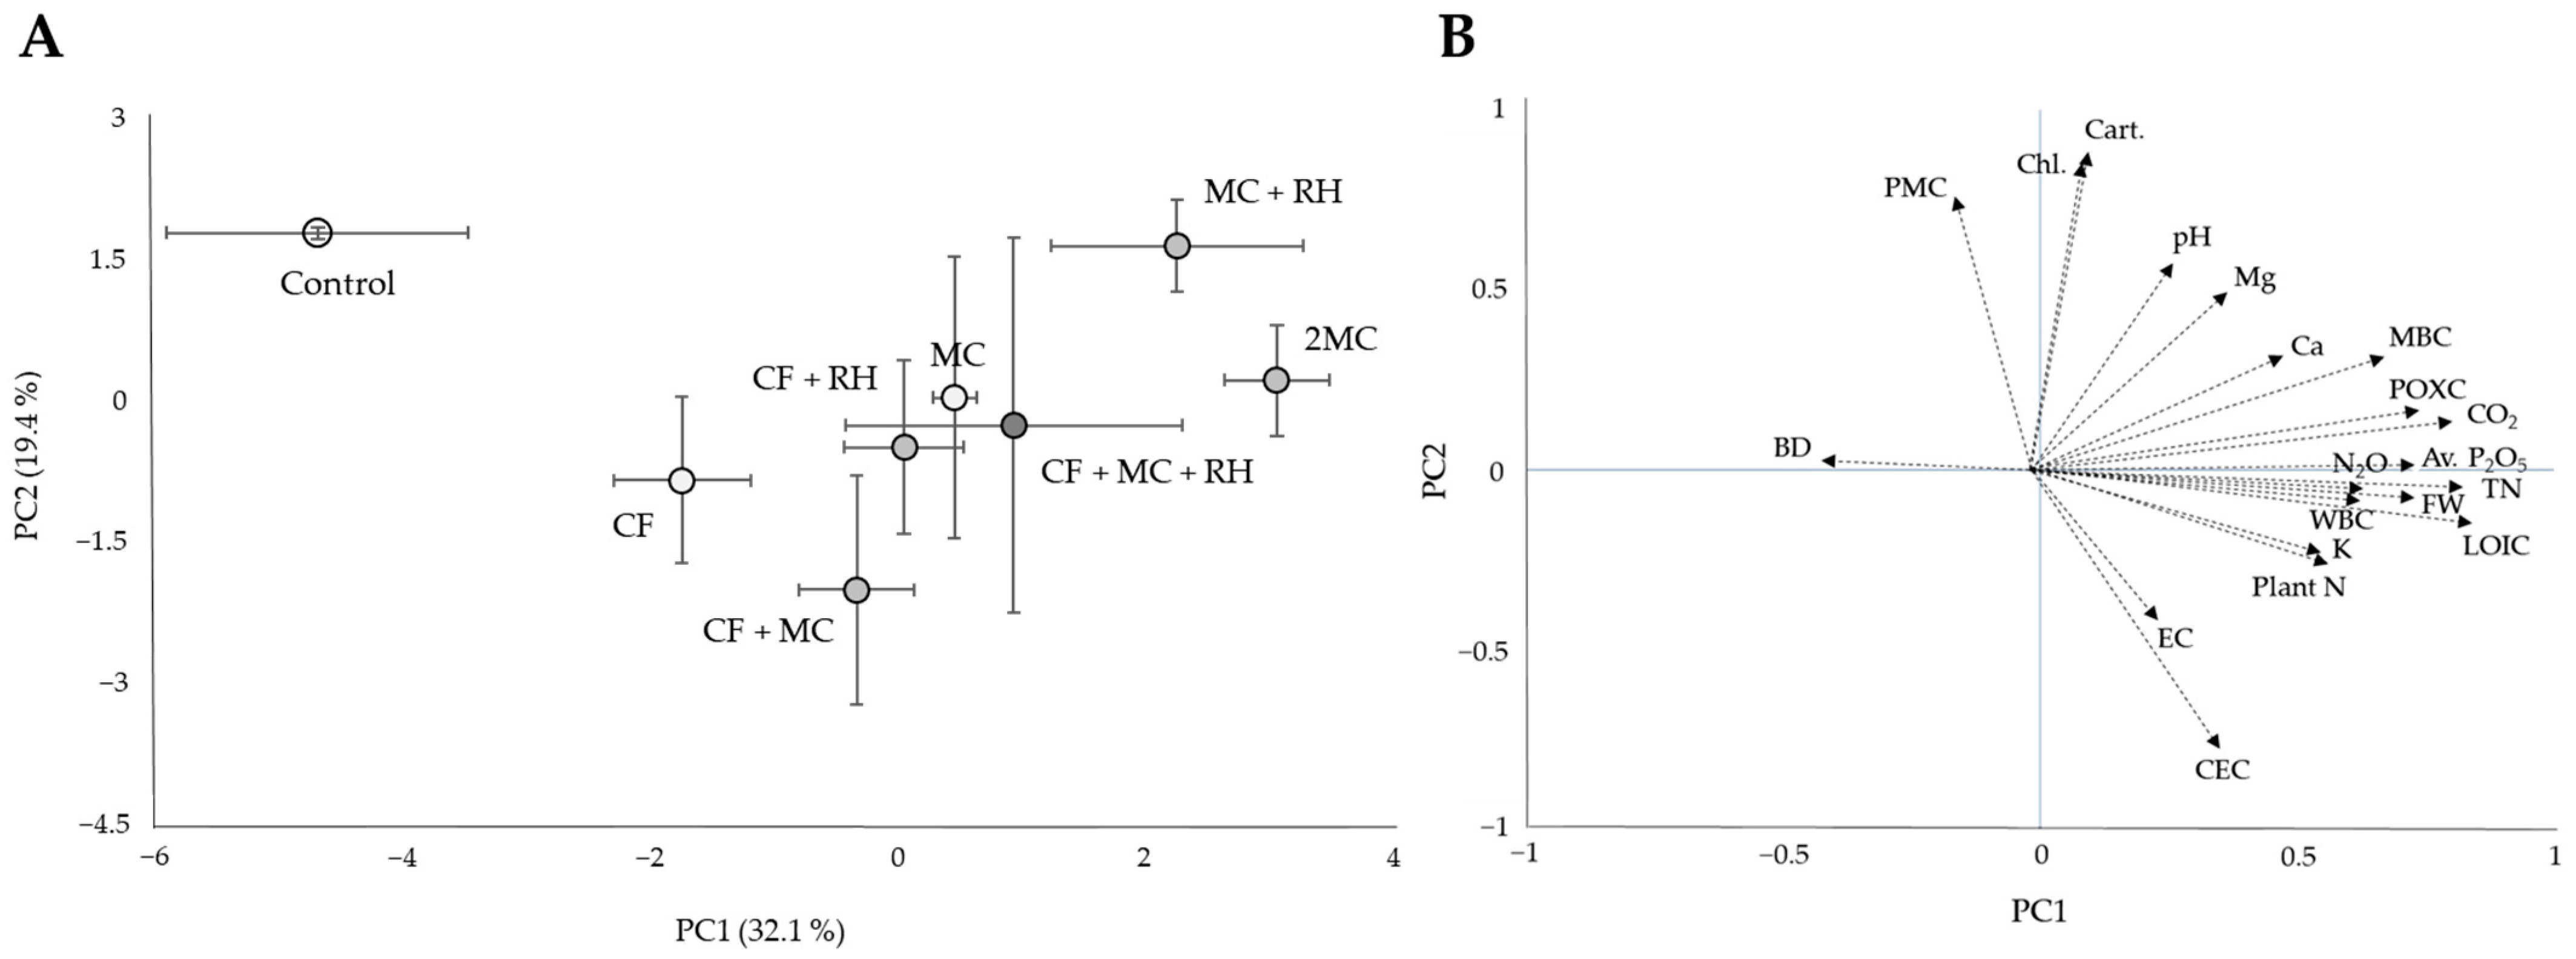
3.6. Analysis of PCA

The PCA of the dataset for all variables, including soil biogeochemical properties, plant properties, and gas emissions, provided a clear picture of the effects of soil amendment types (Figure 4). As illustrated in the PC1 axis (32.1% variance), there was a clear separation of soils with soil amendment types due primarily to SOC fractions, such as LOIC, POXC, MBC, and WBC as well as T-N, Av. P2O5, and emission of CO2 and N2O (p < 0.001). Along with the PC2 axis (19.4% variance), the soils were separated by chlorophyll and carotenoid content, PMC, and CEC (p < 0.001). Because of this multivariate analysis, there appeared to be an overall trend that adding OAs, including MC, RH, and their mixture, had a close influence on most SOC fractions, including LOIC, WBC, POXC, and MBC, as well as key soil variables (bulk density, pH, N, P, K, etc.), plant biomass, GHG emission, and their significant correlations.

4. Discussion

SOC stock regulation is critical for managing soil quality and sustaining agricultural production. However, since the capacity to store SOC in agricultural lands varies with external factors, such as climate, soil properties, and land management practices, including fertilization, tillage, and cropping system [28,29,30], appropriate land management approaches are required per region. Generally, various soil amendments have been widely introduced into farmlands to promote SOC pool, leading to further modifications of overall soil biogeochemical properties [31]. In this study, SOC fractions in upland soil appeared to be significantly influenced by the short-term fertilization practices but varied with the type of soil amendment. Clearly, adding OAs increased the amount of all SOC fractions than that of CF alone (Table 2), indicating the superiority of OA application in improving C stock in agricultural soils that can be supported by several reports from other short-term [31,32,33] and long-term [34,35] field experiments. Conversely, we found that applying OAs along with additional input of inorganic fertilizer (e.g., MC → CF + MC and MC + RH → CF + MC + RH) did not have a significant effect on all SOC fractions (Table 2). Perhaps this might be due to inadequate proportions and balance status of chemical fertilizers applied as well as crop residue and tillage management together with experimental duration [28,34]. Consistent with this, several studies have reported that applying CF does not affect the SOC pool and its fractions [36,37,38].
Of the SOC fractions, LOIC, WBC, and POXC, often used as indicators of SOC storage [14,19], were the highest in this study’s MC + RH treatment, and their concentrations were higher than those in the control: LOIC (37.2%), WBC (19.1%), and POXC (25.4%). Such increases in these SOC fractions may suggest that the co-treatment of MC and RH, which is well-balanced of labile and recalcitrant-formed organic C, would be the best approach for the short-term soil management to promote C sequestration in this upland field. Moreover, soil MBC was allowed to be enhanced by adding OAs. Similarly, Chang et al. [39] revealed that MBC in the soil of compost-applied treatments was higher than that of inorganic fertilizer treatment, explaining that this may be due to the improved availability of organic substrates to the indigenous microbial growth. Meanwhile, we could find neutral and negative effects on MBC using CF alone and CF-combined amendments, respectively, supported by Omay et al. [40] and Xue et al. [41]. According to Zhang et al. [42], such negative effects on MBC may be attributed to the occurrences of uneven nutrient supply, acidification, and compaction in the soil surface by chemical fertilization, consequently causing degradation of soil microbial community abundance and activity. Moreover, the high concentration of MBC was observed in 2MC treatment, which seemed to be due to the supply of abundant C sources by adding the largest amount of MC and the increase in abundance of newly introduced microorganisms. Then, we also observed a significant effect of additional RH inputs on MBC increase: e.g., CF → CF + RH (11.2%), MC → MC + RH (25.4%), and CF + MC → CF + MC + RH (13.7%). This indicated that although the applied RH dominantly formed recalcitrant C is very resistant to microbial degradation [43], it certainly facilitated soil microbial communities during this experiment by providing some C energy sources and microflora habitats.
Similarly to SOC fractions, physicochemical properties of arable soil considerably responded to different fertilization practices of this study (Table 3). Among the soil parameters, BD had the largest effect size on different treatments (F = 16.08, p < 0.001, ω2 = 0.81) (Table S1), indicating that applying soil amendments during the short-term experiment generated the greatest effect on the status of soil physic rather than soil biochemistry. Compared to the control, soil BD slightly decreased with CF alone, which is supported by the findings of Tang et al. [33] and Liu et al. [44]. This BD decrease may be associated with an increased turnover of crop leaves and root residues generated during growth [45]. Moreover, we found that the effect of organic-complex fertilizers outweighed that of CF alone in BD reduction. Compared to CF treatment, significantly greater BD reduction was observed in treatments of OAs, such as MC (4.2%), 2MC (8.4%), and MC + RH (5.9%), and in combination with CF, such as CF + MC + RH (22%) (Table 3). This appears to be due to organic additives being lighter than an equal volume of solid soil and more porous, thereby lowering BD in the organic matter-enriched soils. Moreover, during the decomposition of the organic compounds, the formation of macropores and macroaggregates generated by the adsorption of organic acids and polysaccharides secreted by microorganisms could contribute to soil BD reduction [29,33]. In particular, of the SOC fractions, LOIC showed the largest negative correlation with soil BD, indicating that increased recalcitrant-formed C through the input of soil amendments resulted in a significant reduction in soil BD [29,46]. Therefore, our findings suggest that the enhanced SOC pool in the upland’s surface layer mainly by adding OAs, and the incidental accumulation of plant residues generated during this experiment improved the overall soil physical status. Several studies demonstrated such benefits of adding OAs, e.g., stabilizing soil aggregation against slaking and dispersion and promoting soil aeration and moisture retention, in agricultural soils, which would contribute to crop yield increase in turn [47,48,49].
Soil chemical properties, including pH, EC, T-N, Av. P2O5, CEC, and Ex. Ca, K, and Mg, were affected by adding soil amendments, but their changes varied significantly with the soil amendment type (Table 3). Compared to the control, all treatments, including CF, MC, RH, and their combinations, showed higher concentrations of these variables. The most significant differences were observed in the soils treated with OAs. Of the minerals, T-N and Av. P2O5 concentrations were higher in MC, MC + RH, or 2MC treatments than in CF alone treatment (p < 0.05), indicating that increased SOM by adding OAs improved the soil retention for these key nutrients essential for crop growth and production [50]. As a basis to support this, significant correlations of T-N and Av. P2O5 with most SOC fractions, such as LOIC, WBC, POXC, or MBC, were found throughout this study’s treatments (Figure 3).
Recently, intensive agricultural practices for crop production have been characterized by high N fertilizer application and frequent tillage events, causing a significant amount of soil-borne GHG emissions [51]. Moreover, it can be expected that the provision of C and N sources subsequently circulated to the atmosphere through OA application promotes GHG release from the agricultural soils. However, there remains no consensus on whether adding OAs increases or decreases GHG emissions from soil [52] because it varies significantly with climate conditions, soil properties, and the quality and quantity of organic additives applied [53,54]. In this study, CO2 and N2O showed considerably large effect sizes, ω2 = 0.81 and 0.54, respectively (Table S1), indicating that GHG emissions had significant sensitivity to different fertilization. In particular, the amounts of CO2 and N2O emissions were significantly higher in the treatments of OAs and in combination with CF than in the control treatment, regardless of the measurement dates (Table 4). Bhattacharyya et al. [55] reported the highest CO2 and N2O fluxes by the co-application of manure and NPK fertilizers, and they explained that the balanced fertilization through inorganic and organic amendment treatment promoted the formation of the labile source of C and N, leading to higher soil heterotrophic GHG flux. Conversely, in this study, it was observed that the amount of both gases emitted from the field soil of 2MC treatment outperformed the amount generated in the combination treatments, including CF + MC or CF + MC + RH. This shows that the larger amount of composted manure, which can be readily decomposed in the short-term, applied to nutrient-limited agricultural land was vaporized more provocatively by promoting soil microbial population and respiration. This could be elucidated by the strongest linear regression between CO2 and MBC (Table S2), indicating that the elevated CO2 emission was attributed to an increase in the microbial-related LSOC fraction by fertilizer applications [16,56]. Meanwhile, nitrous oxide showed significant relationships with LOIC and T-N (Table S2), indicating that enhanced SOM by adding soil amendments promotes the status of mineral N, which could then affect denitrification in the soil. In particular, adding MC with a lower C/N ratio (15.9:1) showed a larger effect on N2O emission than that of RH (85.1:1): e.g., MC → 2MC (160% increase) > MC → MC + RH (50% increase). This is consistent with a result of Dalal et al. [57], who demonstrated that applying feedlot MC with a lower C/N ratio (11.6:1) increased N2O emission relative to green waste compost (C/N ratio of 19:1).
Since crop productivity is highly dependent on the fertility and quality of agricultural soil, systematic and well-managed farmland can ensure sustainable production and increased yield of crops [31]. Our results showed that, similarly to the major parameters of soil, the FW of cabbage was significantly sensitive to different amendment applications (F = 4.93, p = 0.004, ω2 = 0.53), indicating that the crop yield could vary significantly with the modified fertility and quality of soil by different fertilization in this study. Moreover, significantly higher FWs were observed in treatments, including OAs, and in combination with CF rather than in the control treatment (p < 0.05). In particular, with significant correlations of plant FW with LOIC, BD, T-N, and Av. P2O5 along the first axis of PCA (Figure 4B), we could assert how important the altered SOC status and key soil properties through fertilization are in improving crop production. Moreover, the PCA component score matrix (Figure 4A) well reflected that the close correlation between these variables was highly associated with the application effect of soil amendments containing mainly organic additives, suggesting the superior role of OAs in agricultural soil’s quality and productivity regulation [58,59].
Chlorophyll and carotenoids, as chloroplast pigments, play a vital role in photosynthesis and serving primary metabolites, so they are well-known as essential elements for crop growth and production [60,61]. Currently, the quantity of both pigments in the green tissues of vegetables is widely used as a key parameter to evaluate the quality and performance of crops [62] as well as maturity and storability [63]. In particular, with significant correlations with N content in plants [64,65,66], the analysis of chlorophyll content is widely conducted to determine the nutrient status of crops [62], and this further helps prepare a better soil management approach to enhance N use efficiency [67]. In this study, we found insignificant differences in the photosynthetic pigments and N content in the leaves of cabbage among the treatments (Figure 2) and significant correlations between both variables as well (Figure 3). This phenomenon is far from the response of soil biogeochemical properties to different fertilizer treatments, which may be due to various limitations during this experiment, including cold damage in the early growth stages, emerging plant pathogens, heavy rain, etc. Conversely, the N content in the plant was significantly correlated with POXC and LOIC fractions, indicating that increased SOM through fertilization tended to improve the N uptake of plants. Moreover, the highest values of chlorophyll and carotenoids were observed in MC + RH treatment, probably suggesting that applying manure compost together with rice husk would be an alternative to replace conventional farming methods, including chemical fertilization with or without organic additives. This has been practiced in this field for the past decade in terms of improving the quality of crops and economical farm management.
Soil organic C fractions have been widely used as an indicator of soil quality and health [12,68]. However, because each SOC fraction is often influenced differently by land management practices [18], it is difficult to select which fraction will be the best SQI applicant. In this study, Table S2 shows tendencies in the overall association between the status of SOC fractions and change in key parameters highly related to soil quality and productivity after fertilization in short-term cultivation duration. Among the SOC fractions, LOIC classified as a recalcitrant form appeared to have the highest linear relationship with BD (R2 = 16.6%) and plant FW (R2 = 60.8%), suggesting that LOIC would be a good indicator to predict the improvement of physical properties of both soil and plant. Conversely, soil key minerals, such as N, P, and K, had the greatest linear relationships with some SOC fractions: POXC with T-N (R2 = 60.8%) and LOIC with Av. P2O5 (R2 = 22.3%) and Ex. K (R2 = 32.9%). With the highest linear relationship between POXC and plant N content was observed (R2 = 19.3%), we could also infer that POXC would be the best predictor of N uptake efficiency in agricultural soils. Furthermore, the highest linear relationship of POXC with MBC (R2 = 25.9%) suggests that the active C will promote microbial abundance and activity in cultivated soils. Overall, the SOC fraction with an intermediate dynamic, i.e., POXC, seems to be a crucial indicator to identify short-term fertilization effects than other fractions, especially in terms of N mineralization. Therefore, the routine testing of selected SOC fractions is expected to be a cost-effective method to fertilize the soil and improve crop performance, at least in upland areas.

5. Conclusions

Our findings obtained from this short-term field experiment revealed that the status of SOC and its fractions can significantly vary with the type of soil amendment, especially OAs, including MC + RH and 2MC. Rather than CF alone, OAs represented a larger effect size on major soil parameters (e.g., BD, MBC, T-N, Av. P2O5, etc.), highly associated with improving soil quality and productivity. Moreover, strong correlations between SOC fractions and these soil parameters suggest that enhanced SOC dynamics through OA application could promote biogeochemical processes of the arable soil, closely linked with soil fertility and subsequent crop performance. In particular, the strongest relationship of LOIC with plant FW, BD, and soluble P and K suggests that this recalcitrant C form could reflect an improvement in physical properties of either soil or plant and the bioavailability of the two minerals. Meanwhile, with the strong relationship of POXC with T-N, N content in plants, and MBC, we could infer that the moderate liable C fraction would be a good indicator to identify the short-term fertilization effects, especially in terms of N mineralization associated with soil microorganisms. Therefore, the routine testing of selected SOC fractions will be a cost-effective method to manage agricultural land’s quality and productivity effectively. Based on our findings, applying MC together with RH would be an alternative to replace conventional farming practices in this upland for improving overall soil quality and health as well as crop performance, both eco-effectively and economically.

Supplementary Materials

The following supporting information can be downloaded at: https://www.mdpi.com/article/10.3390/agronomy12051106/s1, Table S1: Analysis of influences of different fertilizer applications on soil organic carbon fractions, properties of soil and plant, and gas emission based on omega squared (ω2) from ANOVA model; Table S2: Relationship of linear regression between soil organic C fractions and variables of soil, plant, GHGs (R-sq: %; * p < 0.05, ** p < 0.01. *** p < 0.001, ns p > 0.05). The largest R2 value in each row is indicated in bold.

Author Contributions

Conceptualization, Y.-N.K., Y.-S.C. and K.-H.K.; methodology, Y.-N.K., Y.-S.C. and J.-H.L.; software, Y.-N.K. and H.-R.S.; formal analysis, Y.-S.C., J.-H.L., H.-R.S. and D.-B.L.; investigation, Y.-N.K. and B.-H.K.; writing—original draft preparation, Y.-N.K.; writing—review and editing, Y.-N.K. and Y.B.L.; supervision, K.-H.K.; funding acquisition, K.-H.K. All authors have read and agreed to the published version of the manuscript.

Funding

This research was supported by the project funded by the Rural Development Administration, Republic of Korea (Project No. PJ015106032022).

Data Availability Statement

Not applicable.

Conflicts of Interest

The authors declare no conflict of interest.

References

  1. Gong, W.; Yan, X.; Wang, J.; Hu, T.; Gong, Y. Long-Term Manure and Fertilizer Effects on Soil Organic Matter Fractions and Microbes under a Wheat–Maize Cropping System in Northern China. Geoderma 2009, 149, 318–324. [Google Scholar] [CrossRef]
  2. FAO. Plant Nutrition for Food Security: A Guide for Integrated Nutrient Management; Roy, R.N., Finck, A., Blair, G.J., Tandon, H.L.S., Eds.; FAO fertilizer and plant nutrition bulletin; Food and Agriculture Organization of the United Nations: Rome, Italy, 2006; p. 348. [Google Scholar] [CrossRef]
  3. Savci, S. An Agricultural Pollutant: Chemical Fertilizer. IJESD 2012, 3, 73–80. [Google Scholar] [CrossRef] [Green Version]
  4. Srivastav, A.L. Chemical Fertilizers and Pesticides: Role in Groundwater Contamination. In Agrochemicals Detection, Treatment and Remediation; Prasad, M.N.V., Ed.; Butterworth-Heinemann: Oxford, UK, 2020; Chapter 6; pp. 143–159. [Google Scholar]
  5. Clark, S. Organic Farming and Climate Change: The Need for Innovation. Sustainability 2020, 12, 7012. [Google Scholar] [CrossRef]
  6. Xu, C.; Wang, J.; Wu, D.; Li, C.; Wang, L.; Ji, C.; Zhang, Y.; Ai, Y. Optimizing Organic Amendment Applications to Enhance Carbon Sequestration and Economic Benefits in an Infertile Sandy Soil. J. Environ. Manag. 2022, 303, 114129. [Google Scholar] [CrossRef]
  7. Franzluebbers, A.J. Soil Organic Matter Stratification Ratio as an Indicator of Soil Quality. Soil Tillage Res. 2002, 66, 95–106. [Google Scholar] [CrossRef]
  8. Mirsky, S.B.; Lanyon, L.E.; Needelman, B.A. Evaluating Soil Management Using Particulate and Chemically Labile Soil Organic Matter Fractions. Soil Sci. Soc. Am. J. 2008, 72, 180–185. [Google Scholar] [CrossRef]
  9. Deb, S.; Bhadoria, P.B.S.; Mandal, B.; Rakshit, A.; Singh, H.B. Soil Organic Carbon: Towards Better Soil Health, Productivity and Climate Change Mitigation. Clim. Chang. Environ. Sustain. 2015, 3, 26. [Google Scholar] [CrossRef]
  10. Wander, M.M. Soil Organic Matter Fractions and Their Relevance to Soil Function. In Soil Organic Matter in Sustainable Agriculture; Magdoff, F., Weil, R., Eds.; Advances in Agroecology; CRC Press: Boca Raton, FL, USA, 2004; pp. 67–102. [Google Scholar]
  11. Bolan, N.; Kunhikrishnan, A.; Thangarajan, R.; Kumpiene, J.; Park, J.; Makino, T.; Kirkham, M.B.; Scheckel, K. Remediation of Heavy Metal(Loid)s Contaminated Soils—To Mobilize or to Immobilize? J. Hazard. Mater. 2014, 266, 141–166. [Google Scholar] [CrossRef]
  12. Bongiorno, G.; Bünemann, E.K.; Oguejiofor, C.U.; Meier, J.; Gort, G.; Comans, R.; Mäder, P.; Brussaard, L.; de Goede, R. Sensitivity of Labile Carbon Fractions to Tillage and Organic Matter Management and Their Potential as Comprehensive Soil Quality Indicators across Pedoclimatic Conditions in Europe. Ecol. Indic. 2019, 99, 38–50. [Google Scholar] [CrossRef]
  13. Culman, S.W.; Snapp, S.S.; Green, J.M.; Gentry, L.E. Short- and Long-Term Labile Soil Carbon and Nitrogen Dynamics Reflect Management and Predict Corn Agronomic Performance. Agron. J. 2013, 105, 493–502. [Google Scholar] [CrossRef]
  14. Hurisso, T.T.; Culman, S.W.; Horwath, W.R.; Wade, J.; Cass, D.; Beniston, J.W.; Bowles, T.M.; Grandy, A.S.; Franzluebbers, A.J.; Schipanski, M.E.; et al. Comparison of Permanganate-Oxidizable Carbon and Mineralizable Carbon for Assessment of Organic Matter Stabilization and Mineralization. Soil Sci. Soc. Am. J. 2016, 80, 1352–1364. [Google Scholar] [CrossRef]
  15. Lewis, D.B.; Kaye, J.P.; Jabbour, R.; Barbercheck, M.E. Labile Carbon and Other Soil Quality Indicators in Two Tillage Systems during Transition to Organic Agriculture. Renew. Agric. Food Syst. 2011, 26, 342–353. [Google Scholar] [CrossRef]
  16. Li, J.; Wu, X.; Gebremikael, M.T.; Wu, H.; Cai, D.; Wang, B.; Li, B.; Zhang, J.; Li, Y.; Xi, J. Response of Soil Organic Carbon Fractions, Microbial Community Composition and Carbon Mineralization to High-Input Fertilizer Practices under an Intensive Agricultural System. PLoS ONE 2018, 13, e0195144. [Google Scholar] [CrossRef] [PubMed] [Green Version]
  17. Gong, W.; Yan, X.; Wang, J.; Hu, T.; Gong, Y. Long-Term Manuring and Fertilization Effects on Soil Organic Carbon Pools under a Wheat–Maize Cropping System in North China Plain. Plant Soil 2009, 314, 67–76. [Google Scholar] [CrossRef]
  18. Haynes, R.J. Labile Organic Matter Fractions as Centralcomponents of the Quality of Agricultural Soils: Anoverview. Adv. Agron. 2005, 5, 221–268. [Google Scholar]
  19. Weil, R.R.; Islam, K.R.; Stine, M.A.; Gruver, J.B.; Samson-Liebig, S.E. Estimating Active Carbon for Soil Quality Assessment: A Simplified Method for Laboratory and Field Use. Am. J. Altern. Agric. 2003, 18, 3–17. [Google Scholar]
  20. Culman, S.W.; Snapp, S.S.; Freeman, M.A.; Schipanski, M.E.; Beniston, J.; Lal, R.; Drinkwater, L.E.; Franzluebbers, A.J.; Glover, J.D.; Grandy, A.S. Permanganate Oxidizable Carbon Reflects a Processed Soil Fraction That Is Sensitive to Management. Soil Sci. Soc. Am. J. 2012, 76, 494–504. [Google Scholar] [CrossRef] [Green Version]
  21. Heiri, O.; Lotter, A.F.; Lemcke, G. Loss on Ignition as a Method for Estimating Organic and Carbonate Content in Sediments: Reproducibility and Comparability of Results. J. Paleolimnol. 2001, 25, 101–110. [Google Scholar] [CrossRef]
  22. Nelson, D.W.; Sommers, L.E. Total Carbon, Organic Carbon, and Organic Matter. In Methods of Soil Analysis: Part 3 Chemical Methods; Sparks, D.L., Page, A.L., Helmke, P.A., Loeppert, R.H., Soltanpour, P.N., Tabatabai, M.A., Johnston, C.T., Summer, M.E., Eds.; Soil Science Society of America—American Society of Agronomy: Madison, WI, USA, 1996; Chapter 34; pp. 961–1010. [Google Scholar] [CrossRef]
  23. Franzluebbers, A.J.; Haney, R.L.; Honeycutt, C.W.; Schomberg, H.H.; Hons, F.M. Flush of Carbon Dioxide Following Rewetting of Dried Soil Relates to Active Organic Pools. Soil Sci. Soc. Am. J. 2000, 64, 613–623. [Google Scholar] [CrossRef]
  24. Vance, E.D.; Brookes, P.C.; Jenkinson, D.S. An Extraction Method for Measuring Soil Microbial Biomass C. Soil Biol. Biochem. 1987, 19, 703–707. [Google Scholar] [CrossRef]
  25. NIAST. Methods of Analysis of Soil and Plant; RDA: Suwon, Korea, 2000. [Google Scholar]
  26. Bray, R.H.; Kurtz, L.T. Determination of Total, Organic, and Available Forms of Phosphorus in Soils. Soil Sci. 1945, 59, 39–46. [Google Scholar] [CrossRef]
  27. Lichtenthaler, H.K. Chlorophylls and Carotenoids: Pigments of Photosynthetic Biomembranes. Meth. Enzymol. 1987, 148, 350–382. [Google Scholar]
  28. Ding, X.; Yuan, Y.; Liang, Y.; Li, L.; Han, X. Impact of Long-Term Application of Manure, Crop Residue, and Mineral Fertilizer on Organic Carbon Pools and Crop Yields in a Mollisol. J. Soils Sediments 2014, 14, 854–859. [Google Scholar] [CrossRef]
  29. Brar, B.S.; Singh, K.; Dheri, G.S. Carbon Sequestration and Soil Carbon Pools in a Rice–Wheat Cropping System: Effect of Long-Term Use of Inorganic Fertilizers and Organic Manure. Soil Tillage Res. 2013, 128, 30–36. [Google Scholar] [CrossRef]
  30. Yan, X.; Zhou, H.; Zhu, Q.H.; Wang, X.F.; Zhang, Y.Z.; Yu, X.C.; Peng, X. Carbon Sequestration Efficiency in Paddy Soil and Upland Soil under Long-Term Fertilization in Southern China. Soil Tillage Res. 2013, 130, 42–51. [Google Scholar] [CrossRef]
  31. Zhu, L.; Hu, N.; Zhang, Z.; Xu, J.; Tao, B.; Meng, Y. Short-Term Responses of Soil Organic Carbon and Carbon Pool Management Index to Different Annual Straw Return Rates in a Rice–Wheat Cropping System. Catena 2015, 135, 283–289. [Google Scholar] [CrossRef]
  32. Ghosh, M.; Ashiq, W.; Bhogilal Vasava, H.; Gamage, D.N.V.; Patra, P.K.; Biswas, A. Short-Term Carbon Sequestration and Changes of Soil Organic Carbon Pools in Rice under Integrated Nutrient Management in India. Agriculture 2021, 11, 348. [Google Scholar] [CrossRef]
  33. Tang, H.; Xiao, X.; Li, C.; Pan, X.; Cheng, K.; Shi, L.; Li, W. Short-Term Responses of Soil Organic Carbon and Its Labile Fractions to Different Manure Nitrogen Input in a Double-Cropping Rice Field. J. Agric. Sci. 2020, 158, 119–127. [Google Scholar] [CrossRef]
  34. Lou, Y.; Wang, J.; Liang, W. Impacts of 22-Year Organic and Inorganic N Managements on Soil Organic C Fractions in a Maize Field, Northeast China. Catena 2011, 87, 386–390. [Google Scholar] [CrossRef]
  35. Zhang, Z.; Yan, J.; Han, X.; Zou, W.; Chen, X.; Lu, X.; Feng, Y. Labile Organic Carbon Fractions Drive Soil Microbial Communities after Long-Term Fertilization. Glob. Ecol. Conserv. 2021, 32, e01867. [Google Scholar] [CrossRef]
  36. Manna, M.C.; Swarup, A.; Wanjari, R.H.; Singh, Y.V.; Ghosh, P.K.; Singh, K.N.; Tripathi, A.K.; Saha, M.N. Soil Organic Matter in a West Bengal Inceptisol after 30 Years of Multiple Cropping and Fertilization. Soil Sci. Soc. Am. J. 2006, 70, 121–129. [Google Scholar] [CrossRef]
  37. Rudrappa, L.; Purakayastha, T.J.; Singh, D.; Bhadraray, S. Long-Term Manuring and Fertilization Effects on Soil Organic Carbon Pools in a Typic Haplustept of Semi-Arid Sub-Tropical India. Soil Tillage Res. 2006, 88, 180–192. [Google Scholar] [CrossRef]
  38. Lou, Y.; Xu, M.; Wang, W.; Sun, X.; Liang, C. Soil Organic Carbon Fractions and Management Index after 20 Yr of Manure and Fertilizer Application for Greenhouse Vegetables: Soil Organic C and Fertilizer Use. Soil Use Manag. 2011, 27, 163–169. [Google Scholar] [CrossRef]
  39. Chang, E.-H.; Wang, C.-H.; Chen, C.-L.; Chung, R.-S. Effects of Long-Term Treatments of Different Organic Fertilizers Complemented with Chemical N Fertilizer on the Chemical and Biological Properties of Soils. Soil Sci. Plant Nutr. 2014, 60, 499–511. [Google Scholar] [CrossRef]
  40. Omay, A.B.; Rice, C.W.; Maddux, L.D.; Gordon, W.B. Changes in Soil Microbial and Chemical Properties under Long-term Crop Rotation and Fertilization. Soil Sci. Soc. Am. J. 1997, 61, 1672–1678. [Google Scholar] [CrossRef]
  41. Xue, D.; Yao, H.; Huang, C. Microbial Biomass, N Mineralization and Nitrification, Enzyme Activities, and Microbial Community Diversity in Tea Orchard Soils. Plant Soil 2006, 288, 319–331. [Google Scholar] [CrossRef]
  42. Zhang, D.; Yang, X.; Wang, Y.; Zong, J.; Ma, J.; Li, C. Changes in Soil Organic Carbon Fractions and Bacterial Community Composition under Different Tillage and Organic Fertiliser Application in a Maize−Wheat Rotation System. Acta Agric. Scand. B Soil Plant Sci. 2020, 70, 457–466. [Google Scholar] [CrossRef]
  43. Anda, M.; Syed Omar, S.R.; Shamshuddin, J.; Fauziah, C.I. Changes in Properties of Composting Rice Husk and Their Effects on Soil and Cocoa Growth. Commun. Soil Sci. Plant Anal. 2008, 39, 2221–2249. [Google Scholar] [CrossRef]
  44. Liu, E.; Teclemariam, S.G.; Yan, C.; Yu, J.; Gu, R.; Liu, S.; He, W.; Liu, Q. Long-Term Effects of No-Tillage Management Practice on Soil Organic Carbon and Its Fractions in the Northern China. Geoderma 2014, 213, 379–384. [Google Scholar] [CrossRef]
  45. Jiang, H.-M.; Jiang, J.-P.; Jia, Y.; Li, F.-M.; Xu, J.-Z. Soil Carbon Pool and Effects of Soil Fertility in Seeded Alfalfa Fields on the Semi-Arid Loess Plateau in China. Soil Biol. Biochem. 2006, 38, 2350–2358. [Google Scholar] [CrossRef]
  46. Iqbal, A.; He, L.; Khan, A.; Wei, S.; Akhtar, K.; Ali, I.; Ullah, S.; Munsif, F.; Zhao, Q.; Jiang, L. Organic Manure Coupled with Inorganic Fertilizer: An Approach for the Sustainable Production of Rice by Improving Soil Properties and Nitrogen Use Efficiency. Agronomy 2019, 9, 651. [Google Scholar] [CrossRef] [Green Version]
  47. Chen, C.; Liu, W.; Jiang, X.; Wu, J. Effects of Rubber-Based Agroforestry Systems on Soil Aggregation and Associated Soil Organic Carbon: Implications for Land Use. Geoderma 2017, 299, 13–24. [Google Scholar] [CrossRef]
  48. Logsdon, S.D.; Karlen, D.L. Bulk Density as a Soil Quality Indicator during Conversion to No-Tillage. Soil Tillage Res. 2004, 78, 143–149. [Google Scholar] [CrossRef]
  49. Dong, L.; Zhang, W.; Xiong, Y.; Zou, J.; Huang, Q.; Xu, X.; Ren, P.; Huang, G. Impact of Short-Term Organic Amendments Incorporation on Soil Structure and Hydrology in Semiarid Agricultural Lands. Int. Soil Water Conserv. Res. 2021, in press. [Google Scholar] [CrossRef]
  50. Adugna, G. A Review on Impact of Compost on Soil Properties, Water Use and Crop Productivity. Acad. Res. J. Agric. Sci. Res. 2016, 4, 93–104. [Google Scholar]
  51. De Rosa, D.; Rowlings, D.W.; Biala, J.; Scheer, C.; Basso, B.; Grace, P.R. N2O and CO2 Emissions Following Repeated Application of Organic and Mineral N Fertiliser from a Vegetable Crop Rotation. Sci. Total Environ. 2018, 637, 813–824. [Google Scholar] [CrossRef] [PubMed]
  52. Graham, R.F.; Wortman, S.E.; Pittelkow, C.M. Comparison of Organic and Integrated Nutrient Management Strategies for Reducing Soil N2O Emissions. Sustainability 2017, 9, 510. [Google Scholar] [CrossRef] [Green Version]
  53. Thangarajan, R.; Bolan, N.S.; Tian, G.; Naidu, R.; Kunhikrishnan, A. Role of Organic Amendment Application on Greenhouse Gas Emission from Soil. Sci. Total Environ. 2013, 465, 72–96. [Google Scholar] [CrossRef]
  54. Charles, A.; Rochette, P.; Whalen, J.K.; Angers, D.A.; Chantigny, M.H.; Bertrand, N. Global Nitrous Oxide Emission Factors from Agricultural Soils after Addition of Organic Amendments: A Meta-Analysis. Agric. Ecosyst. Environ. 2017, 236, 88–98. [Google Scholar] [CrossRef]
  55. Bhattacharyya, P.; Nayak, A.K.; Mohanty, S.; Tripathi, R.; Shahid, M.; Kumar, A.; Raja, R.; Panda, B.B.; Roy, K.S.; Neogi, S. Greenhouse Gas Emission in Relation to Labile Soil C, N Pools and Functional Microbial Diversity as Influenced by 39 Years Long-Term Fertilizer Management in Tropical Rice. Soil Tillage Res. 2013, 129, 93–105. [Google Scholar] [CrossRef]
  56. Fang, Y.; Singh, B.P.; Collins, D.; Armstrong, R.; Van Zwieten, L.; Tavakkoli, E. Nutrient Stoichiometry and Labile Carbon Content of Organic Amendments Control Microbial Biomass and Carbon-Use Efficiency in a Poorly Structured Sodic-Subsoil. Biol. Fertil. Soils 2020, 56, 219–233. [Google Scholar] [CrossRef]
  57. Dalal, R.C.; Gibson, I.; Allen, D.E.; Menzies, N.W. Green Waste Compost Reduces Nitrous Oxide Emissions from Feedlot Manure Applied to Soil. Agric. Ecosyst. Environ. 2010, 136, 273–281. [Google Scholar] [CrossRef]
  58. Bhunia, S.; Bhowmik, A.; Mallick, R.; Mukherjee, J. Agronomic Efficiency of Animal-Derived Organic Fertilizers and Their Effects on Biology and Fertility of Soil: A Review. Agronomy 2021, 11, 823. [Google Scholar] [CrossRef]
  59. Celestina, C.; Hunt, J.R.; Sale, P.W.G.; Franks, A.E. Attribution of Crop Yield Responses to Application of Organic Amendments: A Critical Review. Soil Tillage Res. 2019, 186, 135–145. [Google Scholar] [CrossRef]
  60. Liu, C.; Liu, Y.; Lu, Y.; Liao, Y.; Nie, J.; Yuan, X.; Chen, F. Use of a Leaf Chlorophyll Content Index to Improve the Prediction of Above-Ground Biomass and Productivity. PeerJ 2019, 6, e6240. [Google Scholar] [CrossRef]
  61. Hermanns, A.S.; Zhou, X.; Xu, Q.; Tadmor, Y.; Li, L. Carotenoid Pigment Accumulation in Horticultural Plants. Hortic. Plant J. 2020, 6, 343–360. [Google Scholar] [CrossRef]
  62. Agati, G.; Tuccio, L.; Kusznierewicz, B.; Chmiel, T.; Bartoszek, A.; Kowalski, A.; Grzegorzewska, M.; Kosson, R.; Kaniszewski, S. Nondestructive Optical Sensing of Flavonols and Chlorophyll in White Head Cabbage (Brassica oleracea L. Var. Capitata Subvar. Alba) Grown under Different Nitrogen Regimens. J. Agric. Food Chem. 2016, 64, 85–94. [Google Scholar] [CrossRef]
  63. Costa, M.L.; Civello, P.M.; Chaves, A.R.; Martínez, G.A. Effect of Hot Air Treatments on Senescence and Quality Parameters of Harvested Broccoli (Brassica oleracea L. Var. Italica) Heads. J. Sci. Food Agric. 2005, 85, 1154–1160. [Google Scholar] [CrossRef]
  64. Rostami, M.; Koocheki, A.R.; Mahallati, M.N.; Kafi, M. Evaluation of Chlorophyll Meter (SPAD) Data for Prediction of Nitrogen Status in Corn (Zea mays L.). Am.-Eurasian J. Agric. Sci. 2008, 3, 79–85. [Google Scholar]
  65. Wang, Y.; Wang, D.; Shi, P.; Omasa, K. Estimating Rice Chlorophyll Content and Leaf Nitrogen Concentration with a Digital Still Color Camera under Natural Light. Plant Methods 2014, 10, 36. [Google Scholar] [CrossRef] [Green Version]
  66. Kalacska, M.; Lalonde, M.; Moore, T.R. Estimation of Foliar Chlorophyll and Nitrogen Content in an Ombrotrophic Bog from Hyperspectral Data: Scaling from Leaf to Image. Remote Sens. Environ. 2015, 169, 270–279. [Google Scholar] [CrossRef]
  67. Wang, Q.; Mao, X.; Jiang, X.; Pei, D.; Shao, X. Digital Image Processing Technology under Backpropagation Neural Network and K-Means Clustering Algorithm on Nitrogen Utilization Rate of Chinese Cabbages. PLoS ONE 2021, 16, e0248923. [Google Scholar] [CrossRef] [PubMed]
  68. Duval, M.E.; Galantini, J.A.; Iglesias, J.O.; Canelo, S.; Martinez, J.M.; Wall, L. Analysis of Organic Fractions as Indicators of Soil Quality under Natural and Cultivated Systems. Soil Tillage Res. 2013, 131, 11–19. [Google Scholar] [CrossRef]
Figure 1. Mean rainfall and temperature in an upland during the field experiment, which were measured at Suwon weather station of Korea Meteorological Administration.
Agronomy 12 01106 g001
Figure 2. Fresh weight (A), plant N concentration (B), and total chlorophyll (C) and carotenoid (D) content of Chinese cabbage cultivated in soils with different fertilizer application. Data are mean ± standard errors (n = 6) and the overall p value of one-way ANOVA. Same letters indicate no significant difference among the treatments (Tukey’s HSD post hoc, p < 0.05).
Agronomy 12 01106 g002
Figure 3. Correlation matrix among soil organic C fractions (LOIC, WBC, POXC, PMC, and MBC; highlighted in yellow), soil biogeochemical parameters (bulk density, pH, EC, CEC, soluble P, K, Mg, and Ca), plant physiological parameters (FW, N content, and total chlorophyll and carotenoid content). The areas of circles show the value of corresponding Pearson correlation coefficients with significance at the 0.05 probability level. Correlation values are indicated by circle in the upper panel; positive correlations are displayed in blue and negative correlations in red. Color intensity (light to dark) and the size of the circle (small to big) are proportional to the correlation coefficients (0 to 1 for the positive coefficient and 0 to −1 for negative coefficient) where, for example, the correlation coefficients on the principal diagonal are equal to 1 (it was represented in dark blue and biggest size of circle). The legend on the right side of the correlogram shows Pearson’s correlation coefficients with their corresponding colors.
Agronomy 12 01106 g003
Figure 4. PCA of the biogeochemical properties of soils with different fertilizer treatments. (A) Component scores (mean ± standard deviation) for first two principal components of fertilizer treatments. (B) Loading plot of soil and plant parameters.
Agronomy 12 01106 g004
Table 1. Chemical constituent of manure compost (MC) and rice husk (RH) used in this field study.
AmendmentT-CT-NC/NP2O5K2OCaMgK
(%) (%)(cmol kg−1)
MC57.4 ± 0.1453.61 ± 0.05515.98.64 ± 0.7261.93 ± 0.0574.17 ± 0.1772.76 ± 0.0993.48 ± 0.136
RH40.0 ± 0.2190.47 ± 0.04885.13.96 ± 0.8520.33 ± 0.0350.21 ± 0.0160.41 ± 0.0370.01 ± 0.002
Data are the mean ± standard errors of triple measurements. T-C, total carbon; T-N, total nitrogen; C/N, carbon-to-nitrogen ratio.
Table 2. Concentrations of soil organic carbon fractions including LOIC, WBC, POXC, PMC, and MBC in soils treated with different type of soil amendments.
TreatmentLOICWBCPOXCPMCMBC
(g kg−1)(mg kg−1)
Control53.0b18.864343.325.2c
CF65.8a20.469917.926.8c
MC71.1a22.174621.538.9abc
2MC71.4a22.978231.446.1ab
CF + MC67.9a20.471222.927.7c
CF + RH72.9a21.670628.929.8bc
MC + RH72.7a22.480727.548.8a
CF + MC + RH70.1a20.971225.331.5bc
p value<0.0010.8130.4240.097<0.001
Data are the mean of three replicates and the overall p value of one-way ANOVA. Different letters in each column indicate significant difference among the treatments (Tukey’s HSD post hoc, p < 0.05). LOIC, loss-on-ignition carbon; WBC, Walkley-Black carbon; POXC, permanganate oxidizable carbon; PMC, potentially mineralizable C; MBC, microbial biomass carbon; CF, chemical fertilizer; MC, manure compost; RH, rice husk.
Table 3. Physicochemical properties of soils treated with different type of soil amendments.
TreatmentBulk DensitypH1:5wECT-NAv. P2O5CECEx. CaEx. KEx. Mg
(dS m−1)(g kg−1)(mg kg−1)(cmolc kg−1)
Control 1.21a7.510.1071.83b83.39.189.331.063.17
CF1.19ab7.600.2201.87b96.311.89.401.553.22
MC1.14ab7.520.1502.20ab10012.810.01.643.38
2MC1.09b7.780.1832.37a23811.99.821.783.30
CF + MC1.12ab7.270.2172.10ab14712.99.421.703.18
CF + RH1.09b7.570.2402.10ab13411.29.702.473.28
MC + RH1.12ab7.760.1162.23ab16811.610.61.733.40
CF + MC + RH0.93c7.370.1832.10ab17212.19.451.713.24
p value<0.0010.2050.3320.0190.0800.3030.3870.0730.955
Data are the mean of three replicates and the overall p value of one-way ANOVA. Different letters in each column indicate significant difference among the treatments (Tukey’s HSD post hoc, p < 0.05). EC, electrical conductivity; T-N, total nitrogen; Av. P2O5, available phosphorus; CEC, cation exchangeable capacity; Ex. Ca, K, and Mg, exchangeable calcium, potassium, and magnesium; CF, chemical fertilizer; MC, manure compost; RH, rice husk.
Table 4. Concentrations of carbon dioxide (CO2) and nitrous oxide (N2O) emitted from soils treated with different type of soil amendments.
TreatmentCO2 (kg ha−1 d−1)N2O (g ha−1 d−1)
3 Days60 Days3 Days60 Days
Control 14.3c0.124d2.01c5.89b
CF17.4bc0.279cd9.37ab9.30b
MC29.7abc0.391bc9.34ab21.2ab
2MC44.3a0.636a11.6a54.6a
CF + MC34.3ab0.297cd11.3a33.3ab
CF + RH18.0bc0.211cd5.26bc23.7ab
MC + RH36.6a0.543ab9.51ab31.7ab
CF + MC + RH40.3a0.548ab8.16ab33.4ab
p value<0.001<0.001<0.0010.004
Data are the mean of three replicates and the overall p value of one-way ANOVA. Different letters in each column indicate significant difference among the treatments (Tukey’s HSD post hoc, p < 0.05). CF, chemical fertilizer; MC, manure compost; RH, rice husk.
Publisher’s Note: MDPI stays neutral with regard to jurisdictional claims in published maps and institutional affiliations.

