Abstract
Purple eggplant fruits often turn brown during maturity stages, severely influencing their market value and shelf life. However, the metabolites and genes accounting for the fruit color changes are largely unknown. Here, metabolites and gene expression analyses were used to explore the candidates underlying the differences in fruit color changes between two eggplant genotypes, ‘14-345’ and ‘CGN23829’, with contrasting fruit color changes during fruit development. We found that flavonoids are the most differentially accumulated metabolites between ‘14-345’ and ‘CGN23829’. Higher contents of D3R and D3G are important for keeping the purple color at the maturity stage. Naringenin chalcone likely accounts for the color changes from purple to brown in ‘14-345’. Notably, at the physiological maturity stage, lower expression of early biosynthetic genes (EBGs) involved in the flavonoid biosynthesis pathway is important to keep lower contents of metabolites upstream of anthocyanins, thus leading to more purple coloring. Taken together, the results indicate that delphinidins and naringenin chalcone play important roles in determining eggplant fruit color changes at maturity stages, which is helpful for further dissecting the mechanisms underlying fruit color differences and changes in eggplants.
1. Introduction
Eggplant (Solanum melongena L.) belongs to the Solanaceae family and is one of the most important fruit-bearing vegetable crops worldwide [1]. Unripe eggplant fruits are usually edible organisms and can provide abundant phytonutrients, including phenolics, vitamins, flavonoids and antioxidants [2]. Fruit color is an important external and commercial trait as well as a signal of the ripeness of eggplants. Eggplant fruits show a high diversity of color, from purplish-black and purple to green and white, with most commercial varieties being purple [3,4].
Anthocyanins are water-soluble pigments responsible for purple color formation in fruit [5,6] leaves [7] and plants with red to purple to blue colors [8]. The anthocyanins are not only important pigments influencing consumer preference and market value but also antioxidants that benefit human health [9]. Anthocyanins are a diverse class of flavonoids and are composed of an anthocyanidin backbone with sugar and acyl conjugates [10]. The structure, quantity and position of conjugated sugar and acyl moieties on anthocyanidins lead to diverse anthocyanins. There are six prevalent anthocyanidins in plants, including pelargonidin, cyanidin, delphinidin, peonidin, petunidin and malvidin [11]. While cyanidin appears as a red-purple pigment, pelargonidin can give flowers of an orange hue and fruits of a red color. Delphinidin is generally blue-reddish or purple, whereas petunidin is dark-red or purple, and peonidin appears magenta in berries, grapes or red wines [12].
Anthocyanins are synthesized through the flavonoid pathway, which is regulated by the MYB-bHLH-WD40 (MBW) complex [13,14]. Structural genes of the anthocyanin pathway can be divided into early and late biosynthetic genes. The early biosynthetic genes (EBGs) include CHS (Chalcone Synthase), CHI (Chalcone Isomerase) and F3H (Flavanone 3-Hydroxylase). Late biosynthetic genes (LBGs) mainly include F3′H (Flavonoid 3’-Hydroxylase), F3′5′H (Flavonoid 3’,5’-Hydroxylase), DFR (Dihydroflavonol-4-Reductase), ANS (Anthocyanin Synthase) and UFGT (Flavonoid Glucosyltransferase) [14,15]. Naringenin chalcone is located upstream of anthocyanins and is catalyzed by the chalcone isomerase (CHI) enzyme in the flavonoid pathway [16,17,18], which has been reported to impart a yellow color to plant organs such as the stigma [19], muskmelon fruit rinds [20], carnation flowers [21] and seed coat [22].
In cultivated eggplants, the anthocyanin is composed of delphinidins only, including delphinidin-3-[p-coumaroylrutinoside]-5-glucoside (NAS), delphinidin-3-rutinoside (D3R) and delphinidin-3-glucoside (D3G) [23]. While NAS and D3R are the two most common anthocyanins in eggplant fruit peels that impart the purple pigments [23,24,25], D3G was occasionally detected in eggplants [23]. The anthocyanin acyltransferase (AAT) has been proven in determining the anthocyanin type in eggplants [25]. The eggplants from Eastern Asia, especially northern China, that exhibited round black-purple shapes were often photosensitive and contained NAS. In contrast, many eggplants from Europe and the Mediterranean Basin were non-photosensitive to D3R [3,23,25,26], indicating different mechanisms responsible for anthocyanin biosynthesis. It was demonstrated that eggplant fruits turn to brown quickly and the levels of anthocyanins dropped by 75% from the commercial to physiological maturity stage, which severely influences the fruit quality and reduces the shelf life [24]. Therefore, it is of great importance that the metabolites and candidate genes underlying fruit color changes be determined.
Here, we selected two genotypes, ‘CGN23829’ and ‘14-345’, with obvious differences in fruit color changes during development. These two materials are ideal materials for exploring the mechanism underlying fruit color changes during fruit development, which is very important for the market value and shelf life. The fruit color, flavonoids metabolites and gene expression levels involved in the anthocyanin biosynthesis in fruit peels of ‘CGN23829’ and ‘14-345’ were investigated to explore the metabolites and genes underlying the fruit color changes in eggplant.
2. Materials and Methods
2.1. Plant Materials
The two eggplant genotypes, ‘14-345’ and ‘CGN23829’, were grown in the greenhouse of Hebei Agricultural University (HEBAU) in Baoding, China, between January 2021 and August 2021. The ‘14-345’ genotype was an inbred line originating from North China, and the ‘CGN23829’ genotype was introduced from the Centre for Genetic Resources, The Netherlands (CGN), and its origin was the Syrian Arab Republic. The fruit of ‘CGN23829’ was purple during early development stages and remained so until physiological maturity stage, in which it developed a little brown color, while the fruit color of ‘14-345’ changed from green (early development stage) to purple (commercial maturity stage) and then turned to brown (physiological maturity stage).
2.2. Fruit Peel Color Evaluation
Developing fruits were collected at 7–8 days post-anthesis (DPA) (Stage 1), 12–13 DPA (Stage 2), 17–19 DPA (Stage 3), 30 DPA (Stage 4), 45 DPA (Stage 5) and 60 DPA (Stage 6). Fruit peel color evaluation was performed using a reflectance spectrophotometer (KONICA MINOLTA, CR-400). The color index of purple eggplants was calculated by measuring the L*(lightness), a* (red-greenness) and b* (blue-yellowness) values [27,28] of the fruits using the following equation:
Color index = (180 − H)/(L* + C); H = arc tan b*/a* and C = () [29], where H is the hue angle and C is the chroma.
The evaluation was performed with three biological replications, each with three plants per genotype.
2.3. Quantifications of Flavonoids
Three replicates of fruit peel samples were harvested from each genotype at the commercial (Stage 3) and physiological (Stage 6) stages. Fruit peel samples were freeze-dried, and 100 mg of lyophilized powder was dissolved in 1.2 mL of 70% methanol, vortexed for 30 s every 30 min 6 times and incubated at 4 °C overnight. After centrifugation at 12,000 rpm for 10 min, the extracts were filtered using a 0.22 μm-filter membrane and analyzed using a UPLC-ESI-MS/MS system (UPLC, SHIMADZU Nexera X2; MS, Applied Biosystems 4500 Q TRAP, Foster City, CA, USA).
Metabolites whose abundance differed significantly between groups were determined using a threshold of variable importance in projection (VIP) ≥ 1 and absolute log2FC (fold change) ≥ 1. VIP values were extracted from the results of orthogonal partial least square–discriminate analysis (OPLS-DA), which also contained score plots and permutation plots and were generated using the R package Metabo Analyst R. The data were log2-transformed and mean-centered before OPLS-DA. A permutation test (200 permutations) was performed to avoid overfitting.
For anthocyanin content analysis, anthocyanins were extracted from 100 mg of freeze-dried samples, and the total contents were measured using the pH differential spectrophotometric method. The anthocyanin content was calculated according to total anthocyanins = A × MW × 5 × 100 × V/e (mg/100 g), V stands for final volume (ml), and A = (A510 nm (pH 1.0) − A700 nm (pH 1.0)) − (A510 nm (pH 4.5) − A700 nm (pH 4.5)). Three independent biological replicates and technological replicates were performed.
2.4. Quantitative Real Time-PCR
Total RNA was extracted using the ReliaPrep RNA Miniprep system (Promega, Madison, WI, USA, Z6112). Next, cDNA was synthesized using the PrimeScript™ RT reagent Kit with gDNA Eraser (Takara, Shiga, Japan) and amplified using AceQ Universal SYBR qPCR Master Mix (Vazyme, Biotech, Nanjing, China). The qRT-PCR was preformed using a LightCycler 96 system (Roche). Data were collected from three biological replicates, and GAPDH was used as the reference gene. Relative gene expression levels were determined using the 2−ΔΔCT method [30]. The primers used in this experiment are shown in Table 1.

Table 1.
The sequences of the primers used for qRT-PCR in this study.
2.5. Statistical Analysis
Differences between groups were tested using Student’s t-test in GraphPad Prism 8.0 software (GraphPad Software, San Diego, CA, USA), and data are presented as the mean ± standard deviation (SD). Asterisks denote significant differences (* p< 0.1, ** p < 0.05 and *** p < 0.01).
3. Results
3.1. Comparison of Fruit Color between ‘14-345’ and ‘CGN23829’ Using Reflectance Spectrophotometer
To characterize the fruit color difference between ‘14-345’ and ‘CGN23829’, fruits were sampled at six developmental stages, from 7 to 60 DPA (days post-anthesis) (Figure 1A). The fruit color index of ‘14-345’ increased sharply from Stage 1 to Stage 3 and then decreased from Stage 3 to Stage 6. In ‘CGN23829’, the color index increased from Stage 1 to Stage 2 and was maximized from Stage 2 to 4, and then declined gradually along fruit development (Figure 1B). Notably, the color indexes of ‘CGN23829’ were significantly higher than those of ‘14-345’ at all developmental stages except for Stage 3. The results are consistent with the visual differences in the fruit color between the two genotypes, i.e., the purple of ‘CGN23829’ fruits was stronger and lasted longer than that of ‘14-345’ (Figure 1A).
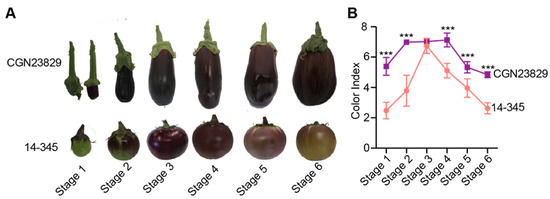
Figure 1.
Fruit peel color evaluations of ‘CGN23829’ and ‘14-345’. (A) Fruit phenotypes of the two eggplant genotypes at the six developmental stages; (B) the color index of purple eggplants during development. Asterisks denote significant differences (*** p < 0.001) as determined by Student’s t-tests.
3.2. Analyses of Phenylpropanoid Metabolite Profiling
To gain further insights into the fruit color differences between the two genotypes, we analyzed phenylpropanoid metabolites in fruit peels of the two genotypes at Stage 3 and Stage 6 using UPLC-ESI-MS/MS. A total of 425 metabolites were detected, including 242 flavonoids, 154 phenolic acids, 13 coumarins, 10 lignans and 6 stilbenes (Figure 2A and Table S1). Flavonoids were the most abundant metabolites, accounting for 56.9% of the total metabolites (Figure 2A and Table S1). In the fruit peels of ‘CGN23829’ at Stage 3 and Stage 6, the contents of 297 metabolites, including 196 flavonoids (~66.0%), were significantly downregulated, and the contents of 129 metabolites, including 68 flavonoids (~52.7%), were significantly upregulated compared with ‘14-345’ (Figure 2B). Notably, most differentially accumulated metabolites were found at Stage 6 (279 metabolites) than Stage 3 (147 metabolites) (Figure 2B), suggesting more changes in metabolism at physiological stages of eggplant fruits. Considering flavonoids were the most abundant metabolites that differentially accumulated in fruit peels between the two genotypes and the fact that anthocyanins are synthesized in the flavonoid biosynthesis pathway, which imparts the purple color of the eggplant fruit, the main metabolites in the flavonoid biosynthesis pathway were further analyzed.
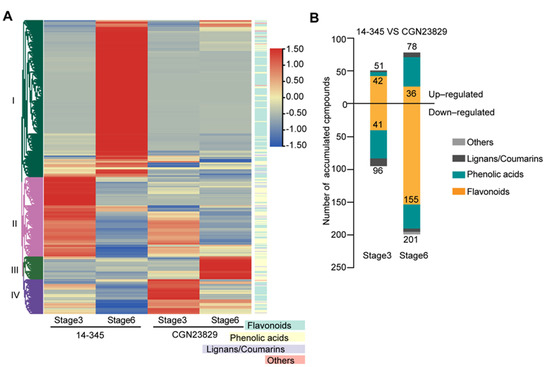
Figure 2.
Overview of phenylpropanoid metabolite profiling in the fruit peel of ‘14-345’ and ‘CGN23829’. (A) Hierarchical cluster analysis of all the compounds detected in this study; (B) differentially accumulated metabolites at the two stages.
The anthocyanin content in ‘CGN23829’ was significantly higher than that in ‘14-345’ at Stage 3 (Figure 3A), which is consistent with the observation of fruit peel color in the two genotypes (Figure 1A). Unexpectedly, the anthocyanin content was significantly lower in ‘CGN23829’ than in ‘14-345’ at Stage 6 (Figure 3A), although the fruits of ‘CGN23829’ looked more purple than ‘14-345’ at Stage 6 (Figure 1A). The D3R content was significantly higher in ‘CGN23829’ than in ‘14-345’ at both Stage 3 and Stage 6. While the D3G was much more abundant in ‘14-345’ than in ‘CGN23829’ at Stage 3, it was lower in ‘14-345’ than in ‘CGN23829’ at Stage 6. NAS was significantly higher in ‘14-345’ than that in ‘CGN23829’ at both Stage 3 and Stage 6. Moreover, we found that the levels of D3R and D3G dropped markedly from Stage 3 to Stage 6, but there was no difference in NAS between Stage 3 and Stage 6 in either genotype. Given the contents of D3R and D3G were significantly lower in ‘14-345’ at Stage 6 and the contents of NAS and total anthocyanin were significantly higher in ‘14-345’ than ‘CGN23829’, we propose that NAS was the primary component of anthocyanin in ‘14-345’ at Stage 6.
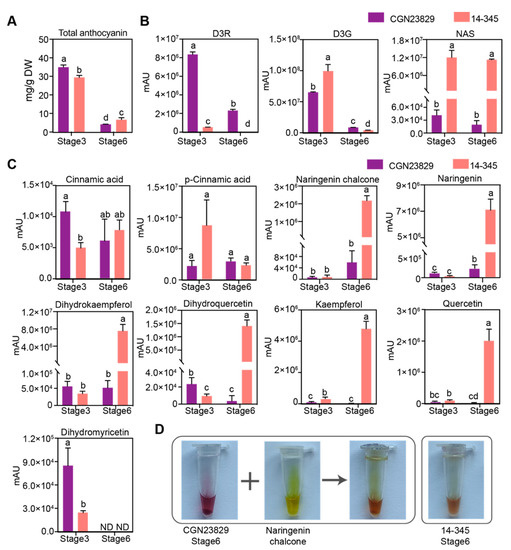
Figure 3.
Flavonoid metabolite contents in the fruit peels at the commercial (Stage 3) and physiological (Stage 6) stages of ‘CGN23829’ and ‘14-345’. (A) Total anthocyanin content; (B,C) relative abundance of cinnamic acid, p-cinnamic acid, naringenin chalcone, naringenin, dihydrokaempferol, dihydroquercetin, kaempferol, quercetin, dihydromyricetin, D3G (delphinidin-3-glucoside), D3R (delphinidin-3-rutinoside), D3R5G (delphinidin-3-(p-coumaroyl) rutinoside-5-glucoside)/nasunin (NAS); and (D) Comparison of anthocyanin extracts from fruit peel of ‘CGN23829’ and ‘14-345’ at Stage 6. Different lower letters indicate significant differences according to Student’ s t-test (p < 0.01).
To further investigate the reasons accounting for the differences in fruit color at Stage 6 between the two genotypes, we next examined the contents of upstream metabolites of anthocyanins in the flavonoid pathway, including cinnamic acid, p-cinnamic acid, naringenin chalcone, naringenin, dihydrokaempferol, dihydroquercetin, kaempferol and quercetin. The contents of cinnamic acid and p-cinnamic acid did not show a significant difference between ‘14-345’ and ‘CGN23829’, except for the cinnamic acid content at Stage 3, in which a significantly higher cinnamic acid content was observed in ‘CGN23829’ than ‘14-345’. Moreover, naringenin chalcone, naringenin, dihydrokaempferol, dihydroquercetin, kaempferol and quercetin exhibited significantly more abundance in ‘14-345’ than ‘CGN23829’ at Stage 6 (Figure 3C).
Anthocyanin extracts were obtained from fruit peels of ‘CGN23829’ and ‘14-345’ at Stage 6, which exhibited a purple and brown color, respectively, and corresponded with the fruit color observed by eye. The color of the anthocyanin extracts from ‘CGN23829’ turn browner after being mixed with 20 mg/mL naringenin chalcone solution, which was similar to that of the ‘14-345’ anthocyanin extracts (Figure 3D).
3.3. Expression Analyses of Genes Involved in Flavonoid Pathway
To further explore the candidate genes underlying the fruit color changes between the two genotypes, the expressions of the genes involved in the flavonoid biosynthetic pathway were detected using quantitative real-time PCR (qRT-PCR), including the cinnamate-4-hydroxylase gene (SmC4H), 4-coumarate CoA ligase gene (Sm4CL) and flavonol synthase gene (SmFLS) as well as EBGs, LBGs and regulatory genes involved in anthocyanin biosynthesis.
SmC4H and Sm4CL are located in the core part of the phenylpropanoid pathway. While SmC4H and Sm4CL showed comparable expression in ‘14-345’ and ‘CGN23829’ at Stage 3, their expression levels were significantly higher in ‘14-345’ than in ‘CGN23829’ at Stage 6 (Figure 4). The expression level of EBGs did not show a significant difference between the two genotypes at Stage 3; however, SmF3H was upregulated in ‘14-345’. However, the EBGs, including SmCHS, SmCHI, SmF3H and SmF3′H, were observed to be more highly expressed in ‘14-345’ than in ‘CGN23829’ at Stage 6 (Figure 4). The LBGs, except SmANS, were upregulated in ‘14-345’ compared with ‘CGN23829’ at Stage 3 and barely expressed at Stage 6. It is worth noting that SmF3′5′H showed no expression at Stage 6 in either genotype. Furthermore, no dihydromyricetin was detected in either genotype at Stage 6 (Figure 3 and Figure 4). In addition, the expression level of regulatory genes, including SmMYB1, SmTT8 and SmTTG1, also showed no significant difference between the two genotypes. Of note, while SmTTG1 showed high expression, SmMYB1, SmTT8 and LBGs were barely expressed at Stage 6 in either genotype.
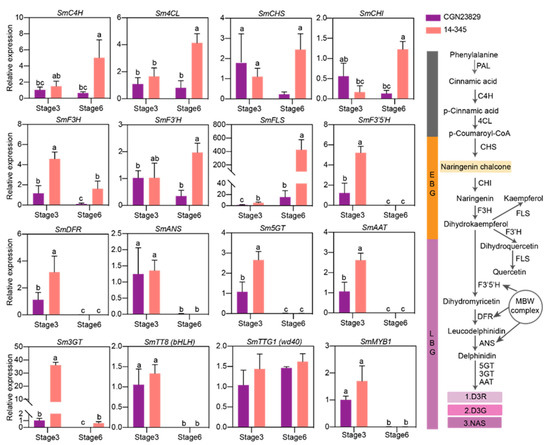
Figure 4.
Analysis of expression of selected genes involved in flavonoid biosynthesis pathway. The arrows indicate the flow direction of the pathway. MBW complex in the cycle indicates MYB-bHLH-WD40 complex. Different lower letters indicate significant differences according to Student’ s t-test (p < 0.01).
In summary, 12 out of 16 genes showed significant increased expression levels in ‘14-345’ compared to those of ‘CGN23829’ at Stage 3 and/or Stage 6. The higher expression levels of genes involved in flavonoid biosynthesis, especially EBGs, likely maintained the higher contents of flavonoids, including naringenin chalcone, naringenin, dihydrokaempferol, dihydroquercetin, kaempferol and quercetin in ‘14-345’ at Stage 6 compared with ‘CGN23829’ (Figure 3).
4. Discussion
Fruit color is an important external and commercial trait influencing market value and consumer preference. Most purple or red fruits are enriched in anthocyanins, such as grapes, strawberries, apples and eggplants [31]. The varieties of eggplant with a dark purple peel contain a high anthocyanin concentration and are more attractive to consumers than the varieties with green or white fruit peels [32]. However, the purple color of eggplant fruit peel gradually turns brown after the commercial stage, which has negative effects on the market value and shelf life. Therefore, the investigation of genes and metabolites responsible for fruit color changes is of great significance.
Anthocyanin components, which accumulate in plants, are species-specific and impart special purple or red color to the plant organism during development. Only one or several anthocyanin components can be detected in one species. For example, four cyanidin derivatives (CyXylGlu, CyGluRutin, CyRutin and CyXylRutin) were identified in the fruit of S. chinensis, and CyRutin was indicated as the primary anthocyanin determining the fruit color variation [33]. Four anthocyanin components (C3R, C3G, C35D, M3G) were significantly correlated with the purple wheat development, and C3R was indicated as the pivotal pigment for the purple grain [34]. In the present study, we analyzed the phenylpropanoid metabolite profiling of two genotypes exhibiting different fruit colors at maturity stages to explore the key metabolites responsible for the coloration of eggplant fruit peel. While the fruits of ‘CGN23829’ looked more purple than ‘14-345’ at Stage 6, the anthocyanin content was significantly lower in ‘CGN23829’ than in ‘14-345’. This result suggests that higher anthocyanin content is not always associated with the purple color of the fruit peel of eggplant, especially at the physiological maturity stages. Considering the anthocyanin was only composed by delphinidin derivatives in eggplant fruits [14] and the fact that different delphinidin derivatives could impart different visual colors to eggplant fruit peels, e.g., NAS was more purple and D3R was lilac [25], the contents of D3R, D3G and NAS were further analyzed. Interestingly, the higher contents of D3R and D3G in ‘CGN23829’ at Stage 6 were likely responsible for this genotype being more purple than ‘14-345’. These results indicate that the contents of D3G, D3R and NAS play important roles in the color changes during fruit ripening in eggplant. Notably, little expression of SmF3′5′H and dihydromyricetin contents at Stage 6 in both genotypes suggests that the anthocyanin biosynthesis process was stopped at Stage 6 from the step of dihydrokaempferol to dihydromyricetin catalyzation by F3′5′H, and the anthocyanins detected at Stage 6 were the residual pigments biosynthesized at the earlier stages during fruit development.
Different pigments could jointly impart the fruit color. For example, carotenoid and chlorophyll pools in hesperidia impart a unique fruit color to Citrus fruit peels [35]. Downregulated anthocyanins and upregulated carotenoids during fruit ripening determine the change in fruit color in Rubus chingii Hu [36]. A comparison of the secondary metabolites between yellowed and normal rice suggested that homoeriodictyol, naringenin chalcone and 4,2′,4′,6′-tetrahydroxychalcone contributed to the yellow color in the yellowed rice [37]. While many studies have shown that naringenin chalcone could exhibit a yellow color in the stigma [19], fruit rinds [20] and flowers [21], little is known about the roles of naringenin chalcone in regulating fruit color changes in eggplant.
A previous study indicated that the contents of naringenin chalcone increased at the physiological stage compared with the commercial stage in eggplant [24]. Similar results were also observed in the present study. In the present study, naringenin chalcone content in ‘14-345’ is much higher than that of ‘CGN23829’, and the color of anthocyanin extracts in ‘CGN23829’ at Stage 6 became browner after being mixed with naringenin chalcone solution (Figure 3D). The results suggest that delphinidins, together with naringenin chalcone, can influence the fruit color of eggplants, and the higher content of naringenin chalcone in ‘14-345’ likely explains the browner fruit color compared to ‘CGN23829’at Stage 6 (Figure 5). However, since naringenin, kaempferol and quercetin have also been shown to impart colors in plants [38,39,40], we cannot exclude their roles in fruit color changes, and future studies are needed to clarify this.
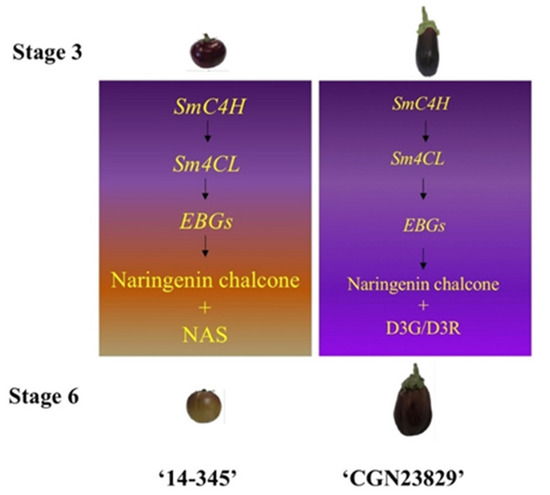
Figure 5.
Proposed model underlying the fruit color changes in ‘14-345’ and ‘CGN23829’. The font size of ‘SmC4H’, ‘Sm4CL’ and ‘EBGs’ corresponds to the expression levels. The font size of ‘Naringenin chalcone’, ‘NAS’ and ‘D3G/D3R’ indicates the contents.
Flavonoid biosynthesis is mainly regulated by two types of genes; one is the structural gene, including EBG and LBG, and the other is the transcription factor, including MYB, bHLH and WD40 [14,15]. CHS, CHI, F3H and F3’H are the EBGs that are directly regulated by MYBs [5,41]. F3′5′H, DFR, ANS, AAT, 5GT and 3GT are the LBGs that control the downstream accumulation of anthocyanins and are regulated by the complex of MYB-bHLH-WD40 [12,42]. Moreover, some other transcription factors that regulate the flavonoid biosynthesis in plants were recently identified. For example, three AP2/ERF family members were identified as positive regulators of CitCHIL1 expression that modulate flavonoid synthesis in citrus [43]. LcNAC13 was identified to physically interact with LcR1MYB1 and negatively regulate the expression of LcCHS1/2, LcCHI, LcF3H, LcF3′H and LcDFR, influencing anthocyanin biosynthesis during litchi fruit ripening [44]. MdWRKY11 could promote the expression of anthocyanin biosynthesis genes and increase the accumulation of flavonoids and anthocyanin in apple calli [45]. SmWRKY44 was also identified to be involved in regulating the expression of SmCHS, SmF3H and SmANS in eggplants [46]. In the present study, most of the structural genes showed significant higher expression in ‘14-345’ than ‘CGN23829’, indicating that lower expression of EBGs was important to keep lower contents of metabolites upstream of anthocyanins, and thus more purple was observed at fruit maturity stages (Figure 5). However, the expression of SmMYB1, SmTT8 and SmTTG1 are comparable between ‘14-345’ and ‘CGN23829’, indicating there are other transcription factors regulating the expression of the structural genes and anthocyanin accumulation. Therefore, RNA-seq will be used to identify novel transcription factors in flavonoid biosynthesis pathway, which would help us to uncover the mechanisms underlying fruit color differences between the two genotypes.
5. Conclusions
Our study uncovers the metabolites and genes underlying fruit color changes during maturity stages of eggplant fruits. Flavonoids are the most differentially accumulated metabolites in ‘14-345’ and ‘CGN23829’. Importantly, D3R and D3G are the primary anthocyanins maintaining the purple color at the fruit maturity stage. NAS, together with naringenin chalcone, contributes to the fruit peel color of ‘14-345’ at Stage 6. Gene expression analysis indicated that higher expressions of SmC4H, Sm4CL and most of the EBGs likely lead to higher contents of flavonoids in the flavonoid biosynthesis pathway in ‘14-345’. This study not only revealed the roles of delphinidins and naringenin chalcone in fruit color changes, but also identified candidate genes involved in the process, providing insights into the breeding of eggplant with purple fruit peel at maturity stages.
Supplementary Materials
The following supporting information can be downloaded at: https://www.mdpi.com/article/10.3390/agronomy12051036/s1. Table S1: The relative content of phenylpropanoid metabolites detected in eggplant fruit peel of ‘14-345’ and ‘CGN23829’.
Author Contributions
Conceptualization, X.W., S.L. and X.C.; Data curation, X.W. and X.C; Formal analysis, X.W. and Q.L.; Funding acquisition, S.L., L.S., X.C. and S.S.; Investigation, P.Y. and S.X.; Methodology, X.W., L.S., W.Z. and S.X.; Project administration, X.C. and S.S.; Resources, S.L., Y.W., J.Z. and X.C.; Supervision, X.C. and S.S.; Validation, X.W., S.L. and X.C.; Visualization, X.W.; Writing—original draft, X.W.; Writing—review and editing, S.L., Q.L. and X.C. All authors have read and agreed to the published version of the manuscript.
Funding
This study was supported by Hebei Fruit Vegetables Seed Industry Science and Technology Innovation Team Project; the Key R & D Project of Hebei Province (Grant No. 21326309D); the State Key Laboratory of North China Crop Improvement and Regulation (NCCIR2020RC-11); Research on Key Technology of Vegetable Molecular Breeding; the Key R & D Project of Hebei Province (Grant No. 20326344D); and the vegetable innovation team project of Hebei modern agricultural industrial technology system (Grant No. HBCT2018030203).
Data Availability Statement
The data generated from the study are clearly presented and discussed in the manuscript.
Conflicts of Interest
The authors declare no conflict of interest.
References
- Chapman, M.A. The Eggplant Genome; Spirnger Nature: Cham, Switzerland, 2019. [Google Scholar]
- Gürbüz, N.; Uluişik, S.; Frary, A.; Frary, A.; Doganlar, S. Health benefits and bioactive compounds of eggplant. Food Chem. 2018, 268, 602–610. [Google Scholar] [CrossRef] [PubMed]
- Martínez-Ispizua, E.; Calatayud, Á.; Marsal, J.I.; Mateos-Fernández, R.; Díez, M.J.; Soler, S.; Valcárcel, J.V.; Martínez-Cuenca, M.R. Phenotyping local eggplant varieties: Commitment to biodiversity and nutritional quality preservation. Front. Plant Sci. 2021, 12, 696272. [Google Scholar] [CrossRef] [PubMed]
- Taher, D.; Solberg, S.; Prohens, J.; Chou, Y.; Rakha, M.; Wu, T. World Vegetable Center Eggplant Collection: Origin, Composition, Seed Dissemination and Utilization in Breeding. Front. Plant Sci. 2017, 8, 1484. [Google Scholar] [CrossRef] [PubMed]
- Shi, M.; Ali, M.M.; He, Y.; Ma, S.; Rizwan, H.M.; Yang, Q.; Li, B.; Lin, Z.; Chen, F. Flavonoids accumulation in fruit peel and expression profiling of related genes in purple (Passiflora edulis f. edulis) and yellow (Passiflora edulis f. flavicarpa) Passion Fruits. Plants 2021, 10, 2240. [Google Scholar] [CrossRef]
- Sun, C.; Deng, L.; Du, M.; Zhao, J.; Chen, Q.; Huang, T.; Jiang, H.; Li, C.B.; Li, C. A transcriptional network promotes anthocyanin biosynthesis in tomato flesh. Mol. Plant 2020, 13, 42–58. [Google Scholar] [CrossRef]
- Jin, S.W.; Rahim, M.A.; Kim, H.T.; Park, J.I.; Kang, J.G.; Nou, I.S. Molecular analysis of anthocyanin-related genes in ornamental cabbage. Genome 2018, 61, 111–120. [Google Scholar] [CrossRef] [Green Version]
- Khoo, H.E.; Azlan, A.; Tang, S.T.; Lim, S.M. Anthocyanidins and anthocyanins: Colored pigments as food, pharmaceutical ingredients, and the potential health benefits. Food Nutr. Res. 2017, 61, 1361799. [Google Scholar] [CrossRef] [Green Version]
- Li, J.; Yang, Y.; Chai, M.; Ren, M.; Yuan, J.; Yang, W.; Dong, Y.; Liu, B.W.; Jian, Q.; Wang, S.; et al. Gibberellins modulate local auxin biosynthesis and polar auxin transport by negatively affecting flavonoid biosynthesis in the root tips of rice. Plant Sci. 2000, 298, 110545. [Google Scholar] [CrossRef]
- Stommel, J.R.; Lightbourn, G.J.; Winkel, B.S.; Griesbach, R. Transcription factor families regulate the Anthocyanin biosynthetic pathway in Capsicum annuum. J. Am. Soc. Hortic. Sci. 2009, 134, 244–251. [Google Scholar] [CrossRef] [Green Version]
- Zhao, C.L.; Chen, Z.J.; Bai, X.S.; Ding, C.; Long, T.J.; Wei, F.G.; Miao, K.R. Structure-activity relationships of anthocyanidin glycosylation. Mol. Divers. 2014, 18, 687–700. [Google Scholar] [CrossRef]
- Enaru, B.; Drețcanu, G.; Pop, T.D.; Stǎnilǎ, A.; Diaconeasa, Z. Anthocyanins: Factors affecting their stability and degradation. Antioxidants 2021, 10, 1967. [Google Scholar] [CrossRef] [PubMed]
- Lloyd, A.; Brockman, A.; Aguirre, L.; Campbell, A.; Bean, A.; Cantero, A.; Gonzalez, A. Advances in the MYB–bHLH–WD repeat (MBW) pgment regulatory model: Addition of a WRKY factor and co-option of an anthocyanin MYB for betalain regulation. Plant Cell Physiol. 2017, 58, 1431–1441. [Google Scholar] [CrossRef] [Green Version]
- Liu, Y.; Tikunov, Y.; Schouten, R.E.; Marcelis, L.F.M.; Visser, R.G.F.; Bovy, A. Anthocyanin biosynthesis and degradation mechanisms in Solanaceous vegetables: A Review. Front. Chem. 2018, 6, 52. [Google Scholar] [CrossRef]
- Song, X.; Liu, H.; Shen, S.; Huang, Z.; Yu, T.; Liu, Z.; Yang, Q.; Wu, T.; Feng, S.; Zhang, Y.; et al. Chromosome-level pepino genome provides insights into genome evolution and anthocyanin biosynthesis in Solanaceae. Plant J. 2022, 15728. [Google Scholar] [CrossRef] [PubMed]
- Thomas, V. Phenylpropanoid biosynthesis. Mol. Plant 2010, 3, 2–20. [Google Scholar]
- Zhang, X.B.; Liu, C.J. Multifaceted regulations of gateway enzyme phenylalanine ammonia-lyase in the biosynthesis of phenylpropanoids. Mol. Plant 2014, 8, 17–27. [Google Scholar] [CrossRef] [PubMed] [Green Version]
- Barros, J.; Dixon, R.A. Plant phenylalanine/tyrosine ammonia-lyases. Trends Plant Sci. 2020, 25, 66–79. [Google Scholar] [CrossRef] [PubMed]
- Zhang, Y.; Zhao, G.; Li, Y.; Zhang, J.; Shi, M.; Muhammad, T.; Liang, Y. Transcriptome profiling of tomato uncovers an involvement of cytochrome P450s and peroxidases in stigma color formation. Front. Plant Sci. 2017, 8, 897. [Google Scholar] [CrossRef] [Green Version]
- Feder, A.; Burger, J.; Gao, S.; Lewinsohn, E.; Katzir, N.; Schaffer, A.A.; Meir, A.; Davidovich-Rikanati, R.; Portnoy, V.; Gal-On, A.; et al. A kelch domain-containing F-Box coding gene negatively regulates flavonoid accumulation in muskmelon. Plant Physiol. 2015, 169, 1714–1726. [Google Scholar]
- Itoh, Y.; Higeta, D.; Suzuki, A.; Yoshida, H.; Ozeki, Y. Excision of transposable elements from the chalcone isomerase and dihydroflavonol 4-reductase genes may contribute to the variegation of the yellow-flowered carnation (Dianthus caryophyllus). Plant Cell Physiol. 2002, 43, 578–585. [Google Scholar] [CrossRef] [Green Version]
- Kim, H.B.; Bae, J.H.; Lim, J.D.; Yu, C.Y.; An, C.S. Expression of a functional type-I chalcone isomerase gene is localized to the infected cells of root nodules of Elaeagnus umbellata. Mol. Cells 2007, 23, 405–409. [Google Scholar] [PubMed]
- Azuma, K.; Ohyama, A.; Ippoushi, K.; Ichiyanagi, T.; Takeuchi, A.; Saito, T.; Fukuoka, H. Structures and antioxidant activity of anthocyanins in many accessions of eggplant and its related species. J. Agric. Food Chem. 2008, 56, 10154–10159. [Google Scholar] [CrossRef] [PubMed]
- Scalzo, R.L.; Florio, F.E.; Fibiani, M.; Speranza, G.; Rabuffetti, M.; Gattolin, S.; Toppino, L.; Rotino, G.L. Scrapped but not neglected: Insights into the composition, molecular modulation and antioxidant capacity of phenols in peel of eggplant (Solanum melongena L.) fruits at different developmental stages. Plant Physiol. Biochem. 2021, 167, 678–690. [Google Scholar] [CrossRef] [PubMed]
- Florio, F.E.; Gattolin, S.; Toppino, L.; Bassolino, L.; Fibiani, M.; Scalzo, R.L.; Rotino, G.L. A SmelAAT acyltransferase variant causes a major difference in eggplant (Solanum melongena L.) peel anthocyanin composition. Int. J. Mol. Sci. 2021, 22, 9174. [Google Scholar] [CrossRef]
- Cericola, F.; Portis, E.; Toppino, L.; Barchi, L.; Acciarri, N.; Ciriaci, T.; Sala, T.; Rotino, G.L.; Lanteri, S. The population structure and diversity of eggplant from Asia and the Mediterranean Basin. PLoS ONE 2013, 8, e73702. [Google Scholar] [CrossRef] [Green Version]
- Oğuza, İ.; Oğuza, H.; Kafkas, E. Evaluation of fruit characteristics of various organically-grown goji berry (Lycium barbarum L., Lycium chinense Miller) species during ripening stages. J. Food Compos. Anal. 2021, 101, 103846. [Google Scholar] [CrossRef]
- Bakker, J.; Bridle, P.; Timberlake, C.F. Tristimulus measurements (CIELAB 76) of port wine colour. Vitis 1986, 25, 67–78. [Google Scholar]
- Carreno, J.; Martinez, A.; Almela, L.; Fernandez-Lopez, J.A. Proposal of an index for the objective evaluation of the color red table grapes. Food Res. Int. 1995, 28, 373–377. [Google Scholar] [CrossRef]
- Schmittgen, T.D.; Livak, K.J. Analyzing real-time PCR data by the comparative C(T) method. Nat. Protoc. 2008, 3, 1101–1108. [Google Scholar] [CrossRef]
- Paauw, M.; Koes, R.; Quattrocchio, F.M. Alteration of flavonoid pigmentation patterns during domestication of food crops. J. Exp. Bot. 2019, 70, 3719–3735. [Google Scholar] [CrossRef]
- Li, J.; He, Y.J.; Zhou, L.; Liu, Y.; Jiang, M.; Ren, L.; Chen, H. Transcriptome profiling of genes related to light-induced anthocyanin biosynthesis in eggplant (Solanum melongena L.) before purple color becomes evident. BMC Genom. 2018, 19, 201. [Google Scholar] [CrossRef] [PubMed] [Green Version]
- Liao, J.; Zang, J.; Yuan, F.; Liu, S.; Zhang, Y.; Li, H.; Piao, Z.; Li, H. Identification and analysis of anthocyanin components in fruit color variation in Schisandra chinensis. J. Sci. Food Agric. 2016, 96, 3213–3219. [Google Scholar] [CrossRef] [PubMed]
- Wang, F.; Ji, G.; Xu, Z.; Feng, B.; Zhou, Q.; Fan, X.; Wang, T. Metabolomics and transcriptomics provide insights into anthocyanin biosynthesis in the developing grains of purple wheat (Triticum aestivum L.). J. Agric. Food Chem. 2021, 69, 11171–11184. [Google Scholar] [CrossRef]
- Zhu, K.; Zheng, X.; Ye, J.; Huang, Y.; Chen, H.; Mei, X.; Xie, Z.; Cao, L.; Zeng, Y.; Larkin, R.M.; et al. Regulation of carotenoid and chlorophyll pools in hesperidia, anatomically unique fruits found only in Citrus. Plant Physiol. 2021, 187, 829–845. [Google Scholar] [CrossRef] [PubMed]
- Li, X.; Wang, Y.; Jin, L.; Chen, Z.; Jiang, J.; Jackson, A. Development of fruit color in Rubus chingii Hu (Chinese raspberry): A story about novel offshoots of anthocyanin and carotenoid biosynthesis. Plant Sci. 2021, 311, 110996. [Google Scholar] [CrossRef] [PubMed]
- Liu, Y.; Liu, J.; Wang, R.; Sun, H.; Li, M.; Strappe, P.; Zhou, Z. Analysis of secondary metabolites induced by yellowing process for understanding rice yellowing mechanism. Food Chem. 2021, 342, 128204. [Google Scholar] [CrossRef]
- Nouwen, N.; Gargani, D.; Giraud, E. The modification of the flavonoid naringenin by Bradyrhizobium sp. strain ORS285 changes the nod genes inducer function to a growth stimulator. Mol. Plant Microbe Interact. 2019, 32, 1517–1525. [Google Scholar] [CrossRef]
- Chen, W.; Xiao, Z.; Wang, Y.; Wang, J.; Zhai, R.; Lin-Wang, K.; Espley, R.; Ma, F.; Li, P. Competition between anthocyanin and kaempferol glycosides biosynthesis affects pollen tube growth and seed set of Malus. Hortic. Res. 2021, 8, 173. [Google Scholar] [CrossRef]
- Khalifa, I.; Du, J.; Nawaz, A.; Li, C. Multiple co-pigments of quercetin and chlorogenic acid blends intensify the color of mulberry anthocyanins: Insights from hyperchromicity, kinetics, and molecular modeling investigations. J. Sci. Food Agric. 2021, 101, 1579–1588. [Google Scholar] [CrossRef]
- Pelletier, M.K.; Burbulis, I.E.; Winkel-Shirley, B. Disruption of specific flavonoid genes enhances the accumulation of flavonoid enzymes and end-products in Arabidopsis seedlings. Plant Mol. Biol. 1999, 40, 45–54. [Google Scholar] [CrossRef]
- Zhou, H.; Lin-Wang, K.; Wang, F.; Espley, R.V.; Ren, F.; Zhao, J.; Ogutu, C.; He, H.; Jiang, Q.; Allan, A.C. Activator-type R2R3-MYB genes induce a repressor-type R2R3-MYB gene to balance anthocyanin and proanthocyanidin accumulation. New Phytol. 2019, 221, 1919–1934. [Google Scholar] [CrossRef] [PubMed] [Green Version]
- Zhao, C.; Liu, X.; Gong, Q.; Cao, J.; Shen, W.; Yin, X.; Grierson, D.; Zhang, B.; Xu, C.; Li, X.; et al. Three AP2/ERF family members modulate flavonoid synthesis by regulating type IV chalcone isomerase in citrus. Plant Biotechnol. J. 2021, 19, 671–688. [Google Scholar] [CrossRef]
- Jiang, G.; Li, Z.; Song, Y.; Zhu, H.; Lin, S.; Huang, R.; Jiang, Y.; Duan, X. LcNAC13 Physically Interacts with LcR1MYB1 to coregulate anthocyanin biosynthesis-related genes during litchi fruit ripening. Biomolecules 2019, 9, 135. [Google Scholar] [CrossRef] [PubMed] [Green Version]
- Wang, N.; Liu, W.; Zhang, T.; Jiang, S.; Xu, H.; Wang, Y.; Zhang, Z.; Wang, C.; Chen, X. Transcriptomic analysis of red-fleshed apples reveals the novel role of MdWRKY11 in flavonoid and anthocyanin biosynthesis. J. Agric. Food Chem. 2018, 66, 7076–7086. [Google Scholar] [CrossRef] [PubMed]
- He, Y.; Wang, Z.; Ge, H.; Liu, Y.; Chen, H. Weighted gene co-expression network analysis identifies genes related to anthocyanin biosynthesis and functional verification of hub gene SmWRKY44. Plant Sci. 2021, 309, 110935. [Google Scholar] [CrossRef] [PubMed]
Publisher’s Note: MDPI stays neutral with regard to jurisdictional claims in published maps and institutional affiliations. |
© 2022 by the authors. Licensee MDPI, Basel, Switzerland. This article is an open access article distributed under the terms and conditions of the Creative Commons Attribution (CC BY) license (https://creativecommons.org/licenses/by/4.0/).