
Yield and Quality of Romaine Lettuce at Different Daily Light Integral in an Indoor Controlled Environment

 , ,
, ,  , and
, and
Abstract
:1. Introduction
2. Materials and Methods
2.1. Plant Material and Growing Conditions
2.2. Experimental Design
2.3. Light Treatments
2.4. Data Collection and Analysis
2.5. Chlorophyll a Fluorescence of Light-Adapted Plants
2.6. Statistical Analysis of Growth Traits
2.7. Sensory Analysis
2.7.1. Sensory Quality Attributes
2.7.2. Statistical Analysis of Sensory Quality Descriptors
2.8. Discrimination Based on Image Textures
2.8.1. Image Processing
2.8.2. Discriminant Analysis
3. Results
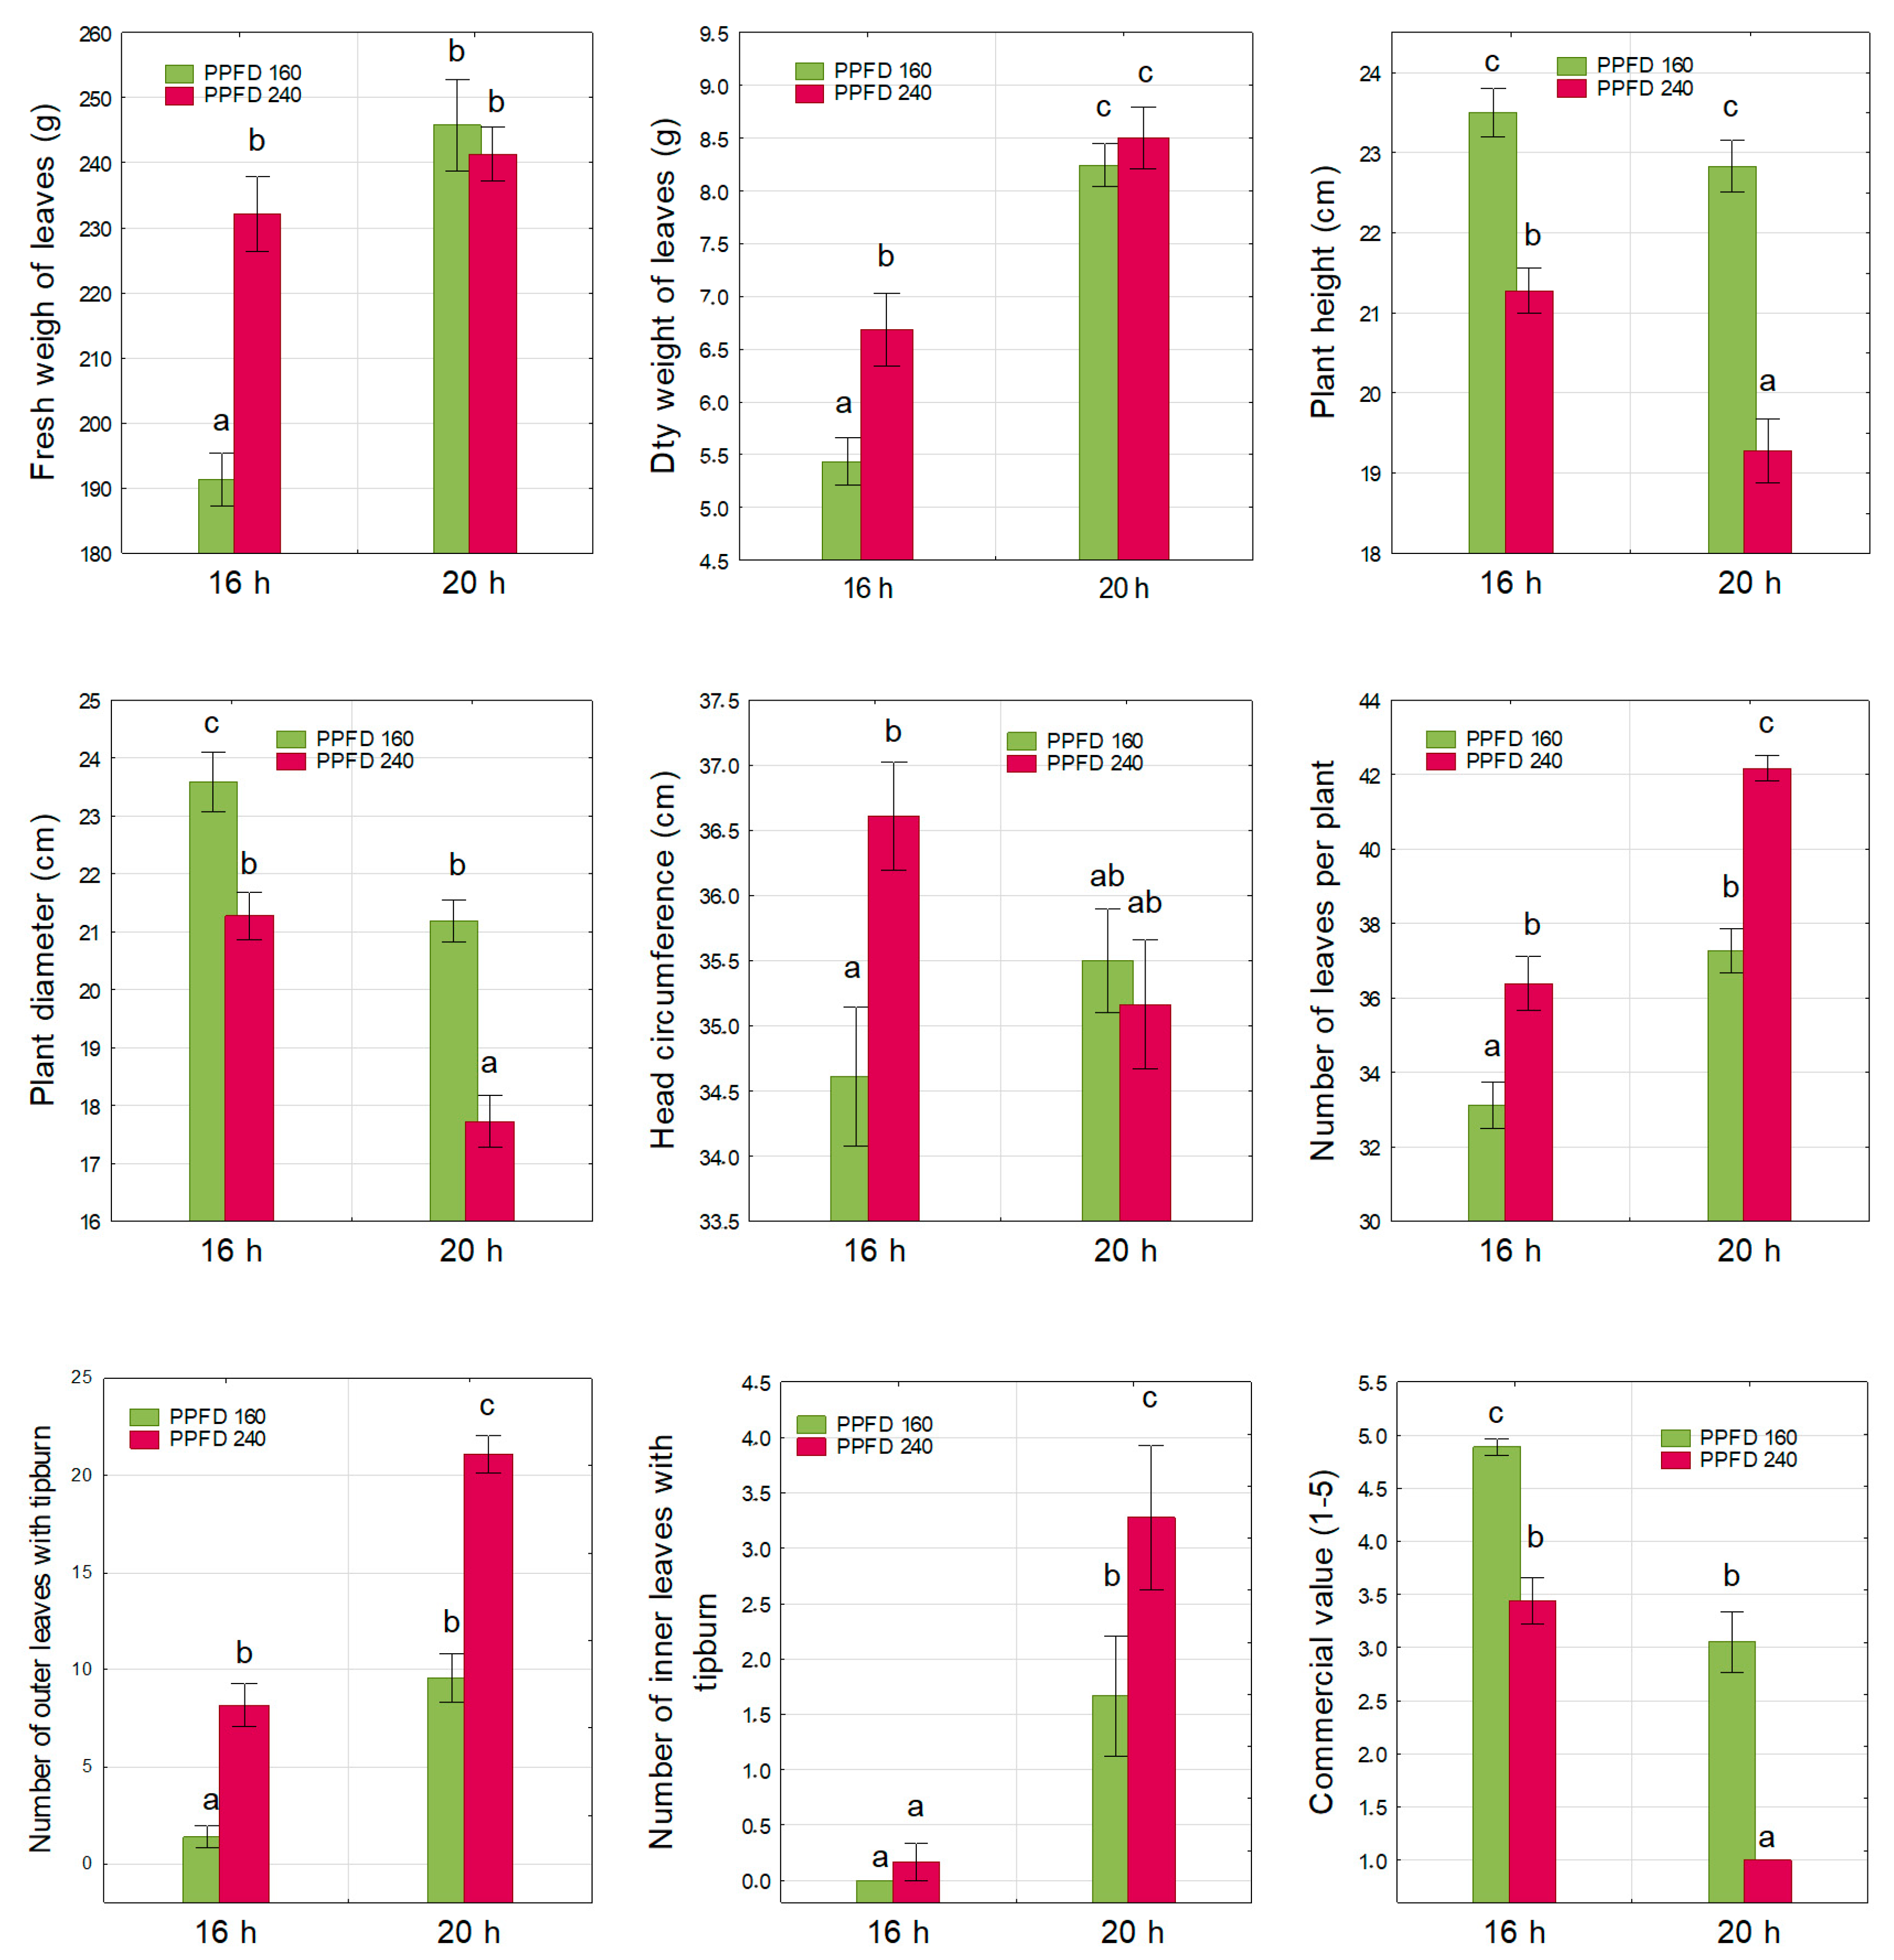
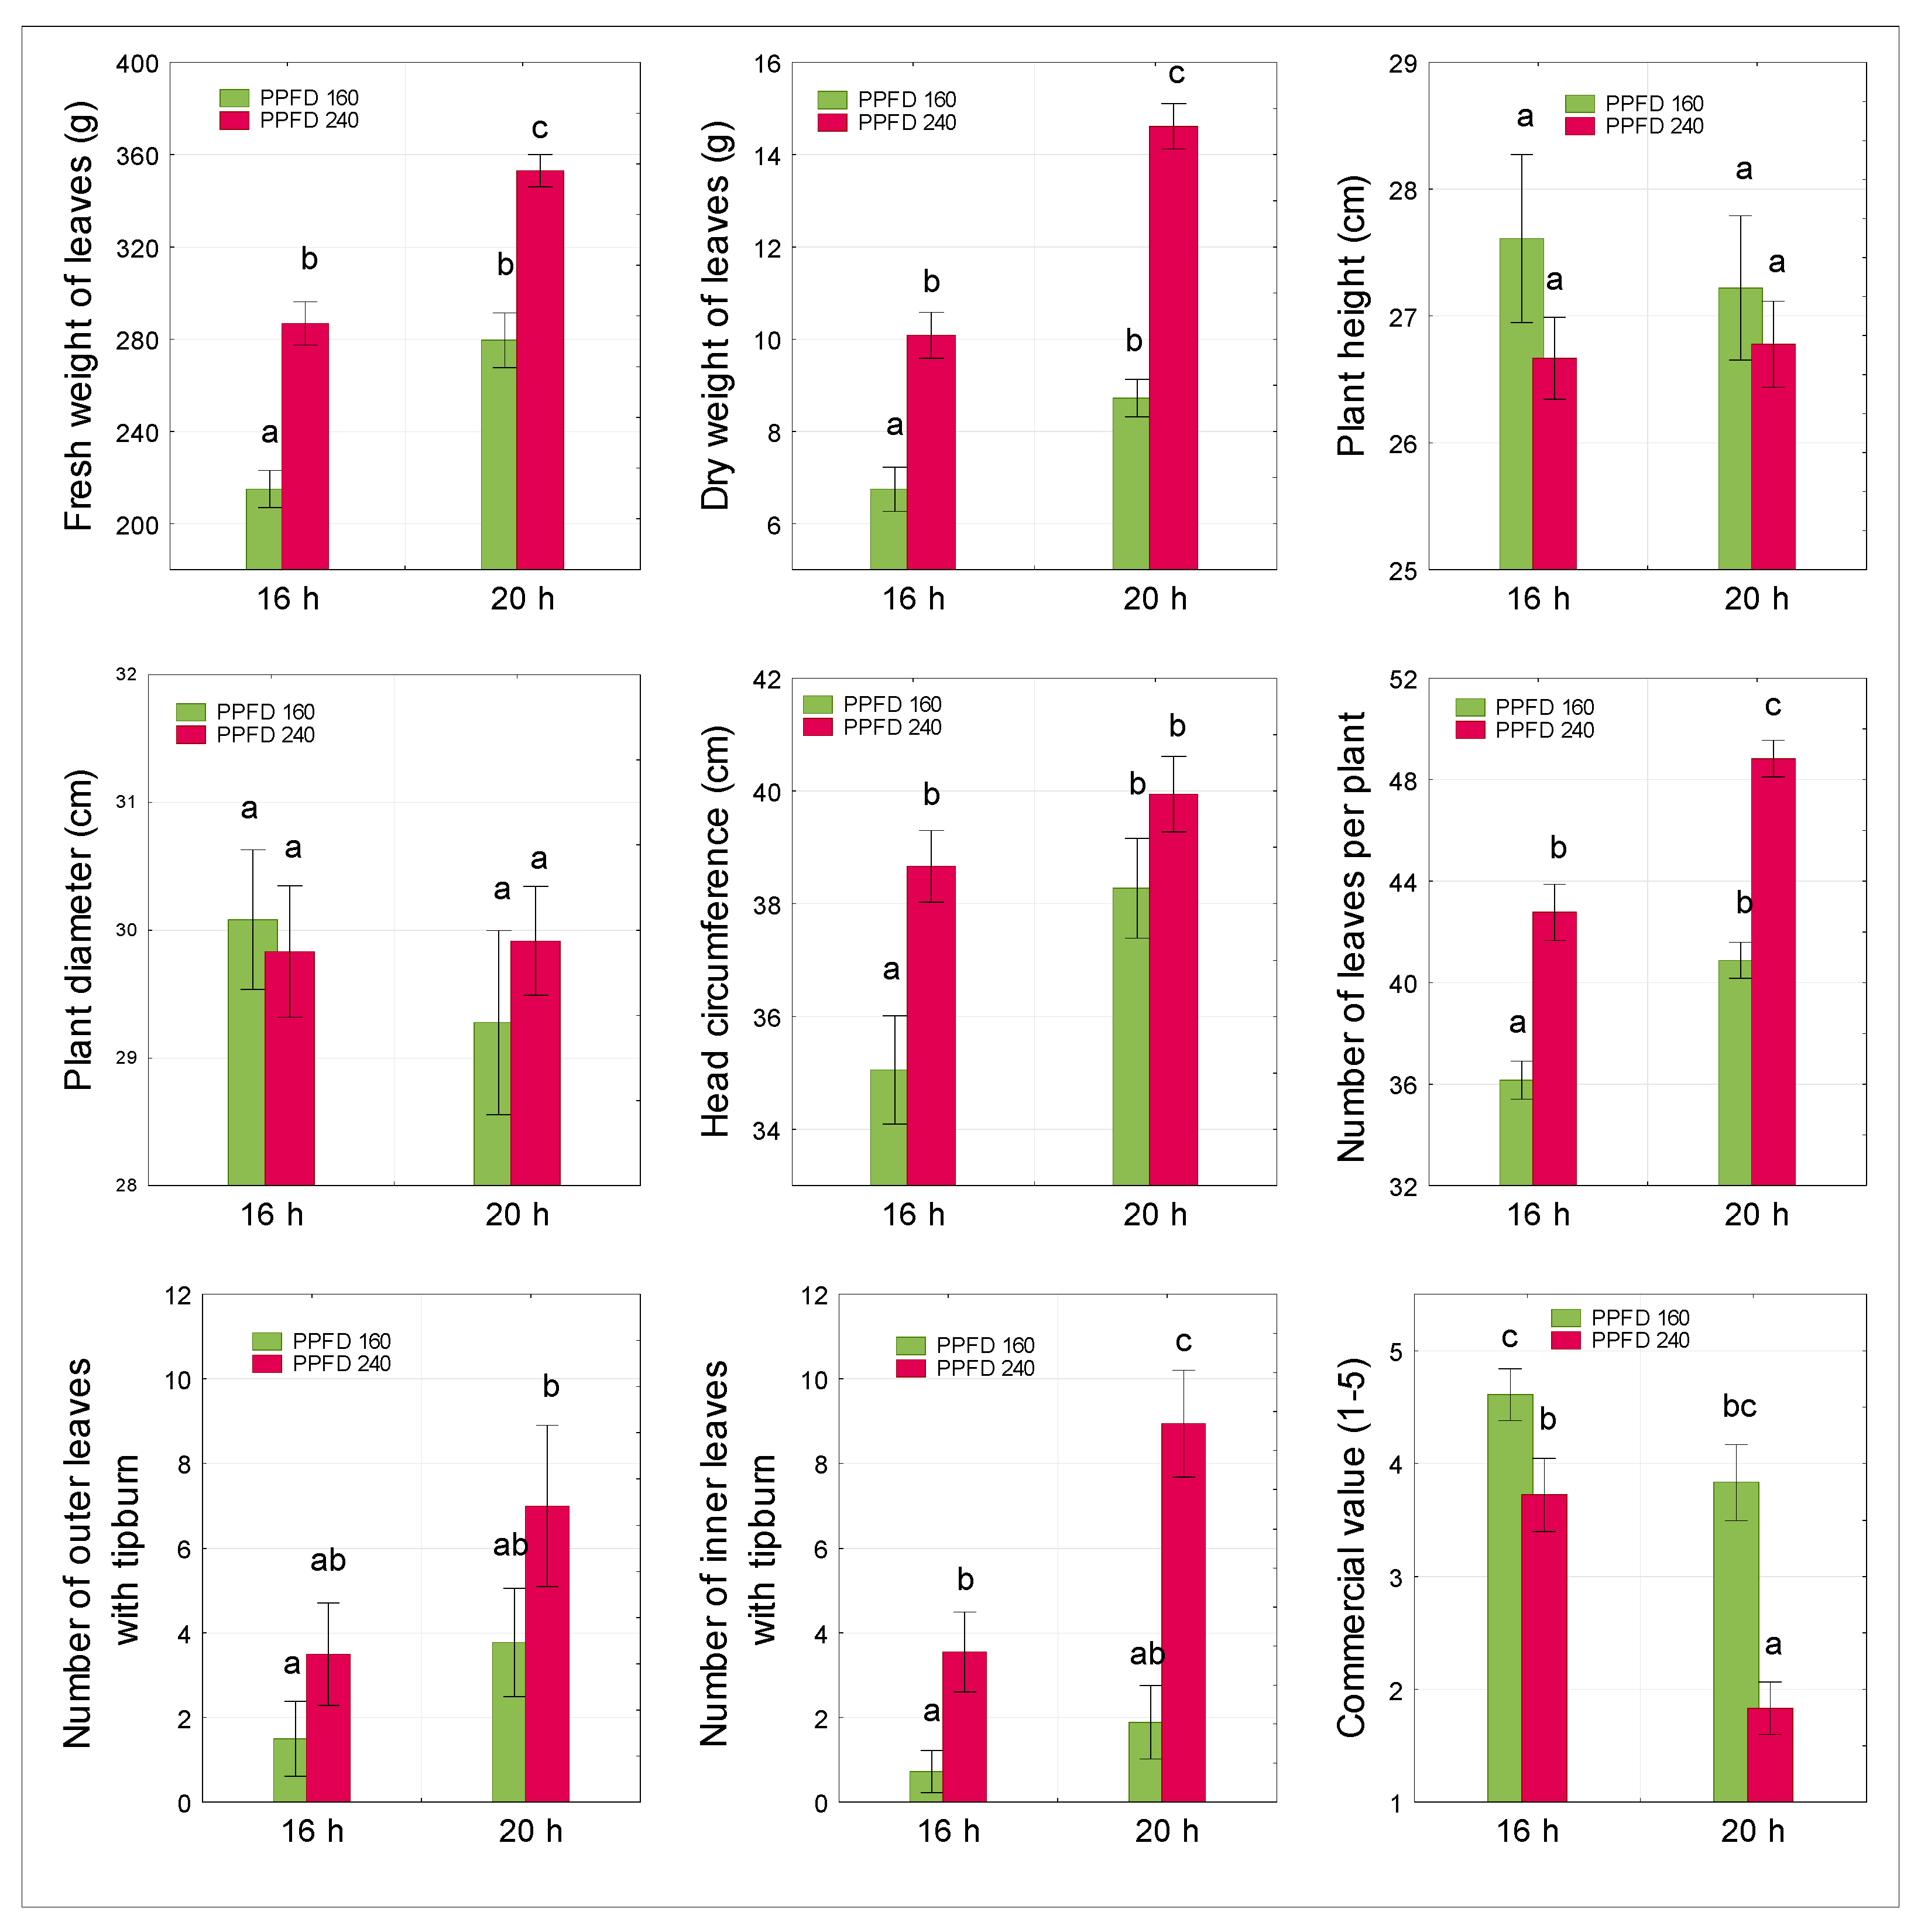
3.1. Plant Growth
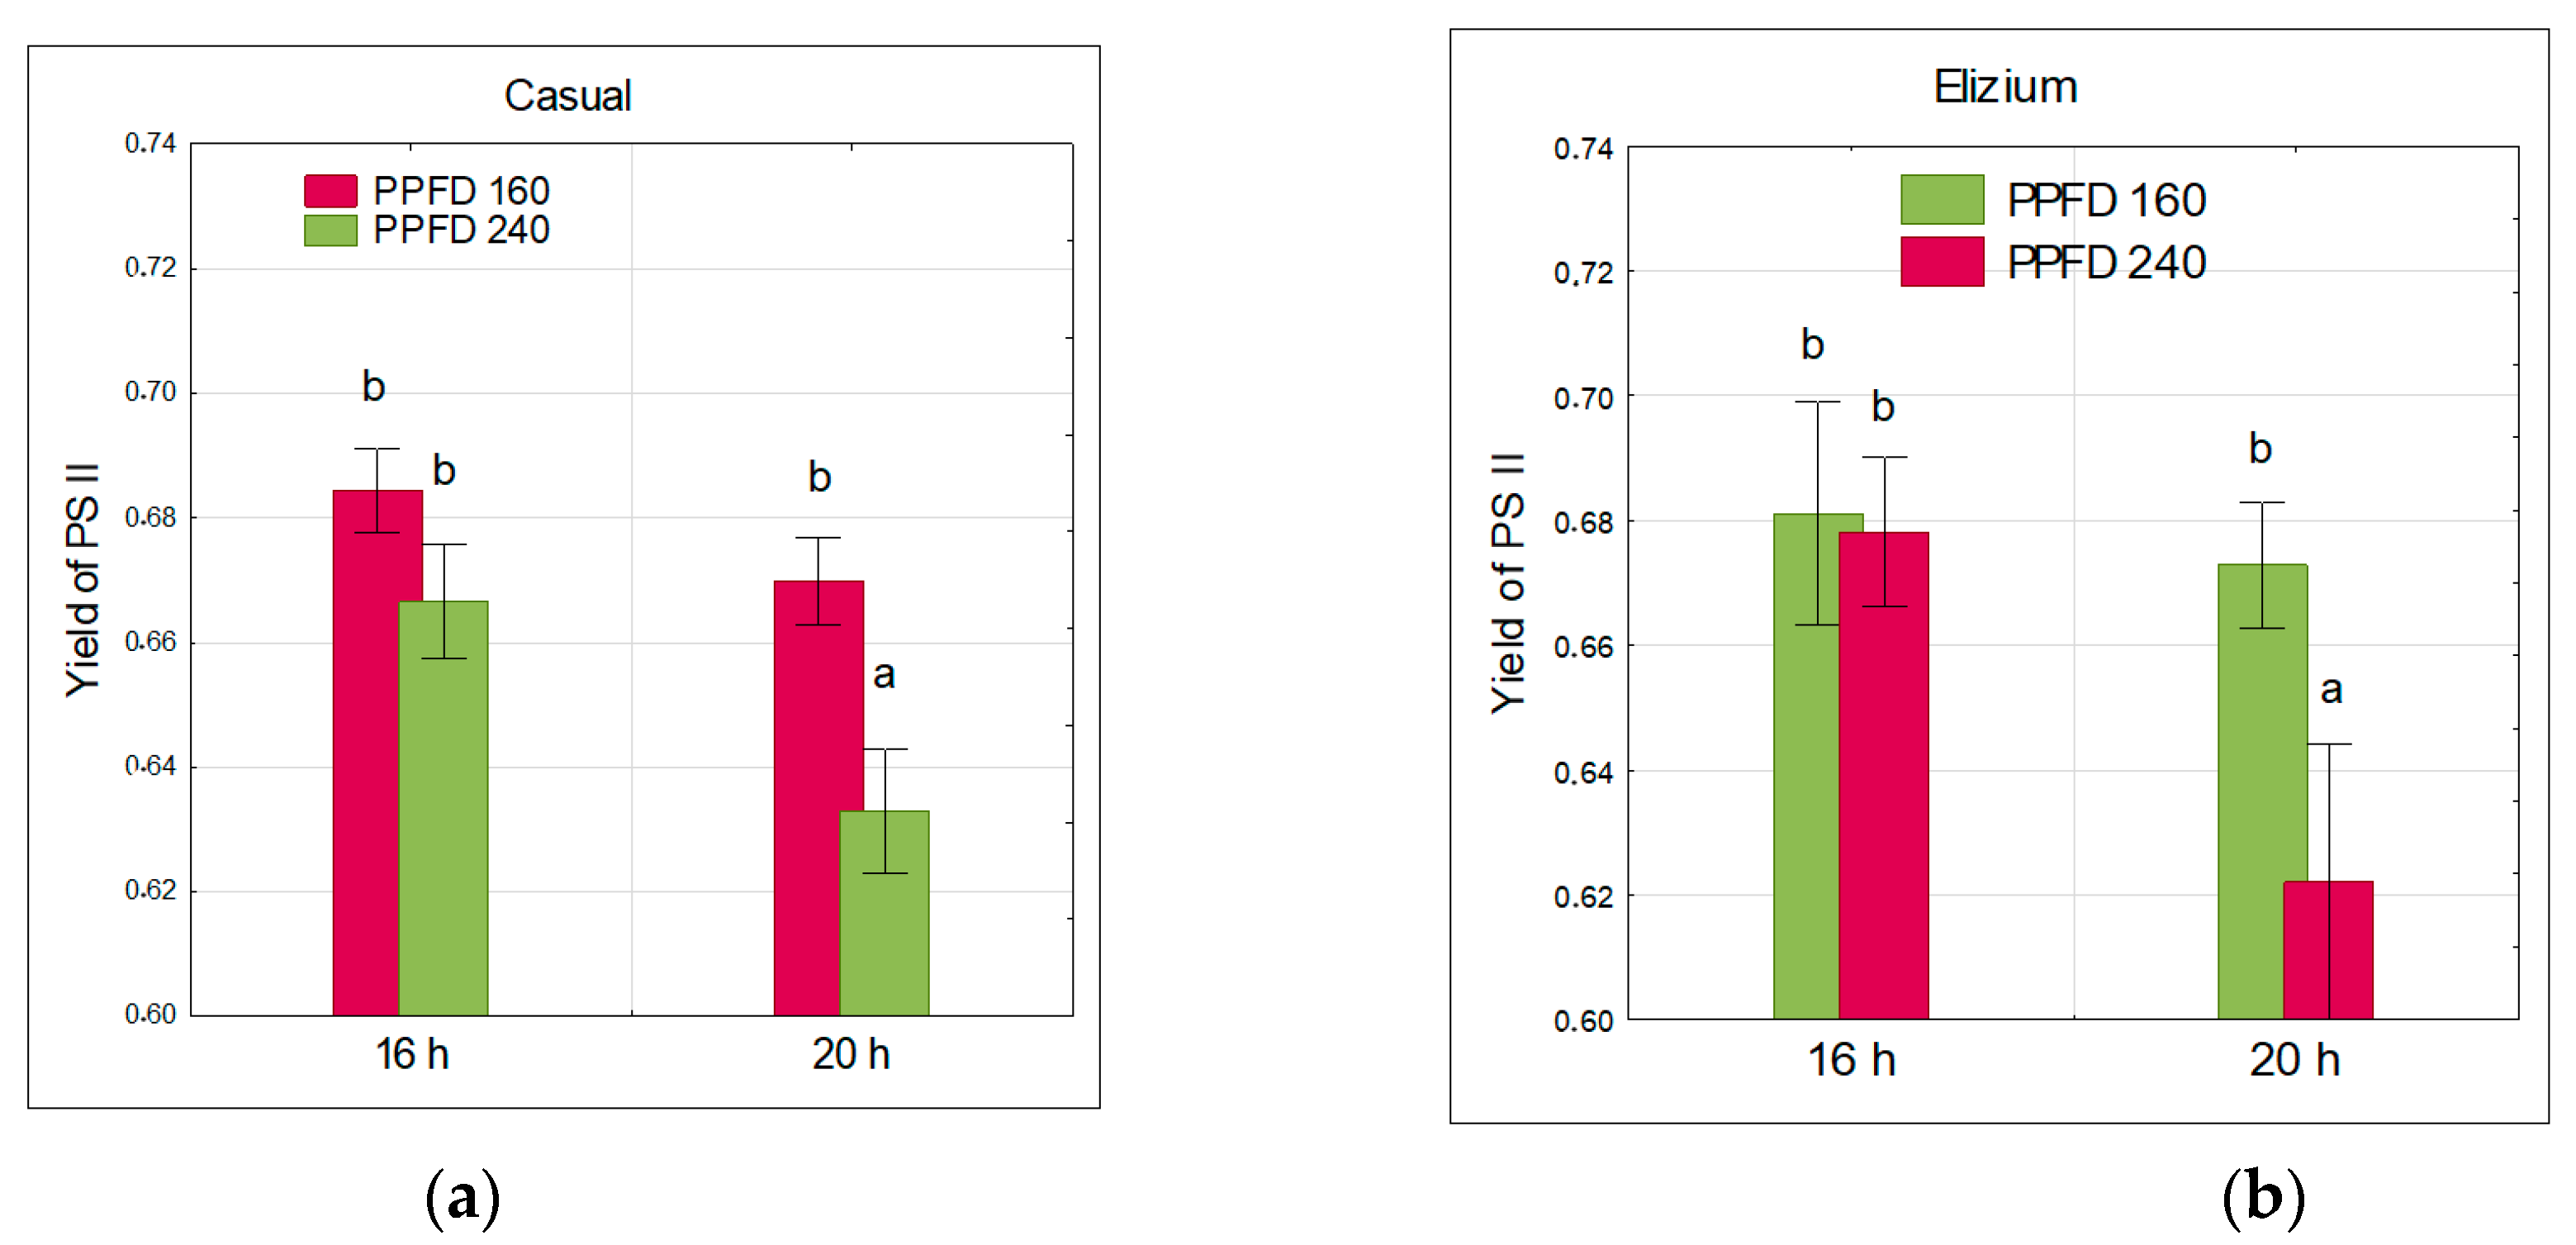
3.2. Chlorophyll Fluorescence
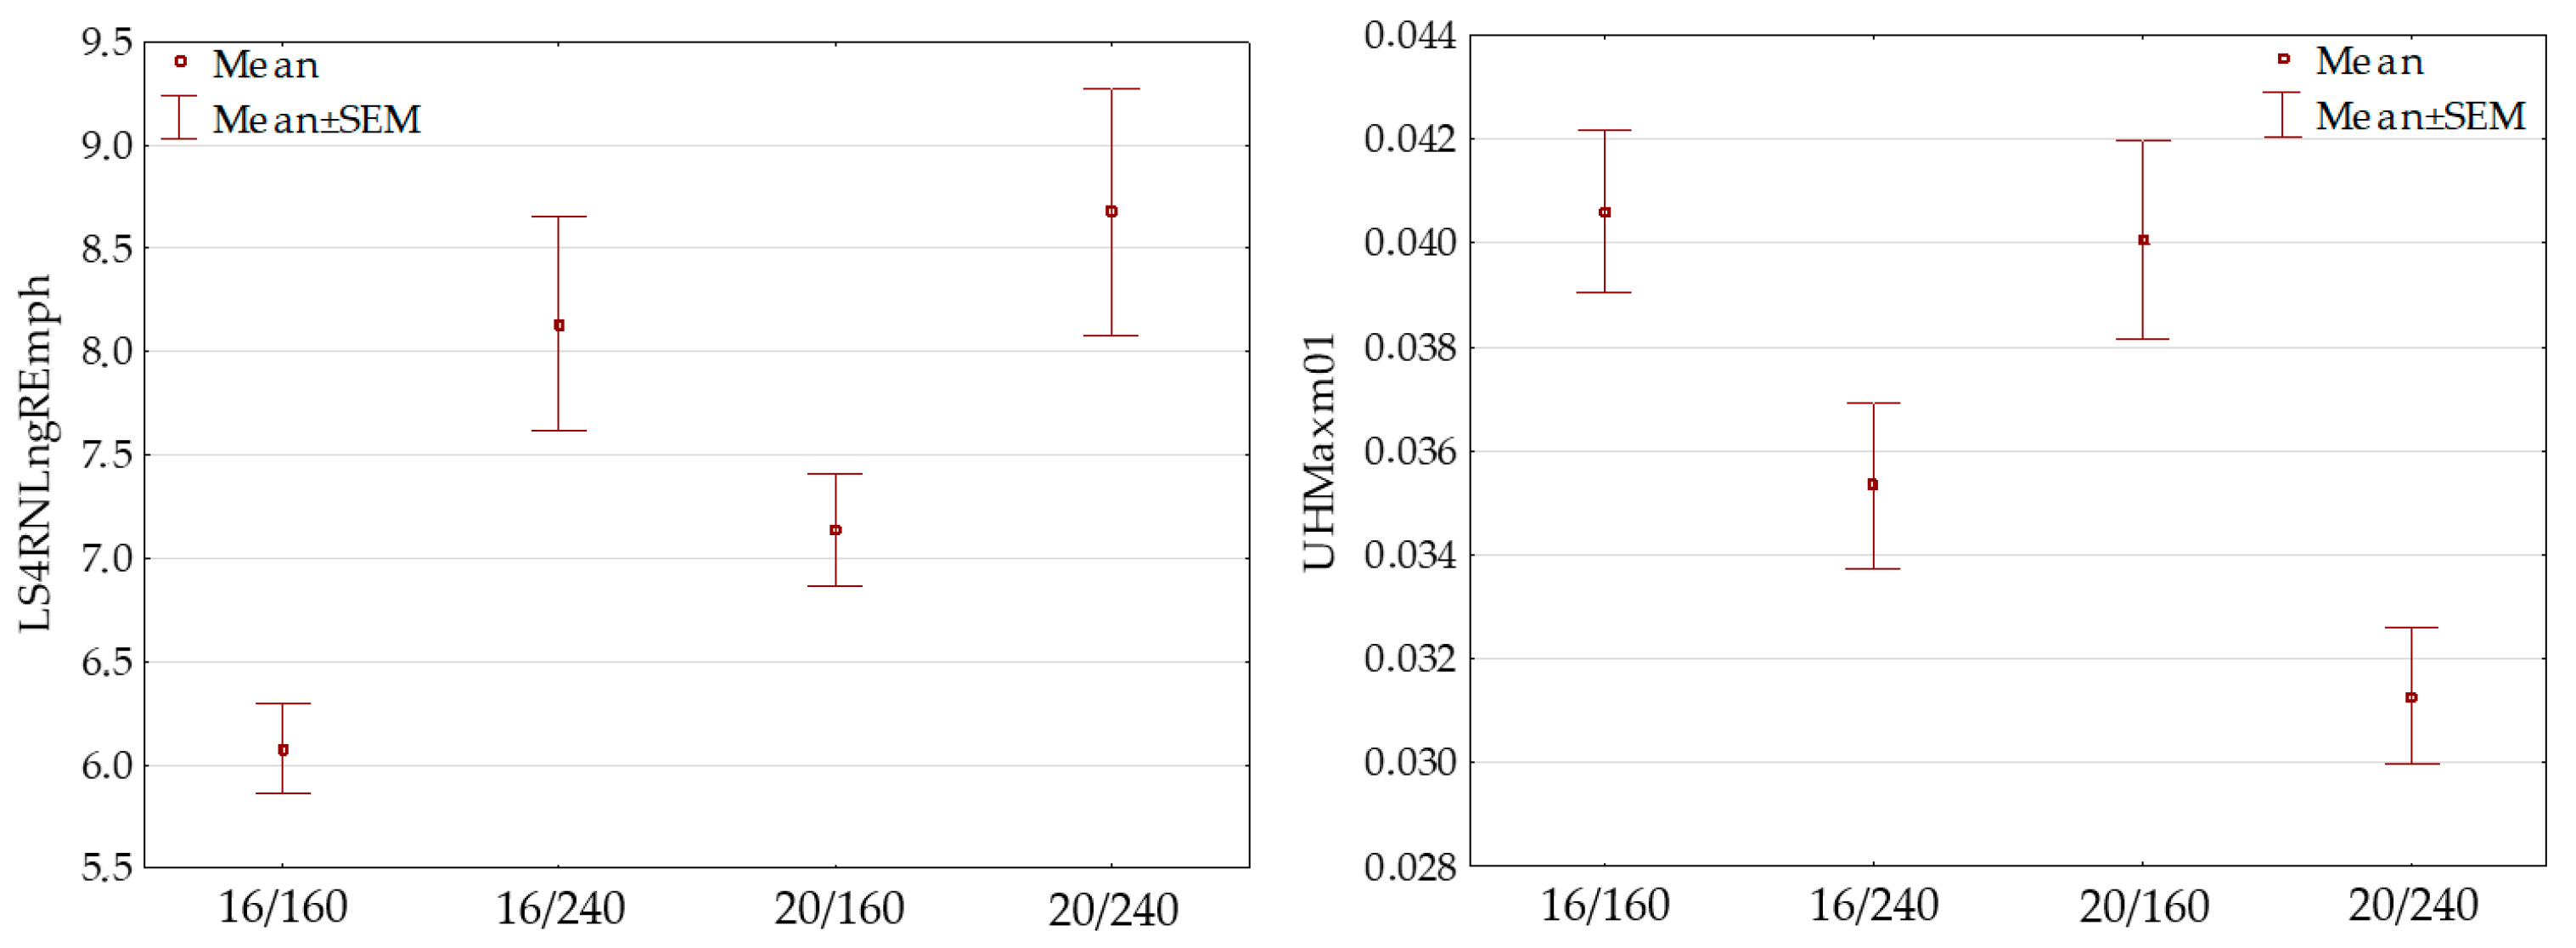
3.3. Nitrate Nitrogen in Plants
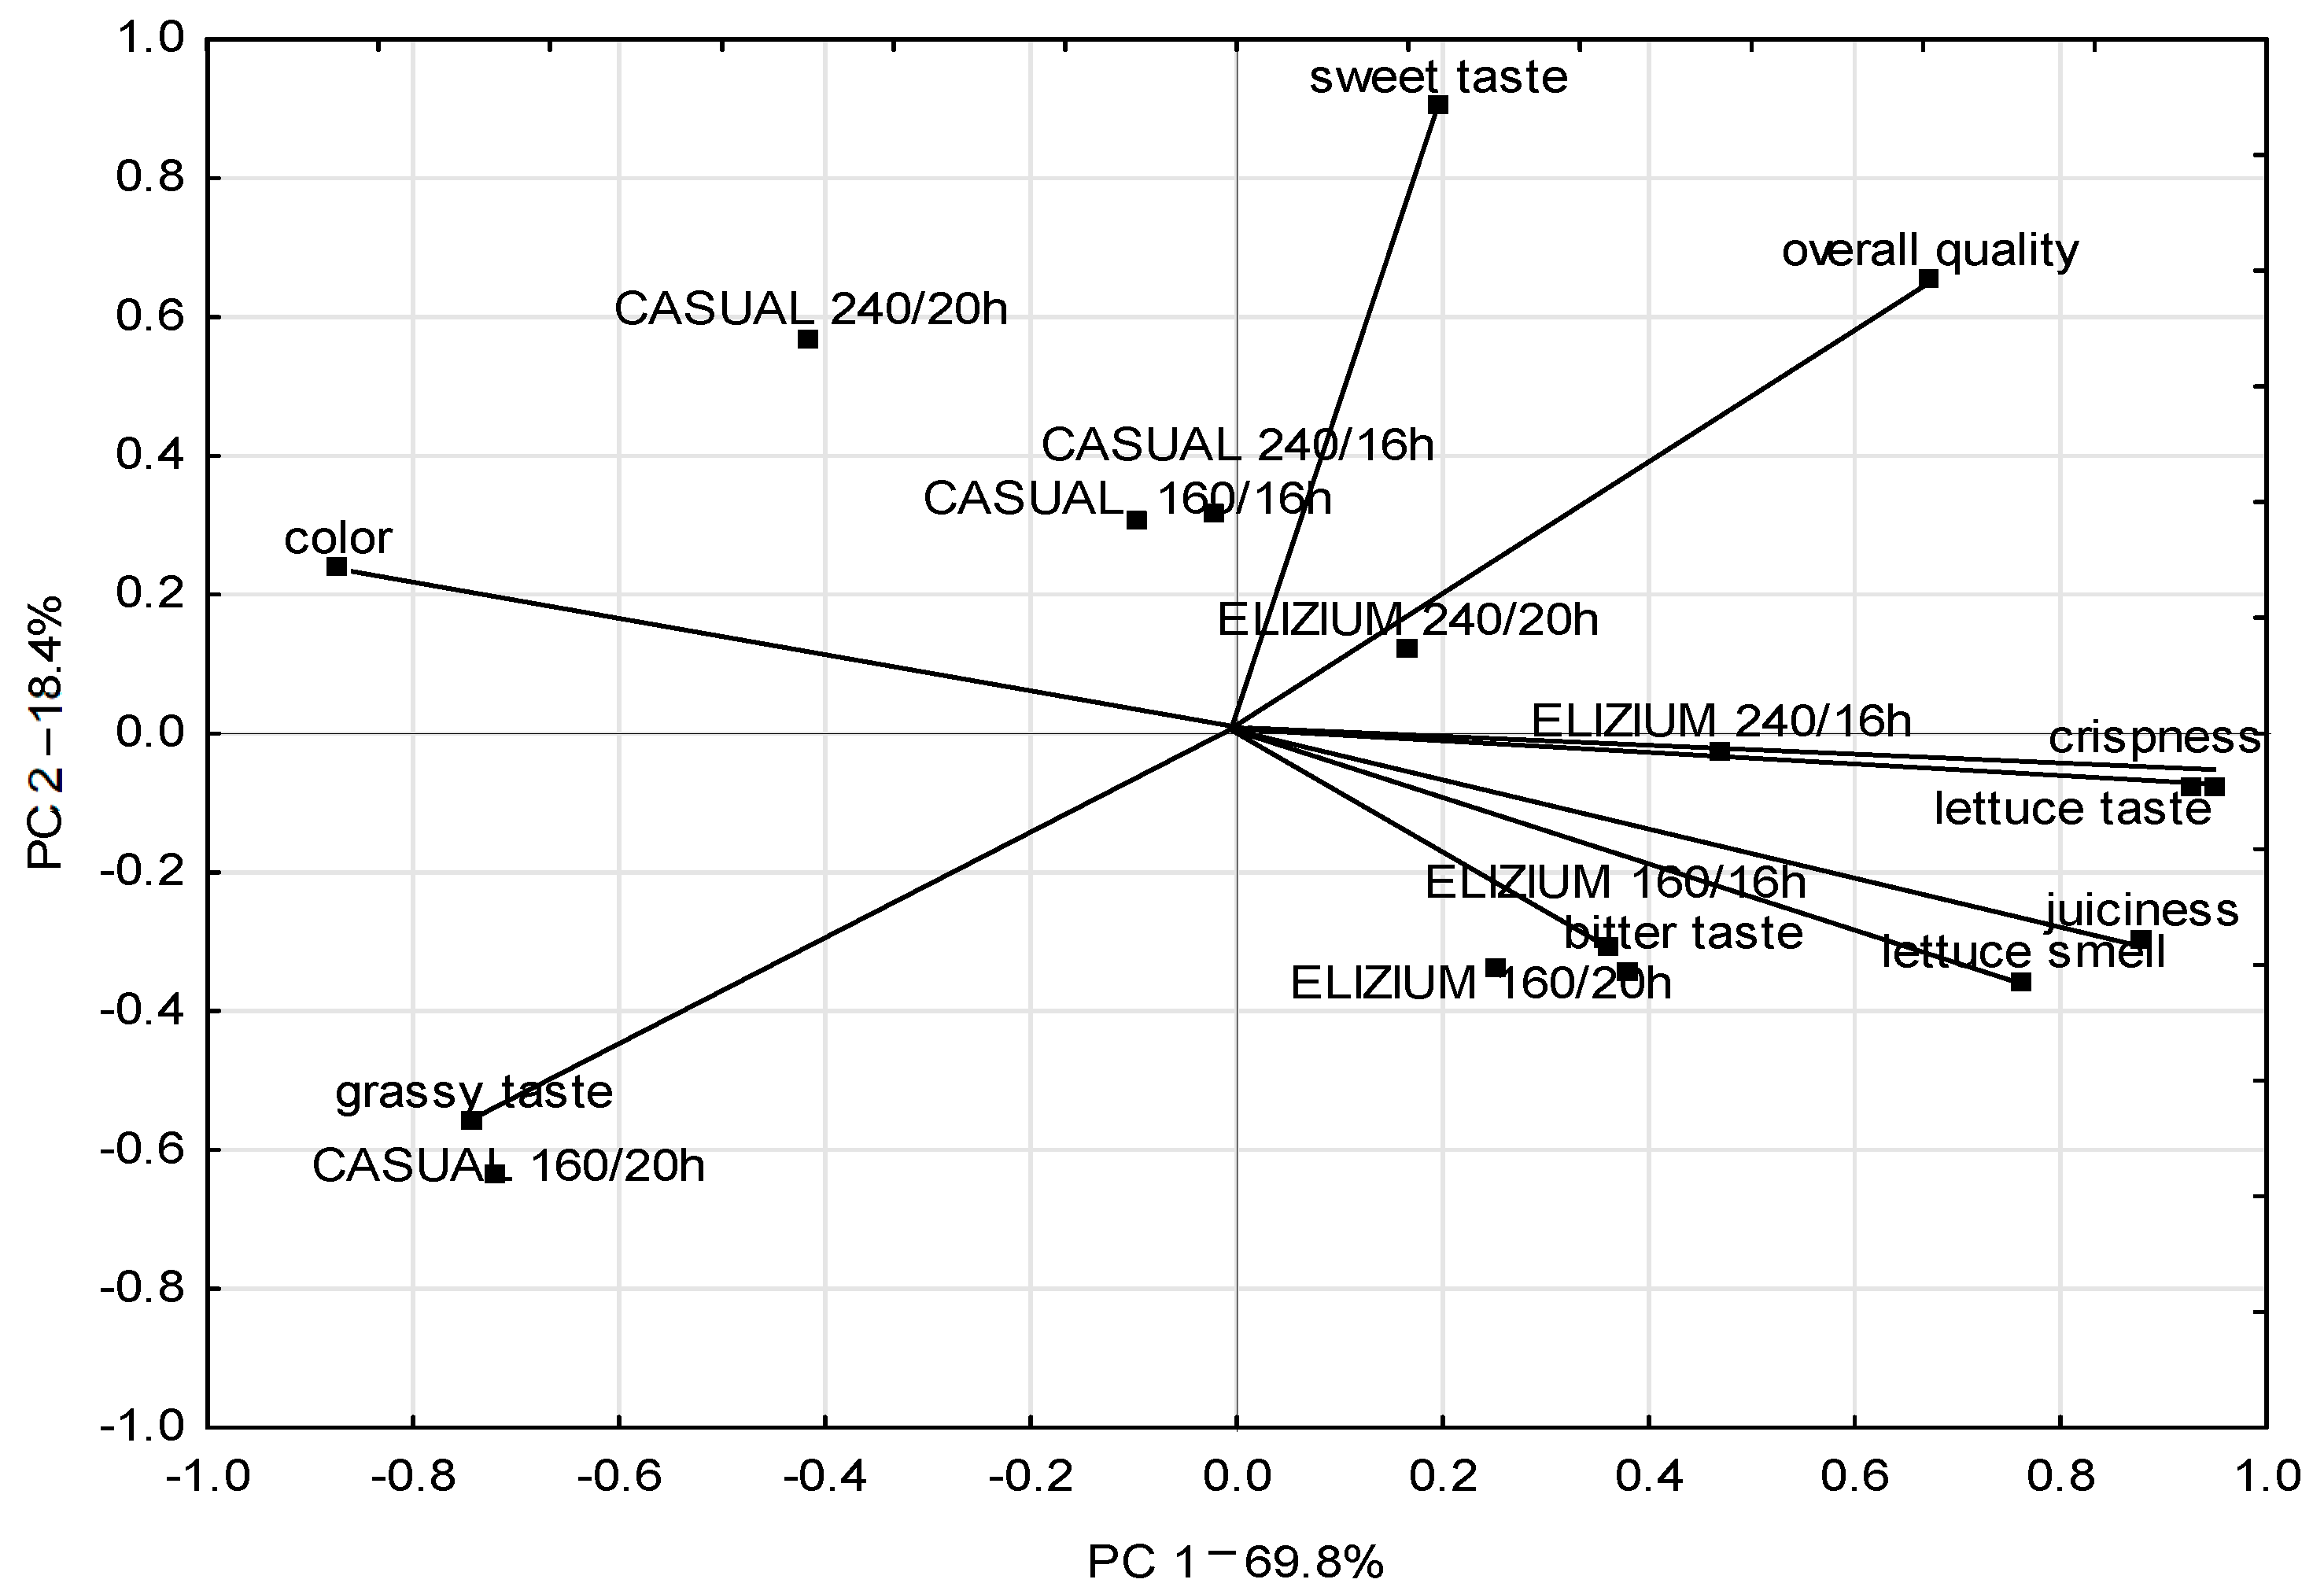
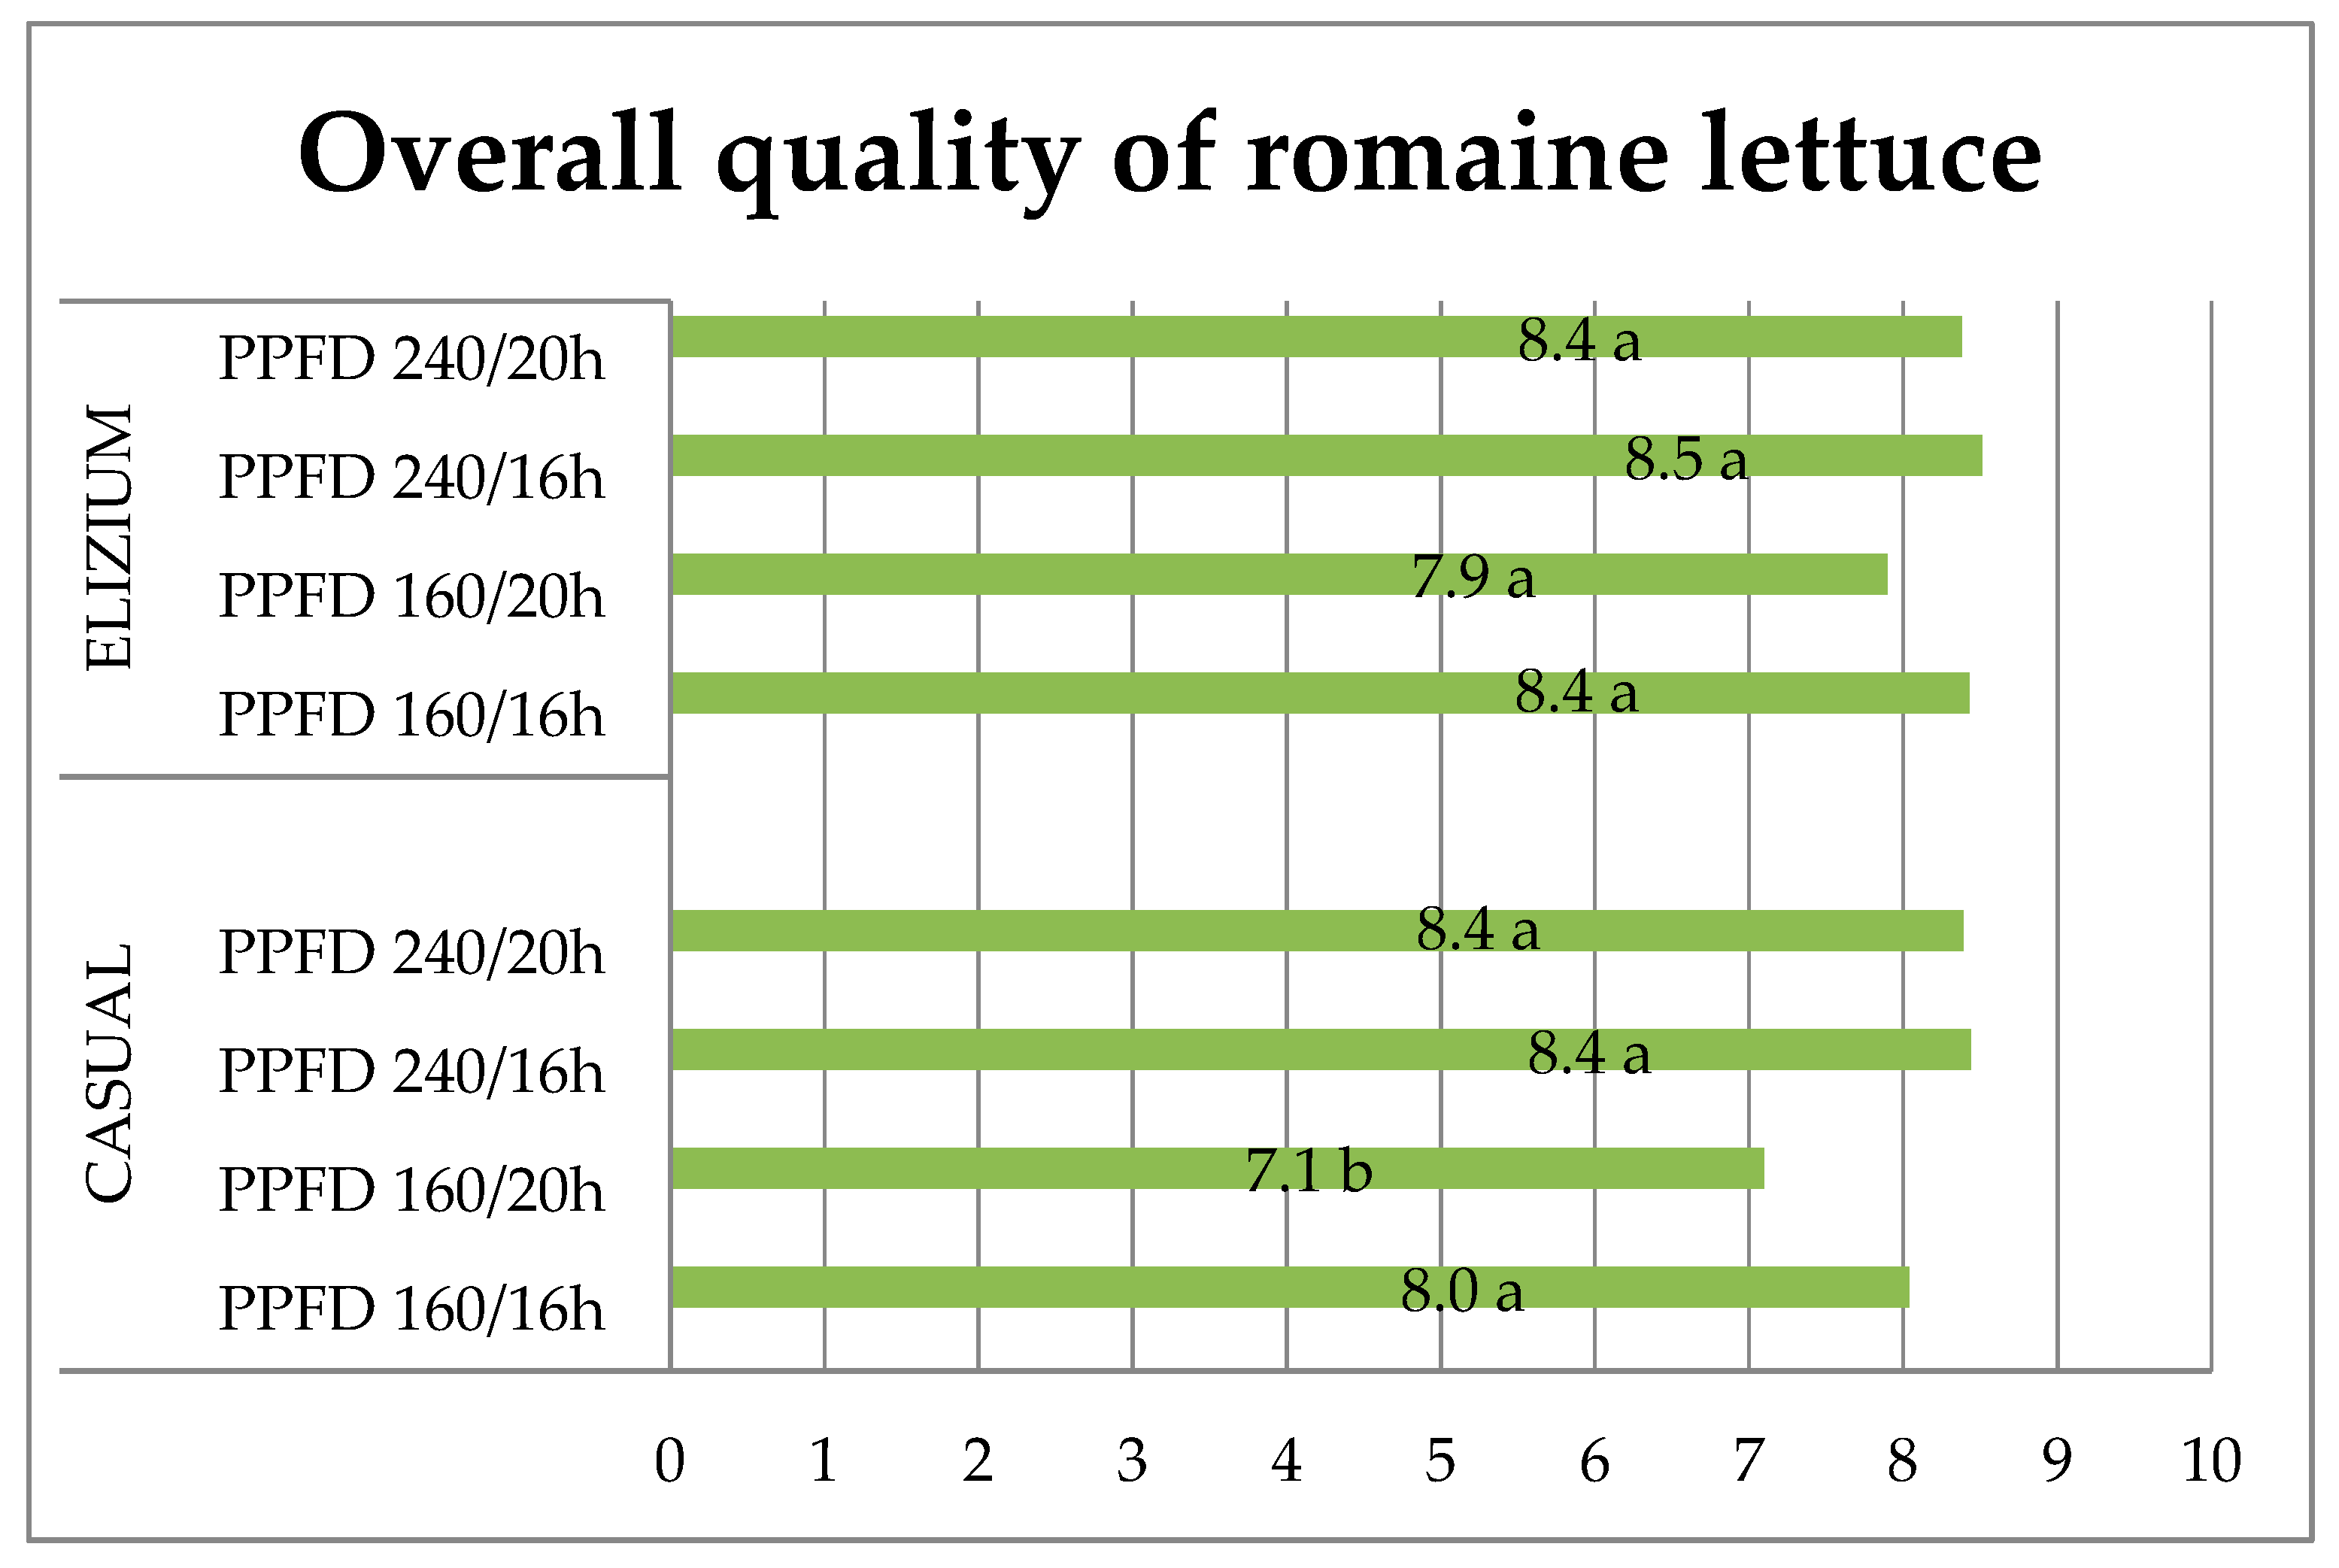
3.4. Sensory Quality
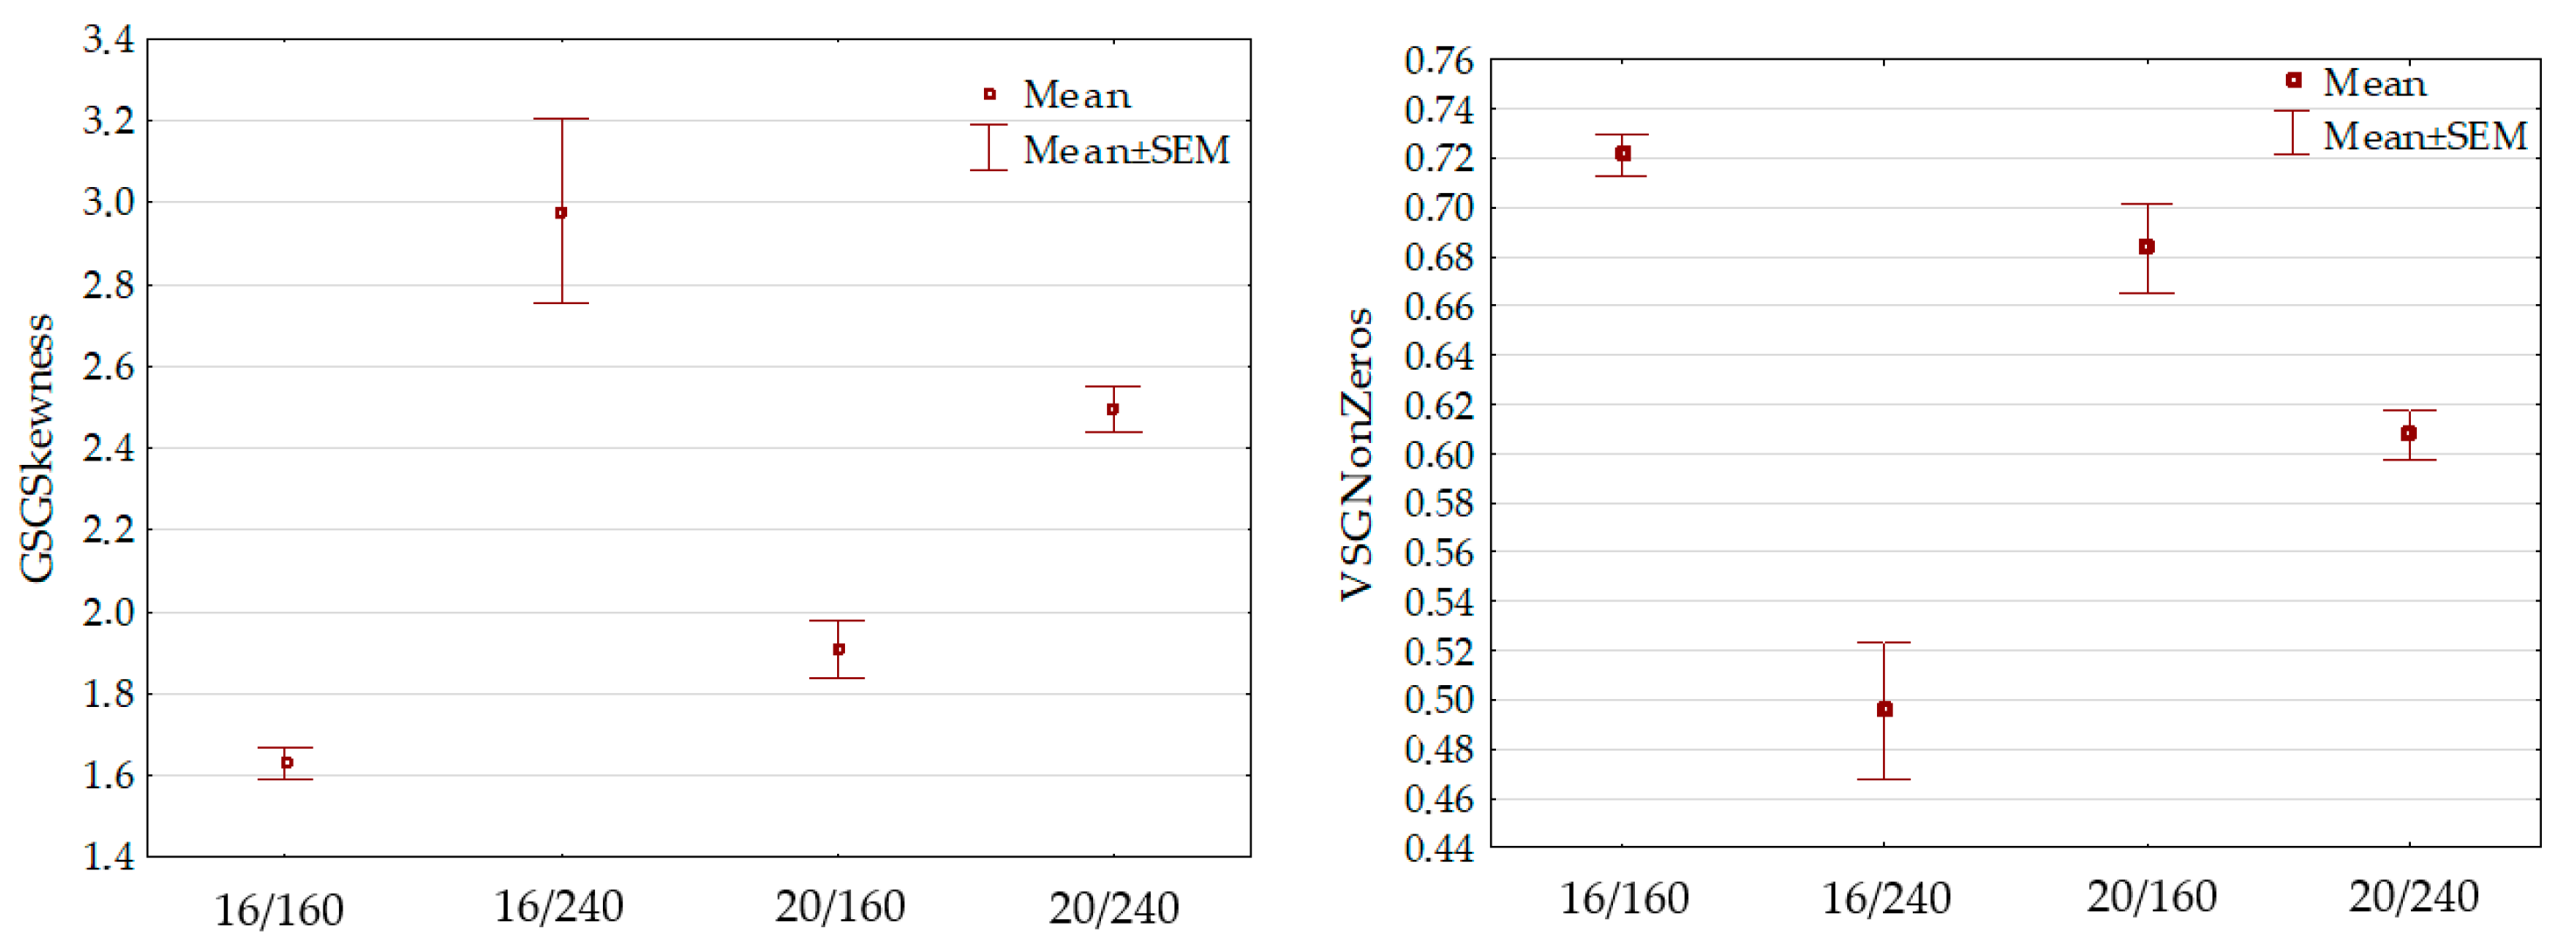
3.5. Lettuce Leaf Discrimination Based on Image Features
4. Discussion
5. Conclusions
Author Contributions
Funding
Institutional Review Board Statement
Informed Consent Statement
Data Availability Statement
Conflicts of Interest
References
- Kozai, T.; Niu, G. Plant factory as a resource-efficient closed plant production system. In Plant Factory: An Indoor Vertical Farming System for Efficient Quality Food Production; Academic Press: Cambridge, MA, USA, 2016; pp. 69–90. [Google Scholar]
- Shen, Y.Z.; Guo, S.S.; Ai, W.D.; Tang, Y.K. Effects of illuminants and illumination time on lettuce growth, yield and nutritional quality in a controlled environment. Life Sci. Space Res. 2014, 2, 38–42. [Google Scholar] [CrossRef]
- Ouzounis, T.; Rosenqvist, E.; Ottosen, C.O. Spectral effects of artificial light on plant physiology and secondary metabolism: A review. HortScience 2015, 50, 1128–1135. [Google Scholar] [CrossRef] [Green Version]
- van Iersel, M.W. Optimizing LED lighting in controlled environment agriculture. In Light Emitting Diodes for Agriculture; Springer: Singapore, 2017; pp. 59–80. [Google Scholar]
- Zhang, X.; He, D.X.; Niu, G.H.; Yan, Z.N.; Song, J.X. Effects of environment lighting on the growth, photosynthesis, and quality of hydroponic lettuce in a plant factory. Int. J. Agric. Biol. Eng. 2018, 11, 33–40. [Google Scholar] [CrossRef]
- Azad, O.K.; Kjaer, K.H.; Adnan, M.; Naznin, M.T.; Lim, J.D.; Sung, I.J.; Park, C.H.; Lim, Y.S. The evaluation of growth performance, photosynthetic capacity, and primary and secondary metabolite content of leaf lettuce grown under limited irradiation of blue and red LED light in an urban plant factory. Agriculture 2020, 10, 28. [Google Scholar] [CrossRef] [Green Version]
- Loconsole, D.; Cocetta, C.; Santoro, P.; Ferrante, A. Optimization of LED lighting and quality evaluation of Romaine Lettuce grown in an innovative indoor cultivation system. Sustainability 2019, 11, 841. [Google Scholar] [CrossRef] [Green Version]
- Carotti, L.; Graamans, L.; Puksic, F.; Butturini, M.; Meinen, E.; Heuvelink, E.; Stanghellini, C. Plant factories are heating up: Hunting for the best combination of light intensity, air temperature and root-zone temperature in lettuce production. Front. Plant Sci. 2021, 11, 592171. [Google Scholar] [CrossRef]
- Park, J.E.; Park, Y.G.; Jeong, B.R.; Hwang, S.J. Growth of lettuce in closed-type plant production system as affected light intensity and photoperiod under influence of white LED light. Prot. Hortic. Plant. Fact. 2013, 22, 228–233. [Google Scholar] [CrossRef]
- Kang, W.H.; Park, J.S.; Park, K.S.; Son, J.E. Leaf photosynthetic rate, growth, and morphology of lettuce under different fractions of red, blue, and green light from light-emitting diodes (LEDs). Hortic. Environ. Biotechnol. 2016, 57, 573–579. [Google Scholar] [CrossRef]
- Yan, Z.; He, D.; Niu, G.; Zhou, Q.; Qu, Y. Growth, nutritional quality, and energy use efficiency of hydroponic lettuce as influenced by daily light integrals exposed to white versus white plus red light-emitting diodes. Hortscience 2019, 54, 1737–1744. [Google Scholar] [CrossRef] [Green Version]
- Lin, K.-H.; Huang, M.-Y.; Huang, W.-D.; Hsu, M.-H.; Yang, Z.-W.; Yang, C.-M. The effects of red, blue, and white light-emitting diodes on the growth, development, and edible quality of hydroponically grown lettuce (Lactuca sativa L. var. capitata). Sci. Hortic. 2013, 150, 86–91. [Google Scholar] [CrossRef]
- Pennisi, G.; Orsini, F.; Blasioli, S.; Cellini, A.; Crepaldi, A.; Braschi, I.; Spinelli, F.; Nicola, S.; Fernandez, J.; Stanghellini, C.; et al. Resource use efficiency of indoor lettuce (Lactuca sativa L.) cultivation as affected by red:blue ratio provided by LED lighting. Sci. Rep. 2019, 9, 14127. [Google Scholar] [CrossRef] [PubMed]
- Pinho, P.; Jokinen, K.; Halonen, L. The influence of the LED light spectrum on the growth and nutrient uptake of hydroponically grown lettuce. Light. Res. Technol. 2017, 49, 866–881. [Google Scholar] [CrossRef]
- Son, K.H.; Lee, J.H.; Oh, Y.; Kim, D.; Oh, M.M.; In, B.C. Growth and bioactive compound synthesis in cultivated lettuce subject to light-quality changes. HortScience 2017, 52, 584–591. [Google Scholar] [CrossRef]
- Ropelewska, E.; Wrzodak, A.; Sabanci, K.; Aslan, M.F. Effect of lacto-fermentation and freeze-drying on the quality of beetroot evaluated using machine vision and sensory analysis. Eur. Food Res. Technol. 2022, 248, 153–161. [Google Scholar] [CrossRef]
- Jishi, T.; Kimura, K.; Matsuda, R.; Fujiwara, K. Effects of temporally shifted irradiation of blue and red LED light on cos lettuce growth and morphology. Sci. Hortic. 2016, 198, 227–232. [Google Scholar] [CrossRef]
- Mickens, M.A.; Skoog, E.J.; Reese, L.E.; Barnwell, P.L.; Spencer, L.E.; Massa, G.D.; Wheeler, R.M. A strategic approach for investigating light recipes for ‘Outredgeous’ red romaine lettuce using white and monochromatic LED. Life Sci. Space Res. 2018, 19, 53–62. [Google Scholar] [CrossRef]
- Xu, W.; Nguyen, D.T.P.; Sakaguchi, S.; Akiyama, T.; Tsukagoshi, S.; Feldman, A.; Lu, N. Relation between relative growth rate and tipburn occurrence of romaine lettuce under different light regulation in a plant factory with LED lighting. Eur. J. Hortic. Sci. 2020, 85, 351–361. [Google Scholar] [CrossRef]
- Matysiak, B.; Kaniszewski, S.; Dyśko, J.; Kowalczyk, W.; Kowalski, A.; Grzegorzewska, M. The Impact of LED Light Spectrum on the Growth, Morphological Traits, and Nutritional Status of ‘Elizium’ Romaine Lettuce Grown in an Indoor Controlled Environment. Agriculture 2021, 11, 1133. [Google Scholar] [CrossRef]
- Fu, W.; Li, P.; Wu, Y.; Tang, J. Effects of different light intensities on anti-oxidative enzyme activity, quality and biomass in lettuce. Hortic. Sci. 2012, 39, 129–134. [Google Scholar]
- Noh, K.; Jeong, B.R. Optimizing temperature and photoperiod in a home cultivation system to program normal, delayed, and hastened growth and development modes for leafy-oak and romaine lettuce. Sustainability 2021, 13, 10879. [Google Scholar] [CrossRef]
- Birlanga, V.; Acosta-Motos, J.R.; Pérez-Pérez, J.M. Genotype-dependent tipburn severity during lettuce hydroponic culture is associated with altered nutrient leaf content. Agronomy 2021, 11, 616. [Google Scholar] [CrossRef]
- Jenni, S.; Hayes, R.J. Genetic variation, genotype × environment interaction, and selection for tipburn resistance in lettuce in multi-environments. Euphytica 2010, 171, 427–439. [Google Scholar] [CrossRef]
- Modarelli, G.C.; Paradiso, R.; Arena, C.; De Pascale, S.; Van Labeke, M.-C. High Light intensity from blue-red LEDs enhance photosynthetic performance, plant growth, and optical properties of red lettuce in Controlled Environment. Horticulturae 2022, 8, 114. [Google Scholar] [CrossRef]
- Paz, M.; Fisher, P.; Gómez, C. Minimum light requirement for indoor gardening of lettuce. Urban Agric. Reg. Food Syst. 2019, 4, 190001. [Google Scholar] [CrossRef] [Green Version]
- Chang, C.-L.; Chung, S.-C.; Fu, W.-L.; Huang, C.-C. Artificial intelligence approaches to predict growth, harvest day, and quality of lettuce (Lactuca sativa L.) in a IoT-enabled greenhouse system. Biosyst. Eng. 2021, 212, 77–105. [Google Scholar] [CrossRef]
- Hosseini, H.; Mozafari, V.; Roosta, H.R.; Shirani, H.; van de Vlasakker, P.C.H.; Farhangi, M. Nutrient Use in Vertical Farming: Optimal Electrical Conductivity of Nutrient Solution for Growth of Lettuce and Basil in Hydroponic Cultivation. Horticulturae 2021, 7, 283. [Google Scholar] [CrossRef]
- Mokhtar, A.; El-Ssawy, W.; He, H.; Al-Anasari, N.; Sammen, S.S.; Gyasi-Agyei, Y.; Abuarab, M. Using Machine Learning Models to Predict Hydroponically Grown Lettuce Yield. Front. Plant Sci. 2022, 13, 706042. [Google Scholar] [CrossRef]
- Sharma, N.; Sharma, R.; Jindal, N. Machine Learning and Deep Learning Applications—A Vision. Glob. Transit. Proc. 2021, 2, 24–28. [Google Scholar] [CrossRef]
- Asongo, A.I.; Barma, M.; Muazu, H.G. Machine Learning Techniques, methods and Algorithms: Conceptual and Practical Insights. Int. J. Eng. Res. Appl. 2021, 11, 55–64. [Google Scholar]
- Sharma, A.; Jain, A.; Gupta, P.; Chowdary, V. Machine learning applications for precision agriculture: A comprehensive review. IEEE Access 2020, 9, 4843–4873. [Google Scholar] [CrossRef]
- Nosratabadi, S.; Ardabili, S.; Lakner, Z.; Mako, C.; Mosavi, A. Prediction of Food Production Using Machine Learning Algorithms of Multilayer Perceptron and ANFIS. Agriculture 2021, 11, 408. [Google Scholar] [CrossRef]
- Benos, L.; Tagarakis, A.C.; Dolias, G.; Berruto, R.; Kateris, D.; Bochtis, D. Machine Learning in Agriculture: A Comprehensive Updated Review. Sensors 2021, 21, 3758. [Google Scholar] [CrossRef] [PubMed]
- Lawless, H.T.; Heymann, H. Sensory Evaluation of Food: Principles and Practices; Chapman & Hall: New York, NY, USA, 1998; p. 608. [Google Scholar]
- Szczypiński, P.M.; Strzelecki, M.; Materka, A.; Klepaczko, A. MaZda-A software package for image texture analysis. Comput. Methods Programs Biomed. 2009, 94, 66–76. [Google Scholar] [CrossRef]
- Ibraheem, N.A.; Hasan, M.M.; Khan, R.Z.; Mishra, P.K. Understanding Color Models: A Review. ARPN J. Sci. Technol. 2012, 2, 265–275. [Google Scholar]
- Ropelewska, E. The Application of Machine Learning for Cultivar Discrimination of Sweet Cherry Endocarp. Agriculture 2021, 11, 6. [Google Scholar] [CrossRef]
- Ropelewska, E. The use of seed texture features for discriminating different cultivars of stored apples. J. Stored Prod. Res. 2020, 88, 101668. [Google Scholar] [CrossRef]
- Ropelewska, E. Diversity of Plum Stones Based on Image Texture Parameters and Machine Learning Algorithms. Agronomy 2022, 12, 762. [Google Scholar] [CrossRef]
- Bouckaert, R.R.; Frank, E.; Hall, M.; Kirkby, R.; Reutemann, P.; Seewald, A.; Scuse, D. WEKA Manual for Version 3-9-1; University of Waikato: Hamilton, New Zealand, 2016; 341p. [Google Scholar]
- Frank, E.; Hall, M.A.; Witten, I.H. The WEKA Workbench. In Online Appendix for Data Mining: Practical Machine Learning Tools and Techniques, 4th ed.; Elsevier: San Francisco, CA, USA, 2016; 128p. [Google Scholar]
- Witten, I.H.; Frank, E. Data Mining: Practical Machine Learning Tools and Techniques, 2nd ed.; Elsevier: San Francisco, CA, USA, 2005; 558p. [Google Scholar]
- Sago, Y. Effects of light intensity and growth rate on tipburn development and leaf calcium concentration in butterhead lettuce. HortScience 2016, 51, 1087–1091. [Google Scholar] [CrossRef]
- Pennisi, G.; Orsini, F.; Landolfo, M.; Pistillo, A.; Crepaldi, A.; Nicola, S.; Fernandez, J.; Marcelis, L.F.M.; Gianquinto, G. Optimal photoperiod for indoor cultivation of leafy vegetables and herbs. Eur. J. Hortic. Sci. 2020, 85, 329–338. [Google Scholar] [CrossRef]
- Weaver, G.; van Iersel, M.W. Photochemical characterization of greenhouse-grown lettuce (Lactuca sativa L. ‘Green Towers’) with applications for supplemental lighting control. HortScience 2019, 54, 317–322. [Google Scholar] [CrossRef] [Green Version]
- Demmig-Adams, B.; Cohu, C.M.; Muller, K.O.; Adams, W.W. Modulation of photosynthetic energy conversion in nature: From seconds to seasons. Photosynth. Res. 2012, 113, 75–78. [Google Scholar] [CrossRef] [PubMed]
- Nunes-Nesi, A.; Fernie, A.R.; Stitt, M. Metabolic and signaling aspects underpinning the regulation of plant carbon nitrogen interactions. Mol. Plant. 2010, 3, 973–996. [Google Scholar] [CrossRef] [PubMed]
- Lee, J.G.; Choi, C.S.; Jang, Y.A.; Jang, S.W.; Lee, S.G.; Um, Y.C. Effects of air temperature and air flow rate control on the tipburn occurrence of leaf lettuce in a closed-type plant factory system. Hortic. Environ. Biotechnol. 2013, 54, 303–310. [Google Scholar] [CrossRef]
- Najera, C.; Urrestarazu, M. Effect of the intensity and spectral quality of LED light on yield and nitrate accumulation in vegetables. HortScience 2019, 54, 1745–1750. [Google Scholar] [CrossRef] [Green Version]
- Song, J.; Huang, H.; Hao, Y.; Song, S.; Zhang, Y.; Liu, H. Nutritional quality, mineral and antioxidant content in lettuce affected by interaction of light intensity and nutrient solution concentration. Sci. Rep. 2020, 10, 2796. [Google Scholar] [CrossRef] [Green Version]
- Samuolienė, G.; Urbonavičiūtė, A.; Duchovskis, P.; Bliznikas, Z.; Vitta, P.; Žukauskas, A. Decrease in nitrate concentration in leafy vegetables under a solid-state illuminator. HortScience 2009, 44, 1857–1860. [Google Scholar] [CrossRef]
- Gómez, C.; Jiménez, J. Effect of end-of-production high-energy radiation on nutritional quality of indoor-grown red-leaf lettuce. HortScience 2020, 55, 1055–1060. [Google Scholar] [CrossRef]
- FAO. European Commission Regulation EC No. 1258/2011 of 2 December 2011 amending Regulation (EC) No. 1881/2006 as regards maximum levels for nitrates in foodstuffs. Off. J. Eur. Union 2011, 320, 15–17. [Google Scholar]
- Gude, K.; Talavera, M.; Sasse, A.M.; Rivard, C.L.; Pliakoni, E. Effect of Light Characteristics on the Sensory Properties of Red Lettuce (Lactuca sativa). Foods 2021, 10, 2660. [Google Scholar] [CrossRef]
- Bumgarner, N.R.; Miller, W.S.; Kleinhenz, M.D. Digital image analysis to supplement direct measures of lettuce biomass. HortTechnology 2012, 22, 547–555. [Google Scholar] [CrossRef]
- Mendoza-Tafolla, R.O.; Ontiveros-Capurata, R.E.; Juarez-Lopez, P.; Alia-Tejacal, I.; Lopez-Martinez, V.; Ruiz-Alvarez, O. Nitrogen and chlorophyll status in romaine lettuce using spectral indices from RGB digital images. Zemdirbyste 2021, 108, 79–86. [Google Scholar] [CrossRef]
- Lu, J.Y.; Chang, C.L.; Kuo, Y.F. Monitoring growth rate of lettuce using deep convolutional neural networks. In Proceedings of the 2019 ASABE Annual International Meeting, Boston, MA, USA, 7–10 July 2009. [Google Scholar]
- Hassim, S.A.; Chuah, J.H. Lettuce classification using convolutional neural network. Food Res. 2020, 4, 118–123. [Google Scholar] [CrossRef]
- Yang, R.; Wu, Z.; Fang, W.; Zhang, H.; Wang, W.; Fu, L.; Majeed, Y.; Li, R.; Cui, Y. Detection of abnormal hydroponic lettuce leaves based on image processing and machine learning. Inf. Process. Agric. 2021. [Google Scholar] [CrossRef]
- Jung, D.-H.; Park, S.H.; Han, X.Z.; Kim, H.-J. Image Processing Methods for Measurement of Lettuce Fresh Weight. J. Biosyst. Eng. 2015, 40, 89–93. [Google Scholar] [CrossRef] [Green Version]
- Ahsan, M.; Eshkabilov, S.; Cemek, B.; Küçüktopcu, E.; Lee, C.W.; Simsek, H. Deep Learning Models to Determine Nutrient Concentration in Hydroponically Grown Lettuce Cultivars (Lactuca sativa L.). Sustainability 2022, 14, 416. [Google Scholar] [CrossRef]
- Valenzuela, I.C.; Bandala, A.A.; Dadios, E.P. Assessment of Lettuce (Lactuta sativa) Crop Health Using Backpropagation Neural Network. JCIEA 2018, 2, 8–13. [Google Scholar]
- Ropelewska, E. Effect of boiling on classification performance of potatoes determined by computer vision. Eur. Food Res. Technol. 2021, 247, 807–817. [Google Scholar] [CrossRef]


| Photoperiod/PPFD | Casual | Elizium |
|---|---|---|
| 16/160 | 2094 ± 171 b 1 | 1714 ± 54 b |
| 16/240 | 1668 ± 18 ab | 1218 ± 76 a |
| 20/160 | 1481 ± 201 a | 1447 ± 29 ab |
| 20/240 | 1697 ± 168 ab | 1440 ± 170 ab |
| Predicted Class (%) | Actual Class | Average Accuracy (%) | TPR | FPR | Precision | F-Measure | ROC Area | PRC Area | |||
|---|---|---|---|---|---|---|---|---|---|---|---|
| 16/160 | 16/240 | 20/160 | 20/240 | ||||||||
| 100 | 0 | 0 | 0 | 16/160 | 98.75 | 1.000 | 0.000 | 1.000 | 1.000 | 1.000 | 1.000 |
| 0 | 100 | 0 | 0 | 16/240 | 1.000 | 0.000 | 1.000 | 1.000 | 1.000 | 1.000 | |
| 0 | 0 | 95 | 5 | 20/160 | 0.950 | 0.000 | 1.000 | 0.974 | 0.997 | 0.992 | |
| 0 | 0 | 0 | 100 | 20/240 | 1.000 | 0.017 | 0.952 | 0.976 | 0.998 | 0.995 | |
| Predicted Class (%) | Actual Class | Average Accuracy (%) | TPR | FPR | Precision | F-Measure | ROC Area | PRC Area | |||
|---|---|---|---|---|---|---|---|---|---|---|---|
| 16/160 | 16/240 | 20/160 | 20/240 | ||||||||
| 90 | 5 | 0 | 5 | 16/160 | 86.25 | 0.900 | 0.067 | 0.818 | 0.857 | 0.960 | 0.850 |
| 10 | 80 | 5 | 5 | 16/240 | 0.800 | 0.067 | 0.800 | 0.800 | 0.833 | 0.786 | |
| 10 | 5 | 85 | 0 | 20/160 | 0.850 | 0.017 | 0.944 | 0.895 | 0.967 | 0.951 | |
| 0 | 10 | 0 | 90 | 20/240 | 0.900 | 0.033 | 0.900 | 0.900 | 0.974 | 0.905 | |
Publisher’s Note: MDPI stays neutral with regard to jurisdictional claims in published maps and institutional affiliations. |
© 2022 by the authors. Licensee MDPI, Basel, Switzerland. This article is an open access article distributed under the terms and conditions of the Creative Commons Attribution (CC BY) license (https://creativecommons.org/licenses/by/4.0/).
Share and Cite
Matysiak, B.; Ropelewska, E.; Wrzodak, A.; Kowalski, A.; Kaniszewski, S. Yield and Quality of Romaine Lettuce at Different Daily Light Integral in an Indoor Controlled Environment. Agronomy 2022, 12, 1026. https://doi.org/10.3390/agronomy12051026
Matysiak B, Ropelewska E, Wrzodak A, Kowalski A, Kaniszewski S. Yield and Quality of Romaine Lettuce at Different Daily Light Integral in an Indoor Controlled Environment. Agronomy. 2022; 12(5):1026. https://doi.org/10.3390/agronomy12051026
Chicago/Turabian StyleMatysiak, Bożena, Ewa Ropelewska, Anna Wrzodak, Artur Kowalski, and Stanisław Kaniszewski. 2022. "Yield and Quality of Romaine Lettuce at Different Daily Light Integral in an Indoor Controlled Environment" Agronomy 12, no. 5: 1026. https://doi.org/10.3390/agronomy12051026
APA StyleMatysiak, B., Ropelewska, E., Wrzodak, A., Kowalski, A., & Kaniszewski, S. (2022). Yield and Quality of Romaine Lettuce at Different Daily Light Integral in an Indoor Controlled Environment. Agronomy, 12(5), 1026. https://doi.org/10.3390/agronomy12051026