Article

Potential Environmental Impacts of Peanut Using Water Footprint Assessment: A Case Study in Georgia

by
Raveendranpillai Deepa
1,
Aavudai Anandhi
1,2,*,
Nathaniel O. Bailey
1,2,
Johnny M. Grace III
1,3,
Omolola C. Betiku
1 and
James J. Muchovej
1
1
College of Agriculture and Food Sciences, Tallahassee, FL 32307, USA
2
Biological System Engineering, College of Agriculture and Food Sciences, Tallahassee, FL 32307, USA
3
Center for Forest Watershed Research, Southern Research Station, 1740 S. Martin Luther King Jr. Blvd., Perry-Paige Bldg., Suite 303 North, Tallahassee, FL 32307, USA
*
Author to whom correspondence should be addressed.
Agronomy 2022, 12(4), 930; https://doi.org/10.3390/agronomy12040930
Submission received: 28 January 2022 / Revised: 28 March 2022 / Accepted: 31 March 2022 / Published: 13 April 2022

Abstract

:
The recent decade has witnessed an increase in irrigated acreage in the southeast United States due to the shift in cropping patterns, climatic conditions, and water availability. Peanut, a major legume crop cultivated in Georgia, Southeast United States, has been a staple food in the American household. Regardless of its significant contribution to the global production of peanuts (fourth largest), studies related to local or regional scale water consumption in peanut production and its significant environmental impacts are scarce. Therefore, the present research contributes to the water footprint of peanut crops in eight counties of Georgia and its potential ecological impacts. The impact categories relative to water consumption (water depletion—green and blue water scarcity) and pesticide use (water degradation—potential freshwater ecotoxicity) using crop-specific characterization factors are estimated for the period 2007 to 2017 at the mid-point level. These impacts are transformed into damages to the area of protection in terms of ecosystem quality at the end-point level. This is the first county-wise quantification of the water footprint and its impact assessment using ISO 14046 framework in the southeast United States. The results suggest inter-county differences in water consumption of crops with higher blue water requirements than green and grey water. According to the water footprint analysis of the peanut crop conducted in this study, additional irrigation is recommended in eight Georgia counties. The mid-point level impact assessment owing to water consumption and pesticide application reveals that the potential freshwater ecotoxicity impacts at the planting and growing stages are higher for chemicals with high characterization factors regardless of lower pesticide application rates. Multiple regression analysis indicates blue water, yield, precipitation, maximum surface temperature, and growing degree days are the potential factors influencing freshwater ecotoxicity impacts. Accordingly, a possible impact pathway of freshwater ecotoxicity connecting the inventory flows and the ecosystem quality is defined. This analysis is helpful in the comparative environmental impact assessments for other major crops in Georgia and aids in water resource management decisions. The results from the study could be of great relevance to the southeast United States, as well as other regions with similar climatic zones and land use patterns. The assessment of water use impacts relative to resource availability can assist farmers in determining the timing and layout of crop planting.

1. Introduction

In simple terms, a water crisis is the scarcity of freshwater resources resulting in not being able to meet the demand of the environment of a given area. The World Economic Forum has identified the water crisis as among the top five risks for the last eight years. In the recent Global Risk Report, the water crisis remains nested under a cluster of other high impact risks, such as extreme weather events, natural disasters, anthropogenic environmental disasters, biodiversity loss, and ecosystem collapse [1]. The competition for water across different societal sectors depends on climatic changes and population growth [2,3]. This creates a necessity to reconsider water management planning and decisions in water-limited regions [4,5]. The southeast United States (SEUS) is such a region, which experiences moderate to severe drought [6] or even flash droughts [7] in recent decades. The recurring short and long-term drought conditions considerably shifted the rainfed agriculture region to irrigated acreage to mitigate drought risk [7]. Peanut, a legume crop used as a food, confectionery snack, and oil, is a primary crop cultivated in Georgia in the SEUS. Even though it is a drought-tolerant crop, the developmental stages of peanut vary according to the rainfall variability. As peanuts are compliant with other types of food [8], more crop production is required to meet the emerging markets [9]. Peanut cultivation, like other crops, has undergone greater fertilizer use and mechanization, creating environmental impacts, such as water use, land use, and ecotoxicity. There is a dearth of information on peanut water consumption and its effect on the environment. Therefore, there is a need for systematic assessment of the water consumption of peanut crops and their environmental impacts.
Water Foot Print (WFP), analogous to ecological footprints, is an indicator of human appropriation of freshwater consumption and determines the impacts on water resources by individuals, communities, businesses, and production processes [10,11,12,13,14,15,16,17,18]. A first global estimate of crop water consumption based on the “virtual water” concept was performed by [13]. Later on, numerous studies [12,13,14,15] have emerged based on this concept that links the water crisis and the water intense agricultural production [16]. The Water Footprint Network (WFN), an international learning community that shares knowledge, tools, and innovations to implement the sustainable use of water resources published a concept called Water Footprint Assessment (WFA). It is a volumetric method that categorizes water into three types: green (the precipitation that does not contribute to runoff), blue (surface and groundwater resources for irrigation), and grey (water required to assimilate the pollutants based on natural background concentrations and existing ambient water quality standards). The classification of water into three categories paved the way for more specific agricultural crop production studies eventually. The authors of [13] explored the three-component WFP for the first time for an agricultural crop, cotton globally. In the subsequent years, numerous studies have quantified the water consumption of various crop categories, namely beverages [17], bio-energy crops [17,19,20], and contexts: future WFP of crops [14,21,22,23]. However, the volumetric WFA has been critiqued for environmental and socio-economic value [24]. The validity of WFPA to make comparative assessments for products and services in water-scarce regions and assessing its local impacts has been a topic of few studies [25,26]. Therefore, WFPA based on water scarcity indicators [18,19,25] for assessing the local impacts of water use on ecosystems [25,26], human health [25,27], and freshwater resources [28] emerged. Therefore, the development of WFPA from global to local impacts [14,29] motivated the International Standards Organization (ISO) to devise an impact-oriented WFPA ISO 14046, based on Life Cycle Assessment (LCA) principles [30]. The environmental impacts of agricultural productions can be assessed in their entirety with Life Cycle Assessment (LCA), a widely accepted tool for environmental impact assessment.
ISO 14046 is a stand-alone WFP impact assessment method that uses a range of potential water-related impact categories, such as water scarcity (consumption of water), eutrophication, toxicity, and acidification (degradation of water). Water degradation involves aquatic toxicity impacts that can affect multiple trophic levels in the ecosystem, compromising human water consumption and ecosystem biodiversity [24]. Pesticide emissions from agricultural fields constitute a significant source of ecotoxicity. Still, only a few studies [31,32,33,34] have considered the ecotoxicity impact assessment studies due to the lack of site-specific inventory data sets. In the United States, the most studied crops for ecotoxicity impacts are cotton and corn, both being high-input crops [35] from the major agricultural zone, the Midwest. Even though the southeast United States (SEUS) is also a prime contributor to agricultural production, studies on environmental impact assessment of crops are scarce in the region. Hence, the focus of this study is on the water use impacts of peanut production, a major crop cultivated in the coastal plains of Georgia in the SEUS, and its associated ecotoxicity impacts.
The objectives of this research are (i) to quantify the crop water use of the peanut crop in Georgia, in the SEUS for the selected counties based on the WFP assessment manual and (ii) to estimate the potential freshwater ecotoxicity impacts using ISO 14046. The significance of the present study lies in the use of crop-specific (county-wise) and region-specific characterization factors for water depletion and water degradation impact assessments. This forms the basis for local or regional scale sustainability assessment of water resources. Therefore, the contributions from the current research may assist water policymakers in enhancing water use efficiency (green and blue water), thereby contributing to the priorities of UN Sustainable Development Goals (SDG 6, “Clean Water and Sanitation” [36]. In a broader sense, the findings from the study are expected to improve the understanding of the water-food-ecosystem nexus for a sustainable future.

2. Materials and Methods

The study region is Georgia (Figure 1), close to the Gulf of Mexico, and also the Atlantic Ocean in the SEUS. According to Koppen, the climate varies from oceanic in northeast Georgia to humid subtropical in the rest of the state. Summers are humid and hot, with average high temperatures ranging from 90 to 100 °F [37,38]. The average annual rainfall is 1267 mm [39]. The primary crops grown in the state are peanut, cotton, and maize. The soil is predominantly well-drained, productive, and moderately pervious [30]. The peanut crop (Arachis hypogea L.) selected for the present study is a drought-tolerant legume. Even though peanut is drought-tolerant, its nutrient uptake, yield, nitrogen fixation, and water use efficiency depend on rainfall variability.

2.1. Defining Goal and Scope (Phase 1)

The present study adopts the impact assessment methodology from ISO 14046. For the water consumption inventory data, WFP assessment by [11] is followed. The ISO 14046 consists of four stages: (i) specifying goal and scope, (ii) accounting/inventory phase, (iii) sustainability assessment, and (iv) response formulation/interpretation phase. It is assumed that once water is lost, it is not re-used in the cycle.
The main goal of the present work is to quantify the county-wise peanut water use and the corresponding environmental impacts. The target audience of this goal are farmers, and water resource managers at both the local and national levels.

2.2. Scope (System Boundary)

The scope consists of setting the system boundaries for WFP assessment. The system boundary specifies the unit processes involved in the study [40]. In other words, it tells what to include and what to exclude [11] in the analysis, setting spatio-temporal boundaries and where to truncate the analysis along a supply chain. For the present study, the system boundary is the “cultivation stage”, which consists of planting, growing, and harvesting the crop. The agricultural regions in southwest Georgia were chosen for the analysis (Figure 1). The assessment was performed daily during the crop growing period. A cumulative estimate for the crop growing period for a given year was used.

2.3. Functional Unit

The functional unit gives the measure of a reference unit in which the outputs are reported. For the present study, the functional unit is m3/ton.

2.4. WFP Accounting/Inventory Phase (Phase 2)

WFP accounting consists of the quantification of freshwater use and the mapping of three different types of water, namely blue, green, and grey. The quantification involves the methodology, data sets used, and the software used to implement the methods, as detailed in Figure 2. Here, the green, blue, and grey components are considered for the analysis. The WFP inventory is based on the functional unit. The daily effective rainfall is computed based on the USDA soil conservation method [38], as it is one of the most popular methods for estimating effective rainfall in agricultural water management [41,42].
P e =   P × ( 4.17 0.2 × P 4.17 ) ,       P < 8.3   mm 4.17 + 0.1 × P ,             P 8.3   mm
where Pe is the effective rainfall, and P is the total daily precipitation in mm.

2.4.1. Crop Water Requirement

The Crop Water Requirement (CWR) is taken as the amount of water required to compensate for evapotranspiration loss from the field (ETc, mm/day, [11]. The potential evapotranspiration data (ET0) is taken from the United States Geological Survey, calculated based on the Penman–Monteith equation [43,44,45]. The CWR is given by
E T c ( C W R ) = K c × E T 0
where Kc is the crop coefficient, ET0 is the reference evapotranspiration, and ETc is the crop evapotranspiration. The peanut crop coefficients for the different stages of its growth are taken from the FAO website, as given in Table S1. The effect of crop transpiration and soil evaporation are integrated while characterizing the crop coefficients.

2.4.2. Blue, Green, and Grey Water Footprint

CWR can be divided into green evapotranspiration (ETg) and blue evapotranspiration (ETb). Green water use is defined as the effective rainwater required to evaporate from the soil surface, including transpiration from crops and the water incorporated in the product. If the Pe is larger than CWR, the ETg is equal to CWR, since a crop uses as much water as possible but never exceeds the water required for optimal plant growth [46]. Therefore,
E T g = min ( C W R ,   P e   )
where ETg is the green evapotranspiration, Pe is the effective rainfall, and CWR is the crop water use. The total green water use during the growing period is computed by
C W U g = 10 × d = 1 l g p E T g
where CWUg is the green crop water use and lgp is the length of the growing period. The conversion factor is 10 for the green evapotranspiration from mm to m3/ha/day.
The corresponding water footprint is given by
W F P g = C W U g Y
where WFPg is the green water footprint, and Y is the yield of the crop in tonnes/hectare. The yield data is obtained from the USDA/NASS website.
The blue water evapotranspiration is the sum of water required to evaporate from the soil surface, transpiration by plants, and the water incorporated in plants. It is calculated by
E T b = m a x ( 0 , C W R P e )
where ETb is blue evapotranspiration, CWR is the crop water requirement, and Pe is the effective rainfall. The total blue water use is estimated by summing up the blue water evapotranspiration over the growing period.
C W U b = 10 × d = 1 l g p E T b
where CWUb is the blue crop water use, and ETb is the blue water evapotranspiration. The blue water footprint is as follows:
W F P b = C W U b Y
The grey WFP is calculated as
W F g r e y = ( α × A R ) / ( C m a x C n a t   ) Y
where W F g r e y is the grey WFP of the crop, AR is the quantity of nitrogen applied in kghm−2, C m a x is the maximum allowable concentration of nitrogen in ground-water (https://www.epa.gov/ground-water-and-drinking-water/national-primary-drinking-water-regulations, accessed on 20 February 2021), C n a t   is the natural concentration of nitrogen, and Y is the crop yield. The natural concentration of nitrogen is usually taken as zero, and α is the leaching-runoff fraction of nitrogen fertilizer. Finally, the total crop water use is calculated as the sum of green, blue, and grey components.

2.5. Sustainability Assessment/Impact Assessment (Phase 3)

2.5.1. Water Scarcity Impact Assessments (Mid-Point)

The WFP impact assessment was performed to estimate the potential environmental impacts related to water depletion and water degradation using ISO 14046. The procedure for the impact assessment is to multiply the inventory with the local characterization factor for the corresponding impact category [47]. This study considers the impact assessment at the mid-point and end-point levels. The mid-point impact categories water scarcity/depletion (blue, green) and water degradation (freshwater ecotoxicity) are selected for the study. The crop-specific blue water scarcity characterization factor for peanut crops, 6.87 m3 world-eq/m3, for the United States [48], was utilized for the present study. The crop-specific green water characterization factor is estimated based on [49].

2.5.2. Freshwater Ecotoxicity Impact Assessments (Mid-Point)

The freshwater ecotoxicity impact assessment is estimated based on the environmental fate and transport model theory [50,51]. It is formulated as:
F E P ( C T U e c o ) = m i   ( Kg ) × C F i   ( C T U e c o / Kg )
mi is the mass of the substance (pesticide) emitted to compartment I, and CFi is the characterization factor for the potential toxicity impacts; mi is approximated using Yang, 2013. CFi is taken from the Tool for the Reduction and Assessment of Chemical and other environmental Impacts Version 2.1 (TRACI 2.1), USEPA [52].

2.5.3. Effects on Ecosystem Quality (End-Point)

The end-point impact assessments for the inventory flows (water consumption) were assessed based on [25]. The freshwater consumption impacts on ecosystem quality are expressed as units of a possibly disappeared fraction of the species, assessing the vulnerability of vascular plant species biodiversity. It is estimated as the fraction of water-limited net-primary production as a proxy for the number of vascular plant species [53]. Vascular plants provide primary food products to the food chain and are a vital factor in the functioning of an ecosystem. Therefore, an ecosystem damage factor (region-specific) is selected from [25] for the Georgia region to translate the mid-point impacts to end-point impacts. The trade-off between human appropriation of green water over natural ecosystems has a dominant role in losing ecosystem service values. Therefore, to account for the end-point impacts of green water, it is reasonable to assume that the reallocation of green water will also finally damage the ecosystem. Therefore, the same characterization factor for ecosystem damage for blue water obtained from [25] was utilized in the study. Finally, the effect of freshwater ecotoxicity on ecosystem quality was quantified according to [54]. This method represents one-half of the species affected by chronic stress due to ecotoxicity resulting in the damage of the species. The framework for the ISO 14046 impact assessment is depicted in Figure 2.

2.6. Statistical Analysis

Previous studies have shown that pesticide usage varies across regions due to climate and soil properties [55,56]. A multi-regression analysis is performed using R software to check the influential factors for the potential environmental impacts due to pesticide usage. Peanut crop yield, nutrient, and water efficiency is dependent on climate variables.

Selection of Independent Variables

The independent variables are selected based on a meta-analysis from the previously published literature (Figure 12 and Tables A1, B1, C1 and C2 in [57]). It is noticed from the literature that the rate of pesticide leaching and runoff that contributes to ecotoxicity may vary concerning local topography, climate, and soil conditions [33,50,58,59,60] (and the references therein). The interannual variability in rainfall and temperature can lead to extremes, such as flood/drought. The dependence of drought on peanut phenology by [61,62] is used for selecting PDSI (Palmer Drought Severity Index (PDSI) as an independent variable. The base temperature is taken as 13 °C (56 °F). The effect of temperature on peanut yield, denoted by Growing Degree Days (GDD), is selected based on [63] (revised version 2018). Moreover, the increase in temperature can affect pesticides’ chemical and physical properties and change the fate and transport in the soil [64,65]. Drought reduces soil moisture, altering the PH level [59]. At the same time, excess rainfall may lead to the spread of epidemics in crops [66]. These can, in turn, lead to a decrease in crop yield. Accordingly, water consumption (blue, green), yield, precipitation, surface maximum and minimum temperature, growing degree days, soil moisture, and Palmer Drought Severity Index (PDSI) are employed as independent variables for the analysis, and potential freshwater ecotoxicity impacts is considered as a dependent variable.

2.7. Data Sets Used

This study evaluated the environmental impacts of peanut crop cultivation in the southeast United States, Georgia, from 2007 to 2017. The counties selected for the analysis include Seminole, Irwin, Early, Miller, Mitchell, Worth, and Colquitt, which are the major peanut-producing counties (Figure 1). This study utilized both primary (from USDA surveys, fertilizer application) and secondary data sets (precipitation, potential evapotranspiration, harvested acreage, yield, pesticide application, land cover) utilizing GIS software ArcGIS Pro for data processing. The crop coefficients for the different crop stages are from Food and Agricultural Organization [43], as provided in Table S1. The crop planting dates are taken from the USDA [67], and the peanut yield data (Table S2) from the USDA NASS website. The county-wise fertilizer application for peanut crops is obtained from the USDA NASS website. The green water impact assessments are quantified based on the National Land-cover database [68,69]. For freshwater ecotoxicity assessments, the USDA state-wise pesticide data for peanut were available only for the years 2013 and 2018. In order to make the temporal scale of analysis uniform, the United States Geological Survey (USGS) state-wide pesticide data [70,71] are used. The pesticide’s chemical properties are taken from https://pubchem.ncbi.nlm.nih.gov/. accessed on 4 March 2021.

3. Results

3.1. WFP of Peanut Crop from 2007 to 2017

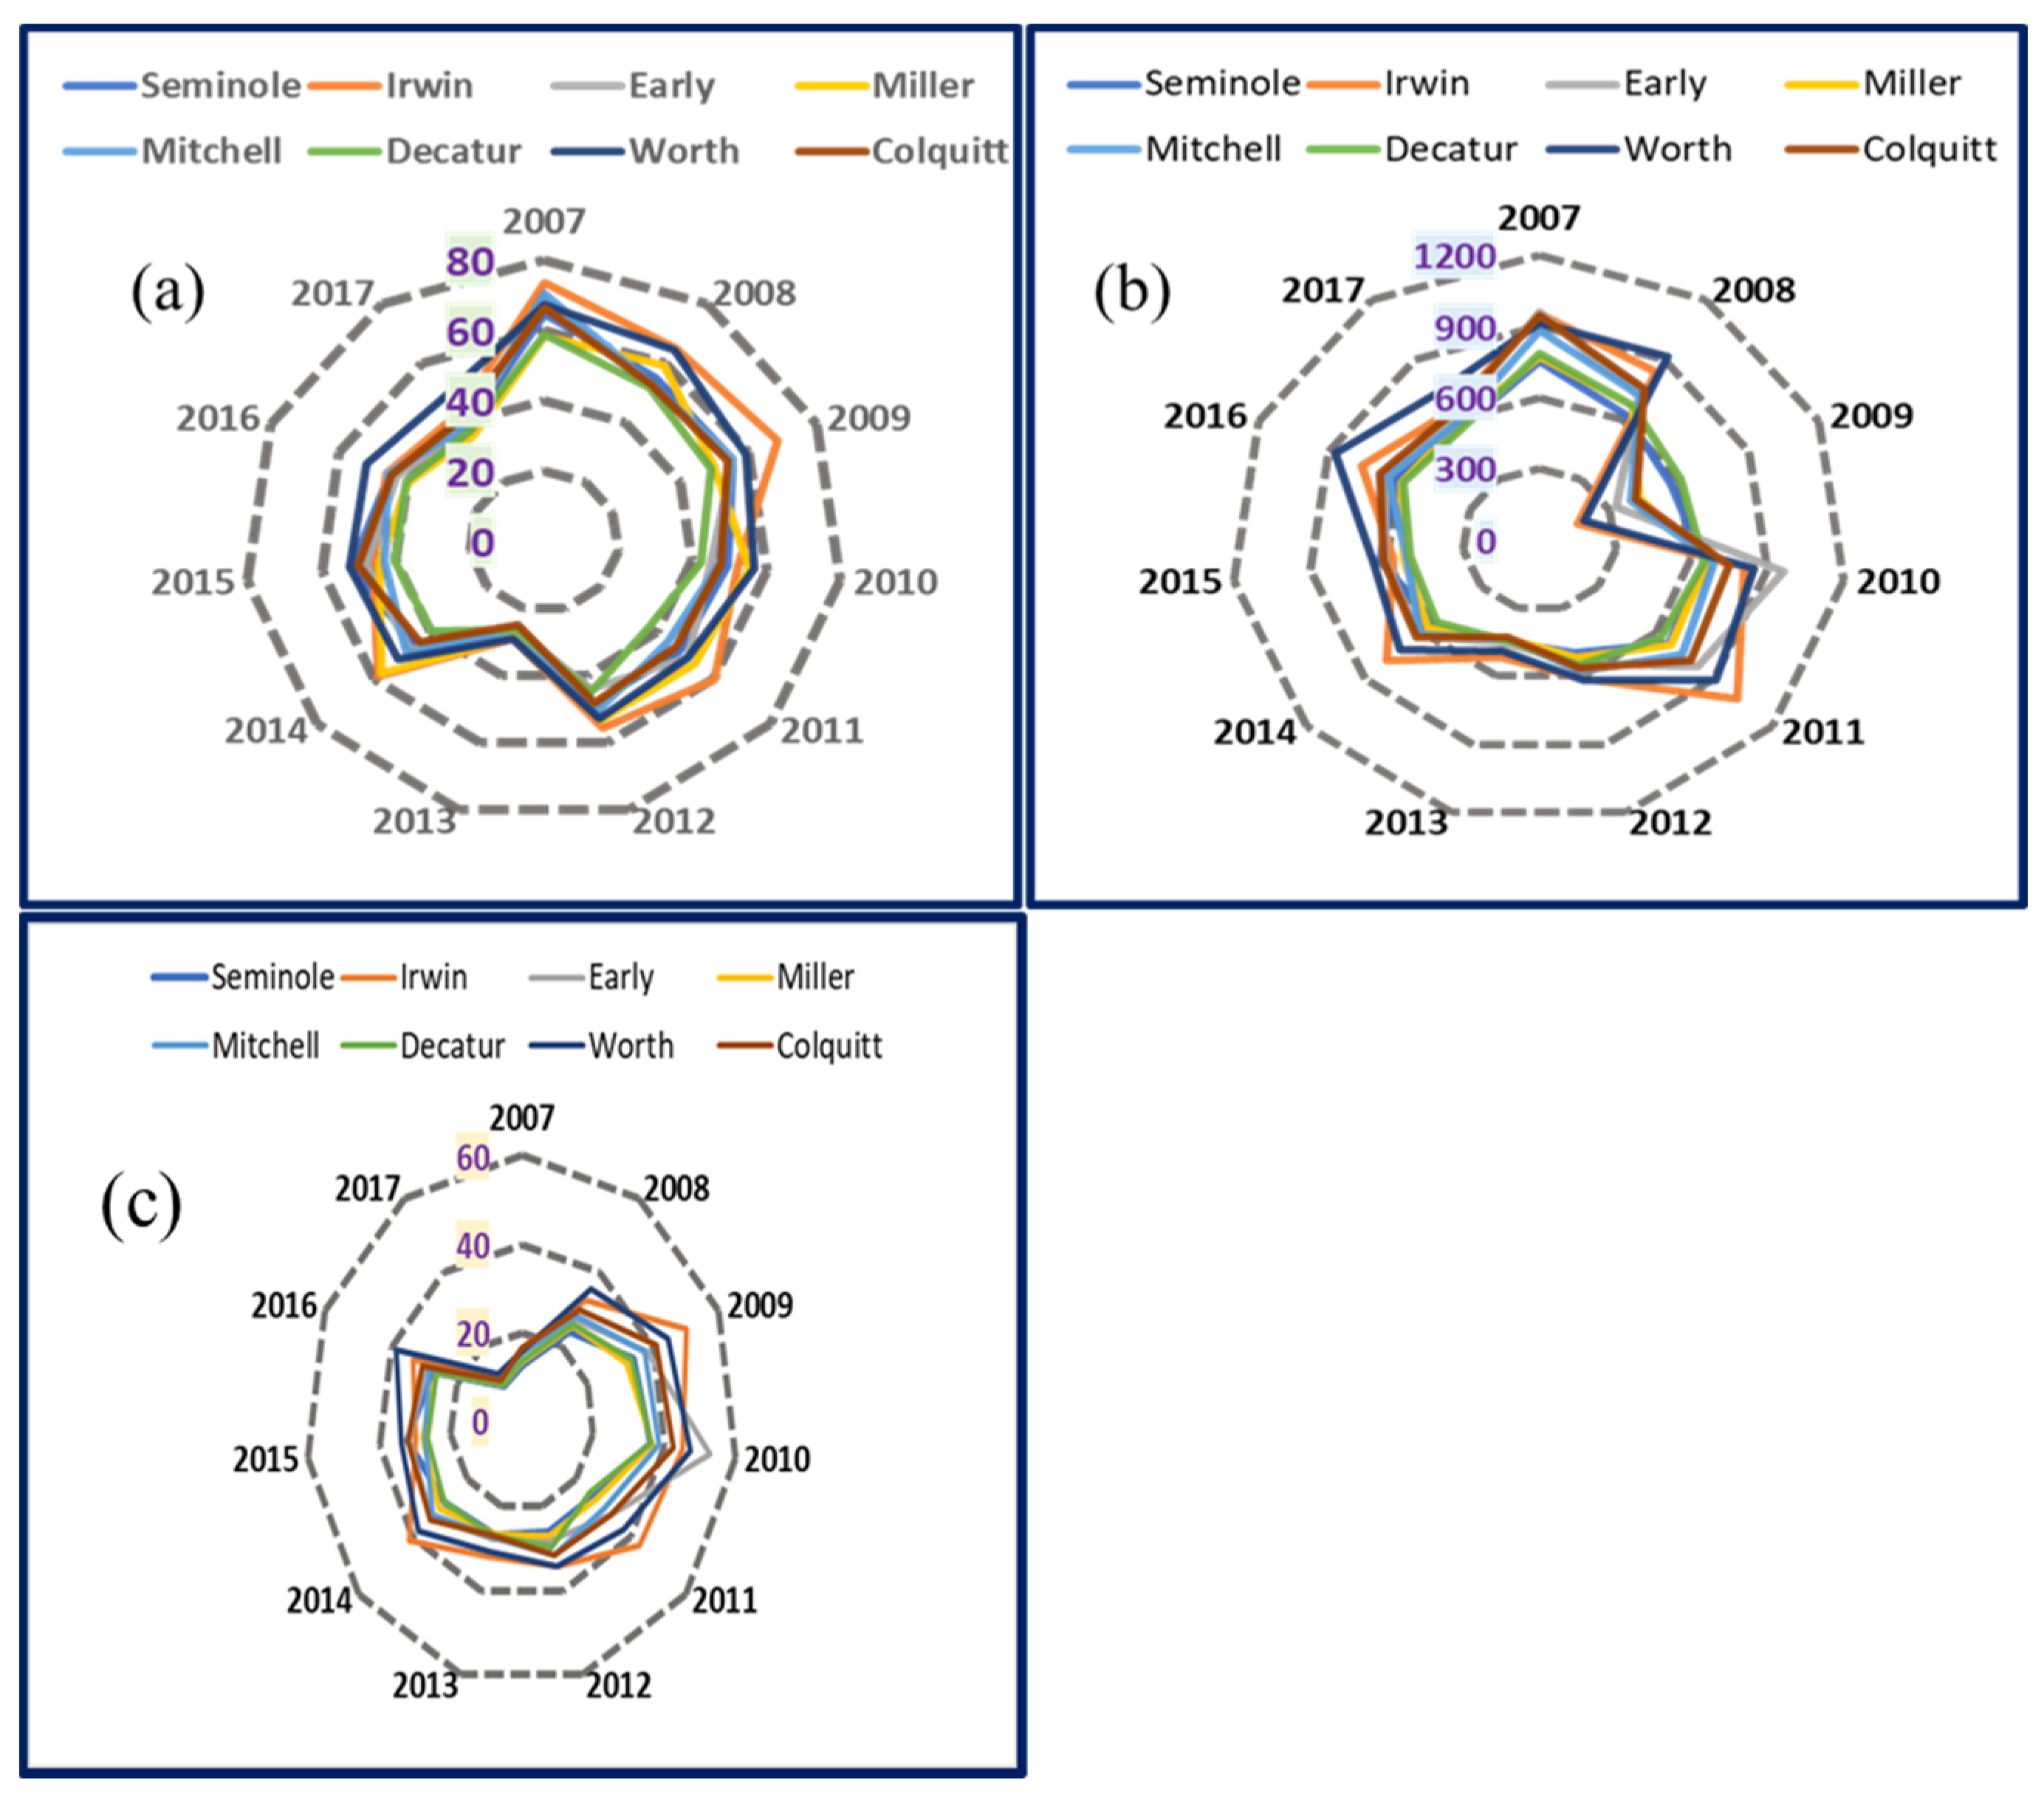
The WFP values are represented in Figure 3 by means of box and whisker plots and line plots. Irwin, Early, and Worth counties show higher dispersion in blue WFP values, Seminole and Decatur counties for green WFP, and Seminole, Irwin, and Colquitt for grey WFP (Figure 3a). Among the three components, green WFP has the least spread, describing less variability throughout the years. Considering the temporal variability (line plots) in Figure 3b, one can notice that blue WFP has higher values between 2009 and 2012. While for green WFP, Irwin County show variations in 2009 and 2011 (Figure 3c), and for grey WFP, during 2007, 2009, and 2011 (Figure 3d), respectively. Green WFP values also show a similar pattern, but the magnitudes are much less compared to blue WFP. The years from 2015 to 2017 witnessed less variation in green WFP. The grey WFP values depict a decrease from 2007 to 2017 except the Irwin County, with higher values in 2011 (591 m3/ton). Colquitt county represents higher values (923 m3/ton) in 2007 compared to all others. This is due to the higher amount of nitrogen fertilizer application (~34 Kg/ha) in contrast to all other counties. The majority of the counties witness a dip in WFP values during 2013. This can be attributed due to the higher yield in 2013 compared to other years. The average WFP values for the counties are provided in Table A1. Irwin (1103 m3/ton), Early (105 m3/ton), and Worth (1113 m3/ton) counties represent higher values of blue water consumption. The blue WFP values for all counties decreased from 2007 to 2009 and later increased with a drastic decrease in 2012 and 2013.
The county-wise mean and standard deviation of the three components of WFP from 2007 to 2017 are given in Table A1. It can be concluded that there are inter-county differences in water consumption during peanut crop production. These differences in water consumption cause local/regional impacts to the water resources over the region according to the resource availability. Accordingly, the quantification of water consumption impacts (blue and green water) is described in the following section. Grey WFP is involved in water degradation through the impact category eutrophication. Since the focus is on freshwater ecotoxicity as described in Section 2, the two components, green and blue, are considered in the remaining sections of this paper.

3.2. Blue and Green Water Impacts

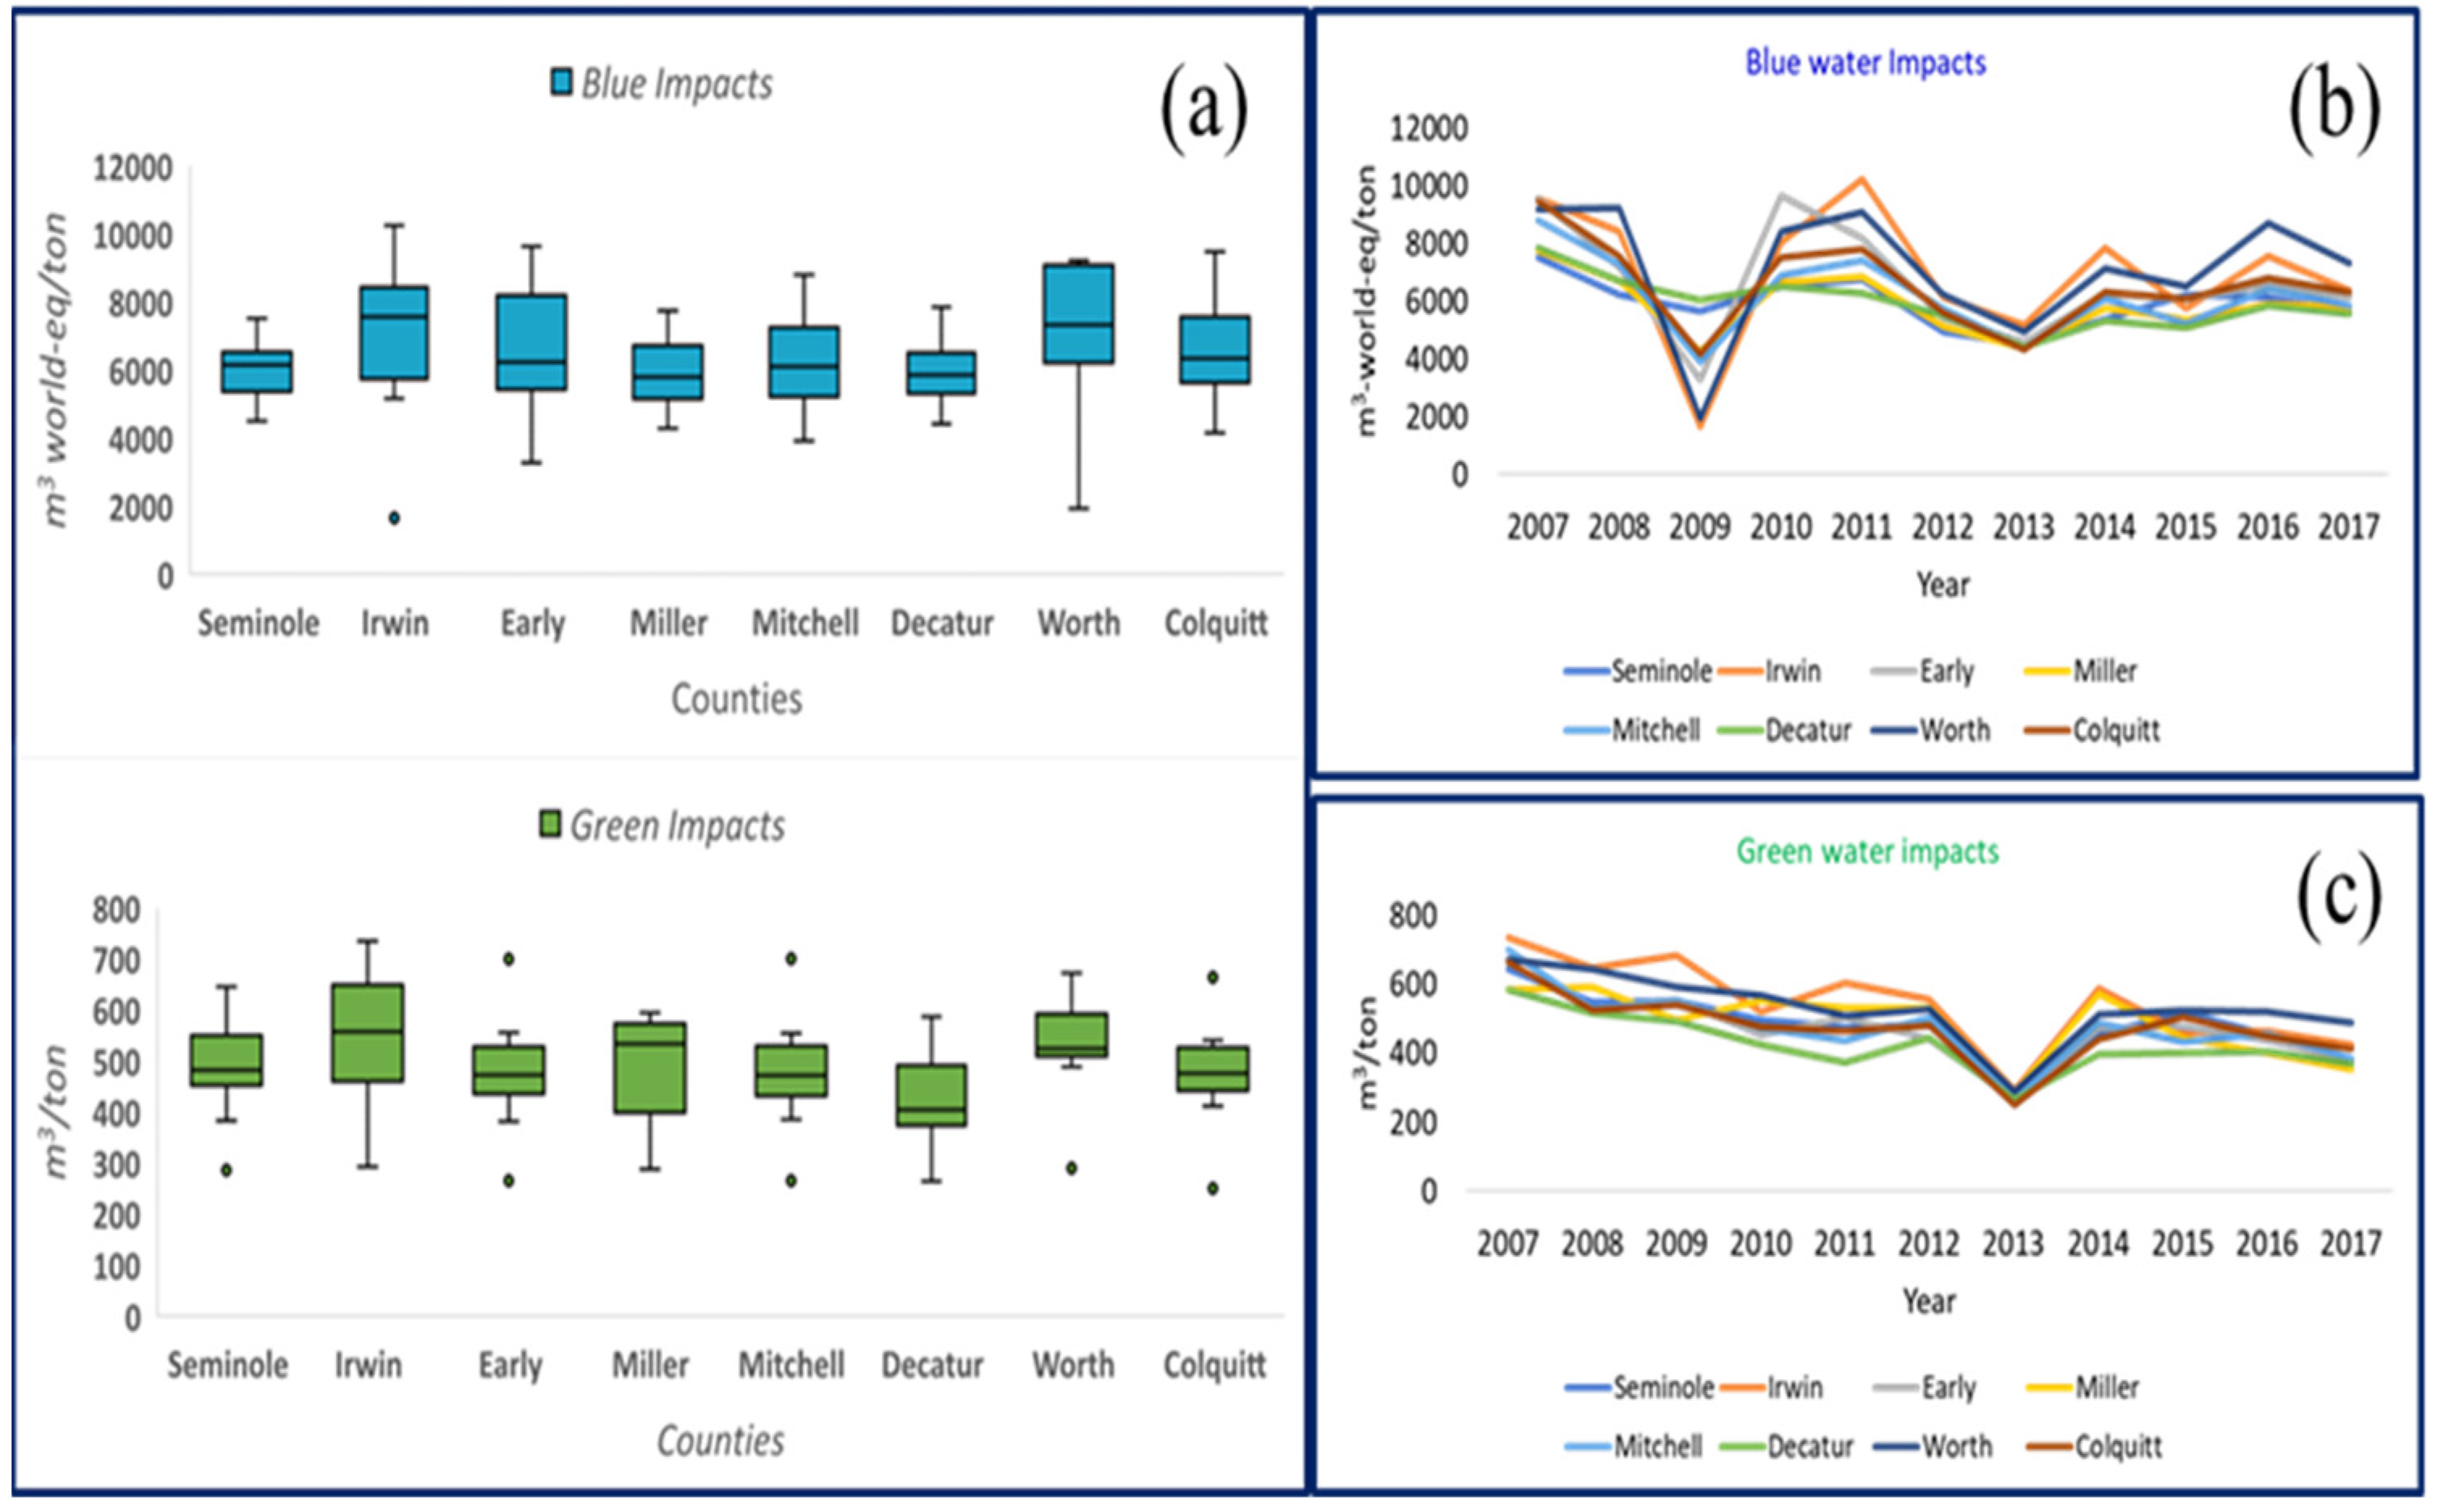
The potential blue water scarcity impacts are characterized as box and whisker plots and line plots in Figure 4. The dispersion of blue water impacts is higher in Irwin (5168 to 10,246 m3-world-eq/ton), Early (3278 to 9585 m3-world-eq/ton), and Worth (1927 to 9179 m3-world-eq/ton) counties (Figure 4a). This is inconsistent with the blue water consumption for the corresponding counties. Even though the same crop-specific characterization factor is used to assess the impacts, there are inter-county differences. It points to the spatial variability in water resources differentiating regions of higher water scarcity from lower scarcity regions. Therefore, these impacts can be called blue water scarcity footprints, as specified by ISO 14046. Considering the green water impacts, a larger spread of values is observed for Irwin (292 to 734 m3/ton) and Miller (287 to 594 m3/ton) counties. These impacts are dependent on the crop’s demand for water and the green water availability (for other ecosystem services, crops, and grasslands). On the other hand, the temporal variability (Figure 4b) depicts very low impacts for blue water during 2009, which means peanut water consumption was less than its availability, indicating lower impacts over the region. Irwin county has maximum impacts (9569 m3/ton in 2007), with the minimum (1656 m3/ton) for Decatur (Figure 4b). The temporal variability of green water impacts (Figure 4c) demonstrates that the majority of the counties show higher values of impacts, so is the case with green water requirements. The green water availability is the product of the two fractions, crop evapotranspiration to effective rainfall and the harvested area to pervious area in the region. The crop evapotranspiration is the net water use of a specific crop. The crop water demand is sourced from either green or blue water. Therefore, the study examines the total evapotranspiration to the effective rainfall in a crop, a green water resource, to derive the demand. This fraction was much less in 2007, ranging from 12% to 27%. The harvested acreage of peanut was also higher in 2007, which drives the reduction of green water availability leading to higher impacts. This area-based analysis may give an insight into the potential land-use changes and green water availability. Moreover, the evaluation of water appropriation for crop production and other ecosystem services can provide an insight into the water-food-ecosystem nexus.

3.3. Potential Freshwater Ecotoxicity Impacts: Emissions to Water

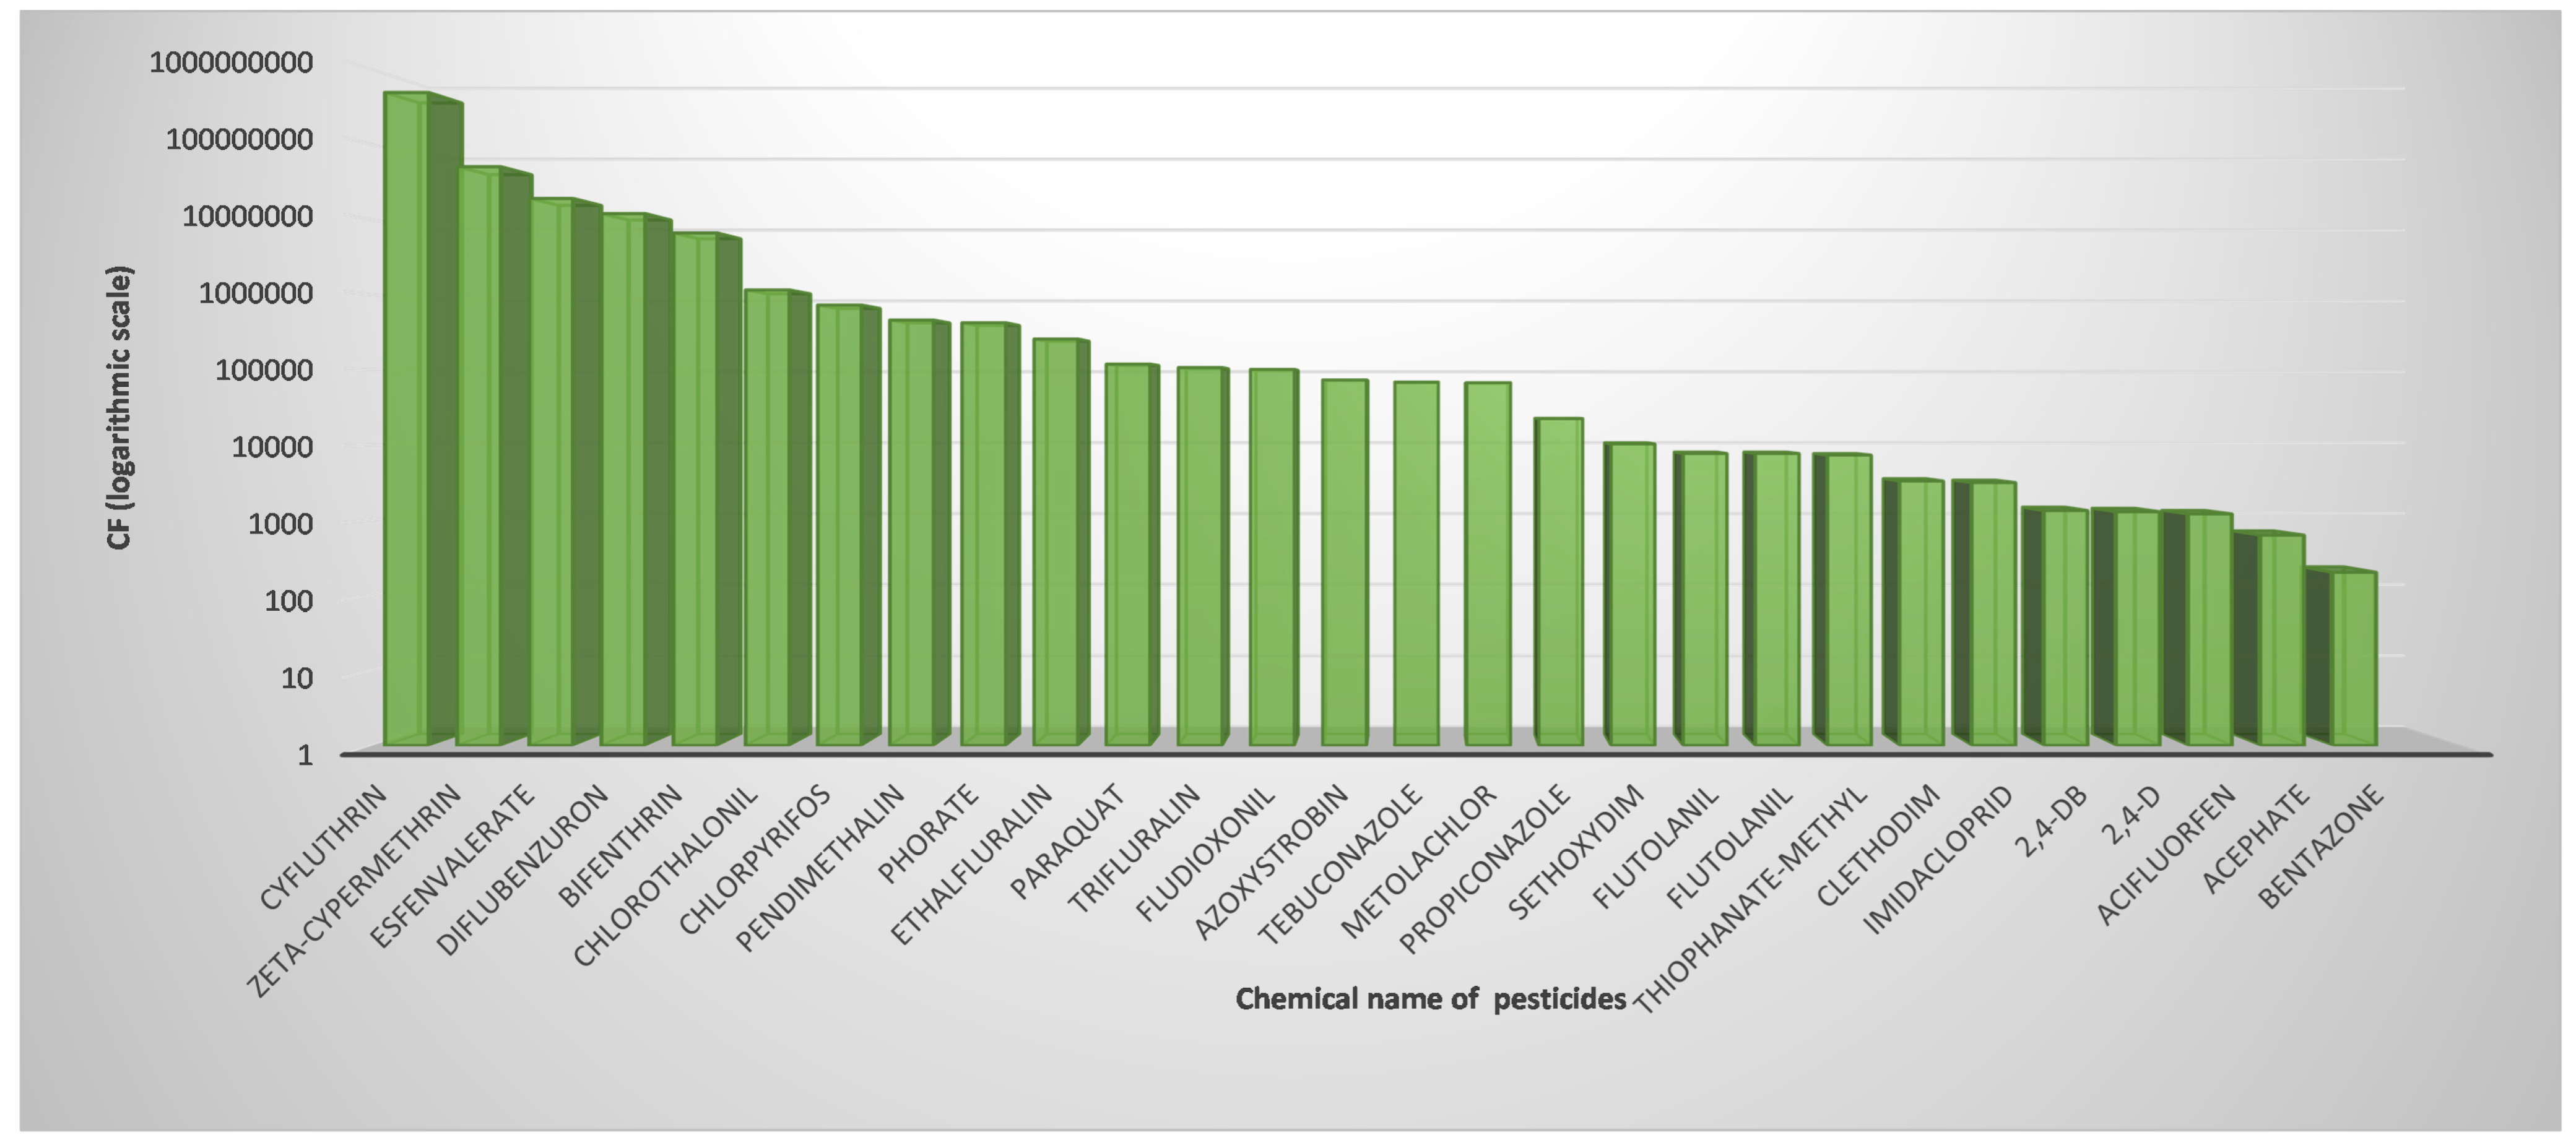
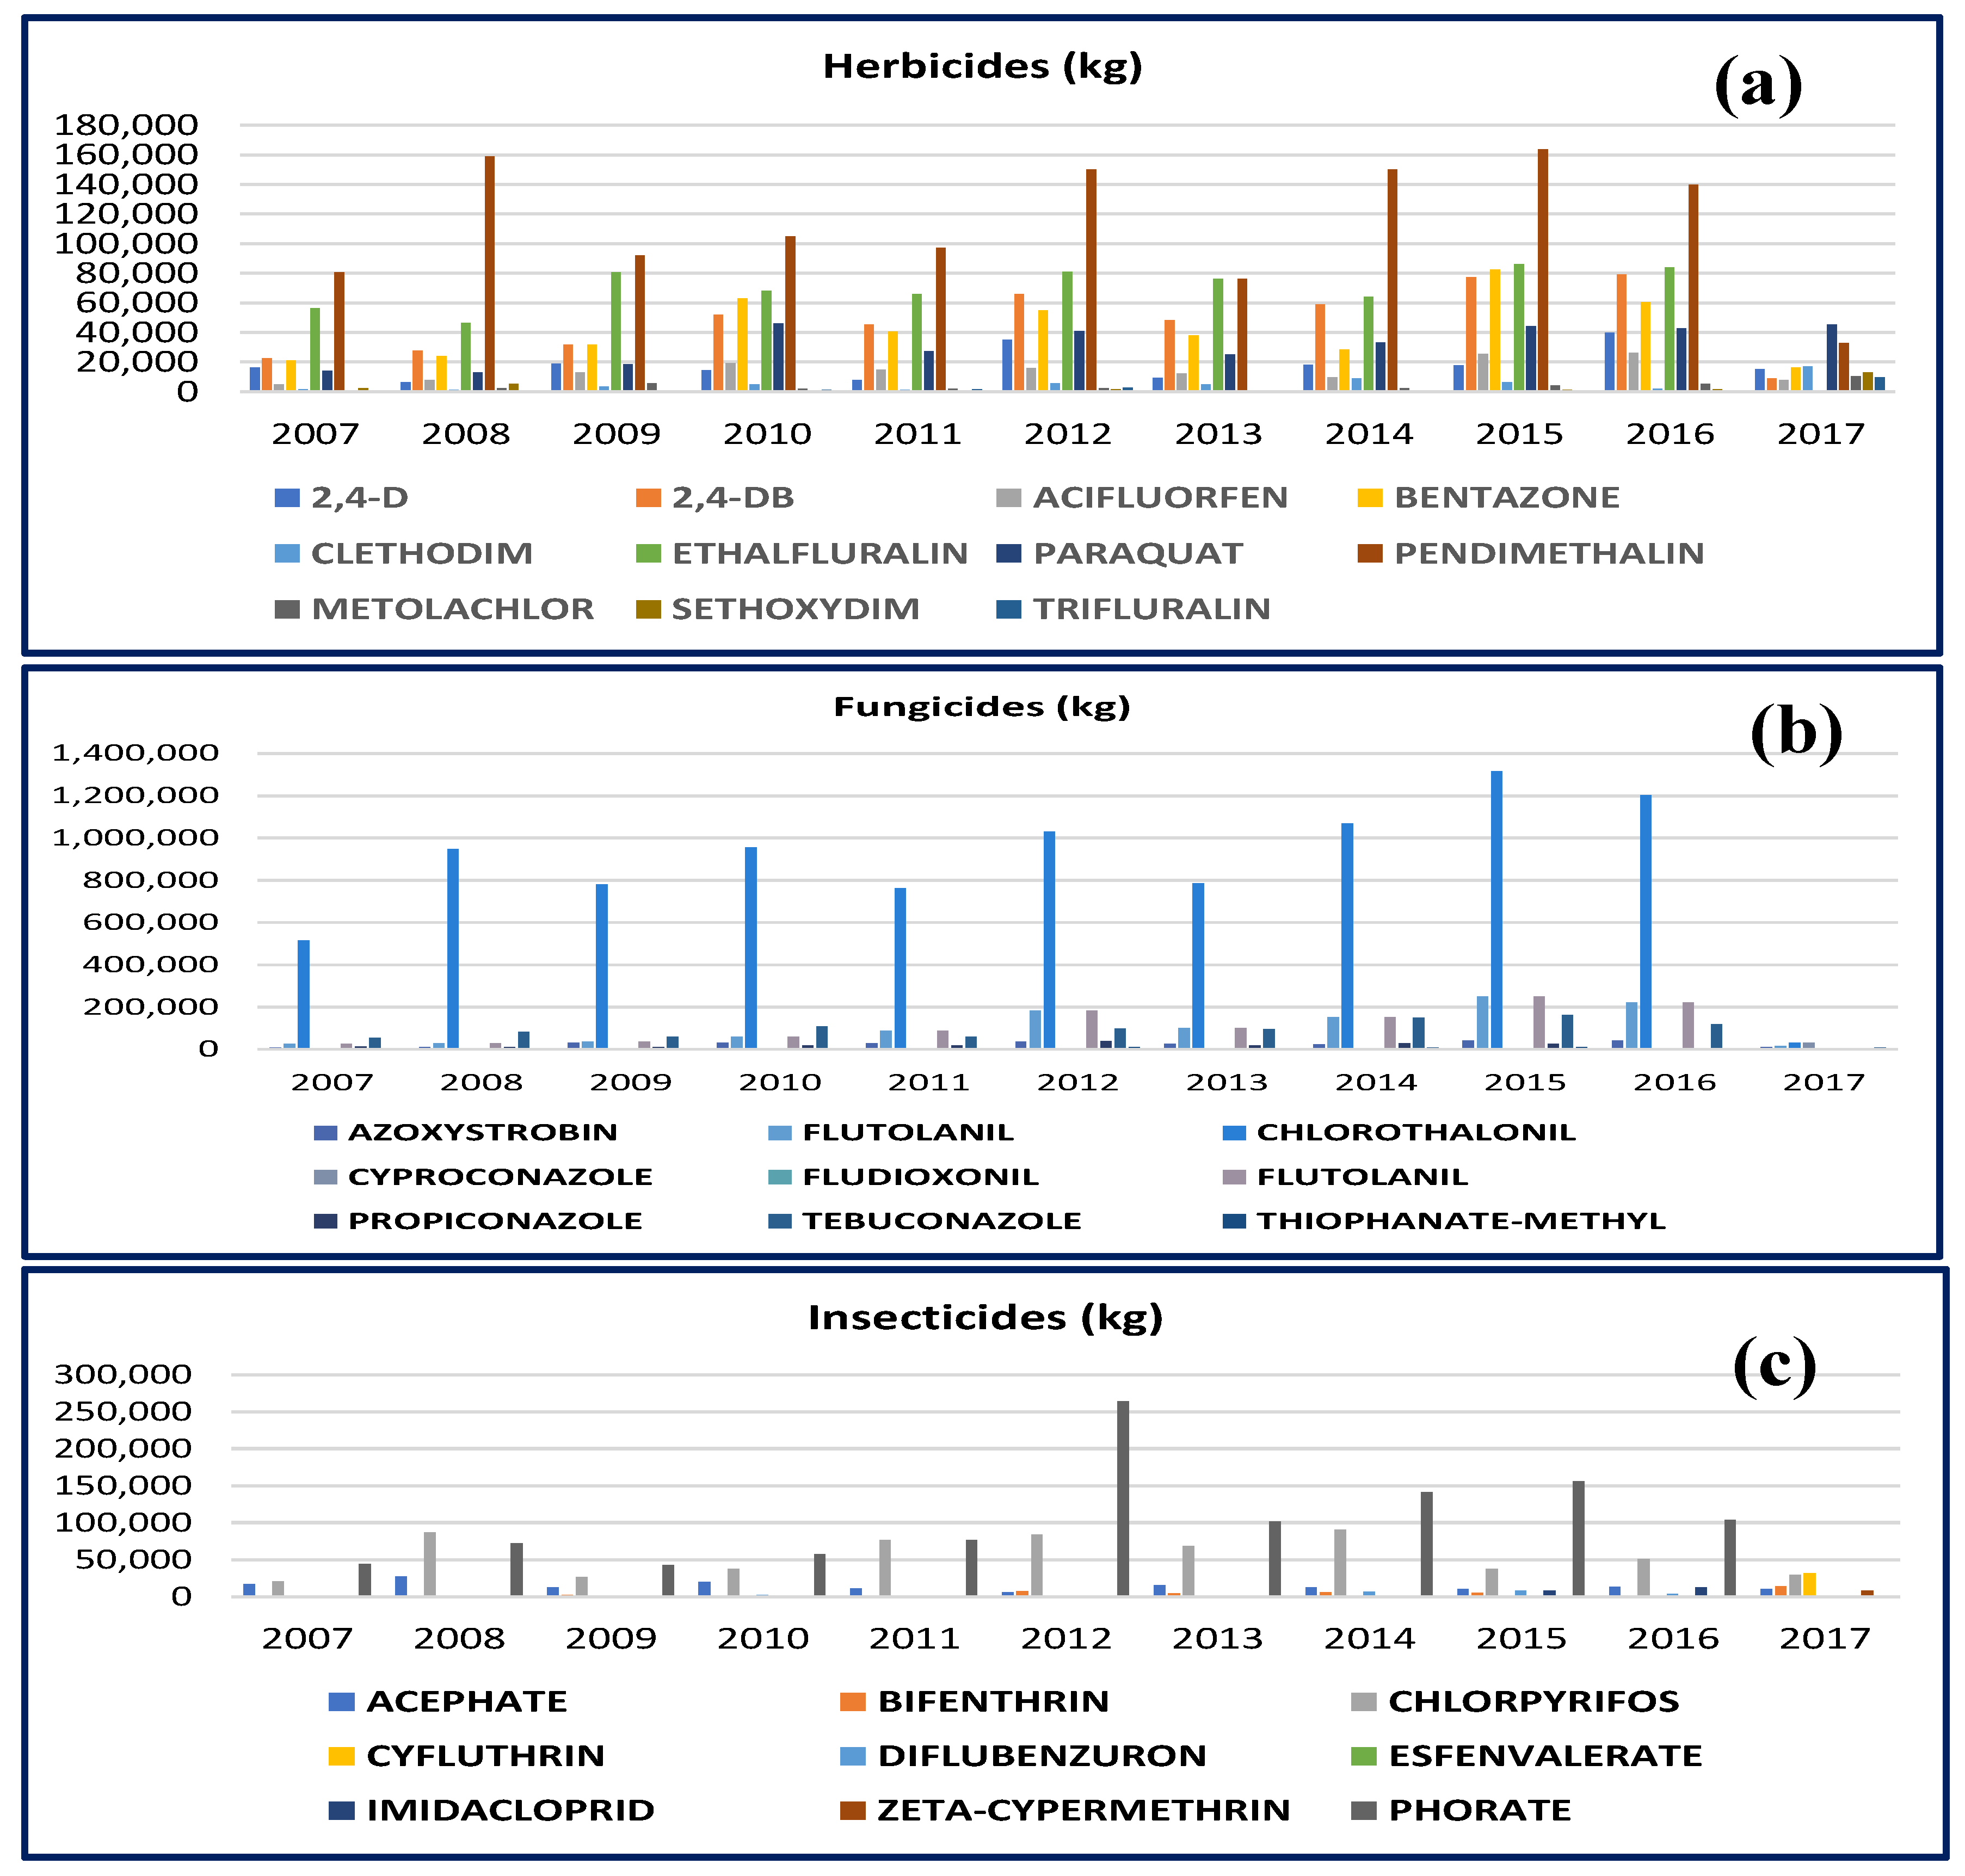
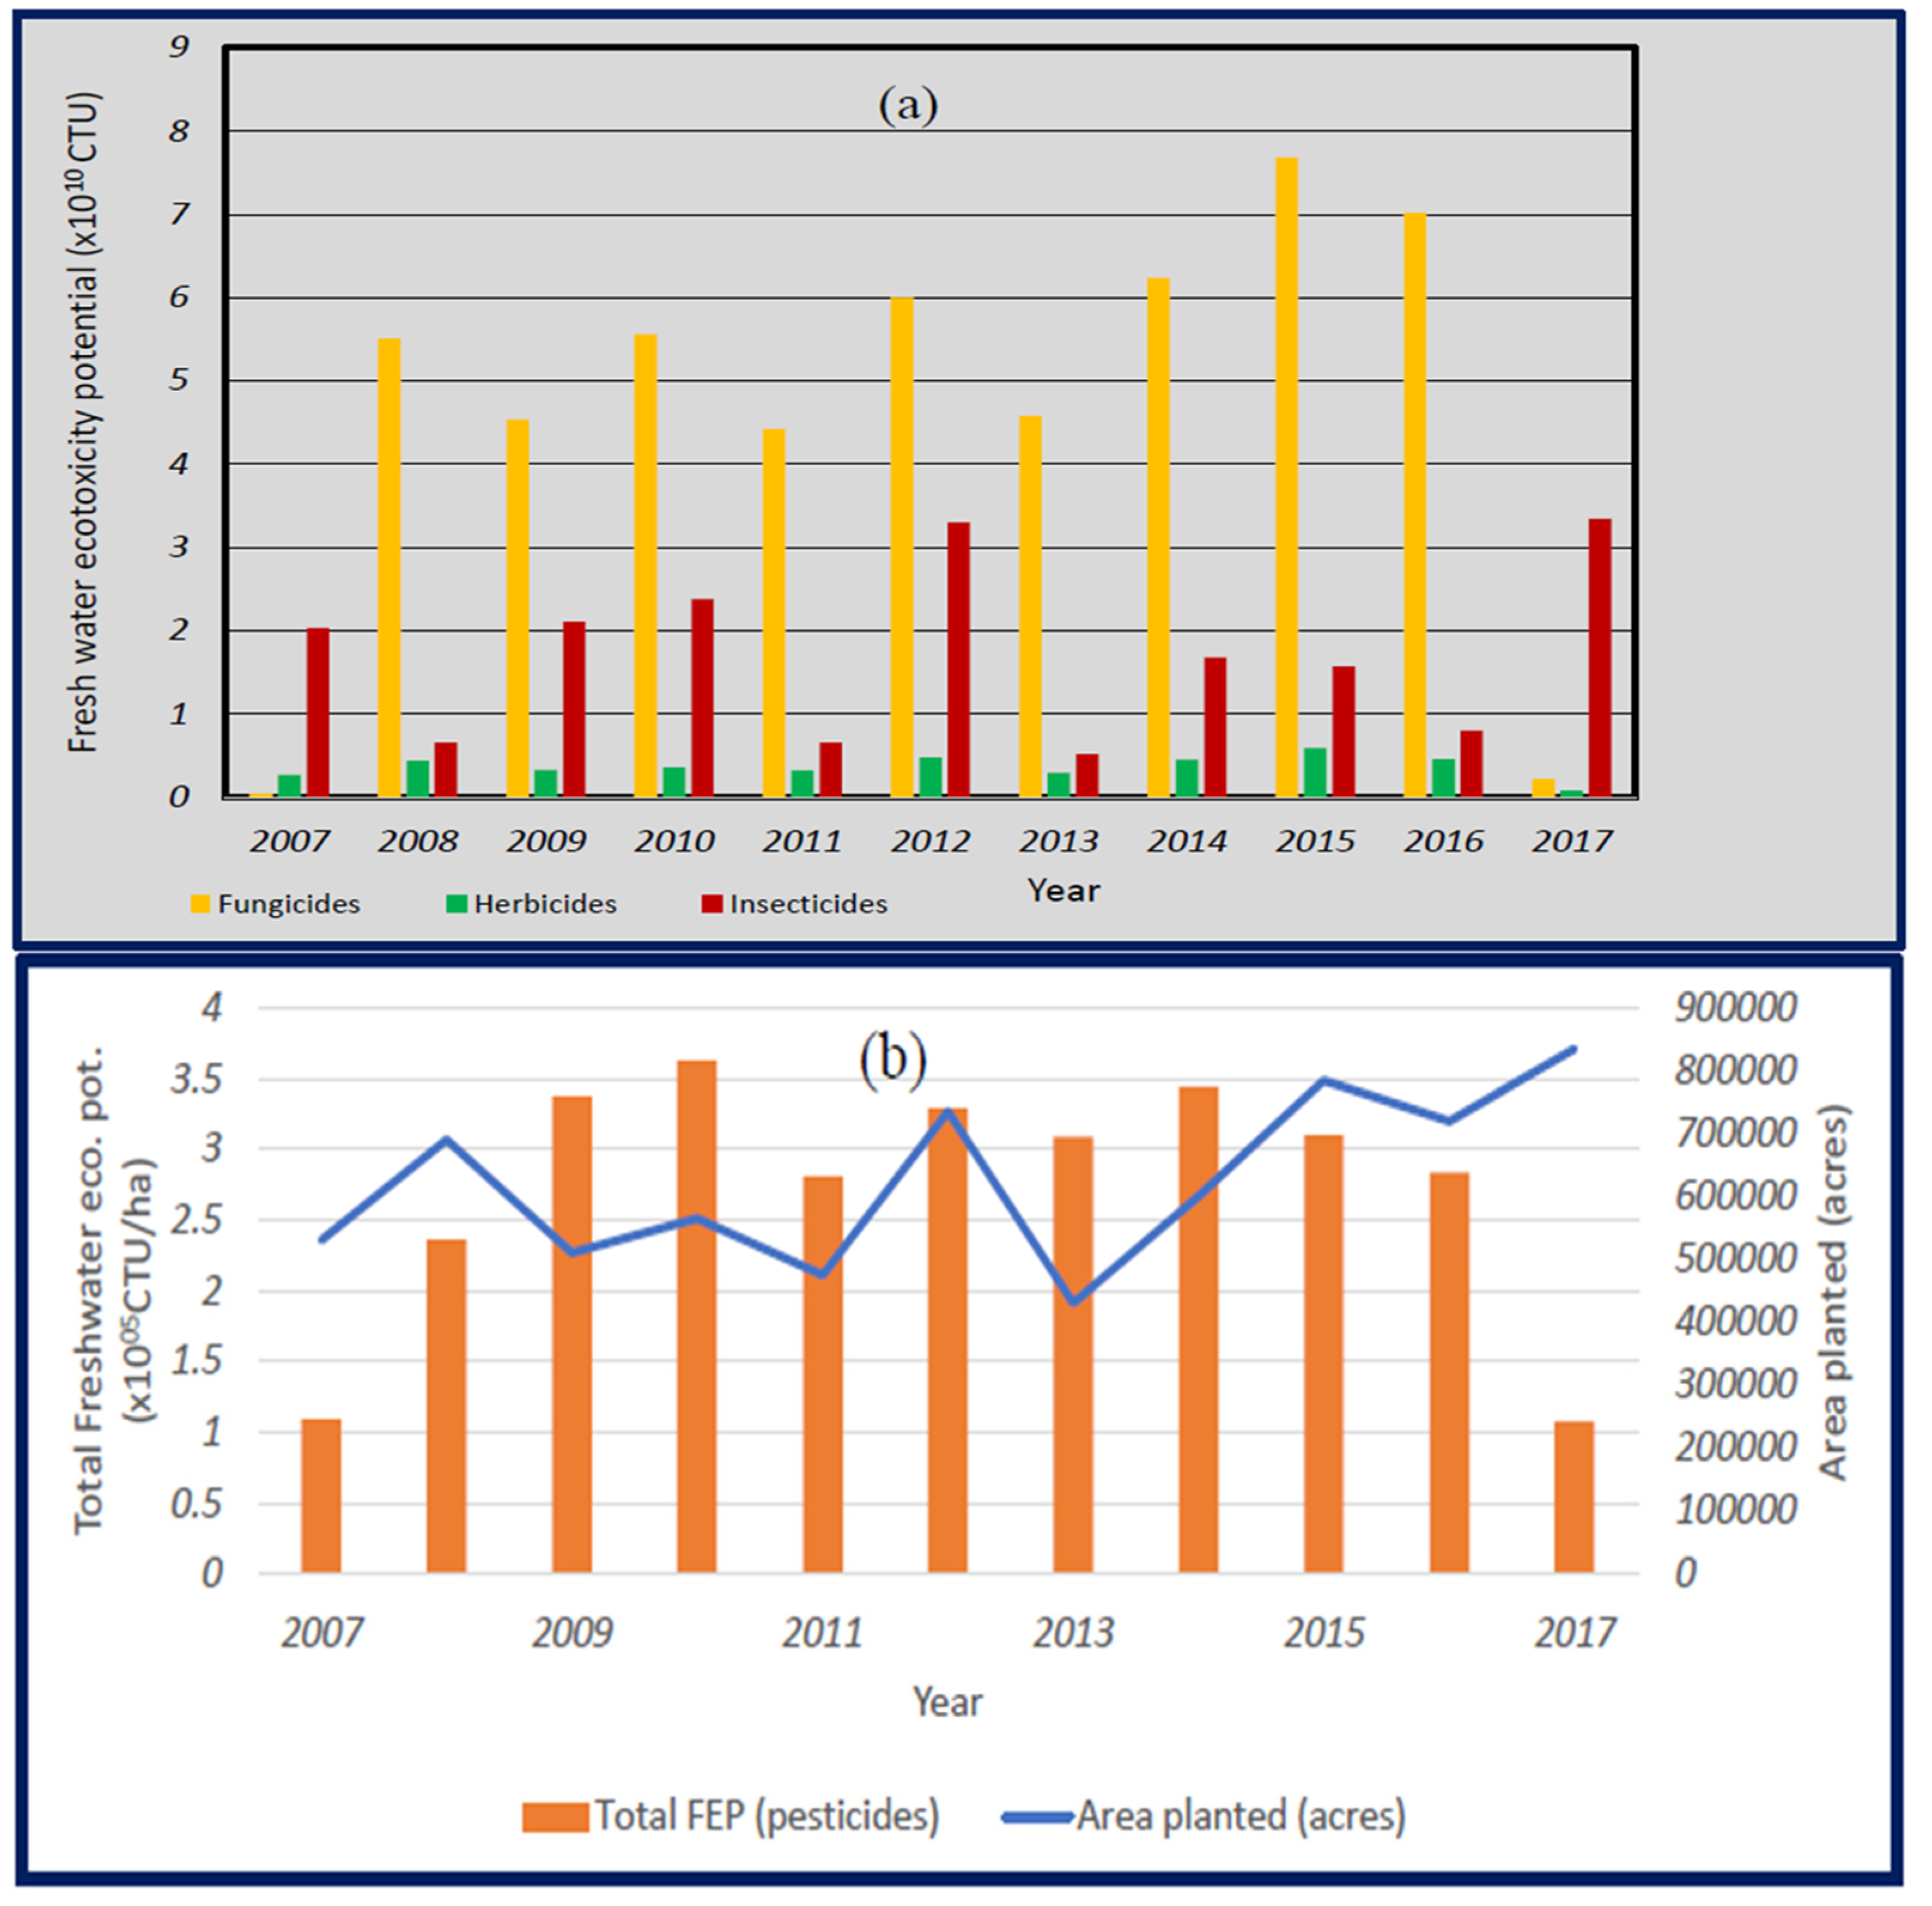
Freshwater ecotoxicity potentials for the years 2007 to 2017 for Georgia are depicted in Figure 5. The impacts are categorized into three groups of pesticides: fungicides, herbicides, and insecticides. The variability in the impacts of fungicides is more prominent than in other categories. The ecotoxicity impact due to fungicides was very low in 2007 and 2017. In order to determine the reason for the decrease, the amount of pesticide application (fungicide) is given in Figure A2a in the Appendix A. It is found that the three fungicides’, flutolanil, chlorothalonil, and fludioxonil, application were less in 2007 and 2017 compared to the other years. The amount of these fungicides in other years is higher. These chemicals are less soluble in water (Table 1), while it is soluble in fat-like solvents or fatty tissues of organisms. Therefore, bioaccumulation of these chemicals is high, resulting in higher fate factors (higher characterization factors, Figure A1), which, in turn, results in higher freshwater ecotoxicity impacts.
The herbicide ecotoxicity impacts are less in almost all the years. Herbicides, such as Bentazone, Ethalfluralin, and Pendimethalin (Figure A2b), are applied in higher amounts. Bentazone is highly soluble in water with a half-life of less than 24 h. It is susceptible to runoff and has a very low Octanol–Carbon partition coefficient (https://iris.epa.gov/static/pdfs/0134tr.pdf access on 4 October 2021) While the other herbicides, ethalfluralin and pendimethalin, are less soluble in water (Table 1), but highly soluble in organic solvents. On the other hand, they have high Koc values, indicating their high adsorption to soil particles with a very high half-life in soil (https://nepis.epa.gov/Exe/ZyPDF.cgi/91024KRK.PDF?Dockey=91024KRK.PDF accessed on 4 October 2021). Pendimethalin is influenced by runoff and photolysis. Ethalfluralin is more susceptible to photolytic degradation and erosion. The low water solubility of Ethalfluralin and Pendimethalin leads to low fate and effect factors and, consequently, less impacts.
In contrast, insecticides show alternate increasing and decreasing values for the impacts. The potential impacts from the insecticides demonstrate higher impacts in some years. Chlorpyrifos and Phorate fungicides are applied in higher amounts, as evident from Figure A2c in the Appendix A. Chlorpyrifos is less soluble in water (Table 1) and binds to soil, which influences its mobility (soil sorption coefficient is high), implying erosion or leaching can directly pave the way to water.
Moreover, the air–water partition coefficient of Chlorpyrifos (4.2 × 10⁻⁶ atm.m3/mol, http://npic.orst.edu/factsheets/archive/chlorptech.html accessed on 4 October 2021) is less, with volatilization from water with a half-life of 21–28 days. The impacts are dependent on the half-life of the chemical in water. Phorate undergoes rapid hydrolysis when in contact with water through run-off. It has less residence time compared to Chlorpyrifos (Figure S1d). The total potential freshwater ecotoxicity impacts from pesticides are depicted in Figure 5b. The variation of impacts directly follows the area of the crop planted.

3.4. End-Point Impacts

The blue and green water consumption end-point impacts are depicted in Figure 6. Irwin (1024 m2 year/ton), Worth (921 m2 year/ton), and Early (963 m2 year/ton) counties show maximum values for blue end-point impacts (Figure 6b). It is found that the potential ecosystem impacts are higher for lower yields. On the contrary, the blue water consumption is higher for lower yields.
The end-point impacts for green water flows are not direct when compared with blue water. For example, blue water has a direct influence on river flows, groundwater levels, and interconnected ecosystems [25,28,72]. Green water is re-allocated from supporting the biodiversity to human food supply due to the land-use management strategies [72]. As we have seen in the previous section, the green water impacts are less than blue impacts; the same pattern follows in the end-point impact assessment, as shown in Figure 6a. The green water end-point impacts are also dependent on yield, inferring better management practices in green water utilization for optimal yields. Moreover, the regional or local availability of green water also has a bearing on the green water impacts.
The potential freshwater ecotoxicity impacts (Figure 6c) are quantified based on Jolliet, 2003. It assumes that one-half of the potentially affected fraction of the ecosystem species will disappear due to severe impacts. The potential freshwater ecotoxicity impacts depend on the green water consumption and peanut yield (p-value: 0.001827).

3.5. Sensitivity Analysis

Sensitivity analysis (SA) is a systematic approach for estimating the major contributions from the inventory flow to the outputs in a WFP accounting/Life-Cycle Impact assessment. It is the last phase of WFP/LCA, also known as the interpretation/response phase. SA helps to understand the quality of input data used in the analysis. Uncertainties in the output results arise from the methodical choices and data sets (primary, secondary, or tertiary). In the present study, the sensitivity analysis for freshwater ecotoxicity is performed by implementing 5% variation in the inventory flows (water consumption, pesticide use) following [73]. It is found that the variation in water consumption gives rise to a 5% change at the mid-point and end-point levels, while for ecotoxicity impacts, 5% variation in pesticide usage leads to enormous changes in the impacts. This may be due to the higher characterization factor (chemical properties of the pesticides) for typical chemicals and the amount of application (e.g., Chlorothalonil, Cyfluthrin, and Tebuconazole). Sensitivity analysis is repeated by applying 1% change in the input, yielding still higher values in some years that vary with the amount of pesticide application. Furthermore, one cannot assume that the increase/decrease in pesticide input varies linearly with the chemical’s exposure concentration in freshwater ecosystems. Therefore, for reducing the pesticide impacts, the substances with less impact (low characterization factor) can be effective as the original is recommended. In addition, the best management practices in pesticide application and irrigation can influence the fate factor of the pesticide in soil, which, in turn, affects the range of ecotoxicity impacts.
A multiple regression model is used to identify the potential predictor variables for freshwater ecotoxicity potential of peanut crop production. Water consumption (blue, green), yield, precipitation, surface maximum and minimum temperature, growing degree days, soil moisture, and Palmer Drought Severity Index are employed as independent variables and freshwater ecotoxicity potential as the dependent variable. It is observed that yield (p-value: 0.000184), precipitation (p-value: 0.000727), and surface maximum temperature (p-value: 0.000253) are highly significant. While blue WFP and growing degree days are significant at the 95% significance level, soil moisture and surface minimum temperature are significant at the 90% level. The details are provided in Table 2.

4. Discussion

The present research deals with a regionalized impact-oriented WFP analysis using ISO 14046. Accordingly, it requires “WFP” qualifiers to specify the impact category at the mid-point level, such as water scarcity and water ecotoxicity footprint. The inventory flows of water consumption are estimated based on the WFP assessment manual [11]. The following section discusses the results from the analysis, its limitations, and future perspectives.

4.1. Water Consumption of Peanut Crop

The county-wise WFP values of peanut crops indicate higher values for blue water requirements compared to green and grey values. Compared to the previous global WFP of crop production by [74], the blue WFP values are higher in the present study. In their analysis for the time period 1996–2005, the average green WFP (1272 m3/ton for Georgia) was higher than the blue WFP (150 m3/ton) and grey (182 m3/ton). In our study, it is found that the blue WFP is higher than the grey WFP. This can be attributed to the recent decades witnessing an enormous increase (2000%) in irrigated acreage in the State of Georgia [75]. Southwest Georgia is the heavily irrigated region in Georgia. On the other hand, irrigation influences the rate of evapotranspiration, altering precipitation patterns and the range of surface temperatures at different spatial scales [75,76]. The discrepancies in the WFP values also depend on the time considered for the analysis, pointing towards the climate variability over the region. The yield dependency of WFP is clearly identifiable for the year 2013 (yield was higher in 2013) in all of the counties. Variations in WFP can also be subject to the differences in climate variables, specifically rainfall in the counties from 2007 to 2017. Consequently, the WFP is dependent on the effective rainfall and its estimation procedure over a geographical region. The nitrogen fertilizer application decreases from 2007 to 2017, leading to low grey WFP values. The peanut residues after harvest contain a considerable amount of nitrogen that is available for the next crop. The range of peanut biomass accumulation in the southeast [77] is found to be 2900 to 4460 lb/acre (41 to 71 lb N/acre). However, at the same time, the release of nitrogen from peanut is very fast after harvest [77,78]. Therefore, for the next peanut planting period, the amount of nitrogen application will vary, influencing the grey WFP.

4.2. Water Consumption Impacts—Blue and Green Water Scarcity

The ecological fitness of a region is maintained by environmental sustainability that is dependent on water security. This can be measured based on indicators such as green and blue water scarcity [11,79,80], and the Falkenmark index [81]. The water consumption impacts are basically measured using the amount of water available over an area to maintain the ecosystems known as environmental water requirements. This assumption is based on the sustainable use of resources from environmental, societal, and economic perspectives. The blue water consumption impacts, namely blue water scarcity, are quantified based on crop-specific characterization factors rather than national values. Ref. [48] reiterated that using crop-specific characterization factors helps better understand crop exposure to water scarcity risks. The characterization factors for peanut crops differ among countries, the highest being Egypt (95 m3 world-eq/m3) and the lowest in Argentina (0.94 m3 world-eq/m3), as shown in the supplementary information (Figure S1). Therefore, the water consumption impacts of a crop over different geographical regions vary according to the regional allocation of water resources.
Green water scarcity has been a topic of debate, identified as a future research need in the previous literature [25,82,83,84]. However, few studies have tried to use proxies for green water availability from an ecohydrological standpoint. This is because of the lack of valid data sets for estimating the green water availability over a region. The method devised by [11], for green water scarcity (based on productive and non-productive ET) was also not operational owing to the same reason. Ref. [85] has quantified scarcity based on the water consumption of crops for a three-year crop rotation. They considered only cropland in their analysis. The methodology by [49], which is adopted in the present study, utilizes land use, crop evapotranspiration, and effective rainfall. Therefore, this analysis considers not only the cropland, but also pervious and impervious areas in the county for estimating green water availability. This gives the fraction of green water available after the green water demand of the crop (peanut) has been encountered, i.e., the remaining green water available to other sectors, such as ecosystem services, timber, and pasture. The green water impacts are lower, as is expected from the green water consumption in Section 3.1. For the selected counties in Georgia, 60–80% of the green water was available after the crop demand had been met for all the years except 2007 (12–24%). This leads to the fact that the majority of the selected counties is under irrigation in recent decades for peanut crop production, meaning the green water resource allocation has already been utilized.

4.3. Freshwater Ecotoxicity Impacts

In the United States, active pesticide ingredients used are classified into herbicides, fungicides, insecticides, and other chemicals. The majority of the peanut crop planted acres are treated with herbicides (94%), with fungicides (87%) in second place, and insecticides constitute 46% [86]. In the present work, the potential freshwater ecotoxicity impacts of herbicides are less compared to fungicides and insecticides. The amount of pesticide application, the type of chemical (characterization factor of chemical), and transportation pathways to the environmental compartment [65] determine the potential impacts. The fate of a pesticide in soil is determined by sorption and the half-life of the pesticide. The sorption is dependent on the organic carbon partition coefficient (Koc), soil properties such as infiltration rate and hydraulic conductivity, and soil structure. According to the USDA report 2014, the total pesticide application has doubled since 1960. Exposure to pesticides has been related to human health and ecosystem impacts. Spatial heterogeneity of pesticide toxicity impacts is pointed out by various studies [56,68,87].
The potential impacts of fungicide are higher, as expected, due to the considerably higher amount of application than herbicides and insecticides. However, the insecticide application amount and the potential impacts reveal that even if the pesticide application is of less quantity, the effects will be higher. This is incommensurate with the higher characterization factor (the year 2017) for all the counties in Figure A2c. The same crop grown in varied geographic regions require distinct amounts of pesticide application depending on the regional climate and soil properties [34,88]. Therefore, it appears that soil hydrology is a determinant of ecotoxicity, in which the former has a significant bearing on the land cover and land use, indicating its relation to green water inventory flow. Table S3 represents the water solubility of pesticides (https://pubchem.ncbi.nlm.nih.gov/ accessed on 15 March 2022). Those pesticides with high water solubility have less Koc, organic carbon water partition coefficient and tend to leach or runoff rather than adsorbed to the soil. Thus, the fate transport in water increases and the ecotoxicity impacts will be higher. On the other hand, less water-soluble compounds have higher Koc values, which are prone to getting adsorbed into the soil, thereby reducing the transport from soil to water. This results in a reduction in characterization factors, which eventually lessens impacts. The fate of pesticides in water once it gets dissolved depends on the Kow, Octanol–water partition coefficient. The less water-soluble compounds may dissolve in Octanol, which tends to absorb in the fatty tissues of organisms. The residence time of chemicals in water is also a factor that influences the characterization of impacts [34,65]. Another process that determines the fate of chemicals in water is sedimentation. The partitioning between sediment and water (carbon-water partitioning) determines the buildup of organic chemicals in aquatic food chains. This accumulation of deposits at higher concentrations in organisms in the bottom zone of aquatic systems can have the potential to transfer the chemical to higher trophic levels through the food chain [50,66].

4.4. Limitations

Even though the ISO 14046 methodology applied in the study is a stand-alone method for WFP impact assessment, it has a few limitations in quantifying the impacts. Primarily, it gives only the “potential” impacts rather than the “actual” impacts. Furthermore, comparison with other studies is impossible because system boundaries and the temporal and spatial scale of analysis will differ. Moreover, the data sources/methods (for estimation of inventory) used for the inventory, the mid-point impact assessment methods, i.e., the characterization factor, will be site-specific and crop-specific. The limitation in providing the actual impacts arises from the quality of inventory data sets employed in impact evaluations. This study did not use any experimental/observational data sets for water consumption inventory. Instead, the potential water requirements for the three categories, green, blue, and grey, are quantified. Secondly, the assumption of zero natural concentration of nitrogen content in water bodies will not give the exact WFP value required to assimilate the pollutant. For better accuracy, the use of local high-resolution (field and farm) level data sets for estimating the water consumption is recommended. The green water scarcity assessment depends on crop evapotranspiration estimation that varies with different methodologies. In addition, the green water availability changes with the choice of effective rainfall methodologies. Thirdly, a major limitation lies in the quantification of freshwater ecotoxicity impacts.
The pesticide usage data sets are not available county-wise on a continuous basis for our study period. The choice of state-wise pesticide usage for a county-wise impact analysis will certainly have inaccuracies. Moreover, the USGS crop-specific usage is individually available only for the major crop categories. While peanut has only the aggregated data along with other crops. Even though the blue and green water flow impacts are estimated separately at the mid-point level, the end-point level impacts are quantified using a single characterization factor for ecosystem damage [25]. This might have slight variations in the magnitude of impacts. Finally, the exclusion of human toxicity impact assessment, which is a crucial end-point of environmental impacts, can be considered as a limitation of the present work.

5. Conclusions

The present work is the first county-wise study using ISO 14046 for peanut crop production in Georgia, considering freshwater ecotoxicity impacts as an impact category at the mid-point level. The crop water consumption based on the WFP assessment method suggests blue water WFP was higher than green water from 2007 to 2017. During the peanut crop’s growth and developmental stages, there is an inter-county difference in water consumption. Irwin, Worth, and Early counties exhibit maximum water consumption during the period. Incorporating crop-specific characterization factors for blue and green water impacts could serve as an improved proxy for local water scarcity assessments that helps in making water resource management decisions. Moreover, assessing green water impacts based on water availability can guide the farmers to adopt best management practices during limited resource availability. The potential freshwater ecotoxicity impacts at the planting and growing stages due to pesticide usage are higher for chemicals with high characterization factors regardless of lesser application. Sensitivity analysis recommends the effective utilization of water consumption, reduction in pesticide usage, and those with less characterization factors (potential impacts) to reduce the environmental impacts per ton of peanut. Moreover, this study suggests through multiple regression analysis that blue WFP, yield, precipitation, maximum surface temperature, and growing degree days can be the potential factors that influence freshwater ecotoxicity. The impact pathway connecting inventory flows, water scarcity/depletion impacts (blue, green), and water degradation (freshwater ecotoxicity) to the end-point damage and areas of protection, the ecosystem quality, are portrayed in Figure 7. Even though the basic relationship between the inventory flows, impact indicators and ecosystem quality is represented, there exists feedback between the indicators at the mid-point level. One can notice that the impact categories at the mid-point level is interrelated via positive or negative feedback (Figure 7) at different spatial and temporal scales. In our opinion, while considering decisions for the sustainable utilization of resources, this feedback must also be considered.
Water footprint assessment can help water resource managers and policymakers set nominal product pricing based on the planted area, yield, and total water consumed, allowing them to reduce water usage. Farmers can also profit from agriculture insurance coverage in the event of severe weather disasters. As a future work, it is suggested that the information regarding pesticide contamination frequency and the benchmark levels of pesticide concentration can help in creating a link between “potential” and “actual” impacts. This helps in identifying the counties as “impaired” or “not-impaired”. The competing demands for water by different ecosystem services affect water security, food security, and natural ecosystems resource availability.

Supplementary Materials

The following supporting information can be downloaded at: https://www.mdpi.com/article/10.3390/agronomy12040930/s1. Figure S1: Crop-specific (peanut) characterization factor from Boulay et al. 2019. Table S1: Crop coefficients for different stages of peanut. Table S2: Peanut yield for the major counties in Georgia (pound per acre). Table S3: Water solubility of pesticides. Table S4: Pesticides susceptible to leaching and runoff.

Author Contributions

Conceptualization, methodology, software, formal analysis, writing—original draft preparation, and visualization, R.D.; writing—review and editing, A.A., N.O.B., J.M.G.III, O.C.B., and J.J.M.; supervision, project administration, and funding acquisition, A.A. All authors have read and agreed to the published version of the manuscript.

Funding

This research was funded by the USDA-NIFA capacity building grant 2017-38821-26405, USDA-NIFA Evans-Allen Project, Grant 11979180/2016-01711, USDA-NIFA grant No. 2018-68002-27920 and National Science Foundation Grant no. 1735235 awarded as part of the National Science Foundation Research Traineeship.

Institutional Review Board Statement

Not applicable.

Informed Consent Statement

Not applicable.

Data Availability Statement

The data sets utilized in this study are from open data set repository maintained by the United States government (https://data.gov/) accessed on 15 March 2022.

Conflicts of Interest

The authors declare no conflict of interest.

Appendix A

Table A1. Mean and standard deviation of water footprint values (county wise) during 2007–2017.
CountyMean (m3/ton)Standard Deviation (m3/ton)
GreenBlueGreyGreenBlueGrey
Seminole37186532271118141
Irwin443110037479221167
Early395100427880224137
Miller35986724759133127
Mitchell38992724969165139
Decatur36985422368129102
Worth44911092657119399
Colquitt42198735983185222
Figure A1. Characterization factors of pesticides taken from TRACI 2.1.
Agronomy 12 00930 g0a1
Figure A2. (a) Herbicide application, (b) fungicide application, and (c) insecticide application from 2007 to 2017.
Agronomy 12 00930 g0a2

References

  1. World Economic Forum. Global Risks 2020: An Unsettled World. 2020. Available online: https://www3.weforum.org/docs/WEF_Global_Risk_Report_2020.pdf (accessed on 4 October 2021).
  2. Vörösmarty, C.J.; McIntyre, P.B.; Gessner, M.O.; Dudgeon, D.; Prusevich, A.; Green, P.; Glidden, S.; Bunn, S.E.; Sullivan, C.A.; Liermann, C.R.; et al. Global threats to human water security and river biodiversity. Nature 2010, 467, 555–561. [Google Scholar] [CrossRef] [PubMed]
  3. Veettil, A.V.; Mishra, A. Water Security Assessment for the Contiguous United States Using Water Footprint Concepts. Geophys. Res. Lett. 2020, 47, 7. [Google Scholar] [CrossRef]
  4. AghaKouchak, A.; Cheng, L.; Mazdiyasni, O.; Farahmand, A. Global warming and changes in risk of concurrent climate extremes: Insights from the 2014 California drought. Geophys. Res. Lett. 2014, 41, 8847–8852. [Google Scholar] [CrossRef] [Green Version]
  5. Stewart, I.T.; Rogers, J.; Graham, A. Water security under severe drought and climate change: Disparate impacts of the recent severe drought on environmental flows and water supplies in Central California. J. Hydrol. X 2020, 7, 100054. [Google Scholar] [CrossRef]
  6. Cook, E.R.; Woodhouse, C.A.; Eakin, C.M.; Meko, D.M.; Stahle, D.W. Long-Term Aridity Changes in the Western United States. Science 2004, 306, 1015–1018. [Google Scholar] [CrossRef] [PubMed] [Green Version]
  7. Vories, E.D.; Evett, S.R. Irrigation Research Needs in the USA Mid-South and Southeast, Humid and Sub-Humid Regions. In Proceedings of the 5th National Decennial Irrigation Conference, Phoenix Convention Center, Phoenix, AZ, USA, 5–8 December 2010. [Google Scholar]
  8. Singh, B.; Singh, U. Peanut as a source of protein for human foods. Plant Foods Hum. Nutr. 1991, 41, 165–177. [Google Scholar] [CrossRef] [Green Version]
  9. Mccarty, J.A.; Sandefur, H.N.; Matlock, M.; Thoma, G.; Kim, D. Life Cycle Assessment of Greenhouse Gas Emissions Associated with Production and Consumption of Peanut Butter in the U.S. Trans. ASABE 2014, 57, 1741–1750. [Google Scholar] [CrossRef]
  10. Hoekstra, A.Y. Value of Water; International Institute for Infrastructural Hydraulic and Environmental Engineering: Delft, The Netherlands, 2003; Proceedings 12. [Google Scholar]
  11. Hoekstra, A.Y.; Chapagain, A.K.; Aldaya, M.M.; Mekonnen, M.M. The Water Footprint Assessment Manual: Setting the Global Standard; Routledge: Abingdon, UK, 2011. [Google Scholar]
  12. Chapagain, A.K.; Hoekstra, A.Y. Water Footprints of Nations. Available online: https://research.utwente.nl/en/publications/water-footprints-of-nations (accessed on 15 March 2022).
  13. Chapagain, A.; Hoekstra, A.; Savenije, H.; Gautam, R. The water footprint of cotton consumption: An assessment of the impact of worldwide consumption of cotton products on the water resources in the cotton producing countries. Ecol. Econ. 2006, 60, 186–203. [Google Scholar] [CrossRef]
  14. Chapagain, A.; Hoekstra, A. The blue, green and grey water footprint of rice from production and consumption perspectives. Ecol. Econ. 2011, 70, 749–758. [Google Scholar] [CrossRef]
  15. Gerbens-Leenes, W.; Berger, M.; Allan, J. Water Footprint and Life Cycle Assessment: The Complementary Strengths of Analyzing Global Freshwater Appropriation and Resulting Local Impacts. Water 2021, 13, 803. [Google Scholar] [CrossRef]
  16. Berger, M.; Campos, J.; Carolli, M.; Dantas, I.; Forin, S.; Kosatica, E.; Kramer, A.; Mikosch, N.; Nouri, H.; Schlattmann, A.; et al. Advancing the Water Footprint into an Instrument to Support Achieving the SDGs—Recommendations from the “Water as a Global Resources” Research Initiative (GRoW). Water Resour. Manag. 2021, 35, 1291–1298. [Google Scholar] [CrossRef]
  17. Chapagain, A.; Hoekstra, A. The water footprint of coffee and tea consumption in the Netherlands. Ecol. Econ. 2007, 64, 109–118. [Google Scholar] [CrossRef]
  18. Chapagain, A.; Orr, S. An improved water footprint methodology linking global consumption to local water resources: A case of Spanish tomatoes. J. Environ. Manag. 2009, 90, 1219–1228. [Google Scholar] [CrossRef] [PubMed]
  19. Chiu, Y.; Walseth, B.; Suh, S. Water Embodied in Bioethanol in the United States. Environ. Sci. Technol. 2009, 43, 2688–2692. [Google Scholar] [CrossRef] [Green Version]
  20. Gerbens-Leenes, W.; Hoekstra, A.Y. The water footprint of sweeteners and bio-ethanol. Environ. Int. 2012, 40, 202–211. [Google Scholar] [CrossRef]
  21. Fader, M.; Gerten, D.; Thammer, M.; Heinke, J.; Lotze-Campen, H.; Lucht, W.; Cramer, W. Internal and external green-blue agricultural water footprints of nations, and related water and land savings through trade. Hydrol. Earth Syst. Sci. 2011, 15, 1641–1660. [Google Scholar] [CrossRef] [Green Version]
  22. Gerten, D.; Heinke, J.; Hoff, H.; Biemans, M.; Fader, M.; Waha, K. Global Water Availability and Requirements for Future Food Production. J. Hydrometeorol. 2011, 12, 885–899. Available online: https://journals.ametsoc.org/view/journals/hydr/12/5/2011jhm1328_1.xml?searchresult=1&tab_body=fulltext-display (accessed on 15 March 2022). [CrossRef]
  23. Jefferies, D.; Muñoz, I.; Hodges, J.; King, V.J.; Aldaya, M.M.; Ercin, A.E.; Milà i Canals, L.; Hoekstra, A.Y. Water Footprint and Life Cycle Assessment as approaches to assess potential impacts of products on water consumption. Key learning points from pilot studies on tea and margarine. J. Clean. Prod. 2012, 33, 155–166. [Google Scholar] [CrossRef] [Green Version]
  24. Ridoutt, B.G.; Huang, J. Environmental relevance--the key to understanding water footprints. Proc. Natl. Acad. Sci. USA 2012, 109, E1424. [Google Scholar] [CrossRef] [Green Version]
  25. Pfister, S.; Koehler, A.; Hellweg, S. Assessing the Environmental Impacts of Freshwater Consumption in LCA. Environ. Sci. Technol. 2009, 43, 4098–4104. [Google Scholar] [CrossRef] [Green Version]
  26. Herath, I.; Green, S.; Horne, D.; Singh, R.; Clothier, B. Quantifying and reducing the water footprint of rain-fed potato production, part I: Measuring the net use of blue and green water. J. Clean. Prod. 2014, 81, 111–119. [Google Scholar] [CrossRef]
  27. Boulay, A.-M.; Bare, J.; Benini, L.; Berger, M.; Lathuillière, M.J.; Manzardo, A.; Margni, M.; Motoshita, M.; Nunez, M.; Pastor, A.V.; et al. The WULCA consensus characterization model for water scarcity footprints: Assessing impacts of water consumption based on available water remaining (AWARE). Int. J. Life Cycle Assess. 2018, 23, 368–378. [Google Scholar] [CrossRef] [Green Version]
  28. Canals, L.M.I.; Chenoweth, J.; Chapagain, A.; Orr, S.; Antón, A.; Clift, R. Assessing freshwater use impacts in LCA: Part I—inventory modelling and characterisation factors for the main impact pathways. Int. J. Life Cycle Assess. 2008, 14, 28–42. [Google Scholar] [CrossRef] [Green Version]
  29. Zhang, Y.; Huang, K.; Yu, Y.; Yang, B. Mapping of water footprint research: A bibliometric analysis during 2006–2015. J. Clean. Prod. 2017, 149, 70–79. [Google Scholar] [CrossRef]
  30. ISO/TC 207/SC 5, “ISO 14046:2014.”. ISO: Geneva, Switzerland, 2014. Available online: https://www.iso.org/cms/render/live/en/sites/isoorg/contents/data/standard/04/32/43263.html (accessed on 15 March 2022).
  31. Greer, K.; Martins, C.; White, M.; Pittelkow, C. Assessment of high-input soybean management in the US Midwest: Balancing crop production with environmental performance. Agric. Ecosyst. Environ. 2020, 292, 106811. [Google Scholar] [CrossRef]
  32. Bhattacharyya, N.; Goodell, A.; Rogers, S.; Demond, A. Environmental impacts of wheat-based vodka production using life cycle assessment. J. Clean. Prod. 2019, 231, 642–648. [Google Scholar] [CrossRef]
  33. Yang, Y.; Suh, S. Land cover change from cotton to corn in the USA relieves freshwater ecotoxicity impact but may aggravate other regional environmental impacts. Int. J. Life Cycle Assess. 2014, 20, 196–203. [Google Scholar] [CrossRef]
  34. Nordborg, M.; Cederberg, C.; Berndes, G. Modeling Potential Freshwater Ecotoxicity Impacts Due to Pesticide Use in Biofuel Feedstock Production: The Cases of Maize, Rapeseed, Salix, Soybean, Sugar Cane, and Wheat. Environ. Sci. Technol. 2014, 48, 11379–11388. [Google Scholar] [CrossRef] [Green Version]
  35. Wallander, S.; Claassen, R.; Nickerson, C. The Ethanol Decade: An Expansion of U.S. Corn Production, 2000-09; Social Science Research Network: Rochester, NY, USA, 2011; SSRN Scholarly Paper ID 2131399. [Google Scholar] [CrossRef] [Green Version]
  36. Vanham, D.; Leip, A.; Galli, A.; Kastner, T.; Bruckner, M.; Uwizeye, A.; van Dijk, K.; Ercin, E.; Dalin, C.; Brandão, M.; et al. Environmental footprint family to address local to planetary sustainability and deliver on the SDGs. Sci. Total Environ. 2019, 693, 133642. [Google Scholar] [CrossRef]
  37. Beck, H.E.; Zimmermann, N.E.; McVicar, T.R.; Vergopolan, N.; Berg, A.; Wood, E.F. Present and future Köppen-Geiger climate classification maps at 1-km resolution. Sci. Data 2018, 5, 180214. [Google Scholar] [CrossRef] [Green Version]
  38. Kottek, M.; Grieser, J.; Beck, C.; Rudolf, B.; Rubel, F. World map of the Köppen-Geiger climate classification updated. Meteorol. Z. 2006, 15, 259–263. [Google Scholar] [CrossRef]
  39. State Average Data—SERCC. Available online: https://sercc.com/state-climate-data/ (accessed on 4 October 2021).
  40. Forin, S.; Mikosch, N.; Berger, M.; Finkbeiner, M. Organizational water footprint: A methodological guidance. Int. J. Life Cycle Assess. 2019, 25, 403–422. [Google Scholar] [CrossRef] [Green Version]
  41. Pacetti, T.; Lombardi, L.; Federici, G. Water–energy Nexus: A case of biogas production from energy crops evaluated by Water Footprint and Life Cycle Assessment (LCA) methods. J. Clean. Prod. 2015, 101, 278–291. [Google Scholar] [CrossRef]
  42. Qin, L.; Jin, Y.; Duan, P.; He, H. Field-based experimental water footprint study of sunflower growth in a semi-arid region of China. J. Sci. Food Agric. 2016, 96, 3266–3273. [Google Scholar] [CrossRef] [PubMed] [Green Version]
  43. Allen, R.G.; Food and Agriculture Organization of the United Nations (Eds.) Crop Evapotranspiration: Guidelines for Computing Crop Water Requirements; Food and Agriculture Organization of the United Nations: Rome, Italy, 1998. [Google Scholar]
  44. Shuttleworth, W.J. Evaporation. Handbook of Hydrology; Maidment, D., Ed.; McGraw-Hill: New York, NY, USA, 1992. [Google Scholar]
  45. Smith, M.; Allen, R.; Monteith, J.L.; Perrier, A.; Segeren, A. Expert Consultation on Revision of FAO Methodologies for Crop Water Requirements; Food and Agricultural Organization (FAO): Rome, Italy, 1992. [Google Scholar]
  46. Gheewala, S.H.; Silalertruksa, T.; Nilsalab, P.; Mungkung, R.; Perret, S.R.; Chaiyawannakarn, N. Water Footprint and Impact of Water Consumption for Food, Feed, Fuel Crops Production in Thailand. Water 2014, 6, 1698–1718. [Google Scholar] [CrossRef] [Green Version]
  47. Boulay, A.-M.; Lenoir, L. Sub-national regionalisation of the AWARE indicator for water scarcity footprint calculations. Ecol. Indic. 2020, 111, 106017. [Google Scholar] [CrossRef]
  48. Boulay, A.-M.; Lenoir, L.; Manzardo, A. Bridging the Data Gap in the Water Scarcity Footprint by Using Crop-Specific AWARE Factors. Water 2019, 11, 2634. [Google Scholar] [CrossRef] [Green Version]
  49. Xu, H.; Wu, M. A First Estimation of County-Based Green Water Availability and Its Implications for Agriculture and Bioenergy Production in the United States. Water 2018, 10, 148. [Google Scholar] [CrossRef] [Green Version]
  50. Darré, E.; Cadenazzi, M.; Mazzilli, S.R.; Rosas, J.F.; Picasso, V.D. Environmental impacts on water resources from summer crops in rainfed and irrigated systems. J. Environ. Manag. 2019, 232, 514–522. [Google Scholar] [CrossRef]
  51. Rosenbaum, R.K.; Margni, M.; Jolliet, O. A flexible matrix algebra framework for the multimedia multipathway modeling of emission to impacts. Environ. Int. 2007, 33, 624–634. [Google Scholar] [CrossRef]
  52. Bare, J.C. Development of impact assessment methodologies for environmental sustainability. Clean Technol. Environ. Policy 2014, 16, 681–690. [Google Scholar] [CrossRef]
  53. Nemani, R.R.; Keeling, C.D.; Hashimoto, H.; Jolly, W.M.; Piper, S.C.; Tucker, C.J.; Myneni, R.B.; Running, S.W. Climate-Driven Increases in Global Terrestrial Net Primary Production from 1982 to 1999. Science 2003, 300, 1560–1563. [Google Scholar] [CrossRef] [PubMed] [Green Version]
  54. Jolliet, O.; Margni, M.; Charles, R.; Humbert, S.; Payet, J.; Rebitzer, G.; Rosenbaum, R. IMPACT 2002+: A new life cycle impact assessment methodology. Int. J. Life Cycle Assess. 2003, 8, 324–330. [Google Scholar] [CrossRef] [Green Version]
  55. Berthoud, A.; Maupu, P.; Huet, C.; Poupart, A. Assessing freshwater ecotoxicity of agricultural products in life cycle assessment (LCA): A case study of wheat using French agricultural practices databases and USEtox model. Int. J. Life Cycle Assess. 2011, 16, 841–847. [Google Scholar] [CrossRef]
  56. Tao, M.; Adler, P.R.; Larsen, A.E.; Suh, S. Pesticide application rates and their toxicological impacts: Why do they vary so widely across the U.S.? Environ. Res. Lett. 2020, 15, 124049. [Google Scholar] [CrossRef]
  57. Deepa, R.; Anandhi, A.; Alhashim, R. Volumetric and Impact-Oriented Water Footprint of Agricultural Crops: A Review. Ecol. Indic. 2021, 130, 108093. [Google Scholar] [CrossRef]
  58. Peña, N.; Antón, A.; Kamilaris, A.; Fantke, P. Modeling ecotoxicity impacts in vineyard production: Addressing spatial differentiation for copper fungicides. Sci. Total Environ. 2018, 616-617, 796–804. [Google Scholar] [CrossRef] [Green Version]
  59. Peña, N.; Knudsen, M.T.; Fantke, P.; Antón, A.; Hermansen, J.E. Freshwater ecotoxicity assessment of pesticide use in crop production: Testing the influence of modeling choices. J. Clean. Prod. 2019, 209, 1332–1341. [Google Scholar] [CrossRef]
  60. Yang, Y. Life cycle freshwater ecotoxicity, human health cancer, and noncancer impacts of corn ethanol and gasoline in the U.S. J. Clean. Prod. 2013, 53, 149–157. [Google Scholar] [CrossRef]
  61. Paula, I.; Ovidiu, P.; Marin, S. Evaluation of Drought Tolerance Indices and Nitrogen Fertilization for Some Groundnut (Arachis Hypogaea L.) Genotypes. Agric. Sci. 2019, 1, 18. [Google Scholar] [CrossRef] [Green Version]
  62. Pimratch, S.; Jogloy, S.; Vorasoot, N.; Toomsan, B.; Kesmala, T.; Patanothai, A.; Holbrook, C.C. Effect of drought stress on traits related to N2 fixation in eleven peanut (Arachis hypogaea L.) genotypes differing in degrees of resistance to drought. Asian J. Plant Sci. 2008. Available online: http://hdl.handle.net/10113/27112 (accessed on 15 March 2022).
  63. Fraisse, C.W.; Moraes, V.P. Degree-Days: Growing, Heating, and Cooling; UF/IFAS, Department of Agricultural and Biological Engineering: Gainesville, FL, USA, 2007; UF/IFAS Extensio ABE381. [Google Scholar]
  64. Herner, A.E. The Usda-Ars Pesticide Properties Database: A Consensus Data Set for Modelers. Weed Technol. 1992, 6, 749–752. [Google Scholar] [CrossRef]
  65. Henderson, A.D.; Hauschild, M.Z.; Van De Meent, D.; Huijbregts, M.A.J.; Larsen, H.F.; Margni, M.; McKone, T.E.; Payet, J.; Rosenbaum, R.K.; Jolliet, O. USEtox fate and ecotoxicity factors for comparative assessment of toxic emissions in life cycle analysis: Sensitivity to key chemical properties. Int. J. Life Cycle Assess. 2011, 16, 701–709. [Google Scholar] [CrossRef]
  66. Rosenzweig, C.; Iglesius, A.; Yang, X.B.; Epstein, P.; Chivian, E. Climate Change and Extreme Weather Events—Implica-Tions for Food Production, Plant Diseases, and Pests. NASA Publ., January 2001. Available online: https://digitalcommons.unl.edu/nasapub/24 (accessed on 4 October 2021).
  67. USDA, NASS, Field Crops: Usual Planting and Harvesting Dates; USDA National Agricultural Statistics Service: Washington, DC, USA, 2010.
  68. Yang, Y.; Tao, M.; Suh, S. Geographic variability of agriculture requires sector-specific uncertainty characterization. Int. J. Life Cycle Assess. 2018, 23, 1581–1589. [Google Scholar] [CrossRef]
  69. Homer, C.G.; Dewitz, J.; Yang, L.; Jin, S.; Danielson, P.; Xian, G.Z.; Coulston, J.; Herold, N.; Wickham, J.; Megown, K. Completion of the 2011 National Land Cover Database for the Conterminous United States—Representing a Decade of Land Cover Change Information. Photogramm. Eng. 2015, 81, 345–354. [Google Scholar]
  70. Thelin, G.; Stone, W.W. Estimation of Annual Agricultural Pesticide Use for Counties of the Conterminous United States, 1992–2009; USGS: Sacramento, CA, USA, 2013.
  71. Baker, N.T.; Stone, W.W. Estimated Annual Agricultural Pesticide Use for Counties of the Conterminous United States, 2008–2012; U.S. Geological Survey: Reston, VA, USA, 2015; USGS Numbered Series 907. [CrossRef] [Green Version]
  72. Schyns, J.F.; Hoekstra, A.Y.; Booij, M.J.; Hogeboom, R.J.; Mekonnen, M.M. Limits to the world’s green water resources for food, feed, fiber, timber, and bioenergy. Proc. Natl. Acad. Sci. USA 2019, 116, 4893–4898. [Google Scholar] [CrossRef] [Green Version]
  73. Zhai, Y.; Zhang, T.; Bai, Y.; Ji, C.; Ma, X.; Shen, X.; Hong, J. Energy and water footprints of cereal production in China. Resour. Conserv. Recycl. 2021, 164, 105150. [Google Scholar] [CrossRef]
  74. Mekonnen, M.; Hoekstra, A. Water footprint benchmarks for crop production: A first global assessment. Ecol. Indic. 2014, 46, 214–223. [Google Scholar] [CrossRef] [Green Version]
  75. Williams, M.D.; Hawley, C.M.S.; Madden, M.; Shepherd, J.M. Mapping the Spatio-Temporal Evolution of Irrigation in the Coastal Plain of Georgia, USA. Photogramm. Eng. Remote Sens. 2017, 83, 57–67. [Google Scholar] [CrossRef] [Green Version]
  76. Shukla, S.P.; Puma, M.J.; Cook, B.I. The response of the South Asian Summer Monsoon circulation to intensified irrigation in global climate model simulations. Clim. Dyn. 2013, 42, 21–36. [Google Scholar] [CrossRef] [Green Version]
  77. Jani, A.D.; Mulvaney, M.J.; Erickson, J.E.; Leon, R.G.; Wood, C.W.; Rowland, D.L. Evaluation of Peanut Residue Nitrogen Contributions to Wheat in a Conservation Tillage Cropping System. In Proceedings of the ASA-CSSA-SSSA Annual Meeting, Tampa, FL, USA, 22–25 October 2017; p. 2. [Google Scholar]
  78. Jani, A.; Mulvaney, M.J. Nitrogen Contributions from Peanut Residues to Subsequent Crops; UF/IFAS: Gainesville, FL, USA, 2019; Volume 2, SS-AGR-432. [Google Scholar]
  79. Veettil, A.V.; Mishra, A.K. Water security assessment using blue and green water footprint concepts. J. Hydrol. 2016, 542, 589–602. [Google Scholar] [CrossRef]
  80. Water Security Assessment for the Contiguous United States Using Water Footprint Concepts-Veettil-2020-Geophysical Research Letters-Wiley Online Library. Available online: https://agupubs.onlinelibrary.wiley.com/doi/abs/10.1029/2020GL087061?casa_token=d3qau3m7R9wAAAAA:sFyAAf46gGXNc1hPmg7MBfyw5OLdi1xhqD6IlhM-93NkPE0G_dwnUeMkk5w_UNhQwObE0au-QekGAg (accessed on 4 October 2021).
  81. Falkenmark, M. The Massive Water Scarcity Now Threatening Africa: Why Isn’t It Being Addressed? Ambio 1989, 18, 112–118. [Google Scholar]
  82. Jeswani, H.K.; Azapagic, A. Water footprint: Methodologies and a case study for assessing the impacts of water use. J. Clean. Prod. 2011, 19, 1288–1299. [Google Scholar] [CrossRef]
  83. Kounina, A.; Margni, M.; Bayart, J.-B.; Boulay, A.-M.; Berger, M.; Bulle, C.; Frischknecht, R.; Koehler, A.; Canals, L.M.I.; Motoshita, M.; et al. Review of methods addressing freshwater use in life cycle inventory and impact assessment. Int. J. Life Cycle Assess. 2013, 18, 707–721. [Google Scholar] [CrossRef] [Green Version]
  84. Schyns, J.F.; Hoekstra, A.Y.; Booij, M.J. Review and classification of indicators of green water availability and scarcity. Hydrol. Earth Syst. Sci. 2015, 19, 4581–4608. [Google Scholar] [CrossRef] [Green Version]
  85. Núñez, M.; Pfister, S.; Antón, A.; Muñoz, P.; Hellweg, S.; Koehler, A.; Rieradevall, J. Assessing the Environmental Impact of Water Consumption by Energy Crops Grown in Spain. J. Ind. Ecol. 2012, 17, 90–102. [Google Scholar] [CrossRef]
  86. ChemUseHighlights_Peanuts_2018.pdf. Available online: https://www.nass.usda.gov/Surveys/Guide_to_NASS_Surveys/Chemical_Use/2018_Peanuts_Soybeans_Corn/ChemUseHighlights_Peanuts_2018.pdf (accessed on 4 October 2021).
  87. Larsen, A.E. Agricultural landscape simplification does not consistently drive insecticide use. Proc. Natl. Acad. Sci. USA 2013, 110, 15330–15335. [Google Scholar] [CrossRef] [Green Version]
  88. Li, S.; Huang, B.; Zhao, F.; Lu, Z.; Wang, X.; Chen, X.; Chen, Y. Environmental impact assessment of agricultural production in Chongming ecological island. Int. J. Life Cycle Assess. 2019, 24, 1937–1947. [Google Scholar] [CrossRef]
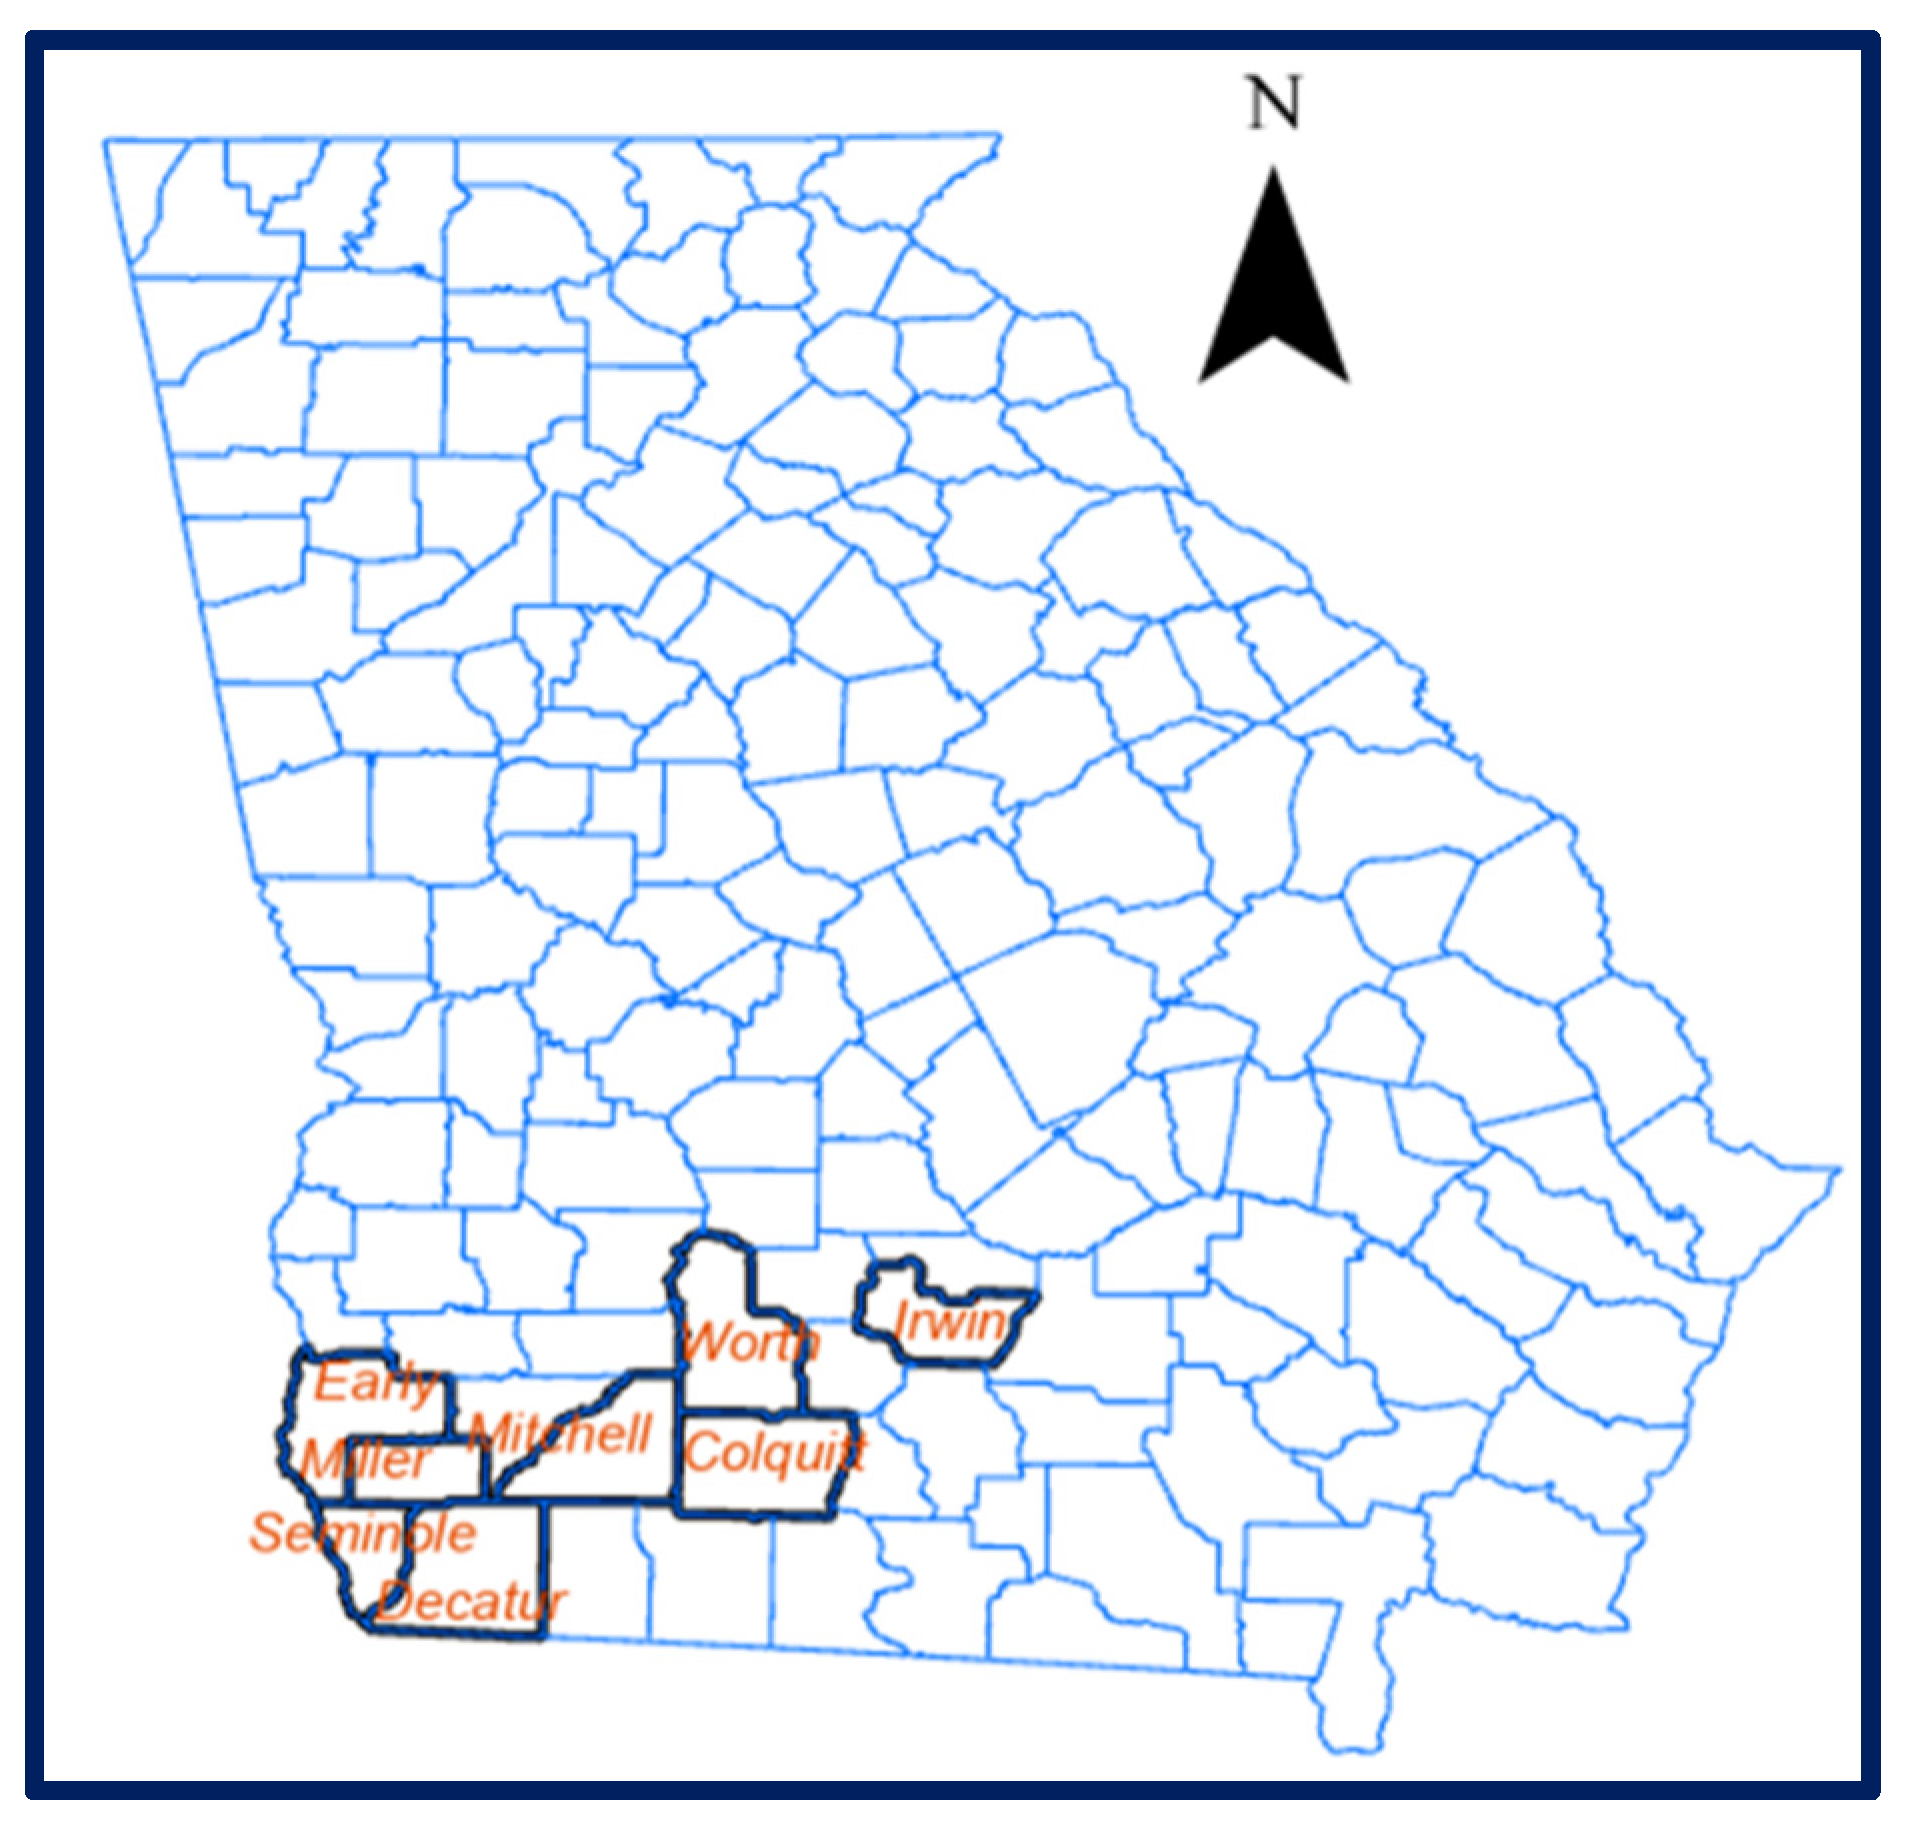
Figure 1. Selected counties in Georgia for the present study.
Agronomy 12 00930 g001
Figure 2. Framework used for the analysis: c, t, i, and ic are the county, time, inventory, and impact category, respectively; WFP is the water footprint in each category; WFPIm is the water footprint impacts due to each category; FEIm is the freshwater ecotoxicity impacts in each category; A is the amount of pesticide emitted to the environmental compartment based on pesticide application in each category; and CFi is the characterization factor for each inventory.
Agronomy 12 00930 g002
Figure 3. (a) Green, blue, and grey WFP for the counties in Georgia from 2007 to 2017 for each county and temporal variability of WFP (b) blue WFP, (c) green WFP, and (d) grey WFP.
Agronomy 12 00930 g003
Figure 4. (a) Green and blue WFP impacts for the counties in Georgia during 2007 to 2017 and temporal variability of (b) blue WFP impacts and (c) green WFP impacts. The dots inside (a) and (b) represent the outliers.
Agronomy 12 00930 g004
Figure 5. Potential freshwater ecotoxicity impacts (CTU) for peanut in Georgia from 2007 to 2017: (a) contribution from each category (fungicides, herbicides, and insecticides) and (b) (total freshwater ecotoxicity impacts) in CTU/ha.
Agronomy 12 00930 g005
Figure 6. County-wise (a) green water, (b) blue water (m2 year/ton), and (c) freshwater ecotoxicity (CTU/ton) end-point impacts (potential ecosystem damage) from 2007 to 2017.
Agronomy 12 00930 g006
Figure 7. Potential impact pathways connecting the inventory flows (water consumption and pesticide use) to the end-points and area of protection.
Agronomy 12 00930 g007
Table 1. Pesticide (major pesticides applied) chemical properties.
Pesticide
Category
Pesticide
(Chemical)
Half-Life (Soil)Half-Life (Water)Sorption
(Koc) mL/g
Water Partition Coefficient
(Kow)
Water Solubility
FungicidesChlorothalonil5–15 daysHours to 2 weeks3.62.94810 microg/L
Flutolanil284 days8–11 days2.7–3.22.8–4.78 mg/L
Fludioxonil164 days51–154 days2.1–2.74.11.8 mg/L
HerbicidesBentazone10–20 days<24 h1.5−0.467712 mg/L
Ethalfluralin13–14 days2 days3.55.10.01 mg/L
Pendimethalin42–1322 days2–60 days3.8–4.65.20.275 mg/L
InsecticidesChlorpyrifos7–120 days21–28 days4.4–5.84.71.4 mg/L
Phorate2–173 days2–60 days2–43.450 mg/L
Table 2. Regression of potential freshwater ecotoxicity impacts of peanut production in Georgia for the selected counties. The variables include bluewfp (Blue WFP), greenwfp (Green WFP), grdd (Growing Degree Days), moist (Soil Moisture), yld (Yield), precip (Precipitation), tmin1(Surface minimum temperature), tmax1 (Surface maximum temperature), and pdsi1 (Palmer Drought Severity Index). Significant codes “***” 0.001, “**” 0.01, “*” 0.05.
EstimateStd. ErrorValuePr (>|t|)
Intercept27.98225963.1937370.4430.659135
bluewfp−0.0457530.013561−3.3740.001157 **
greenwfp−0.0200490.014920−1.3440.182904
grdd−0.0313100.009843−3.1810.002108 **
moist0.0116270.0063011.8450.068797 *
yld−11.9437153.040539−3.9280.000184 ***
precip−0.05247200.014912−3.5190.000727 ***
tminl3.0221101.6681381.8120.073887 *
pdsil0.2341270.7272690.3320.748370
tmaxl3.3899850.8839503.8350.000253 ***
Residual standard error: 6.403 on 78 degrees of freedom. Multiple R-squared: 0.6005, Adjusted R-squared: 0.5544. F-statistic: 13.03 on 9 and 78 DF, p-value: 1.976 × 10⁻¹².
Publisher’s Note: MDPI stays neutral with regard to jurisdictional claims in published maps and institutional affiliations.